
Attending SUPERZOO 2026? – It is a great Opportunity! But….You Need a Plan!

SUPERZOO is still very strong. With almost 1200 exhibitors, over 20,000 expected attendees and 1000+ new products in the New Product Showcase, plus many more on the show floor, SUPERZOO 2026 is literally packed with opportunities. To help attendees in working this huge show there are targeted floor sections to better focus their time on the show floor. One thing is unchanged. There is a huge array of exhibitors in every product category.

Consider these 2026 SUPERZOO facts:

  • 1176 exhibitors as of 7/25, with 24 uncommitted booths to be filled
  • 6 “Targeted” Floor Sections: Natural & Health; Specialty & Lifestyle; Groomers; Live Animals; Emerging Brands; International
  • 301,500 sq ft of exhibitor booths; Plus, a 39,000 sq ft New Products Showcase
  • SuperZoo Education: 56 Seminars on Retail and Grooming …plus 45 show floor talks/demos – totaling 120 hours.
  • Over 5 miles of aisles – just to walk the exhibit floor.

Whew! This show is huge. The show floor is open for 22 hours so…Let’s “Do the Math!”

 If you don’t attend any seminars, visit the New Product Showcase, stop to chat with anyone in the aisles or for food, a drink or to go to the bathroom and maintain a walking speed of 2.5 mph…

You can spend… 61 SECONDS …with each exhibitorYou definitely need a plan!

With a higher concentration of Pet retailer attendees and a commitment to groomers, there are subtle differences between SUPERZOO and GPE.  However, like GPE, SUPERZOO has attendees from every major retail channel and attracts a multitude of exhibitors and attendees from around the globe.

Despite the variety of offerings to fill an attendee’s time, SUPERZOO is still primarily about Pet Products. New Products are critical to maintaining and growing any business so you must take the time to visit the new product area. Knowledge is power so you should also sign up for any relevant classes. Sometimes it’s not what you know, but who you know that matters most. This makes networking with other industry professionals a priority.

Every business can improve in terms of products. If you are a retailer, what sections of your store are not doing as well as you hoped and need a “facelift” or conversely, what areas are growing and need products to fill additional space? Category managers for distributors and retail chains may only be interested in targeted visits to exhibitors relevant to their “categories”. Representatives may be looking for new manufacturers…in specific product categories. Manufacturers could be looking for distributors to handle their products or just looking to “check out” the competition. In products, there is always something to see…for everyone! Plus, there are 338+ Exhibitors at SZ 26 that did no prior SZ or GPE.

SUPERZOO is a great place to review products but Business Services, everything from Private label to POS, have also become increasingly important. In fact, 2 of every 9 exhibitors offers some type of Business Service. Attendees can now “Leave no stone unturned” in their quest for business success. SUPERZOO is about gathering information and making decisions to improve your business – whether they are made on the spot or put on your “must do” list. Your only real limitation is time. How do you make the most effective use of your time on the show floor? Here’s a suggestion.

Use the Super Search Exhibitor Visit Planner to make SUPERZOO easier and more productive. I initially designed it in 2014 and have updated the data and produced a new version for every SUPERZOO since then…including SZ 2026.

The “update” is not just exhibitor lists but also to the product category offerings for every exhibitor. I reviewed every exhibitor profile on the show site, but I also visited over 1200 websites and conducted separate internet searches to “validate” their product offerings. It is not 100% accurate, but it is close.

What does the Super Search do?…It searches for and produces a list of Exhibitors by product categories.

  • From the simplest – “give me a list that I can look at on my phone or tablet in either Booth # order or alphabetically”
  • To the most complex…”can do a simultaneous search for multiple specific product categories, allowing you to personally narrow down the initial results and see the “final” alphabetically or by booth number. The SUPERZOO Super Search Exhibitor Visit Planner does both…and more…and does it quickly!

Take a look at the Updated Quick Start Guide. You will see that it looks complex but is really quite simple

SUPERZOO 2026 Super Search Exhibitor Visit Planner – Quick Start Guide

First: When you download the Excel file, Remember to Enable Editing & Macros

The SZ 2026 Super Search Exhibitor visit planner is designed to make your time on the show floor more efficient and more productive. With the Super Search you can conduct up to 5 separate and distinct product category searches simultaneously with consolidated results produced in booth # order to facilitate your “journey”. There are detailed instructions for reference and to help you understand the nuances of the tool. However, it is really very simple so let’s get started.

Here is the Dashboard where you set up your searches. !

On the dashboard, the first things to note are the numerous category columns. There are 6 separate floor sections, 12 different Exhibitor or Animal Types and 33 Dog and/or Cat Product categories. You can search exhibitors for any combination of these.

Let’s take a specific example running 3 simultaneous searches for several Dog/Cat categories

  • Toys
  • Treats
  • Catnip & Litter (Must sell both)

Now referring to the Dashboard, let’s take it by the numbers:

  • This column is where you activate each search. Type in a “Y” (Cells C3>C7 will auto-capitalize) This search “line” becomes active.(cell turns green) In our example we are running 3 searches, so we have 3 “Y’s”
  • Now we enter a 1 in the correct column for each search line. Search Line 1: Toys; Search Line 2: Treats.
  • In Search Line 3 we want exhibitors that sell both Catnip and Litter, so we put a 1 in both of these columns.
  • Now we just “click” the Execute Search Button. The searches are done simultaneously, and the results combined into a single list in alphabetical order.
  • If you would like to view the list in Booth # order, just click the Booth # Sort.
  • You can switch the list back to an alpha view by clicking the Alpha Sort Button.
  • To Clear all your search categories and start a new search, click the Clear Criteria Button. Then click Execute (#4) again and you will be back to the full list

Note: Any Search Line with a Y and no 1’s in any column will always deliver the entire list regardless of what is selected in other lines. Change the Y back to an N in unused search lines. Now a sample of the results:

Company A – Has Toys Only; Company B has Dog Treats Only and is also a “Startup”; Company C is on the list for Treats and also has Catnip, but no Litter. This is not unusual as Catnip is often a Treat; Company D has Treats & Toys. Company E has both Catnip and Litter and in fact, actually has it all!

Note: The Super Search highlights your search categories, so you know “why you are there”. However, it also shows all categories that are available. Some might “pique” your interest while you are visiting the booth.

You can review the exhibitors alphabetically then put the list in Booth # order to make it easier to “work”. The Super Search also allows you to “cut down” the list during your review. (Pg 2; Point #11 – “U Pick ‘em” in Detailed Instructions) But First, I suggest that you “play” with the Super Search to get a “feel” for the tool, and then review the Detailed Instructions. With your “play” experience, the detailed instructions will become a “quick read” and a valuable reference. You’ll soon be “up to speed” on the full capabilities of Super Search.

Good Luck and Good “Hunting” at SZ 2026.

Use the links below to download The 7/28 Super Search (Be Sure to Enable editing/macros/content), the Quick Start Guide and the Detailed Instructions. Then GET STARTED!  

(To save the PDF to your computer Right Click the download link and select “Save Link As…”)

(To save the PDF to your computer Right Click the download link and select “Save Link As…”)

(For the Excel file to work on your computer, be sure to enable macros/editing/content if asked.)

Note: The SZ 26 Super Search will be regularly updated with exhibitor changes. Look for the date in the file name to ensure that you are using the latest version.

Petflation 2026 – June Update: The CPI Slowed, But Petflation Stabilized

It’s time to continue with 2026 Inflation. The Consumer Price Index peaked back in June 2022 at 9.1% then began to slow until it turned up in Jul/Aug 2023. Prices fell in Oct>Dec 23, then turned up Jan>Oct 24 but fell in Nov. However, they rose 10 straight months to a record high in Sep 25, fell Oct>Dec, rose Jan>May (Record), fell June. The CPI vs last year fell to 3.5% from 4.2%. Grocery prices increased 0.2% from May but their YOY inflation was stable at 2.7%. BTW, Gas prices are still up 36.1% from Feb. Even minor price changes can affect consumer pet spending, especially in the discretionary pet segments, so we will continue to publish monthly reports to track petflation as it evolves in the market.

Petflation was +4.1% in Dec 21 while the overall CPI was +7.0%. The gap narrowed as Petflation accelerated. It was 96.7% of the national rate in June 22. National inflation has slowed considerably, but Petflation generally increased until June 23. It passed the CPI in July 22, fell below Apr>Jul 24. It passed the CPI in Aug, fell below Sep>Oct, rose above in Nov, fell below Dec>Aug 25, passed it Sep>Oct & Dec>Mar 26, equal in Apr, below in May/June. All reports include:

  • A rolling 24 month tracking of the CPI for all pet segments and the national CPI. The base number will be pre-pandemic December 2019 in this and future reports, which will facilitate comparisons.
  • Monthly comparisons of 26 vs 25 which will include Pet Segments and relevant Human spending categories. Plus
    1. CPI change from the previous month.
    2. Inflation changes for recent years (25>26, 24>25, 23>24, 22>23, 21>22, 20>21, 19>20, 18>19)
    3. Total Inflation for the current month in 2026 vs 2019 and vs 2021 to see the full inflation surge.
    4. Average annual Year Over Year inflation rate from 2019 to 2026
  • YTD comparisons
    1. YTD numbers for the monthly comparisons #2>4 above

In our first graph we will track the monthly change in prices for the 24 months from June 24 to June 26. We will use December 2019 as a base number so we can track the progress from pre-pandemic times through an eventual recovery. This chart is designed to give you a visual image of the flow of pricing. You can see the similarities and differences in segment patterns and compare them to the overall U.S. CPI. The year-end numbers & those from 12 and 24 months earlier are included. We also included and highlighted (pink) the cumulative price peak for each segment. In June, Total Pet prices were +0.2% from May. Food, Services & Vet were +0.2%. Supplies were -0.01%.

In Jun 24, the CPI was +22.3% and Pet was +24.2%. The Services segments inflated after mid-20, while Product inflation stayed low until late 21. In 22, Food prices grew but others had mixed patterns until July 22, when all rose. In Aug>Oct Petflation took off. In Nov>Dec, Services & Food inflated while Vet & Supplies prices stabilized. In Jan>Apr 23, prices grew every month for all except for 1 Supplies dip. In May Products prices grew while Services slowed. In Jun/Jul this reversed. In Aug all but Services fell. In Sep/Oct this flipped. In Nov, all but Food & Vet fell. In Dec, Supp. & Vet drove a lift. In Jan>Mar 24 Pet prices grew. In April, prices in all but Vet fell. In May, all but Food grew. In June, Products drove a lift. In July, all but Services fell. In Aug, Food drove a drop. In Sep, Products fueled a drop. In Nov all were up. Prices dropped in Mar & Oct>Nov 25, rose Dec>Mar 26, fell Apr/May, rose Jun. All segments set records in Mar and/or May 26.

  • U.S. CPI – Inflation was below 2% through 2020. It turned up in January 21 and grew until flattening out in Jul>Dec 22. Prices rose Jan>Sep 23, fell Oct>Dec, rose Jan>Oct 24, fell Nov, rose Dec>Sep 25, fell Nov>Dec, hit record highs Jan>May 26, slowed in June. 22.7% of the lift since Dec 19 happened Jan>Jun 22 – 7.7% of the time.
  • Pet Food Prices were at the Dec 19 level Apr 20>Sep /21. They grew & peaked May 23, then got on a roller coaster Jun/Jul 25, Aug, Sep↔, Oct/Nov , Dec>Mar, Apr>May, Jun. 90+% of the lift was in 22/23.
  • Pet Supplies – Supplies prices were high in Dec 19 due to tariffs. They had a deflated roller coaster ride until mid-21 when they returned to Dec 19 prices & stayed there until 22. They turned up in Jan (record). They plateaued Feb>May, grew in June, flattened in July, then turned up in Aug>Oct to a new record. Prices stabilized Nov>Dec, grew Jan>Feb 23. fell in Mar, but the roller coaster hasn’t stopped. Jan>Feb 25, Mar>May, Jun, Jul, Aug, Sep, Oct>Nov, Dec, Jan 26, Feb>Mar(record), Apr>Jun. Prices are only 1.7% below Mar.
  • Pet Services– Inflation is usually 2+%. Perhaps due to closures, prices increased at a lower rate in 2020. In 2021 consumer demand increased but with fewer outlets. Inflation grew in 21 with the biggest lift in Jan>Apr. Inflation was strong in 22 but prices got on a roller coaster. They turned up Jul>Apr 23, fell May. Jun>Aug, Sep>Dec, Jan>Mar 24, Apr, May, Jun, Jul>Nov, Dec>Mar 25, Apr>Aug, Sep, Oct>Jun 26(record).
  • Veterinary – Inflation has been consistent. Prices turned up in Mar 20 and grew through 21. A surge began in Dec 21 which put them above the overall CPI. In May/Jun 22 prices fell below the CPI. However, they rose again & have been above the CPI since July 22. In 23>25 prices grew Jan>May, leveled Jun/Jul, fell Aug, grew Sep>Dec, fell Jan, grew Feb>May, fell Jun>Jul, grew Aug 24>Sep 25, fell Oct>Nov, grew Dec>Apr 26, fell May, grew Jun (record).
  • Total Pet – Petflation is a sum of the segments. In Dec 21 the price surge began. In Mar>Jun 22 the segments had ups & downs. Petflation grew Jul>Nov, slowed Dec, grew Jan>May 23, fell Jun>Aug, grew Sep/Oct, fell Nov, then grew Dec>Mar 24 to a record. Prices fell in April, rose May>Jun, fell Jul>Sep, rose Oct>Nov, fell Dec, rose Jan>Feb 25, fell Mar, grew Apr>Jul, fell Aug, rose Sep, fell Oct>Nov, rose Dec>Mar 26 (record), fell in Apr>May, rose Jun.

Next, we’ll turn our attention to the YOY inflation rate change for June and compare it to last month, last year and to previous years. We will also show total inflation from 21>26 & 19>26. Petflation rose from 2.5% to 3.5% in Sep, fell to 2.6% in Nov, rose to 3.5% in Dec & 4.3% in Mar. In Apr it fell to 3.8% & 3.2% in May/Jun, below the US CPI. The chart will allow you to compare the inflation rates of 25>26 to 24>25 and other years but also see how much of the total inflation since 2019 came from the current surge. We’ve included some human categories to put the pet data into perspective.  

Overall, prices were -0.3% from May and were +3.5% vs Jun 25, down from 4.2% last month. Grocery prices rose 0.2% but inflation was stable at 2.7%. There were 3 price drops from last month, down from 4 in May. In Feb, there were no drops. In Dec & Jan there was 1. In Nov there were 6 drops. The national YOY monthly CPI rate of 3.5% is up 30% from 24>25 but it’s 62% less than 21>22. The 25>26 rate is above 24>25 for all but Medical Serv. & Vet. In our 2021>2025 measurement you also can see that over 75% of the cumulative inflation since 2019 has occurred in all but 2 segments – Haircuts and Medical Services. Service Segments have generally had higher inflation rates so there was a smaller pricing lift in the recent strong increase. Pet Products have a very different pattern. The 21>26 inflation surge provided 103.5% of their overall inflation since 2019. This happened because Pet Products prices in 2021 were still recovering from a deflationary period. Services expenditures account for 63.4% of the National CPI so they are very influential. Their current CPI is 3.2%, down from 3.5%. The CPI for Commodities fell from 5.5% to 4.1%. Services are the usual inflation driver, but both drove the current decrease. The situation in Pet is closer to its “normal” than the national CPI. Petflation: 3.2%. The CPI for the Service Segments is 5.1%. The Pet Products CPI is 1.5%.

  • U.S. CPI– Prices are -0.3% from May. The YOY rate is 3.5%, down from 4.2% in May. It peaked at +9.1% back in June 2022. The targeted inflation rate is <2% so we are now 75+% higher than the target. The Jun drop follows Mar>May lifts, Feb stability, a lift in Jan, stability in Dec and 2 drops in Oct & Nov. The current rate is 30% above 24>25 and the 21>26 rate is +22.9%, 75.3% of the total inflation since 2019. The Inflation surge was growing in Jun 2021, +5.4%
  • Pet Food– Prices are +0.2% vs May, but +1.3% vs Jun 25, down from 1.8%. They are now 52% below the Food at Home inflation rate of +2.7%. Remember that the YOY Pet Food CPI has deflated in 16 of the last 28 months. The 2021>2026 inflation surge has generated 98.8% of the 24.8% inflation since 2019. Inflation began for Pet Food in June 2021, +0.9%, after 12 straight deflationary months. Pet Food prices are still within 0.4% of the Mar record high.
  • Food at Home – Prices are +0.2% from May, but the YOY CPI stayed 2.7%. This is radically lower than Jul>Sep 2022 when it exceeded 13%. The 33.2% Inflation for this category since 2019 is 9.2% more than the national CPI but is only in 4th place behind 3 Services expenditures. 75.0% of the inflation since 2019 occurred from 2021>26. This is slightly less than the CPI, but we should note that Grocery prices began inflating in 2020>21 then the rate accelerated. It appears that the pandemic supply chain issues in Food which contributed to higher prices started early and foreshadowed problems in other categories and the overall CPI tsunami.
  • Pets & Supplies– Prices were -0.01% from May but YOY inflation rose to 9% from 0.1%. They still have the lowest rate vs 2019. Prices were deflated for much of 20>21. As a result, the 2021>26 surge accounted for 122.2% of the total inflation since 2019. Prices set a record in Oct 22 then deflated. 3 lifts pushed them to a record high in Feb 23. Prices fell in Mar & the roller coaster continued into 25. They fell Jan/Feb 25, rose Mar>May, fell Jun, rose Jul, fell Aug, rose Sep, fell Oct>Nov, rose Dec (record), fell in Jan, rose Feb>Mar – a new record, then fell in Apr>Jun.
  • Veterinary Services– Prices are +0.2% from May and +5.1% from 2025, up from 4.9%. They are #2 in inflation vs last year, behind Pet Serv, but still #1 in the increase since 2019, +54.6% and 21, +42.2%. For Veterinary, high annual inflation is the norm. However, the rate has increased during the current surge, especially since 23. They have the highest June avg rate in 26, but only 77.3% of the cumulative inflation since 2019 occurred from 2021>26.
  • Medical Services – Prices turned sharply up at the start of the pandemic but then inflation slowed and fell to a low rate in 20>21. Prices fell -0.1% from May, and inflation vs last year decreased to +2.9% from +3.6%. Medical Services are not a big part of the current surge as only 63.8% of the 22.4%, 2019>26 increase happened from 21>26.
  • Pet Services – Inflation slowed in 20 but grew in 21. In 24 prices surged in Jul>Nov, then fell to 3.9% in Dec>Mar 25. Apr grew, May fell, June rose, Jul rose to 6.3%, fell to 5.8% in Aug & 4.2% in Nov. In Dec>Mar 26 it rose to 7.8%, fell to 6.6% in Apr, rose to 7.0%, fell to 6.3%. They are #1 vs 25 and #2 vs 21 & 19. 78.2% of their inflation is from 21>26.
  • Haircuts/Other Personal Services – Prices are +1.3% from May and +4.4% from June 25. 21 of the last 30 months have been 4.0+%. Inflation has been pretty consistent. 70.5% of the 19>26 inflation happened 21>26.

Total Pet– Petflation stayed at 3.2%. Supplies & Vet had a rate increase. Total Pet is 52.3% above the 24>25 rate but 8.6% below the current U.S. CPI. Plus, it is equal to the 3.2% avg June rate since 1997. June prices rose 0.2%, driven by all but Supplies. The May>Jun 0.2% increase was equal to the 97>25 average change but unexpected. Since 1997, there have been 8 May>Jun price drops. The other years had an avg lift of 0.3% A key factor in the current CPI stability was that prices also rose 0.2% in May>Jun 25. The recovery is definitely slow. Now, we’ll look at YTD data.The 25>26 rate is higher than 24>25 for all, but Veterinary. The 22>23 inflation rate was the highest for Tot Pet, Pet Food, Veterinary & Pet Services. 21>22 has the highest rate for Groceries, Pet Supplies, Haircuts & the Natl CPI; 19>20: Medical Services. The average national inflation rate in the 7 years since 2019 is 3.8%. Only 3 of the categories are below that rate – Medical Services (3.0%), Pet Supplies (1.8%) and Pet Food (3.3%). It is no surprise that Veterinary Services has the highest average rate (6.5%), but all 4 other categories are +4.1% or higher.

  • U.S. CPI – The 25>26 rate is 3.3%, up 27% from 24>25 and 3% from 23>24. However, it is 60% less than 21>22 and 13% below the average increase from 2019>2026. However, it’s still 57% more than the average increase from 2018>21. 81% of the 30.0% inflation since 2019 occurred from 2021>26. Inflation is a problem that started recently.
  • Pet Food – Ytd prices are still inflating, 1.7%, down from 1.8% in May. That’s a big increase from -0.5% in 24>25. It is above 1.3% in 23>24 but equal to the 18>20 average. Pet Food has the highest 22>23 rate but is only #6 in the 21>26 rates and #7 in 19>26. Deflation in the 1st half of 2021 kept YTD prices low then they surged in 22 and especially in 23. 95% of the inflation since 2019 occurred from 2021>26.
  • Food at Home – The 25>26 inflation rate is 19.0% above 24>25, but it is down 68% from 22>23 and 75% from 21>22. It’s even 12% less than 20>21. However, it is 22% higher than the average rate from 2018>20. It is only in 5th place for the highest inflation since 2019 but still beat the U.S. CPI by 7.3%. You can see the impact of supply chain issues on the Grocery category as 80% of the inflation since 2019 occurred from 2021>26.
  • Pets & Pet Supplies – A roller coaster, prices rose Jan>Feb 24, fell Mar>Apr, rose May>Jun, fell July, rose Aug, fell Sep>Oct, rose Nov>Dec, fell Jan>Feb 25, then rose Mar>May. Prices vs 24 deflated in June, back to +0.7% in July, fell to 0.0% in Aug, rose Sep>Dec, fell Jan 26, rose Feb>Mar, fell Apr>Jun. Supplies still have the lowest inflation since 2019. Their biggest YOY lifts since 2019 were in 22 & 23. The 2021 deflation created an unusual situation. Prices are up 13.5% from 2019 but 113.3% of this lift happened from 21>25. Prices are up 15.3% from their 2021 “bottom”.
  • Veterinary Services – Inflation was high in 2019 and steadily grew until it took off in late 2022. The rate may have peaked in 2023, but it is still going strong in 2026, +5.6%, the 2nd  highest on the chart. However, they are still #1 in inflation since 2019 and since 2021. At +6.5%, they have the highest average inflation rate since 2019. It is 71% higher than the National Average but 2.2 times higher than the Inflation average for Medical Services. Strong Inflation is the norm in Veterinary Services.
  • Medical Services – Prices went up significantly at the beginning of the pandemic, but inflation slowed in 2021. In June 2026 it is 3.6%, 20% above the 3.0% 2019>26 average rate. We should also note that 3.6% is 4 times higher than the 0.9% low point in 22>23.
  • Pet Services – After falling in late 2023, prices surged in 2024, then fell in 2025 until an Apr>Aug lift followed by a Sep>Nov dip and a Dec>Jun 26 lift. The 25>26 6.8% CPI is #1 on the chart, passing Veterinary. It is 31% above their 19>26 avg and 2.5 times their 2018>20 avg. Pet Services is also 2nd in both 19>26 and 21>26 inflation.
  • Haircuts & Personal Services – The services segments, essential & non-essential, were hit hardest by the pandemic. The industry responded by raising prices. 2026 inflation is 4.3%, 20.4% below its 20/21 peak, but 36.5% above the 18>20 average. Consumers are paying over 35% more than in 2019, which usually reduces the purchase frequency.
  • Total Pet – Petflation is 3.5%, up 75% from 24>25, but 66% less than their 22>23 peak. However, It’s 59% more than their 18>21 avg and 6.1% above the CPI. Pet prices are still high. Except for Mar/Aug/Oct/Nov, Pet prices rose in 25, which continued in Jan>Mar 26, paused in Apr>May, then rose in June. The overall gain is primarily being driven by a flip from deflation to inflation in Pet Products and continued strong inflation in Services, especially Non-Vet.

The Petflation recovery paused in Aug 24, came back Sep>Oct, paused in Nov, resumed in Dec>Jan 25, paused in Feb, restarted in Mar and paused Apr>Sep. It improved Oct/Nov, paused in Dec>Mar, improved Apr/May, paused June. We tend to focus on the monthly, YOY inflation in the current year and ignore the fact that inflation is cumulative. Pet prices are 28.2% above 2021 and 32.5% higher than 2019. Those are big lifts. In fact, Mar prices for the National CPI, Total Pet and all pet segments reached new record highs. In June, prices either set a new record or are within 1.7% of Mar. Only Supplies prices (+12.6%) are less than 24.8% higher than 2019. Since price/value is the biggest driver in consumer spending, inflation will affect the Pet Industry. Services will be the least impacted as it is the most driven by high income CUs. Veterinary will continue to see a reduction in visit frequency. Pet Parents will just pay more. The product segments will see a more complex reaction. Supplies are more discretionary so we will likely see a reduction in purchase frequency. In Pet Food, the most needed segment, some Pet Parents may choose to downgrade their Pet Food. However, the biggest impact in both product segments will be a strong movement to online purchasing and private label. We saw proof of this at both GPE 25 & SZ 25 as a huge # of exhibitors offer OEM services. At GPE 26 & SZ 26, this trend continued. Strong, cumulative inflation has a widespread impact. We’ll continue to monitor the situation.

SUPERZOO 2026 – Super Charge Your Business!

SUPERZOO 2026 is only 4 weeks away. You will see in this advance look that the Pet Industry is even stronger than ever as SUPERZOO 26 reflects the ever-increasing record level of Pet Products & Services sales.

The pandemic fueled the strong growth of Pet Products sales on the internet, which has continued because of value and convenience. However, most of these $ are coming from proven products. Buyers of all kinds, from consumers to chain store executives, prefer to make in person buying decisions on new pet items. That’s what makes in person trade shows so important. You will clearly see this at SUPERZOO 2026 with a strong influx of new exhibitors.

Currently SUPERZOO 2026 has 1147 exhibitors. That is 5.1% less than 2025, but still a lot. Plus, it will go higher. There are currently 66 uncommitted booths. 59 are 100 sq ft or less, ideal for International and Emerging Brands. These groups are often slow to commit. However, there is no doubt that SUPERZOO 26 will have about 1200 exhibitors. Because the WPA was able to add more booth space in 25, they are able to handle the ongoing influx of new exhibitors. This added space has also allowed some exhibitors to fulfill their desire to have bigger booths. SUPERZOO 26 will be truly “SUPER”!

So how big is the SUPERZOO 26 “house”? There are 299,000 sq ft of booths, a 39,000 sq ft New Products Showcase, with over 1000 items, and 10,000 sq ft devoted to 45 Show Floor Education and demonstration sessions. There are also 56 educational sessions on grooming or business subjects in separate rooms off of the show floor. Combined, these sessions offer over 120 hours of valuable education. This is a great opportunity for the expected 10,000+ buyers but also a challenge. They need to make a plan to take full advantage of the amazing strength of SUPERZOO 26. Total attendance including Buyers, Exhibitors, Media/Guests is expected to be 20,000+. The show will be crowded.

New is always a focus at Pet Trade shows. That also applies to exhibitors. At SUPERZOO 2026:

  • 464 Exhibitors weren’t at SZ25 ●    403 are SuperZoo 1st Timers

Plus, 312 haven’t done any other major pet show (GPE), at least from 2019>2026. Those are some strong arguments for attending SUPERZOO 2026. It is definitely a “must do” for all Pet Industry participants. Now, let’s look at some specifics of what you will see there. To have a more valid comparison, the 2025 data is from 4 weeks before last year’s show. While a change in the booth count is important, I suggest that you also note the changes in the share of booths. Changes in this measurement will indicate how a particular group or product category is performing relative to other groups. This will help identify key trends in the industry – both positive and negative. This can be very important in corporate decision making.

First, we’ll look at the overall show floor in terms of specialized sections.

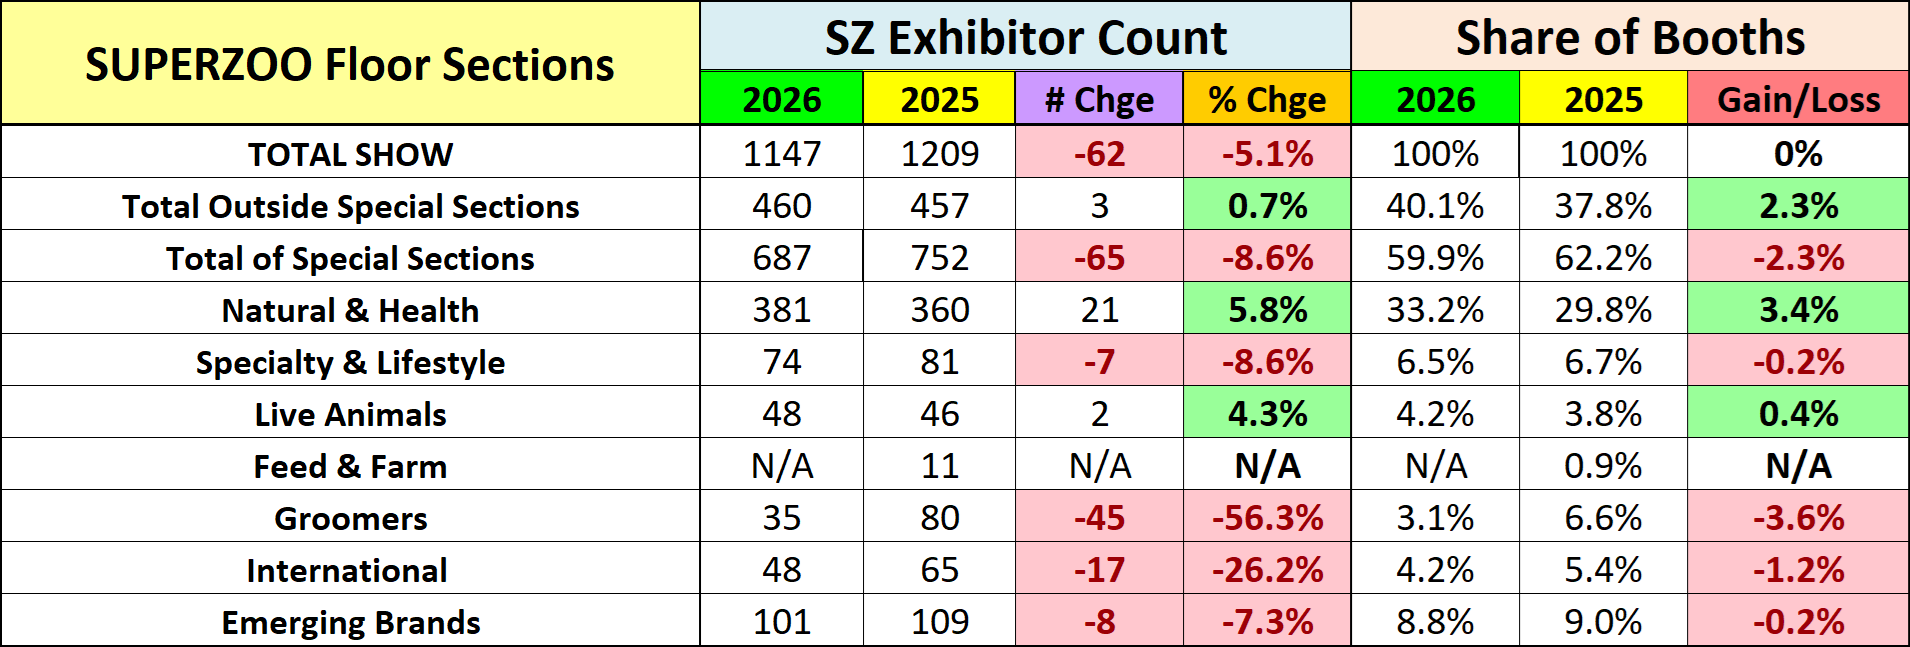
  • Because they help guide attendees’ time on the huge show floor, special sections are very important. They exceeded 50% of SUPERZOO booths for the 1st time in 2021. They are down 8.6% from 25 but still 60% of all booths.
  • Natural & Health are the unquestioned biggest trends in Pet Products. WPA combined them in 2022. They almost always go together so it makes sense to put them in one section. Natural has been the biggest section for years. They are up 5.8% in count and now account for 33.2% of all exhibitors.
  • The appeal of Specialty & Lifestyle (Fashion) continues to slow but the share only fell -0.2% – relatively stable.
  • Live Animals had a 4.3% lift in booths. This is an important section as non-dog/cat pets started the industry.
  • Feed & Farm was discontinued. Poultry products (the driver) have now become part of the mainstream.
  • Grooming has been a major focus of SUPERZOO. This section lost 56% and dropped from 4th largest to the smallest.
  • The International Pavilion also shrank as most of 230+ foreign exhibitors do not want to be separated by location.
  • The strength of Emerging Brands shows the importance of new although many new companies choose a special section/open floor to have a bigger booth. In fact, 1st Time SZ exhibitors occupy 35% of booths at the show.

Now let’s look at the Exhibitors by type, including animal.

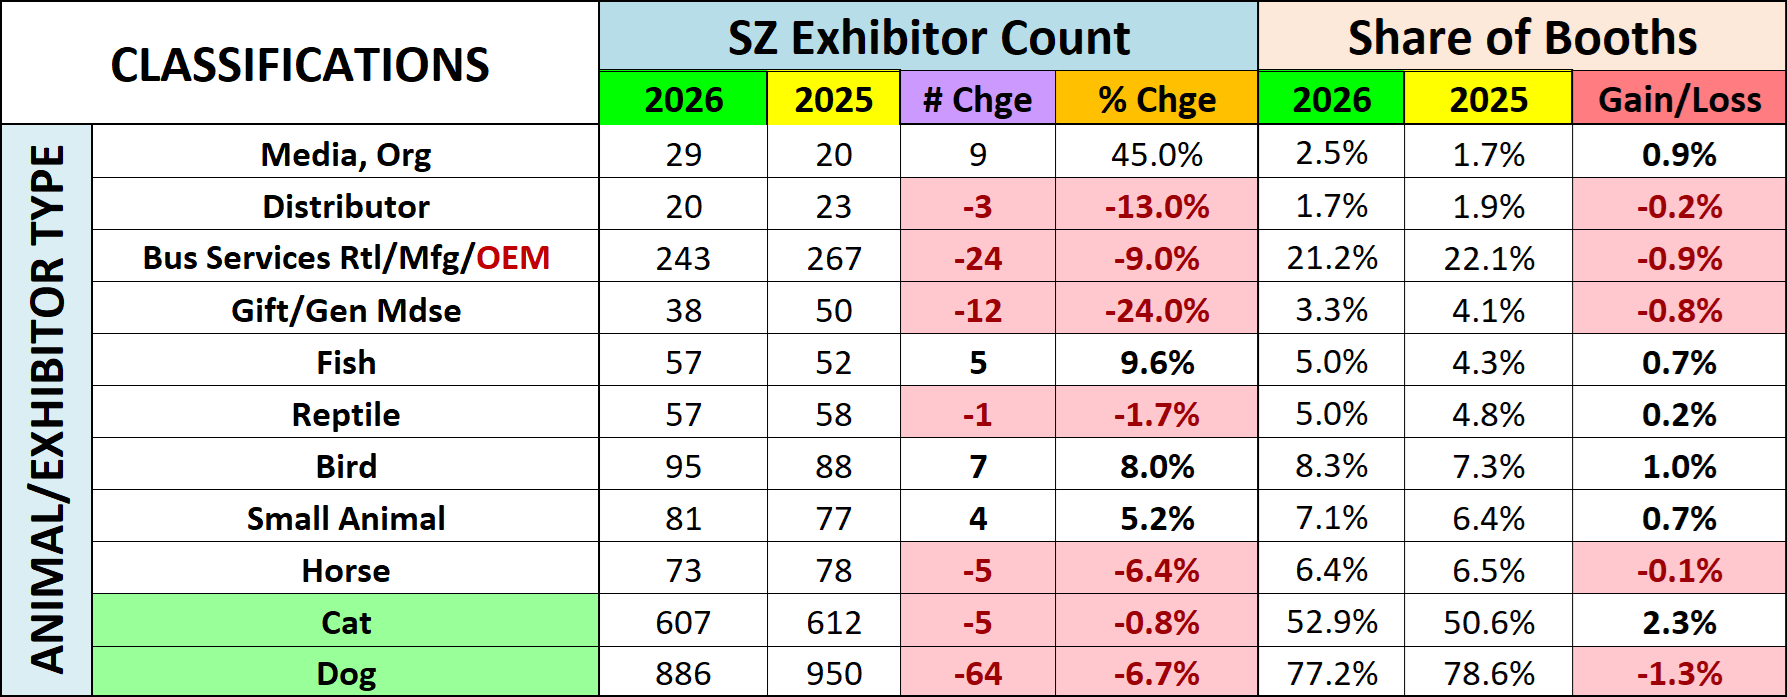
  • Only 1 business classification has more exhibitors, Media/Organizations. Major organizations are increasingly drawn to the Pet Industry.
  • In terms of Animals, Dogs are still the “Pet Kings”. They lost 1.3% in share but are still found in 4 of every 5 booths. All smaller animals, especially Cats (+2.3%), gained in share. 3 even increased in exhibitor count.
  • Business Services is again the exhibitor type leader. This segment includes companies that offer services to improve existing businesses and those that help in private label production – ingredients, packaging or finished products. In 2015 there were 65 SUPERZOO exhibitors in this category. In 2025 there were 267. In 2026, there was a 9% drop to 243, but still 15% more than 2024. OEM services is the biggest driver. The recent inflation surge and cumulative high prices have made Private Label products very appealing to consumers. Retailers also usually make more profit.

Let’s take a closer look at the “Pet Royalty”. Here are the top 10 Dog and/or Cat Categories at SUPERZOO 2026.

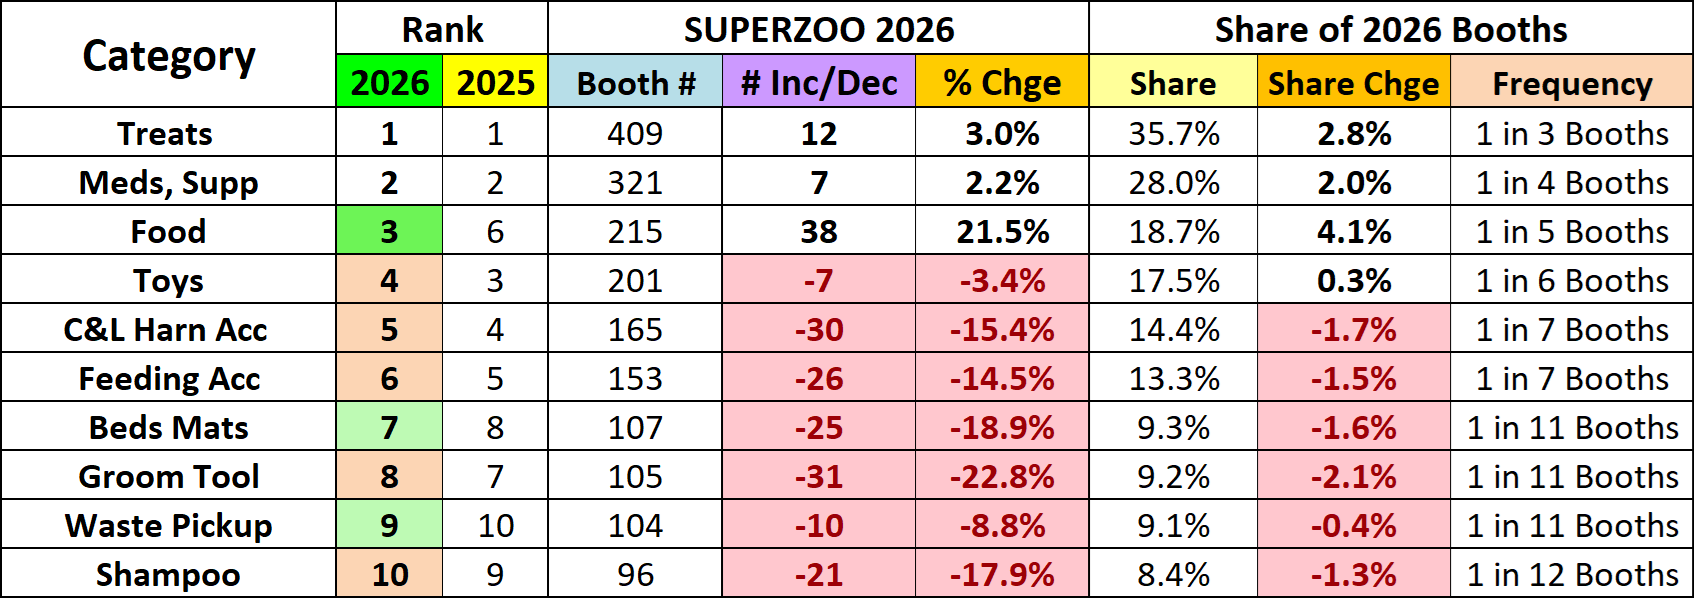
  • This chart shows the performance by the top Cat & Dog products. Only the top 3 grew in booths but 4 gained in share. The avg drop in count was -14.4% but the avg drop in share was only -1.4%.
  • As usual, there was no change in the group from last year. However, there were a lot of rank changes. The top 2 were the same. In the other 8, 3 moved up and 5 down. All changes but Food were only one spot from 2024.
  • Treats & Meds/Supp secured their place in the top 2 spots and have 106 or more booths than #3.
  • Food is the biggest $ producer and had a huge lift in both # & share. It also moved up to 3rd from 6th in rank.
  • Toys had -3.4% fewer booths but gained 0.3% in share. They fell from #3 to #4 in rank.
  • Collars/Leads loss -15.4% in booths and -1.7% in share (the 2nd biggest drop) and fell from 4th to 5th in rank.
  • Feeding Accessories had a -14.5% loss in booths and a -1.5% loss in share and fell from 5th to 6th in ranking.
  • Beds & Mats had 25 fewer booths and lost -1.6% in share, but they rose from #8 to #7 in rank.
  • Grooming Tools had 31 less booths and lost -2.1% in share (biggest drops). They only fell to #8 from #7.
  • Waste Pickup was -8.8% in booths but only lost -0.4% in share. They moved up in rank, from #10 to #9.
  • Shampoos had -17.9% fewer booths and a -1.3% share loss. They fell from #9 to #10.

SUPERZOO will have fewer Exhibitors than the 1229 2025 record, but the house will still feel full. In 2026 the average SUPERZOO booth is 273 sq ft, basically 10’x30’. This is only +0.7% from 2025 but it is +36% from 200 sq ft in 2016. New exhibitors trend towards smaller booths. This allowed the WPA to find room for the ongoing surge in “new”. New and existing Products and Services are available to fill virtually every need or want of the attendees. Plus, the growing strength of targeted special floor sections, which helps attendees fulfill their primary needs along with a massive amount of educational sessions are 2 prime examples of the WPA’s ongoing efforts to continually improve the show.

932 exhibitors (81.3%) focus on Dog and/or Cat. Let’s take a closer look.

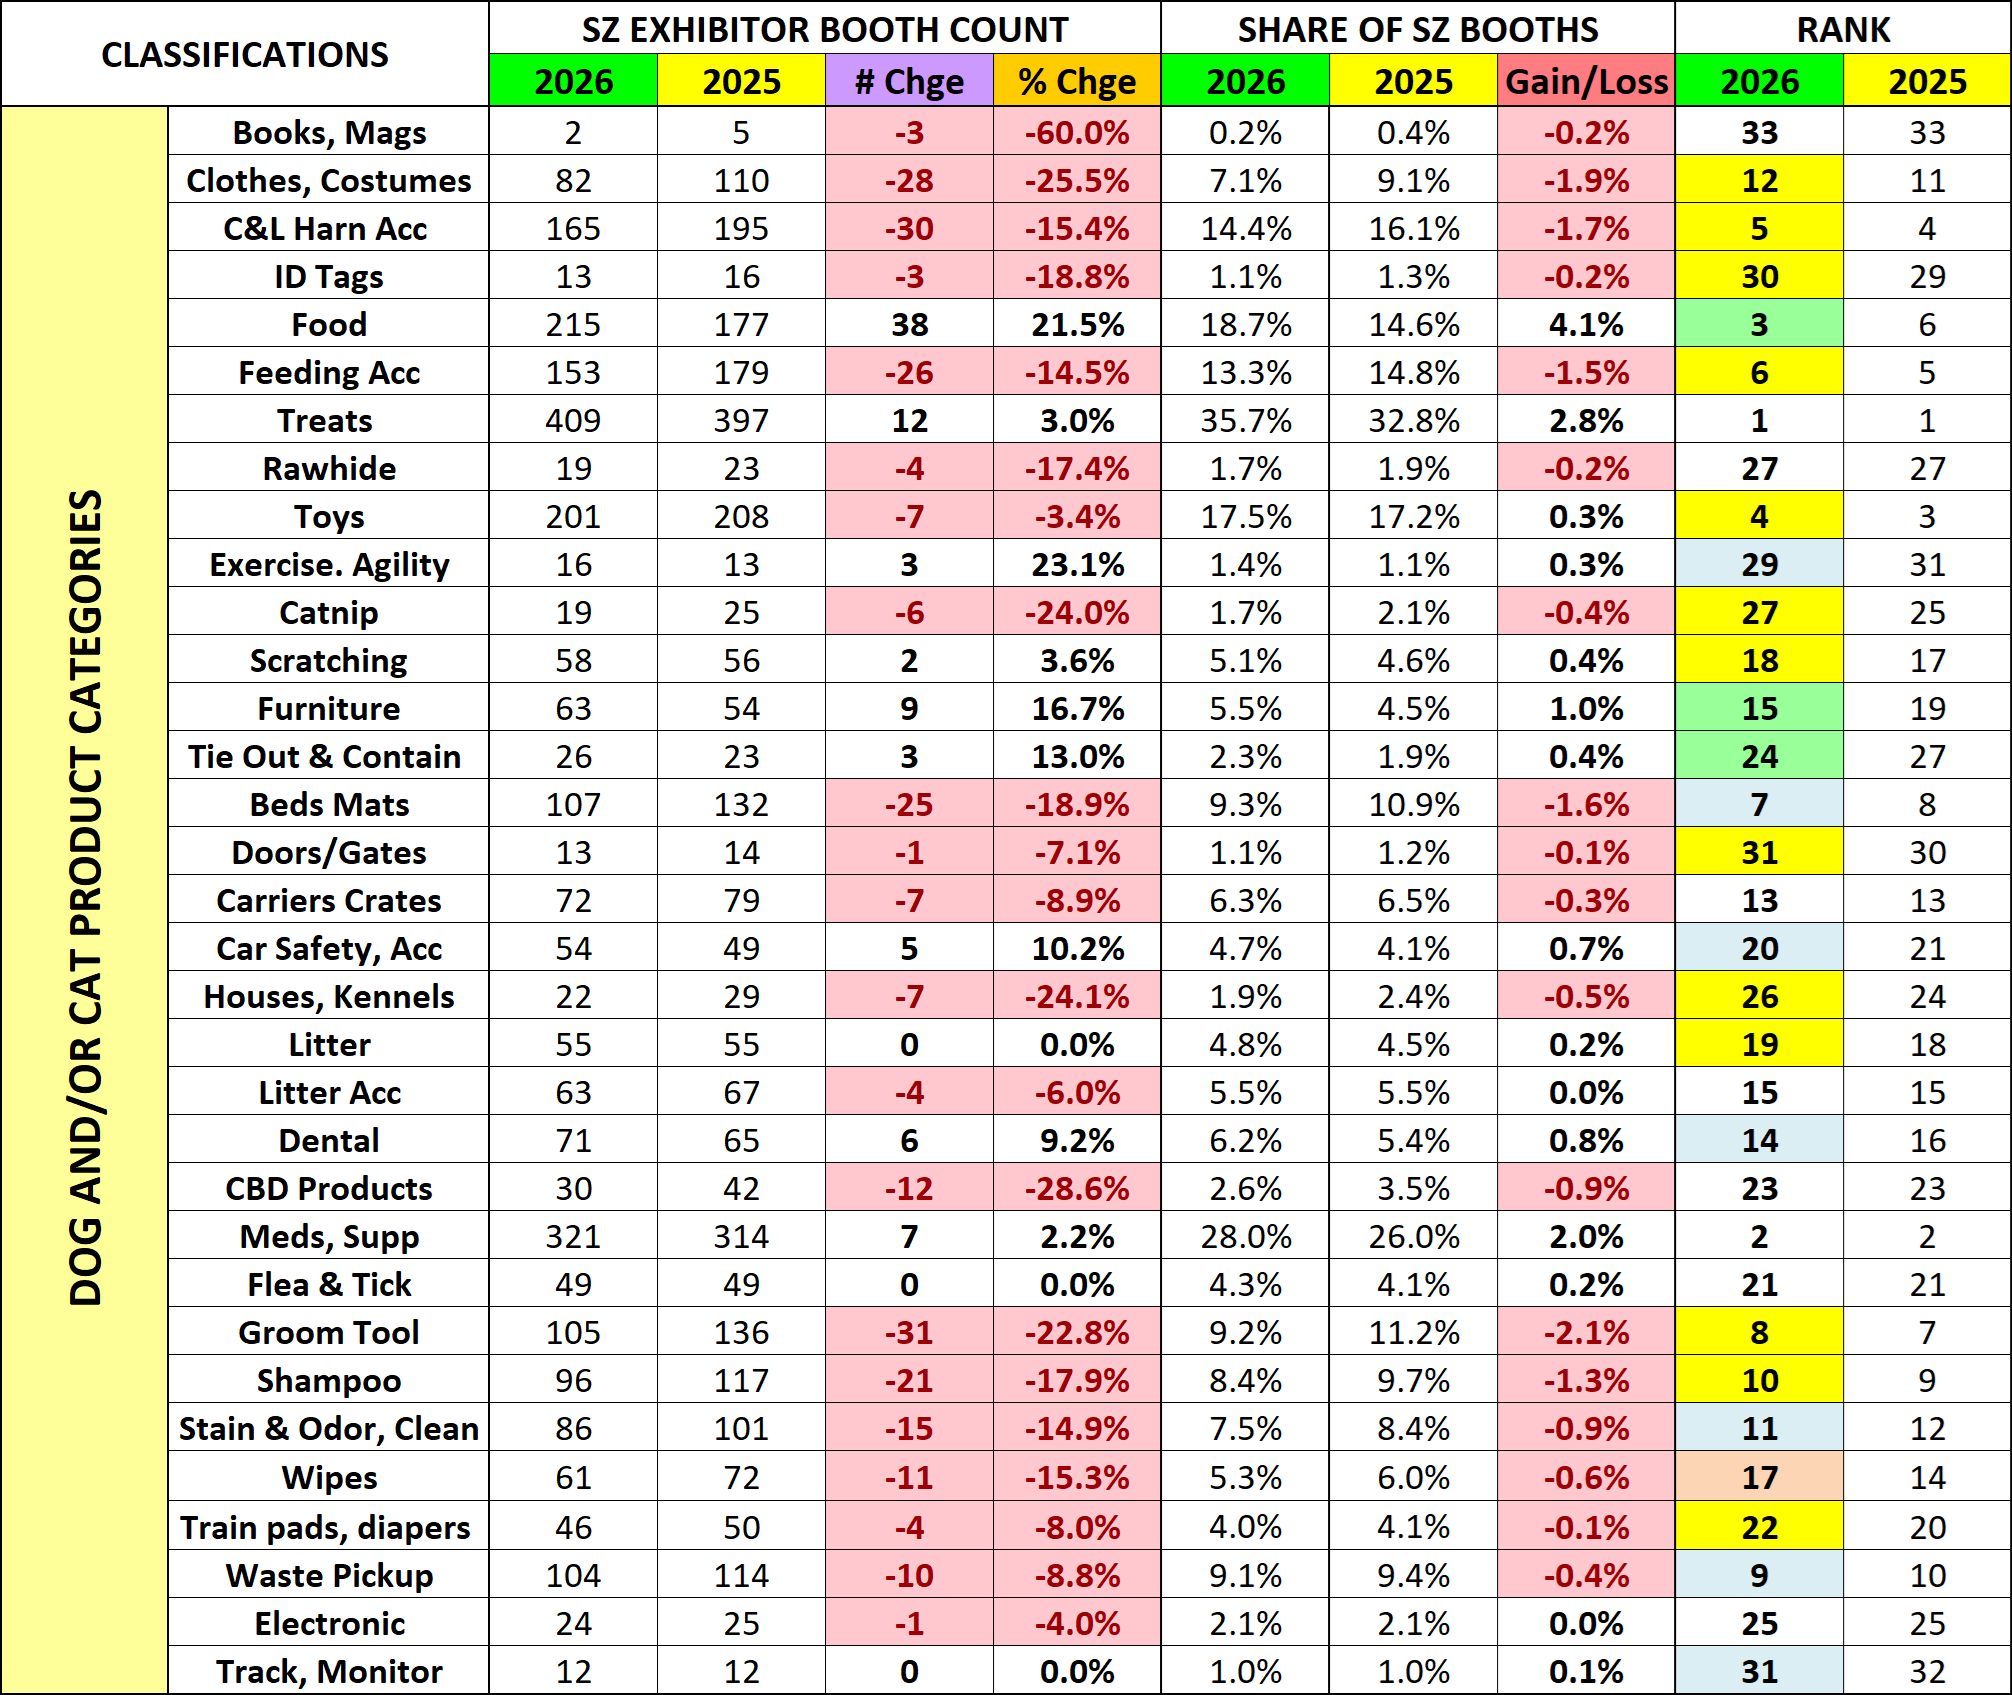
There will be fewer Exhibitors at SUPERZOO 2026 than at 2025. Those offering Dog and/or Cat products fell by 65 (-6.5%) and the Dog/Cat share of exhibitors decreased slightly from 82.5% to 81.3%. However, Dogs and Cats remain the unquestioned “royalty” of the industry. Here are some of the changes from SUPERZOO 2025

  • 9 of 33 categories increased their number of exhibitors; 21 had decreases; 3 had no change
  • 13 categories increased their share of total exhibitors (only 4 in 25); 18 lost share (26 in 25); 2 No Change
  • Ranking changes: 10 up; 14 down; 9 no change (2025: 11 up; 10 down; 12 no change)

In terms of booth gains & losses, the Top 10 had 3 of the 9 increases. The biggest increase was 38 by the Food category (#3). The Top 10 also had 7 of the 21 category decreases and Grooming Tools had the biggest drop, -31.

When you look at share gains & losses, the Top 10 had 4 of the 13 gains. The biggest gain was the huge 4.1% by Food. The Top 10 also had 6 of the 18 losses, including the largest, -2.1% by Grooming Tools. 5 other categories had drops over -1%. Only Grooming Tools had a share loss over -2%. There were 4 in 2025.

The Top 10 had 3 of the 10 increases in rank & 5 of the 14 drops, but the biggest changes were outside the group.

All Dog & Cat product needs are much more than covered, with a lot of choices in each. We should definitely celebrate the big 2.3% share gain by Cat. 3 of 13 category lifts were Cat “driven”. Litter, Furniture & Scratching all gained in share.

SUPERZOO again showcases what is “happening” in the Pet Industry and offers a great opportunity for Industry participants, both exhibitors and attendees, to drive the growth of their businesses. It still takes effort and commitment from everyone, but SUPERZOO 2026 is the surest bet in Las Vegas!

Finally, the chart below details the specifics for all 33 of the Dog/Cat product categories that I defined for the Super Search Exhibitor Visit Planner.  (Note: The SZ 2026 Super Search will be available at PetBusinessprofessor.com on 7/27.

Petflation: Pet Food – Comparing the CPI to the PPI

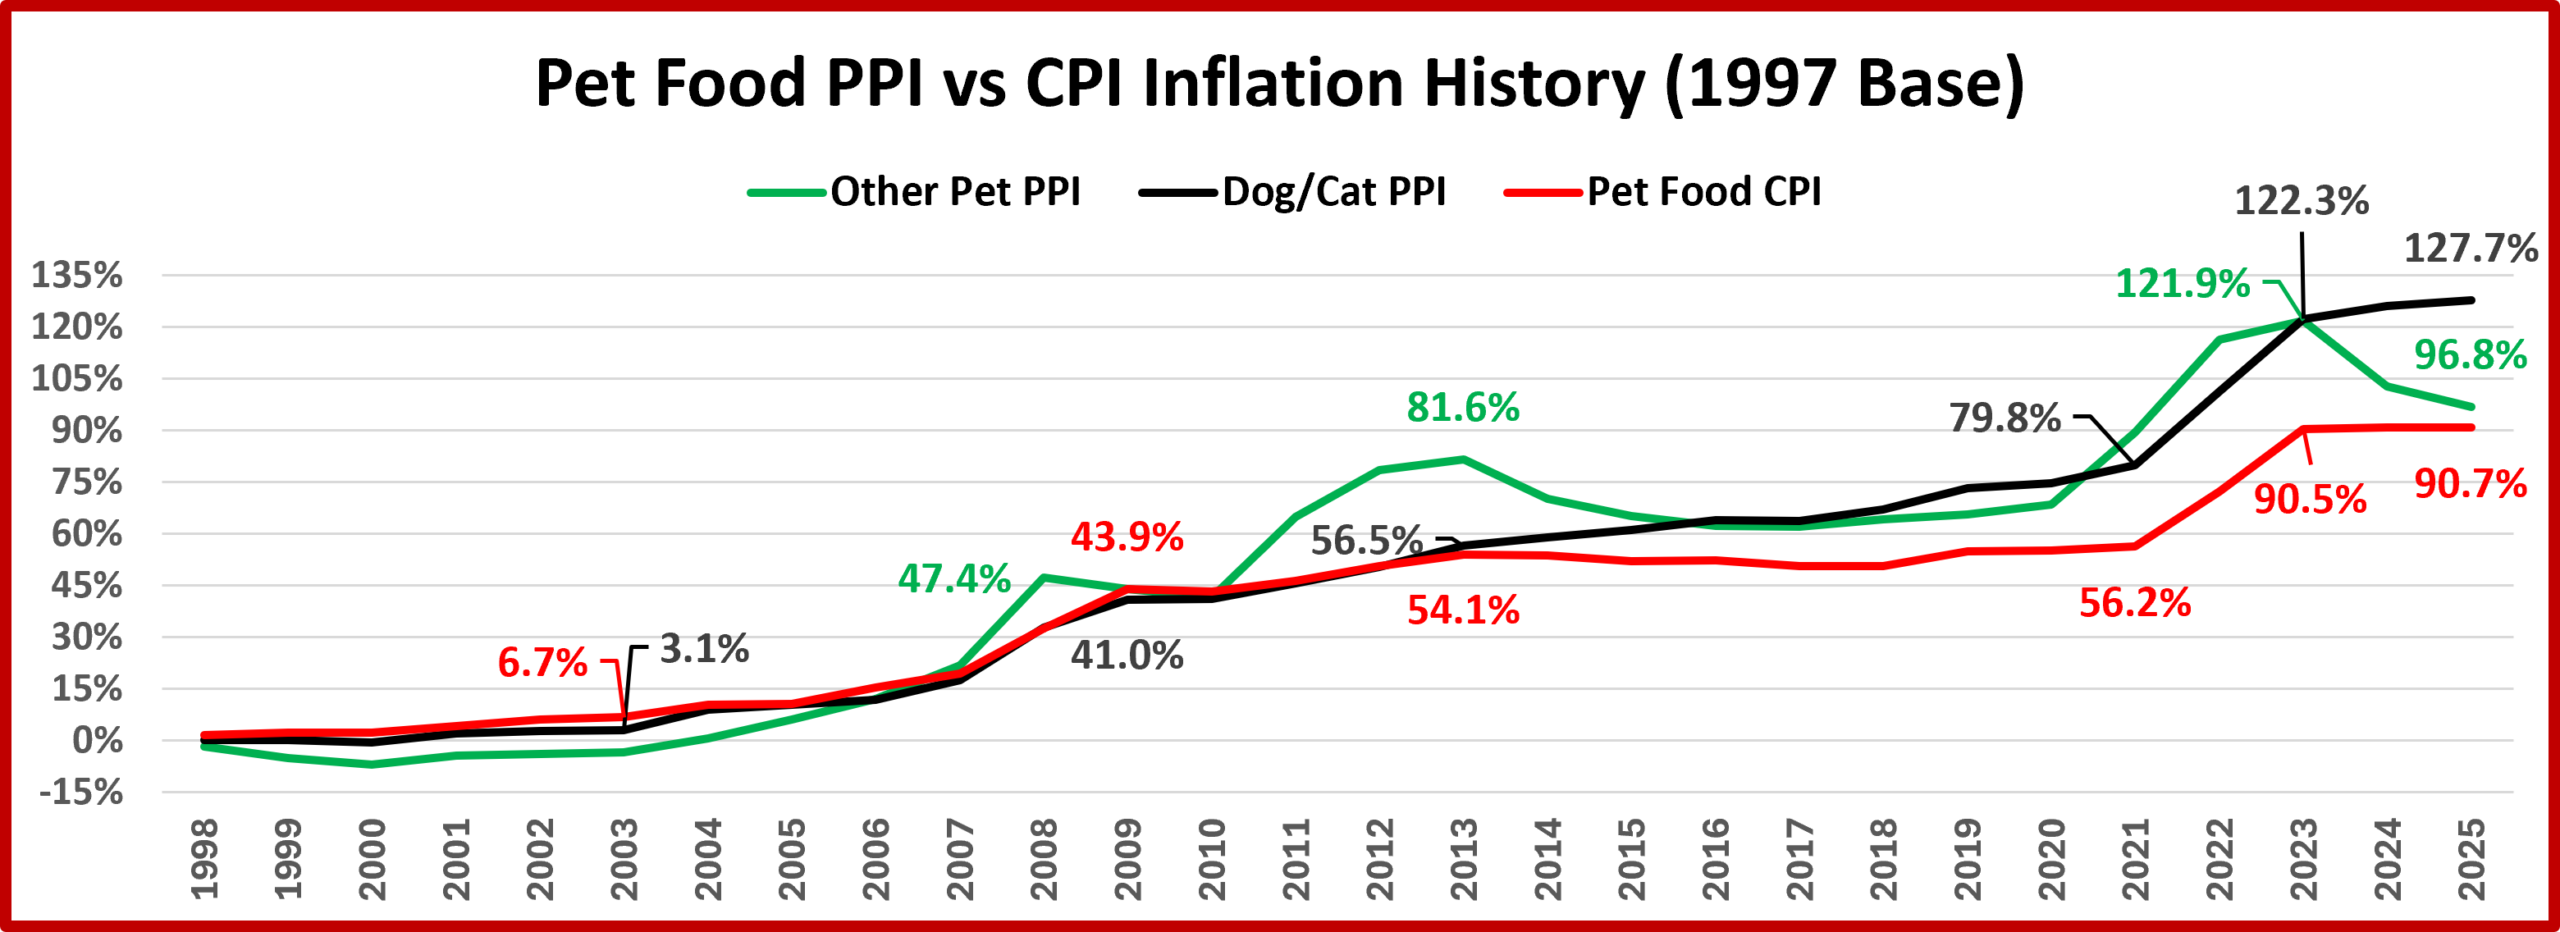
Inflation has certainly become top of mind recently. It’s a complex subject. In this report, we will look at how the Pet Food CPI (Retail Price) compares to its Producer Price Index (PPI – Manufacturers’ selling price). Both are important. Changes in the PPI affect the CPI (Retail Price). We will start with a chart that shows the cumulative annual inflation in the Pet Food PPI & the Pet Food CPI from 1997 to 2025.

The chart is very simple. It includes the Pet Food CPI plus the Dog/Cat PPI and the PPI for Non Dog/Cat, Other Pets. Dog/Cat Food makes up the vast majority of Pet Food sales, and it drives the Pet Food CPI. However, I thought that this chart would be of interest. From 1997 to 2007 the Other Pet PPI matches Dog/Cat, but It had bigger lifts in 2008 and 2011>13. The biggest difference occurred recently. Both had lifts from 2021 to 2023 but the Other Pet PPI fell -11.3% 2023>2025 while the Dog/Cat PPI continued slow growth, +2.4%.

The Dog/Cat PPI is obviously the most important. Its path almost exactly matches the CPI until 2014 when it rose above retail price growth. What happened in 2014? In the 2nd half of the year, Super Premium Pet Food was launched. This included raw food, which requires constant refrigeration. In all previous years, the path to the consumer was Manufacturer > Distributor > Retailer > Consumer. Manufacturers began to think of ways to shorten the trip. The obvious choice was to eliminate distributors and sell directly to Retail, especially for items that required refrigeration. The internet facilitated this plan and even made it possible for some Manufacturers to sell direct to consumers. This allowed the Manufacturers to increase their selling price without impacting retail. This disparity continues but the Dog/Cat Food PPI and Pet Food CPI have had the same pattern since 2019. Now, let’s look deeper within Dog & Cat Food.

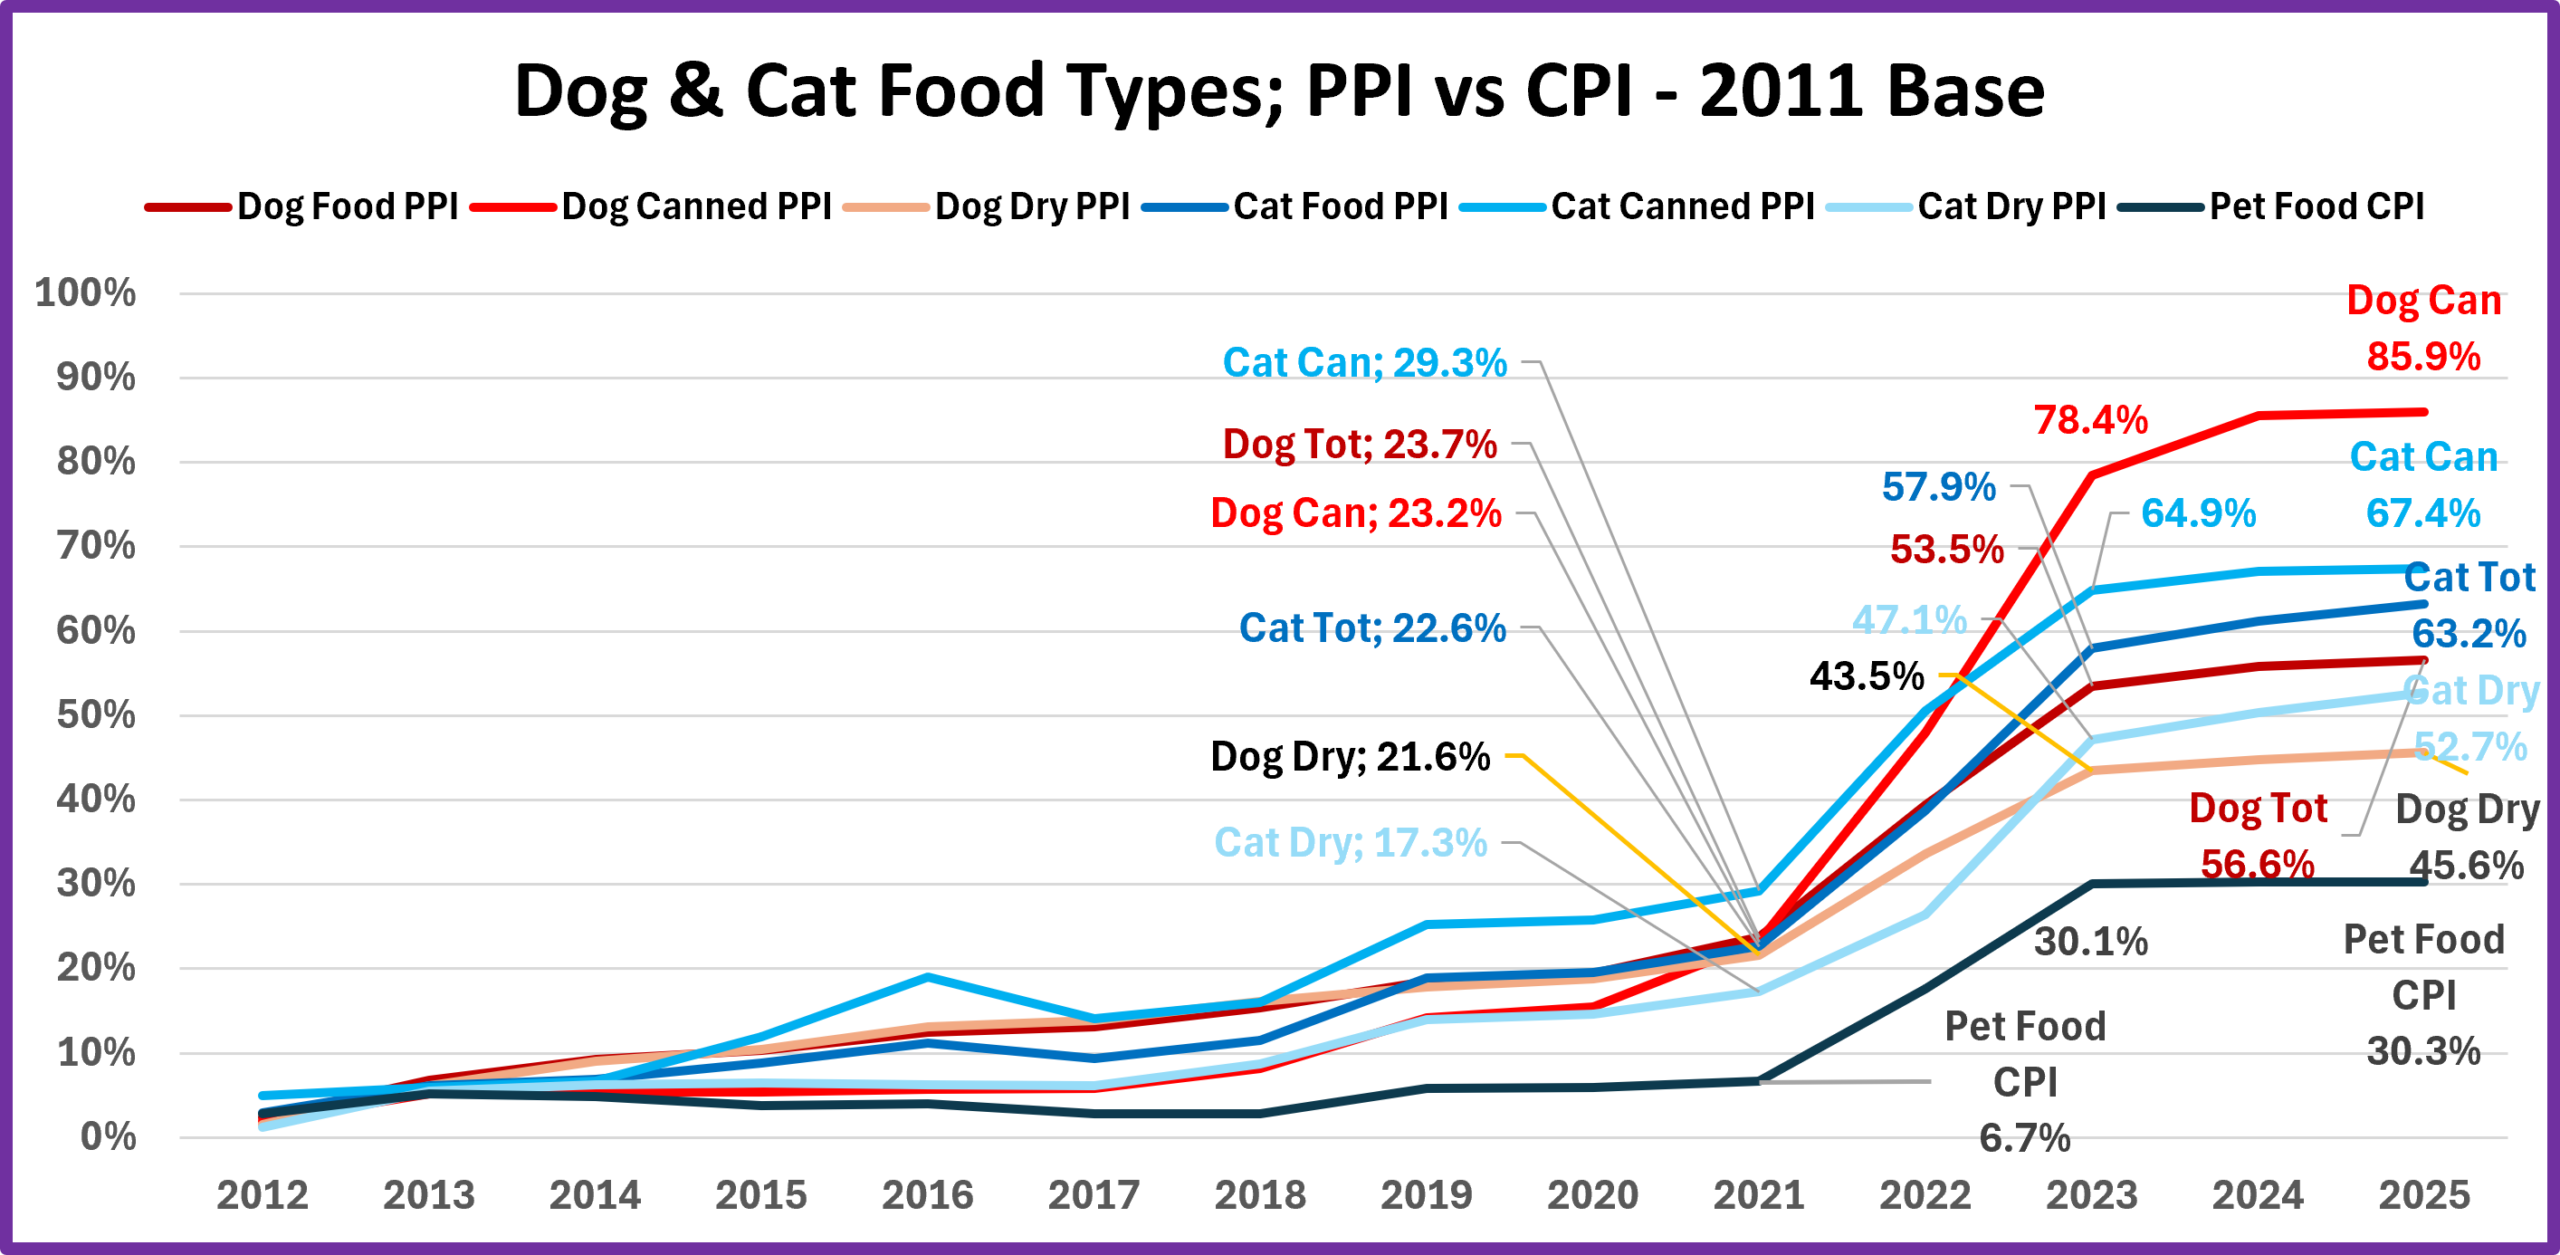
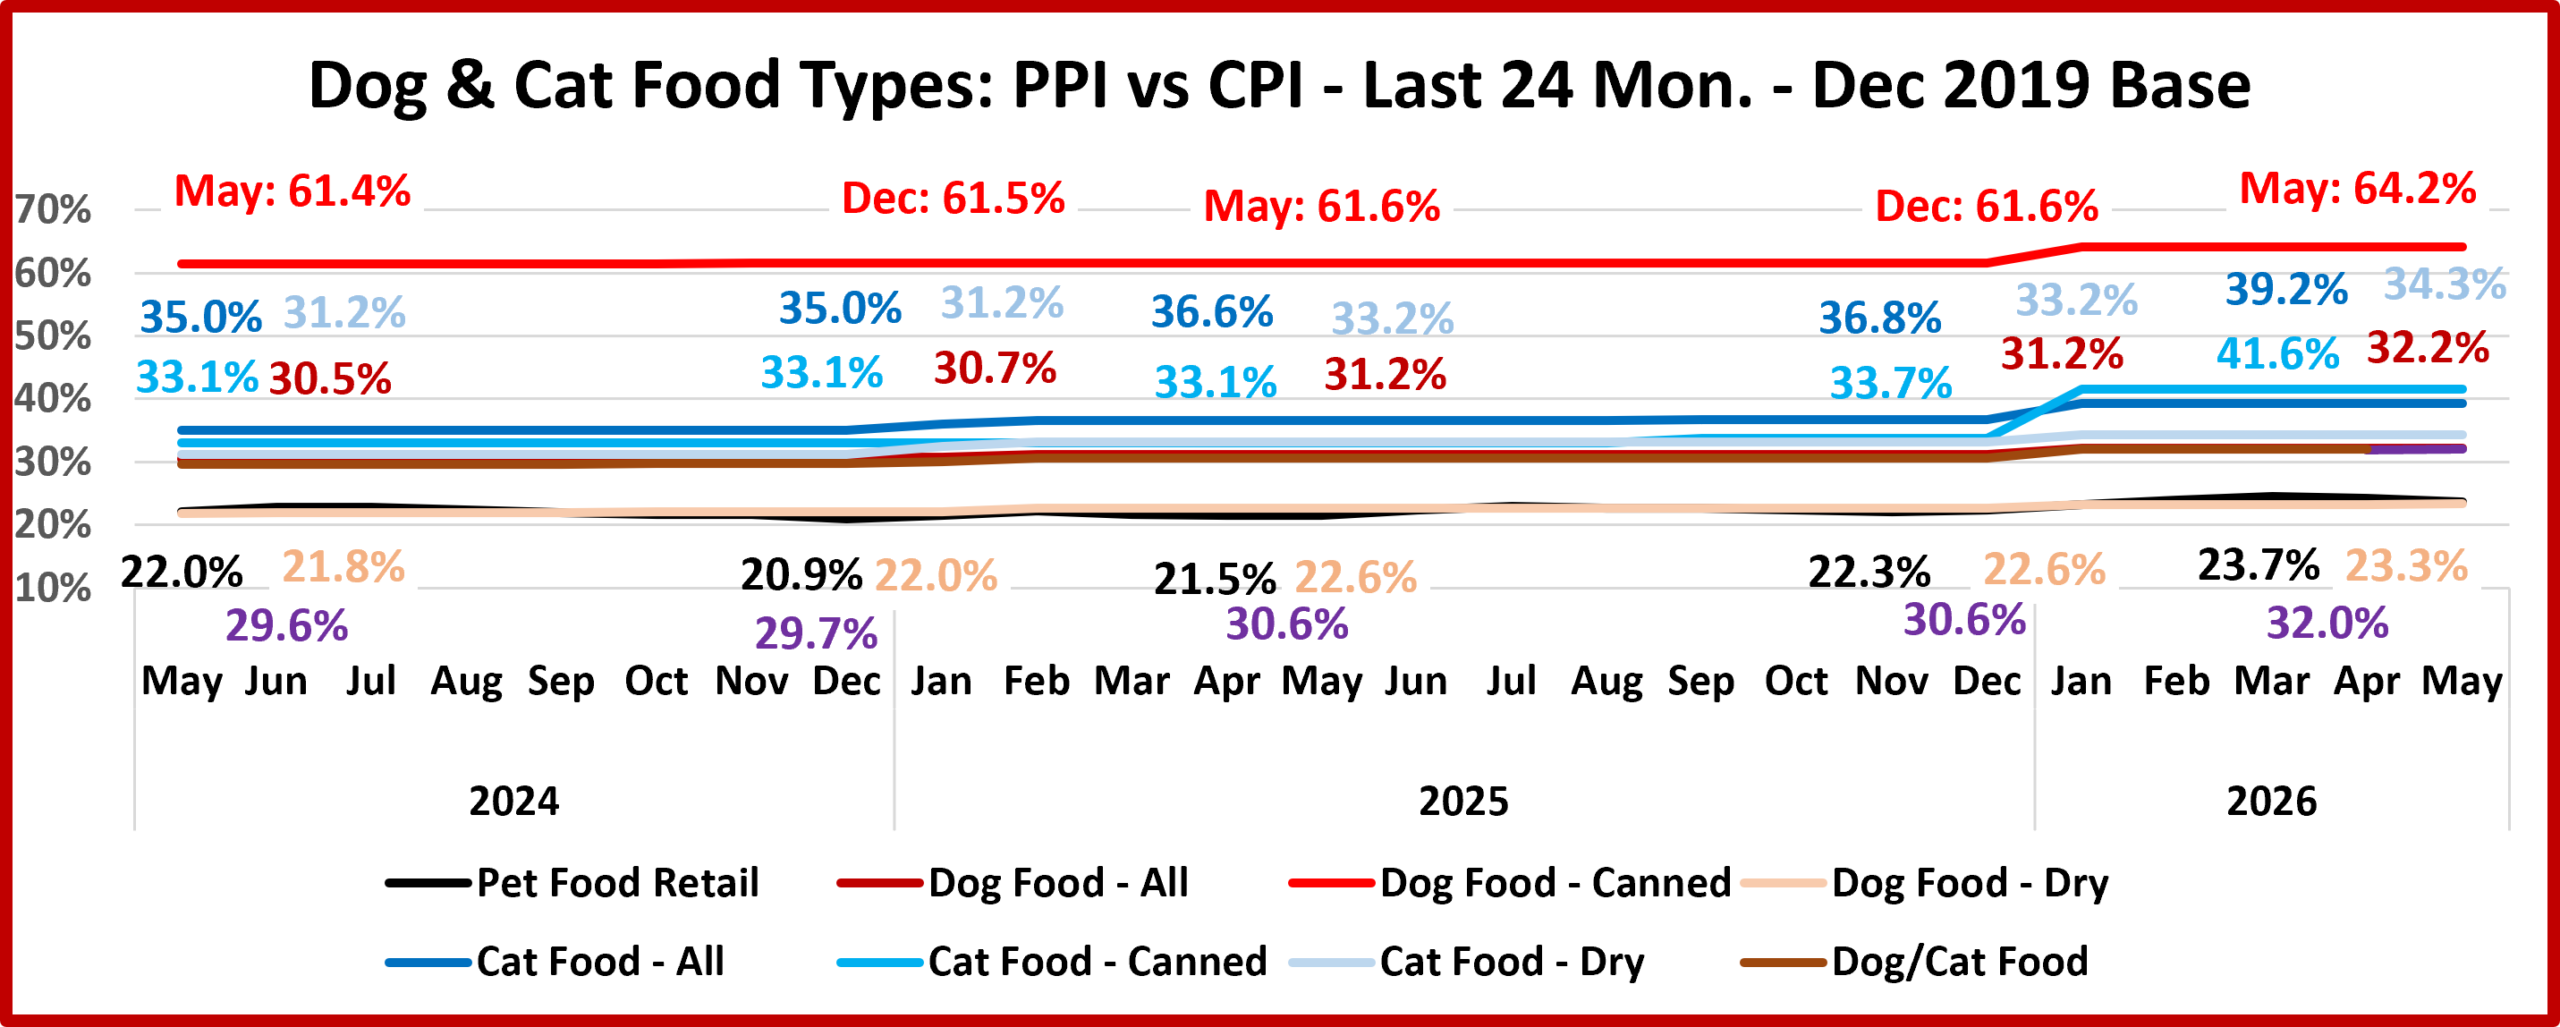
All significantly exceed the CPI but generally match its pattern. Canned/Wet/Raw have the 2 highest inflation rates, but Dog didn’t take the top spot from Cat until 2023. Canned Dog PPI inflation is 88% more than dry Dog. All cumulative rates are more than double 2021, but the CPI is 4.5 times more. No real surprises, just reinforced expectations. Finally, we’ll take a closer look at recent history. This chart shows the monthly CPI vs specific PPIs from May 2024 to May 2026.

We see a lot of “flat” in both the PPIs and the Pet Food CPI. There are only 2 significant lifts on the whole chart. Both are canned food PPIs and occurred in January 2026. The biggest was Canned Cat Food, +5.9%. #2 was Dog Canned, +1.6%.

The Pet Food CPI has only risen 1.4% in the last 24 months. That’s a big change from -0.02% deflation but almost nothing when compared to the 21.9% price lift from 2021 to 2023. We can’t forget that inflation is cumulative. Although the CPI is flat, the May 26 retail price of Pet Food is within 0.6% of the March record high.

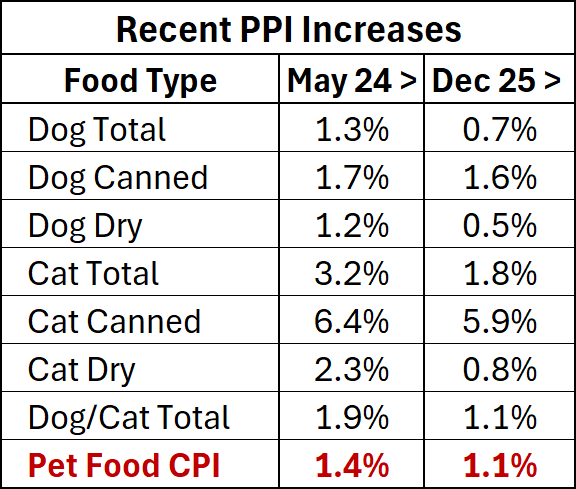
Canned/Wet/Raw Dog & Cat Food drove the 22/23 pricing surge and still lead the way in the current PPIs. Here are recent PPI % lifts by animal and type:

You see that the Pet Food PPI lift over the last 2 years was primarily driven by Cat Food. That’s not unexpected. The Canned/Wet Cat Food PPI is up 6.4% since May 24, 3.8 times more than the 1.7% lift in Canned/Wet Dog Food. Almost all of both canned lifts came from a big December 25 > January 26 PPI increase. The Dry Cat PPI lift since May 24 was +2.3%, almost double the 1.2% increase in Dry Dog Food. That means that Total Cat was +3.2%, 2.5 times more than the +1.3% in Total Dog. As stated, this was not unexpected. However, the difference was much larger than average. The lift in the Total Cat PPI from 2011>2025 was only 14% more than the lift in Total Dog.

The Pet Food CPI spiked in 22/23, flattened in 24 and even fell slightly in 2025. Prices rose from Dec 25 to Mar 26 (Record High), then fell slightly in Apr/May. You see that the Total Dog/Cat PPI lift in 2026 is +1.1%. This is exactly equal to the Pet Food CPI increase. This is a good sign. It says that pet parents have already paid for the recent PPI lifts. Both Retail and Manufacturers’ Prices should stay high but remain relatively stable at least for the next few months. Of course, this could all change quickly due to an unexpected event, like a sudden new supply chain problem. We’ll just wait and see.

Before I end the report, I want to bring up an observation that is largely under the radar but may be significant. It is in the Food Types chart with the 2019 base. We have noted that the different Food PPIs have a big disparity with the Pet Food CPI but a very similar pattern. If you look at the 2024>2026 value line for the Dry Dog Food PPI, you see that the pattern is more than just similar to the CPI. In fact, the data and resulting line almost exactly match the CPI. Consider these facts. Dry Dog food is the largest $ segment in Pet Food. It is still expensive but has the lowest price for this needed product category. It is also the easiest to value shop – in store and online. Maybe Pet Parents who buy dry dog food are helping to slow Petflation.