2021 U.S. PET SUPPLIES SPENDING $23.81B…Up ↑$8.65B
Total Pet spending grew to $99.98B in 2021, up $16.23B (+19.4%) from 2020, the biggest increase in history. In a big turnaround the Supplies segment led the way with a $8.65B, 57.0% increase to $23.81B. (Note: All numbers in this report come from or are calculated by using data from the US BLS Consumer Expenditure Surveys)
Spending plummeted in 2019 & 2020 down -$4.6B due to Tarifflation and the Pandemic. In 2021, with lower prices and an easing of restrictions, spending turned up sharply in the 1st half then skyrocketed up in the 2nd half. We’ll “drill down” into the data to try to determine what and who are “behind” the explosive growth in Supplies Spending in 2021.
In 2021, the average household spent $178.20 on Supplies, up 54.3% from $115.52 in 2020. (Note: A 2021 Pet CU (68%) Spent $262.06) This doesn’t exactly match the 57.0% total $ increase. Here are the specific details:
- 1.8% more CU’s
- Spent 40.7% more $
- 9.7% more often
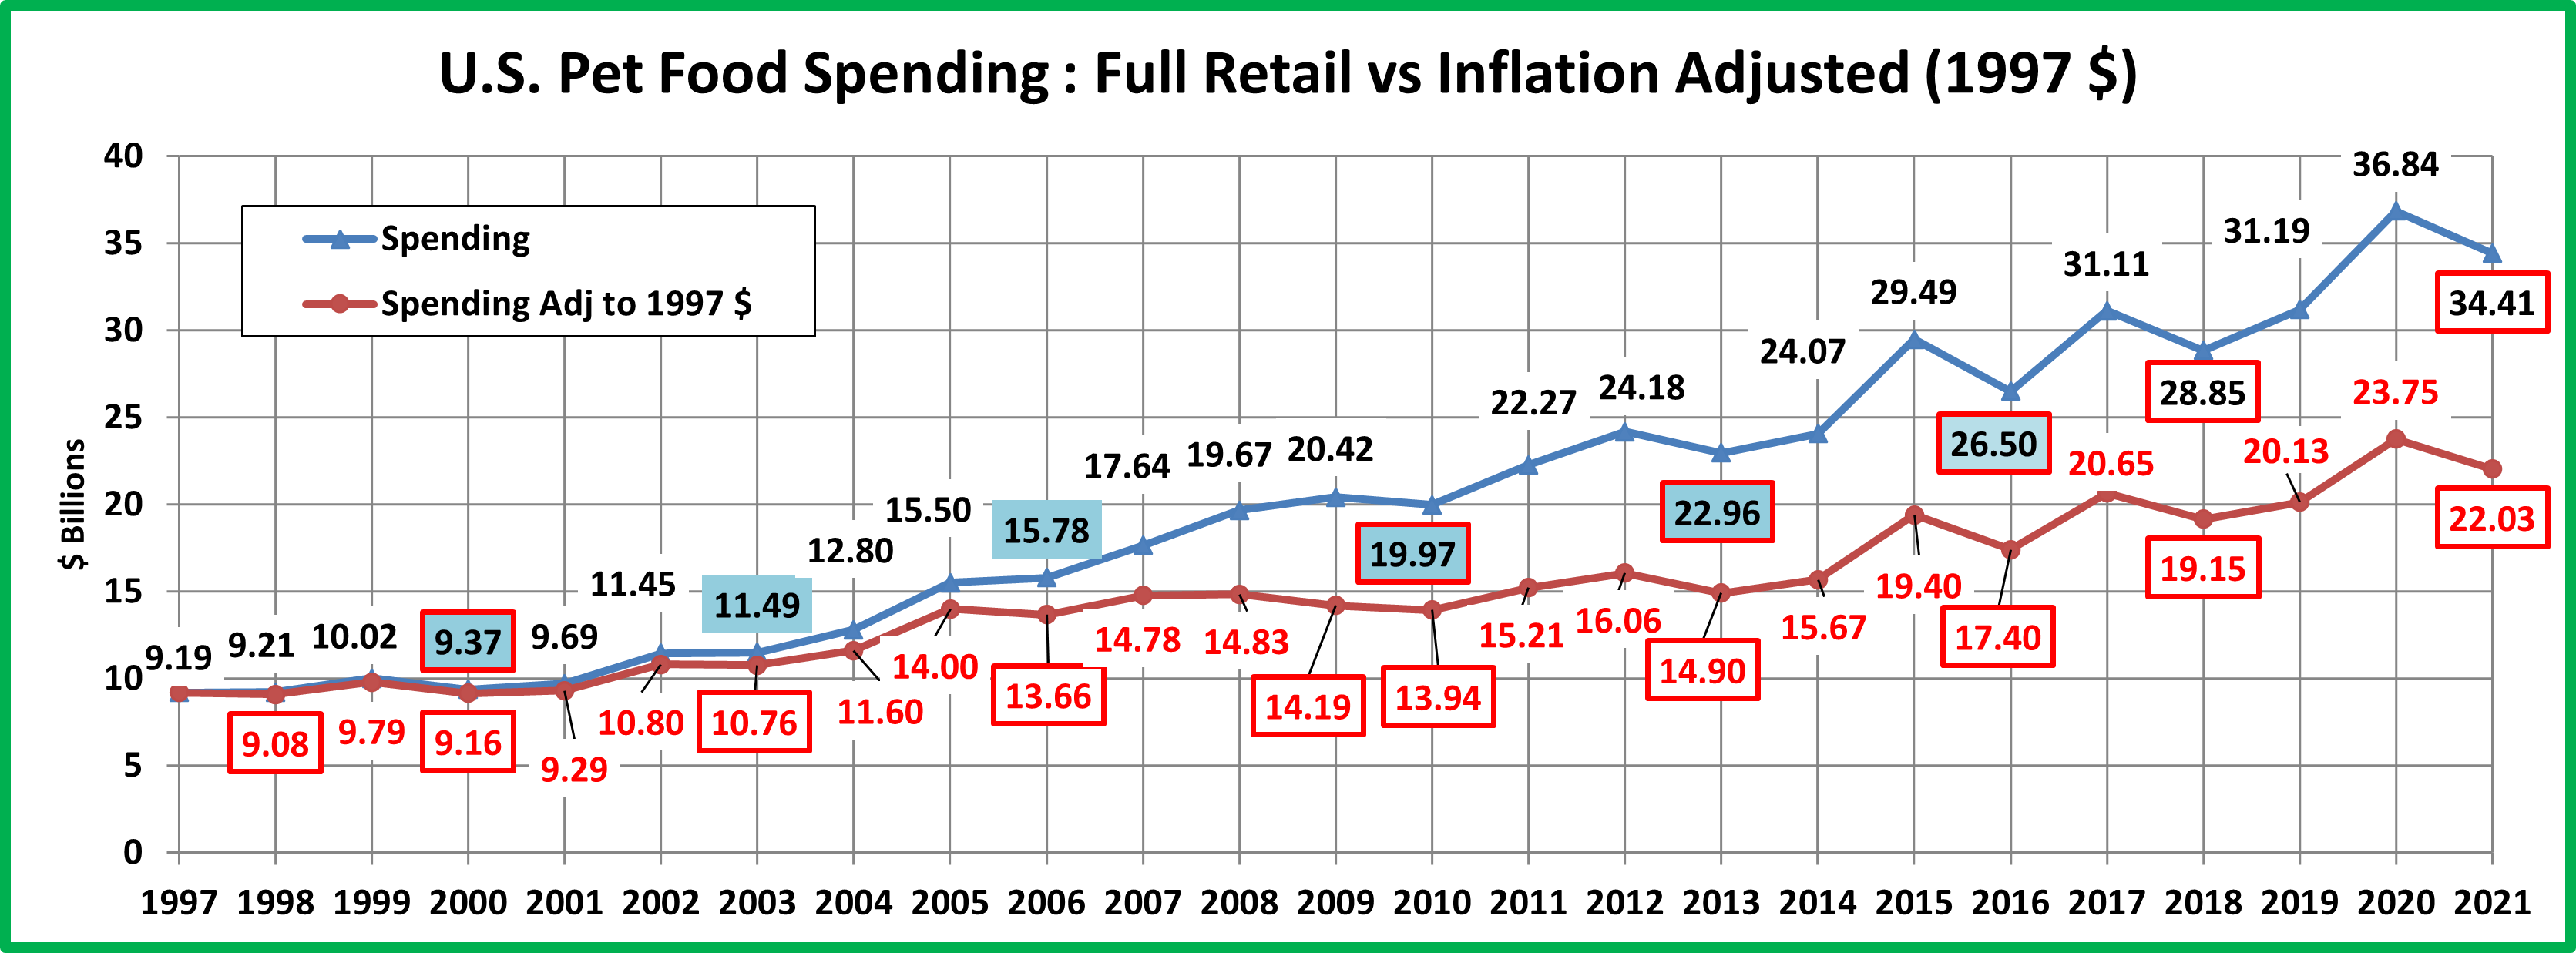
Let’s start with a visual overview. The chart below shows recent Supplies spending history.
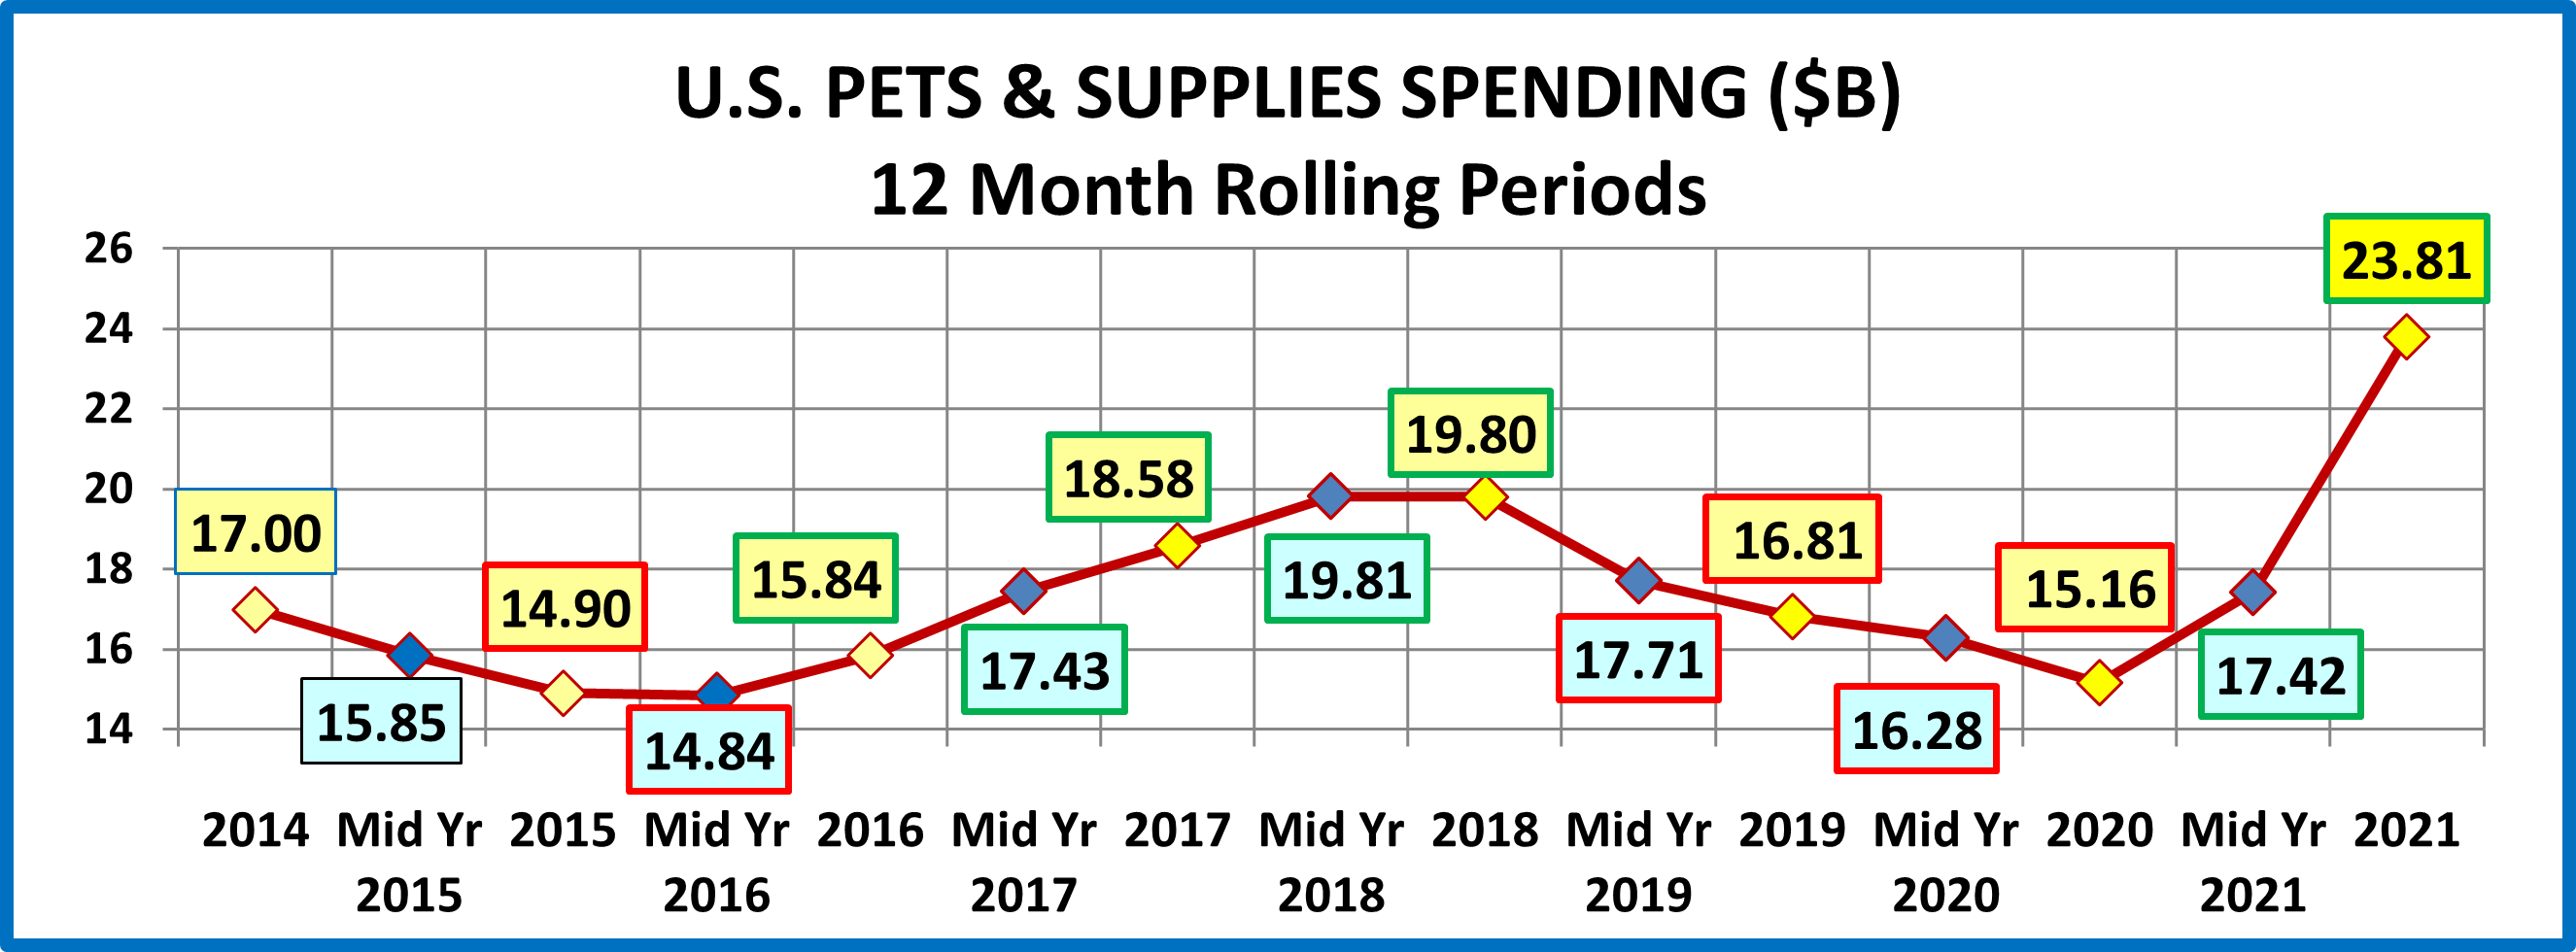
Since the great recession, spending in the Supplies segment has been driven by price. Although many supplies are needed by Pet Parents, when they are bought and how much you spend is often discretionary. When prices fall, consumers are more likely to buy more. When they go up, consumers spend less and/or buy less frequently.
2014 was the third consecutive year of deflation in Supplies as prices reached a level not seen since 2007. Consumers responded with a spending increase of over $2B. Prices stabilized and then moved up in 2015.
In 2015 we saw how the discretionary aspect of the Supplies segment can impact spending in another way. Consumers spent $5.4B for a food upgrade and cut back on Supplies – swapping $. Consumers spent 4.1% less, but they bought 10% less often. That drop in purchase frequency drove $1.6B (78%) of the $2.1B decrease in Supplies spending.
In 2016, supplies’ prices flattened out and consumers value shopped for their upgraded food. Supplies spending stabilized and began to increase in the second half. In 2017 supplies prices deflated, reaching a new post-recession low. The consumers responded with a $2.74B increase in Supplies spending that was widespread across demographic segments. An important factor in the lift was an increase in purchase frequency which was within 5% of the 2014 rate.
In 2018 prices started to move up in April and rapidly increased later in the year due to the impact of new tariffs. By December, Supplies prices were 3.3% higher than a year ago. This explains the initial growth and pull back in spending.
In 2019 we saw the full impact of the tariffs. Prices continued to increase. By yearend they were up 5.7% from the Spring of 2018 and spending plummeted -$2.98B. The major factor in the drop was a 13.1% decrease in purchasing frequency.
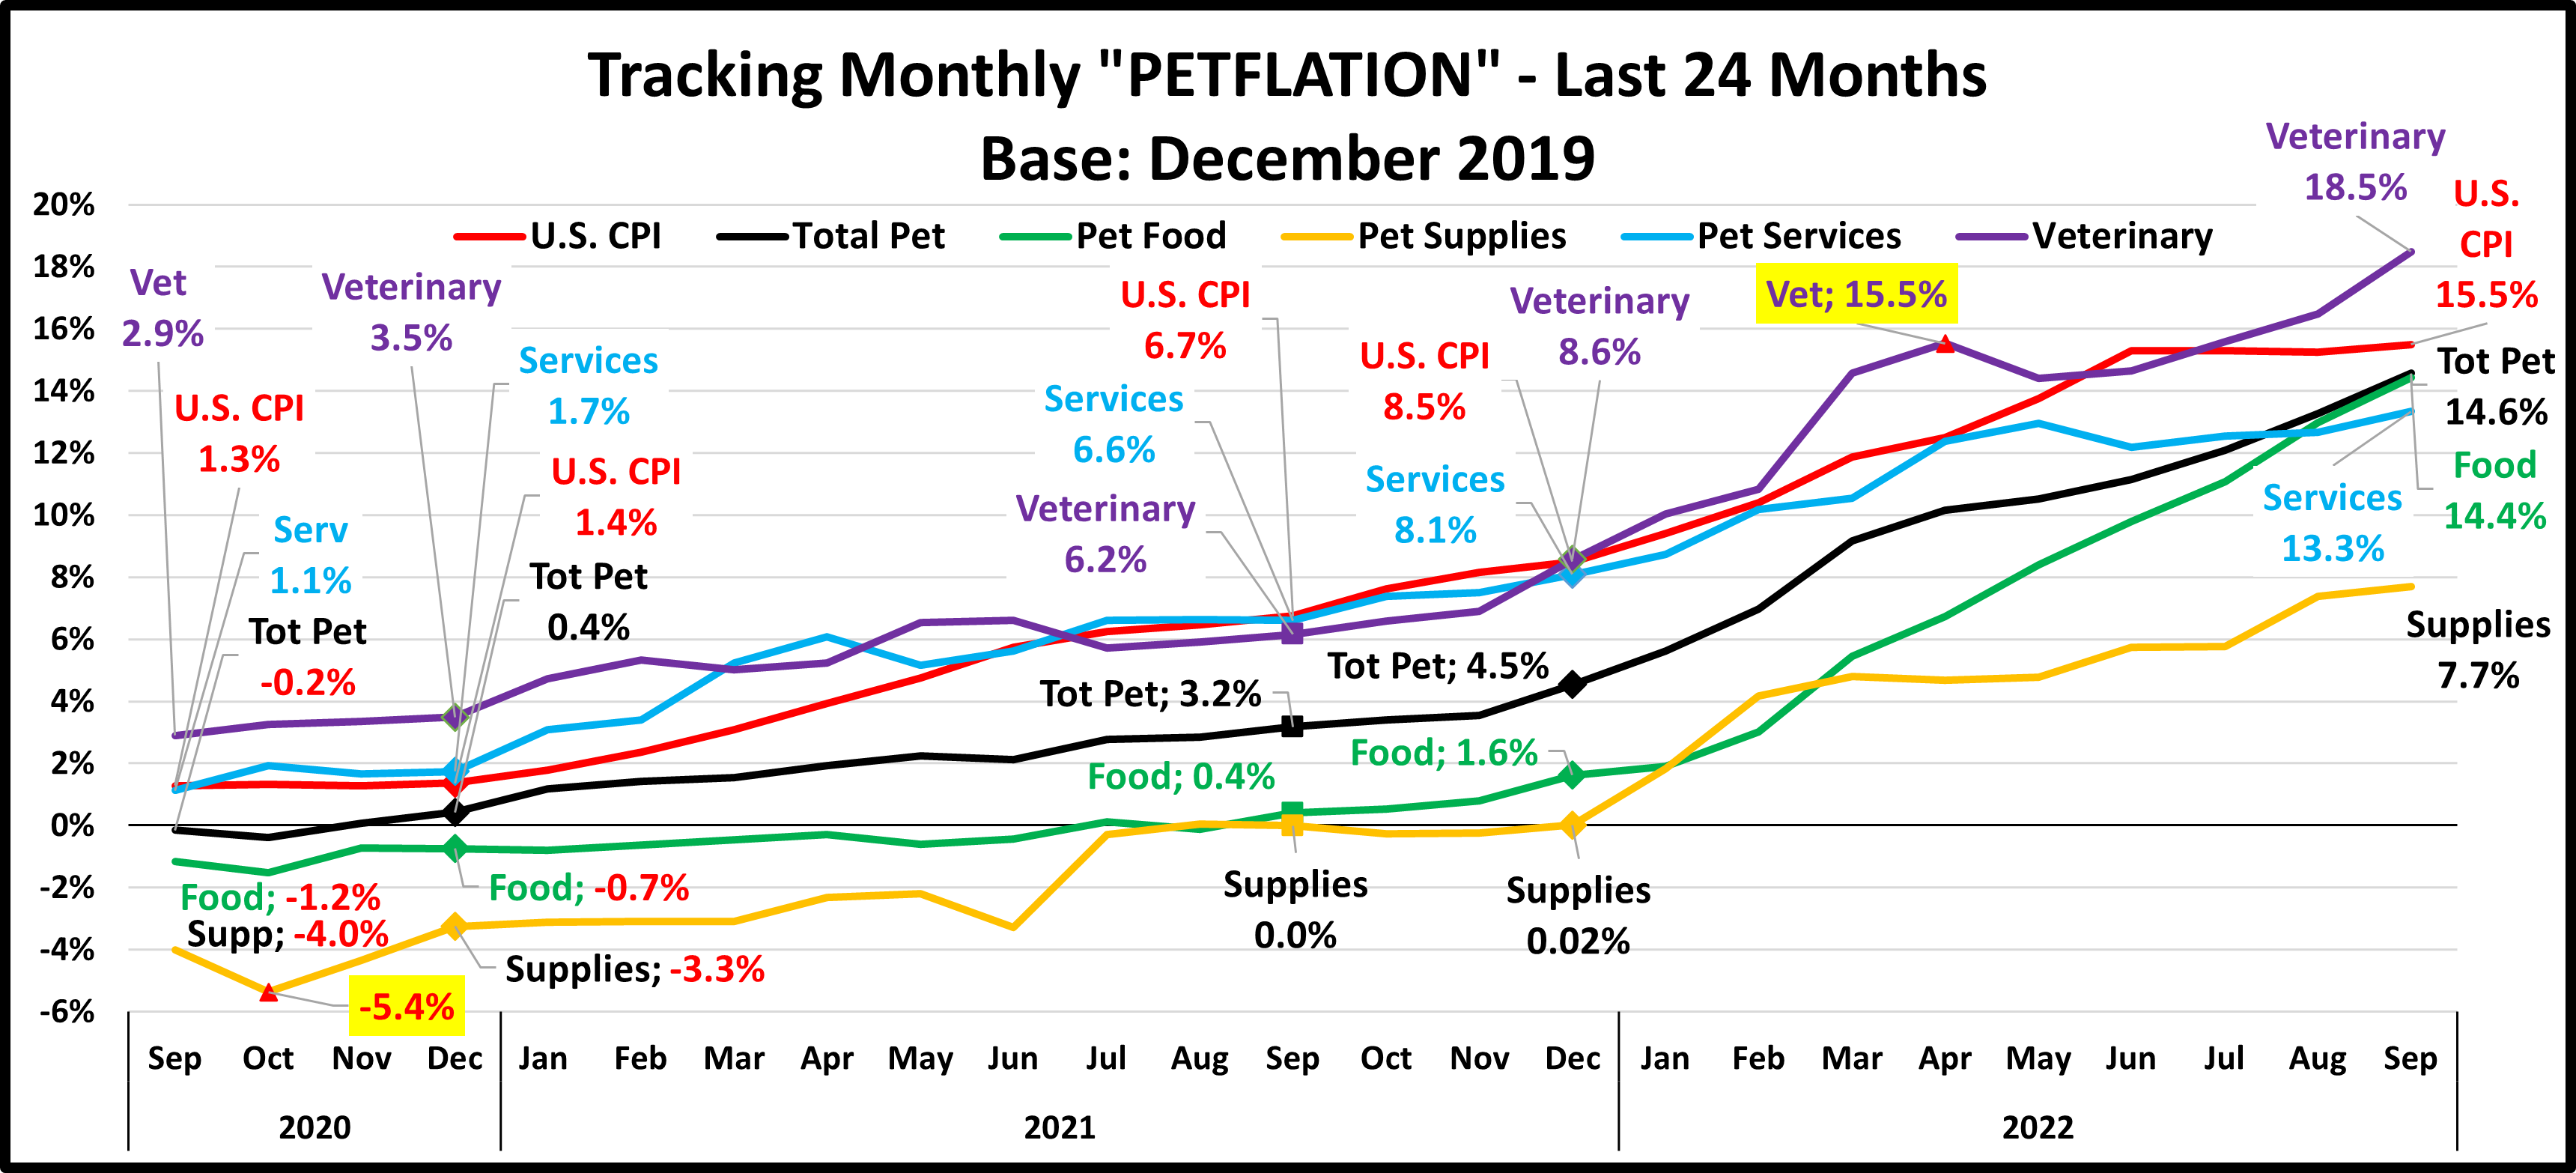
2020 brought the pandemic. Prices deflated but with retail restrictions and the consumers focus on needed items, both the amount spent and frequency of purchase of Supplies fell.
In 2021 the recovery began with a strong lift in the 1st half that reached record levels in the 2nd half. Pet parents bought all the supplies that they had been putting off for 2 years because of Tarifflation and the Pandemic. It was the greatest lift in history, but 2021 spending ended up where it was headed in 2018 before being “derailed” by outside influences.
That gives us an overview of the recent spending history. Now let’s look at some specifics regarding the “who” behind the 2021 lift. First, we’ll look at spending by income level, the most influential demographic in Pet Spending.
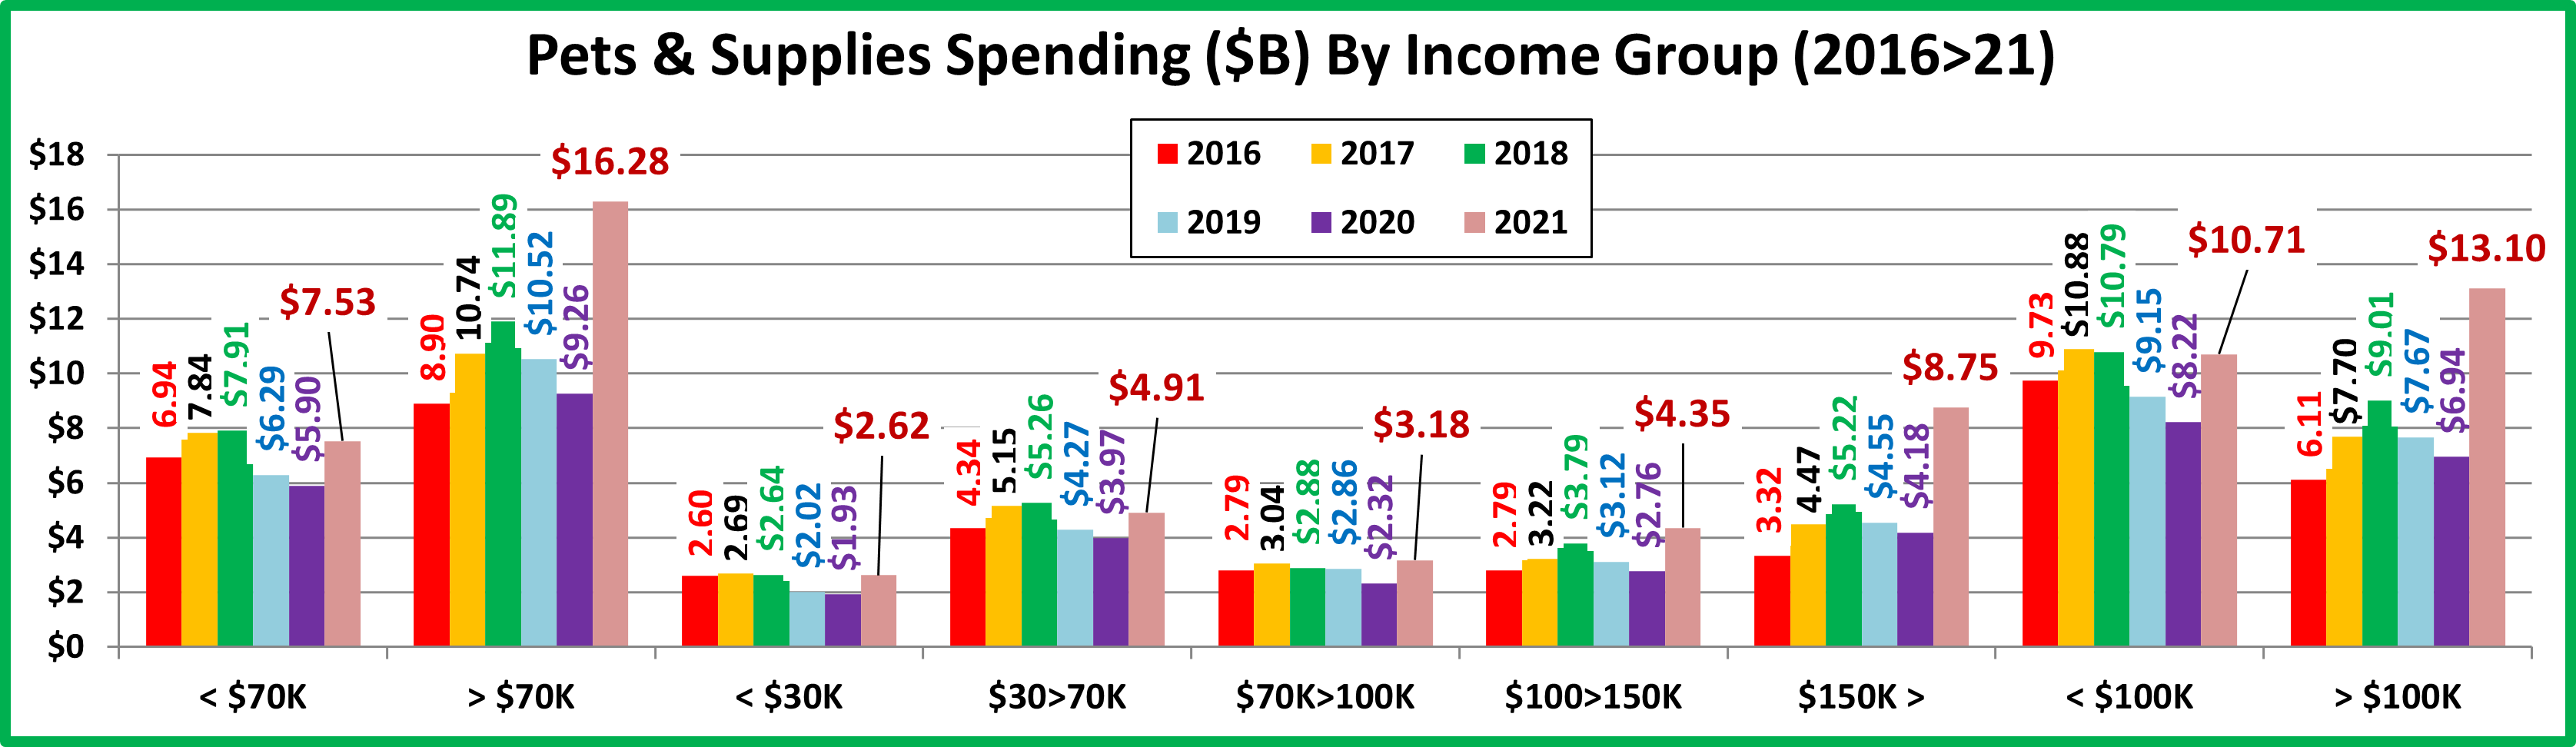
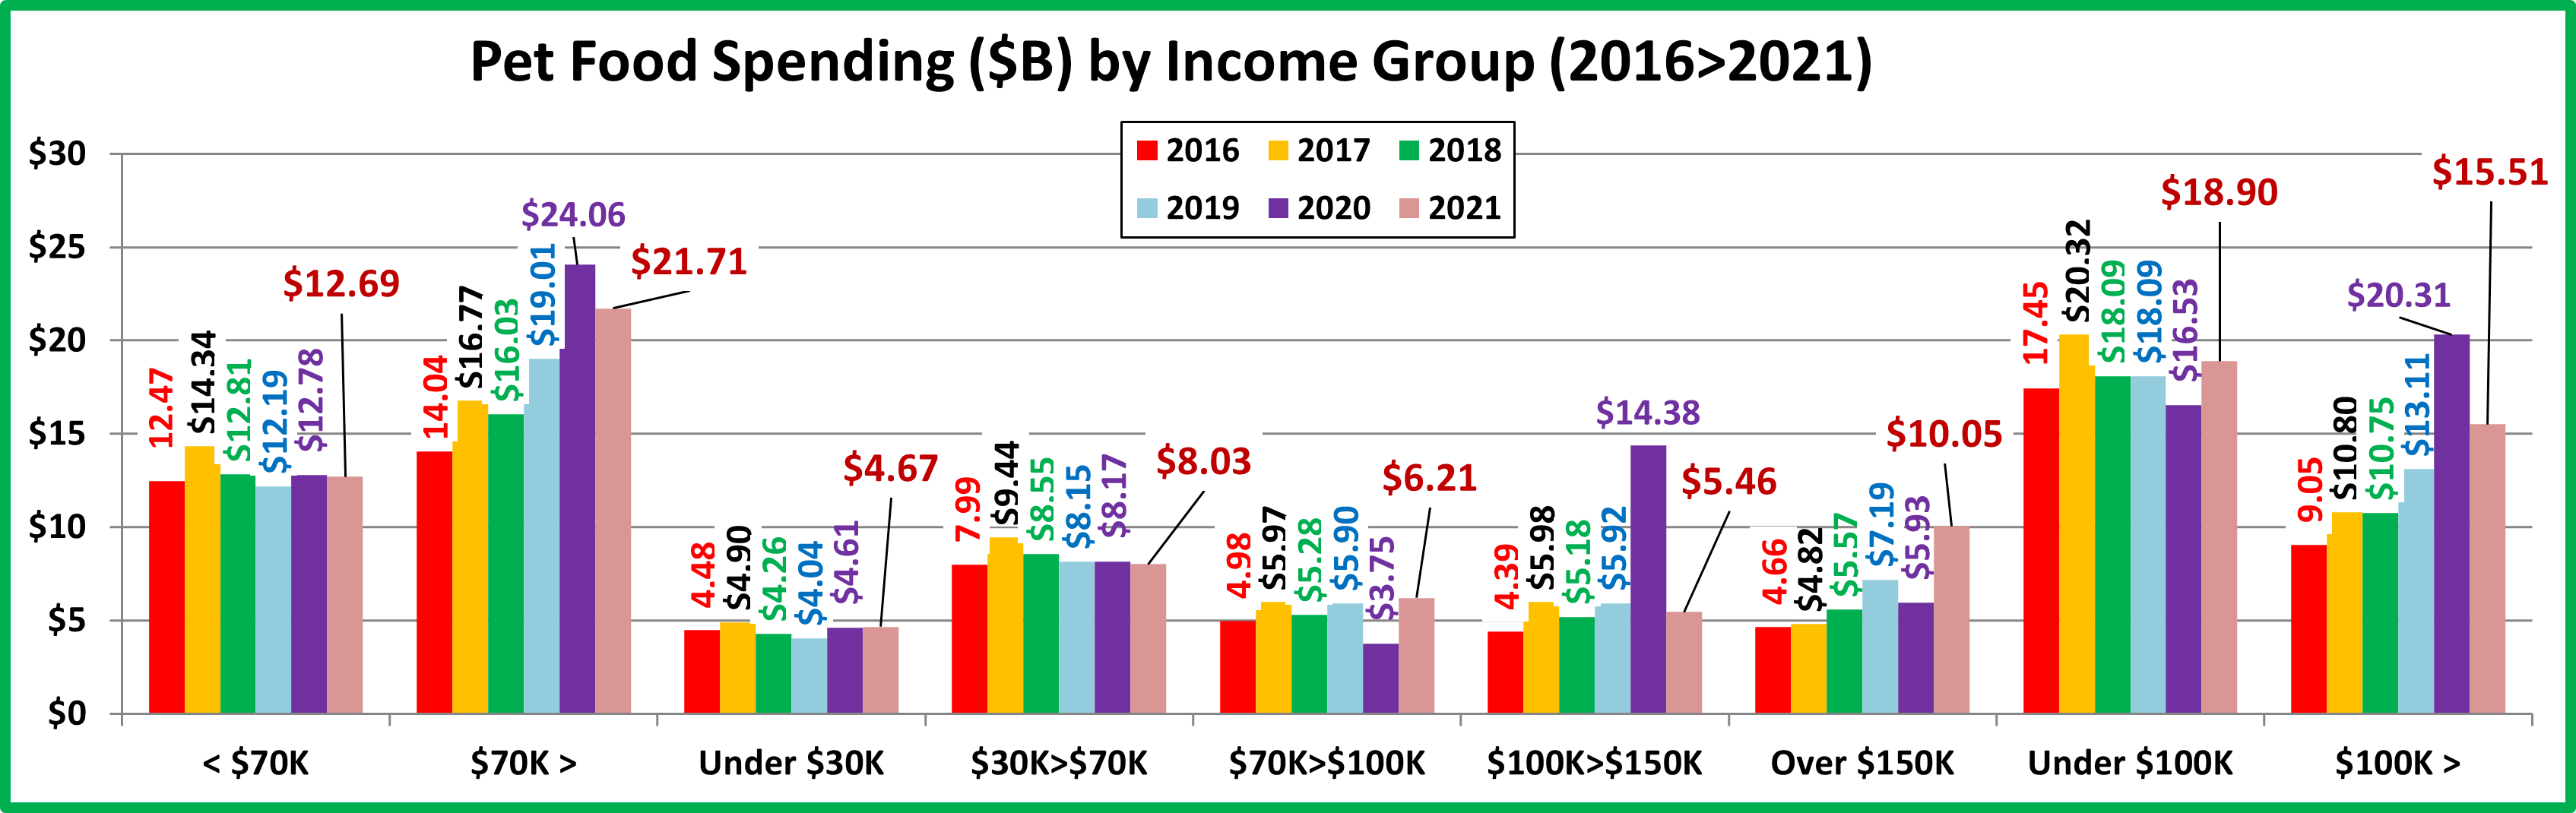
National: $178.20 per CU (+54.3%) – $23.81B – Up $8.65B (+57.0%).
All big income groups spent more but the 50/50 $ divide increased astronomically from $92K to $114K.
- <$30K (25.5% of CU’s)- $76.26 per CU (+33.0%) $2.62B– Up $0.69B (+35.9%). This group is very price sensitive, but their big spending lift finally put them ahead of 2016 $ despite the fact that they have 15% fewer CUs.
- $30K>70K (29.7% of CU’s)- $123.83 per CU (+27.2%) $4.91B Up $0.94 (+23.6%). This big, lower income group closely matches both the national pattern and that of the $150K+ group. Tarifflation had a big impact, but COVID and the recovery were less pronounced. Amazingly enough, until 2019 they were the leader in Total Supplies $.
- $70>$100K (14.8% of CU’s) – $160.38 per CU (+36.3%) – $3.18B Up $0.86B (+37.2%). This middle-income group had been consistent in Supplies spending. 2020 hit them hard but they too rebounded stronger than the drop.
- $100K>$150K (14.2% of CU’s) – $229.43 per CU (+56.7%)- $4.35B Up $1.59B (+57.6%). This high income group had the 2nd biggest COVID drop & traded Supplies $ for Food & Veterinary. In 2021 they had the 2nd strongest recovery.
- $150K> (15.8% of CU’s) – $415.37 per CU (+83.9%) $8.75B Up $4.57B (+109.2%). The more money that you have. The more that you can spend. The $200K> segment almost tripled their Supplies spending in 2021.
Every big group spent more but the biggest increases came from higher incomes. Only the $40>49K group spent less in 2021 but they had spent 25% more in 2020 so they returned to pre-pandemic 2019 $pending… but with 9% fewer CUs.
Now, we’ll look at spending by Age Group.

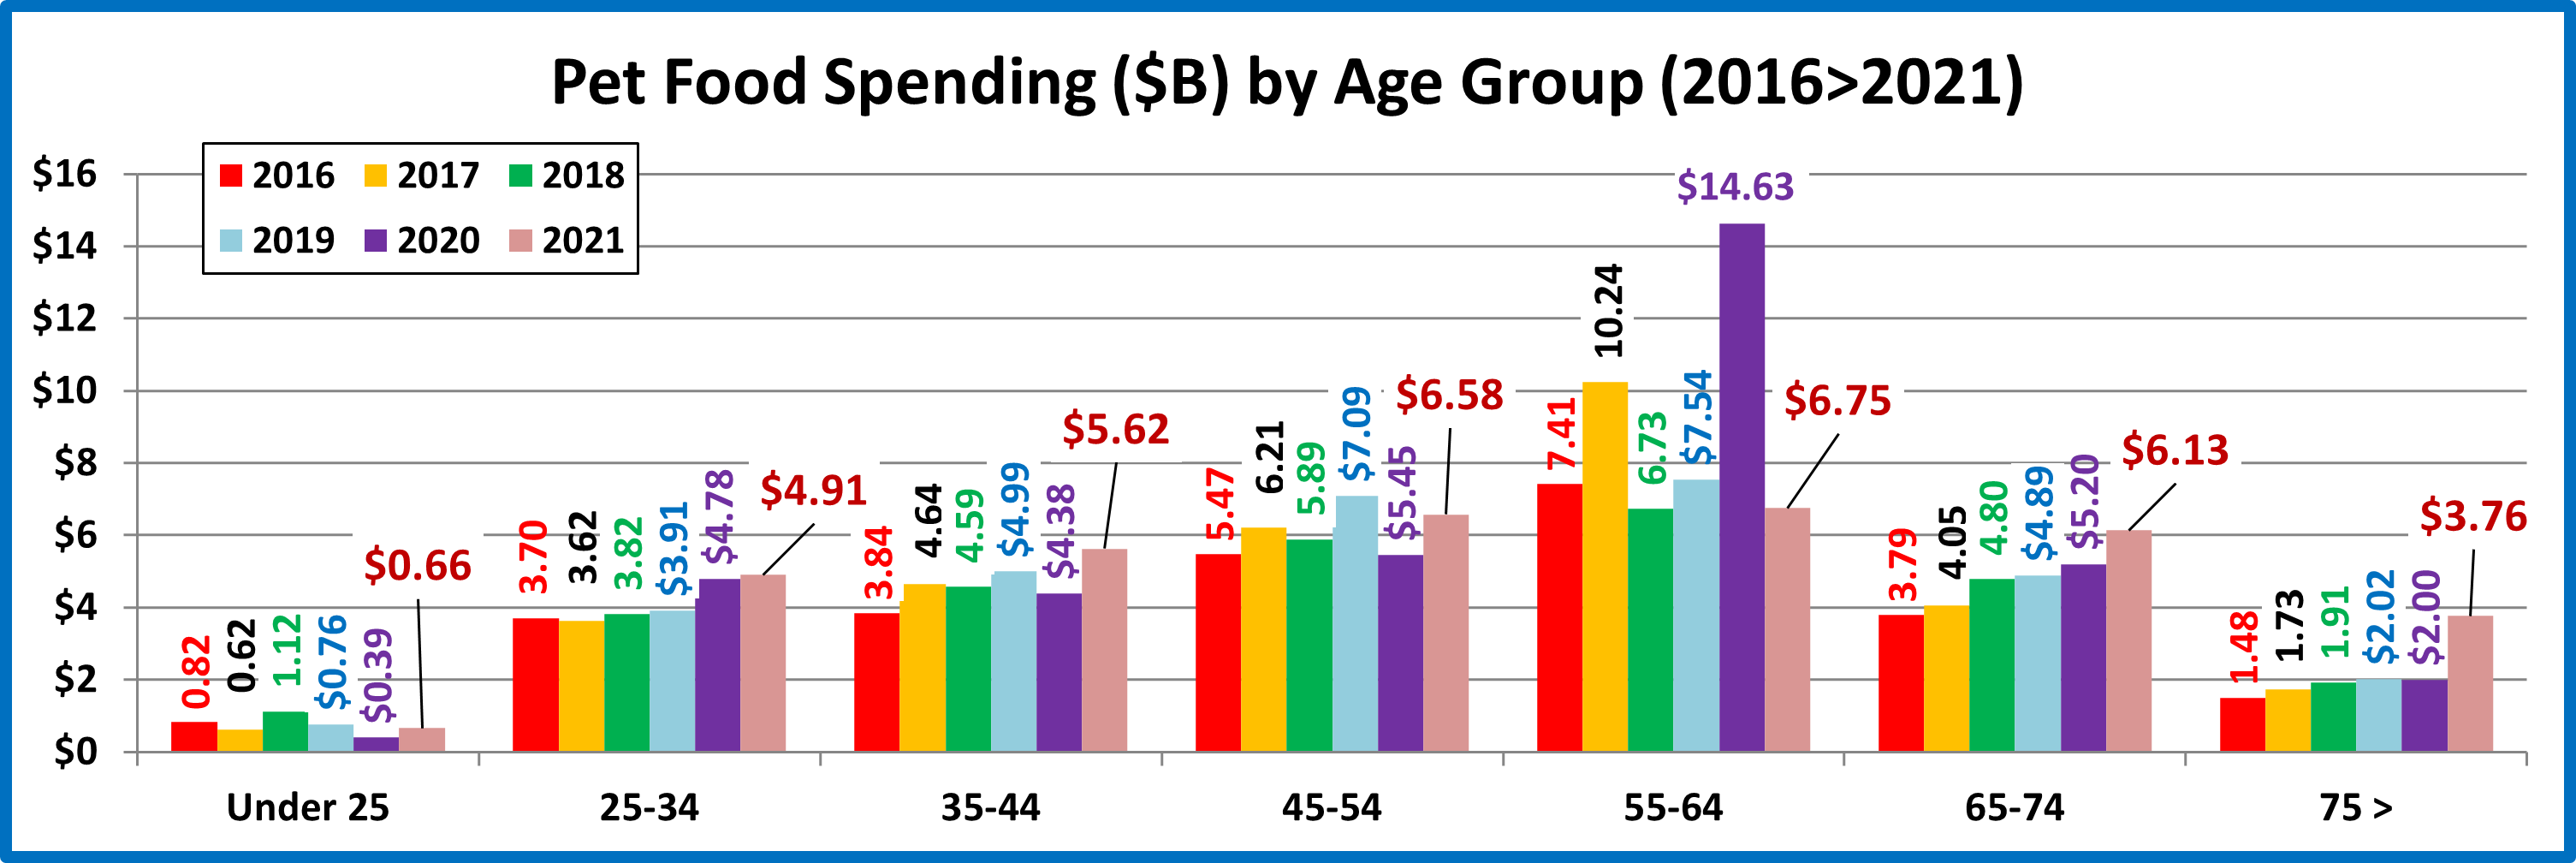
National: $178.20 per CU (+54.3%) – $23.81B – Up $8.65B (+57.0%).
It’s simple. Under 25 spent a little less. Over 25 spent a lot more.
- 35>44 (17.2% of CU’s) $312.65 per CU (+120.3%) – $7.17B; Up $4.0B (+126.3%) This group is second in income and overall expenditures. The strong inflation drove the $ down in 2019 but the Pandemic had little additional impact. Spending skyrocketed in 2021 as 2.8% more CUs spent 92.6% more $, 14.4% more often.
- 55>64 (18.5% of CU’s) $180.26 /CU (+65.5%) – $4.46B – Up $1.73B (+63.2%). When prices turned sharply up in the 2nd half of 2018 and 2019, spending stalled then dropped. Spending fell again in 2020 as they binge bought pet food. They had a strong recovery in 2021 as 1.4% fewer CU’s spent 51.2% more on Supplies, 9.5% more often.
- 45>54 (16.7% of CU’s) $186.48 per CU (+27.4%) – $4.15B – Up $0.85B (+25.6%). Except for 2019 and now 2021, this highest income age group had been the leader in Supplies spending since 2007. They came back from the pandemic drop but now are in 3rd place for Supplies $. 1.5% fewer CU’s spent 24.4% more, 2.4% more often.
- 25<34 (15.7% of CU’s) $177.00 per CU (+32.9%) – $3.72B; Up $0.93B (+33.2%). After trading Supplies $ for upgraded Food and Vet Care in 2016, these Millennials turned their attention back to Supplies. The rising prices hit them hard in 2019 but they actually increased spending in the pandemic. The lift grew even stronger in 2021 primarily due to increased purchase frequency. 0.2% more CUs spent 9.7% more $, 21.1% more often.
- 65>74 (16.1% of CU’s) $130.28 per CU (+35.6%) – $2.80B – Up $0.83B (+42.5%). This older group is very price sensitive so rising prices caused them to cut back on spending in 2019. Like the 25>34 yr-olds, they also increased spending in 2020 and spending soared in 2021. However, it was not due to increased frequency. 5.1% more CUs spent 32.0% more, 2.7% more often. Their purchase size was radically higher.
- 75> (10.9% of CU’s) $67.13 per CU (+56.0%) – $0.98B, Up $0.34B (+53.7%). This lowest income group is truly price sensitive and their spending was severely impacted by the Pandemic. They had a strong recovery in 2021 but didn’t quite make it back to their 2018 level. 1.4% fewer CU’s spent 22.8% more, 27.1% more often.
- <25 (4.9% of CUs) $80.11/CU (-27.6%) $0.53B – Down $0.03B (-5.1%). Most moved out of their parents homes but their average CU spending fell a lot. 31.1% more CUs spent 15.8% less $, 14.8% less often.
The COVID recovery was widespread and spectacular. Only <25 spent less and the performance of 35>44 was amazing.
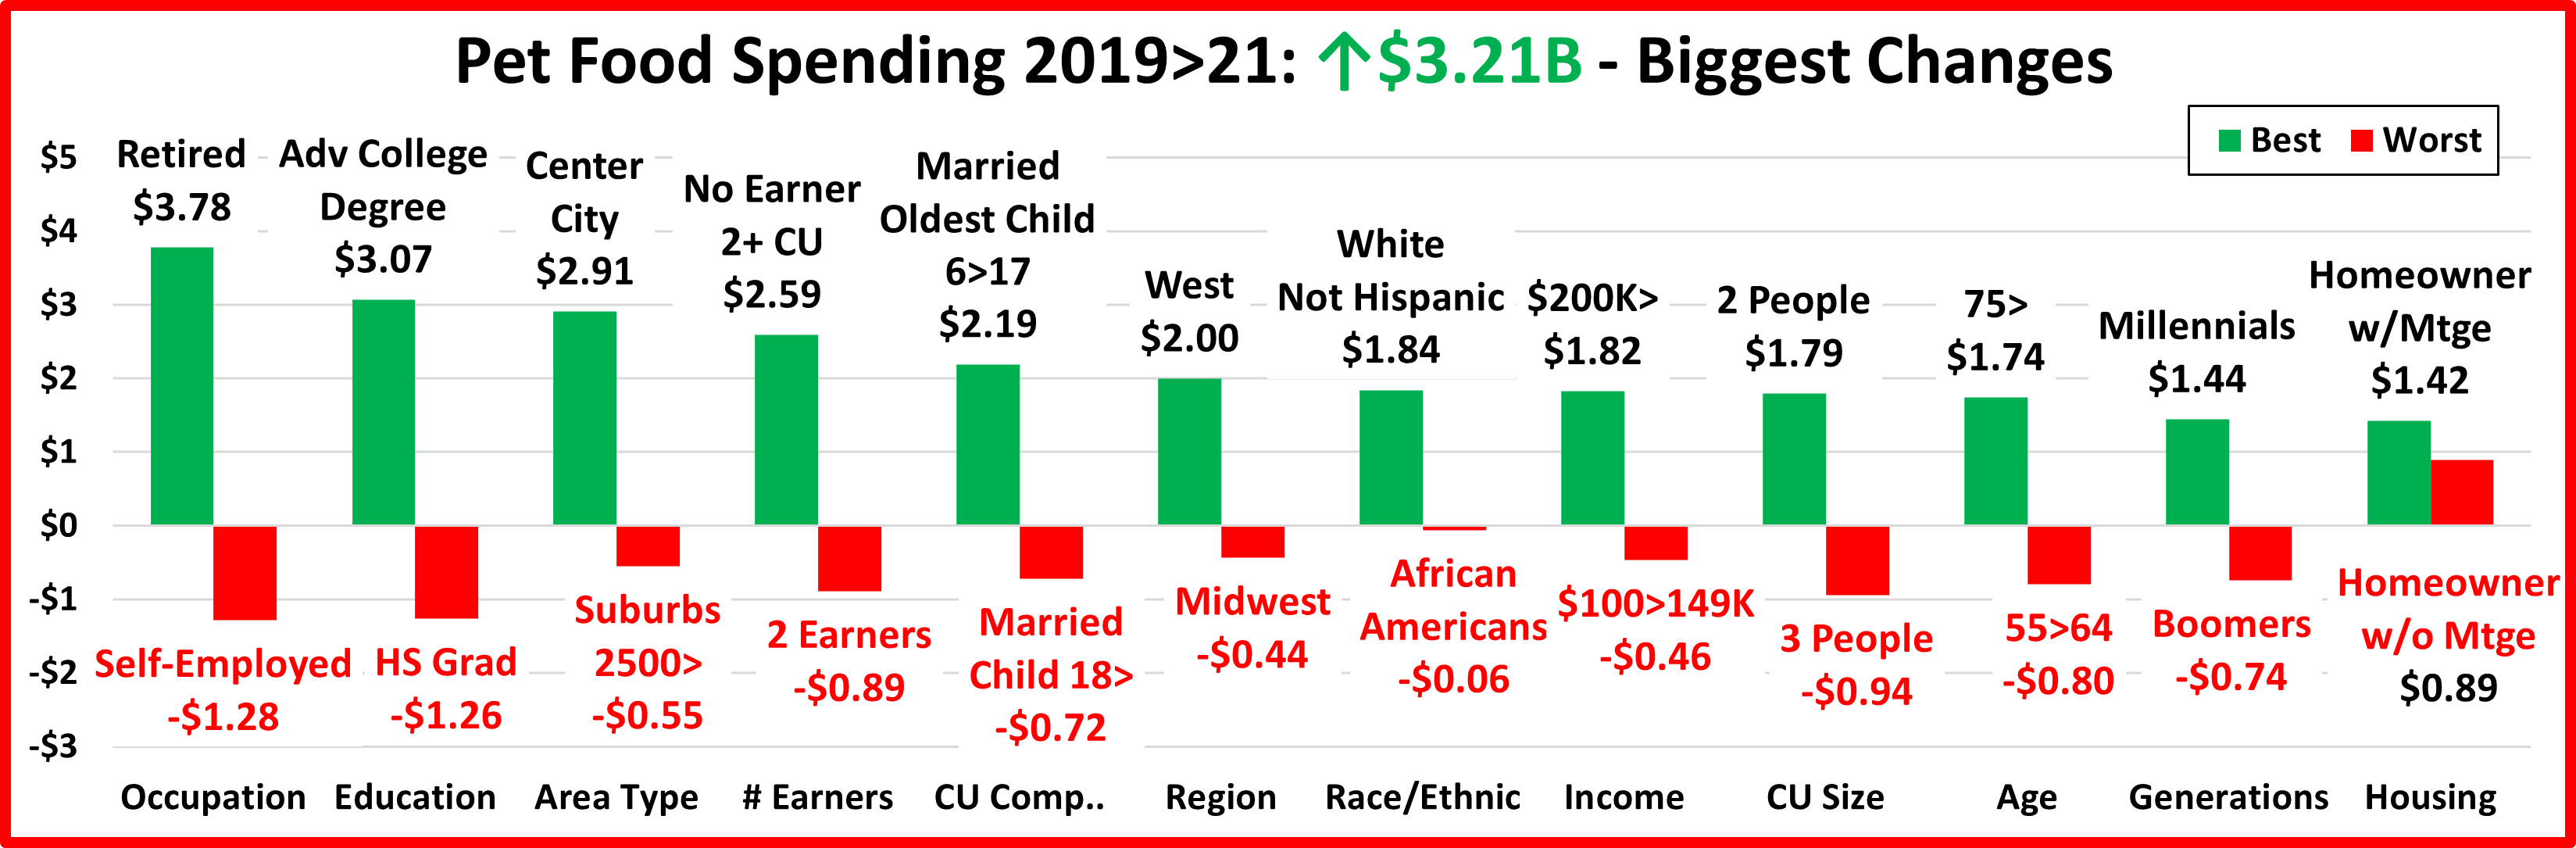
Next, let’s take a look at some other key demographic “movers” in 2021 Pet Supplies Spending. The segments that are outlined in black “flipped” from 1st to last or vice versa from 2020. The red outline stayed the same.
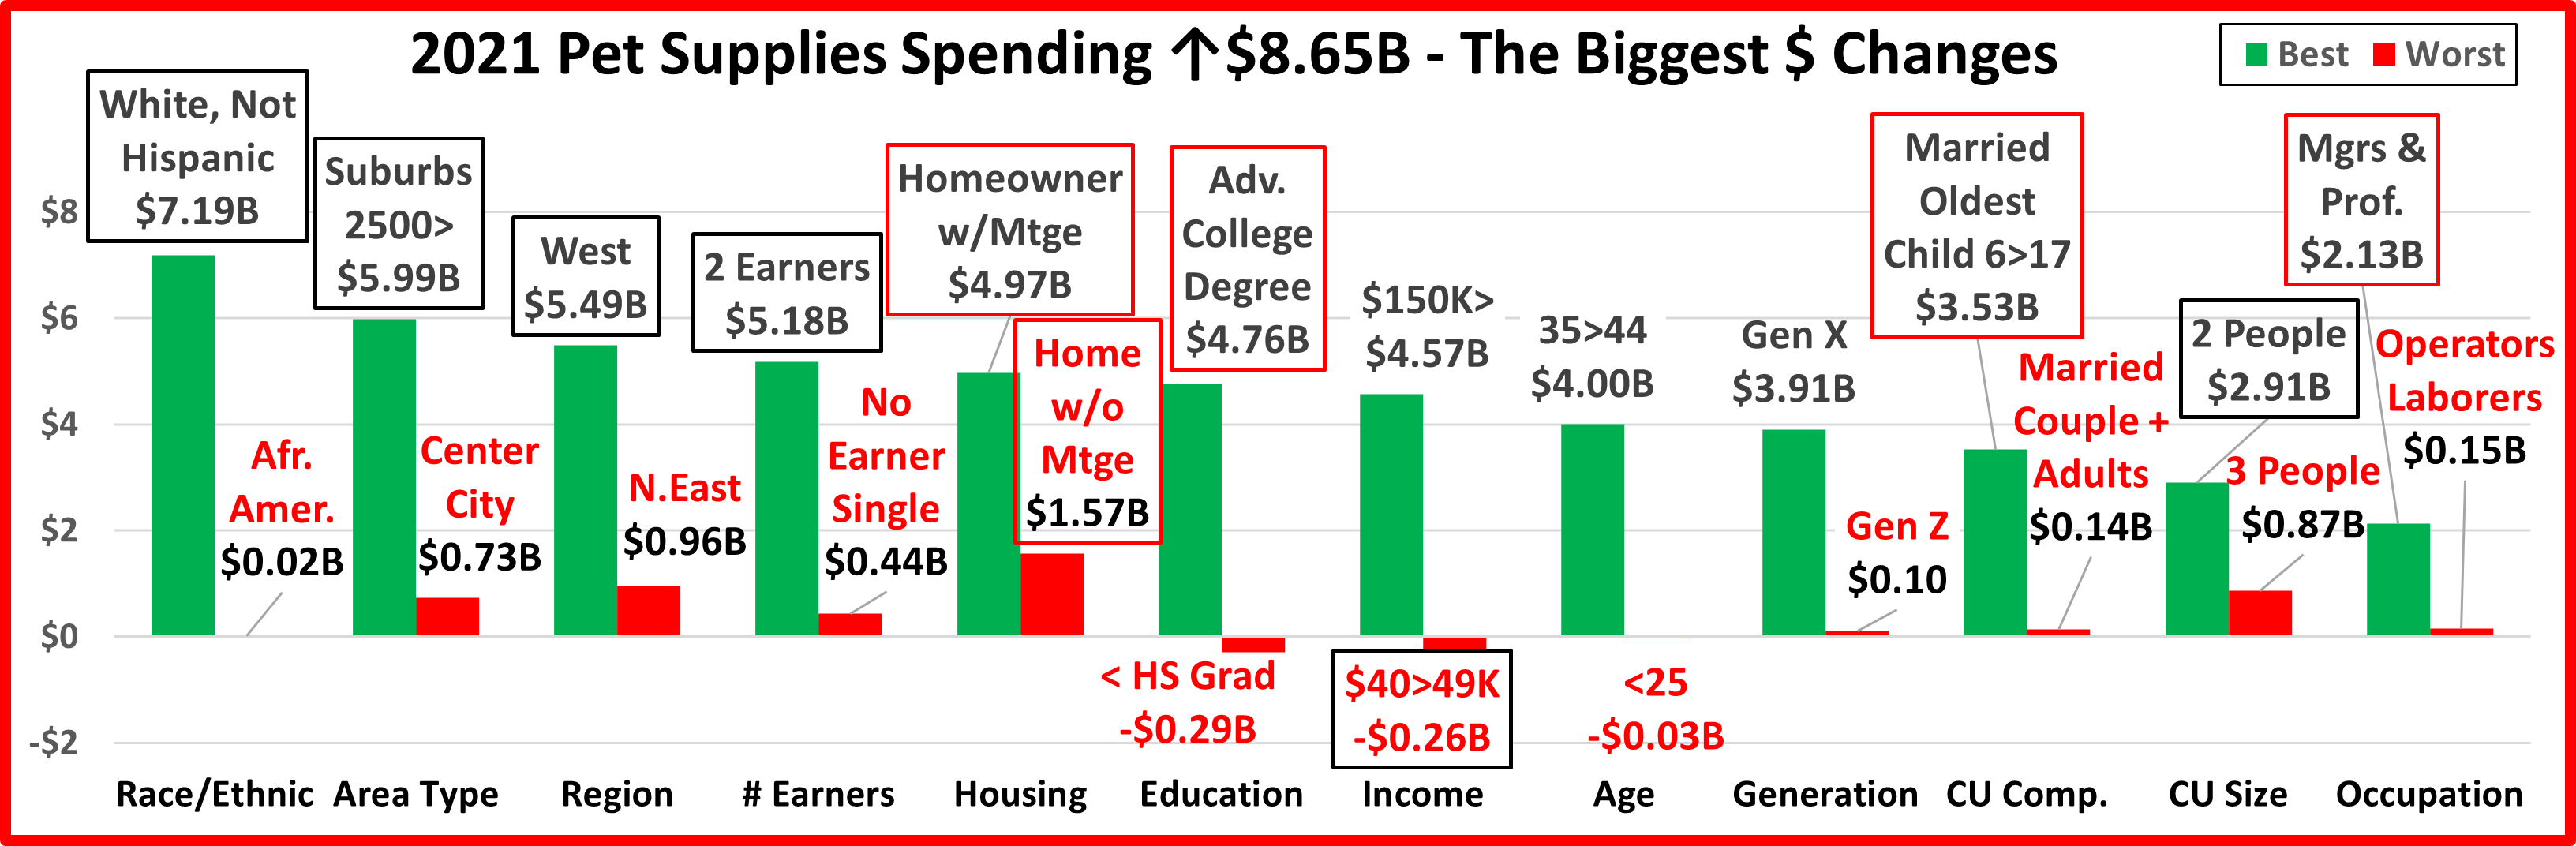
In 2019, in 9 of 12 demographic categories all segments spent less on Supplies. In 2021, in 9 categories all segments spent more. Also in 2019, 97% of 96 demographic segments spent less. In 2021, 97% spent more. Quite a turnaround.
Most of the winners and many losers are in their “usual” spot. Quite frankly, there are no surprises. There were 6 flips. 5 were from last to 1st. 5 Segments held their position from 2020. 4 of them were winners. This chart clearly shows that 2021 was an incredibly positive year for Pet Supplies spending. Your Race or ethnicity, where you lived, how you lived, the makeup and size of your household, your occupation or whether you even had a job didn’t matter. All of the segments in these demographic groups had 1 shared behavior. They spent more on Supplies for their Pet Children.
The $8.65B increase in Supplies $ was the biggest in history, beating the $3.1B lift in 2008 but should it have been expected? Supplies is a discretionary segment, so it is more susceptible to market factors, especially inflation changes, than the more needed segments. Prices deflated from 2016 to 2018, resulting in a $5B increase. Then came Tarifflation and the Pandemic and Spending fell -$4.6B. What if these 2 outside events had never happened? Where would we be in Supplies Spending? The annual growth rate for Supplies from 2015 to 2018 was +9.9%. From 2018 to 2021 it was +6.6%. A 10% growth rate would be difficult to maintain so it is not surprising that despite the big lift, the Supplies growth rate has fallen. We shouldn’t be surprised by the massive spending lift. Supplies are discretionary, primarily in purchase frequency. Most are still needed. In 2021, Pet Parents just bought the Supplies that they have needed for the past 2 years. The current big, unanswered question is how will the high inflation rates in 2022 affect Supplies spending?