Petflation Update: 2015 – 2nd Quarter – Bad Start…Strong Finish!
We last looked at “Petflation” in April. That month produced another drop in Food & Supplies pricing which resulted in the second monthly decrease in the Total Pet Industry Prices since December. In fact, for 3 of the first 4 months of 2015 the Total Pet CPI was below December 2014.
Then came May and June, which brought CPI increases in all segments. The Total Pet CPI went positive and stayed there. We also found a “hidden” pleasant surprise from the Supply Segment.
But first, let’s take a look at the specifics of what has happened since December.
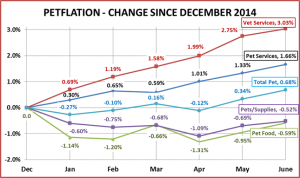
SPECIFICS ON CPI CHANGES
Veterinary Services
- April – Up ↑0.40%; May – Up ↑0.74%; June – Up ↑ 0.27%
- Year To Date: Up ↑3.03%
NonVet Services
- April – Up ↑0.42%; May – Up ↑0.32%; June – Up ↑ 0.33%
- Year To Date: Up ↑1.66%
Pet Food
- April – Down ↓-0.65%; May – Up↑0.37%; June- Up↑0.36%
- Year To Date: Down ↓-0.59%
Pets & Pet Supplies
- April- Down ↓-0.42%; May – Up ↑0.40%; June- Up ↑0.17%
- Year To Date: Down ↓-0.52%
Total Pet
- April- Down↓-0.27%; May- Up ↑0.45%; June- Up 0.34%
- Year To Date: Up ↑0.68%
OBSERVATIONS
- 3 of the first six months in 2015 produced drops in Food and Supplies prices.
- The price changes in Food and Supplies have a similar pattern. However, Food is showing more volatility than Supplies
- Average Supplies Prices are actually 4.3% higher than the same period in 2014.
- Veterinary prices are increasing at a high rate.
- The NonVet Service segment continues to increase in price but with some moderation.
- The Total Pet Market Prices wasn’t positive for 2 months in row until the “across the board” increases in all segments in May and June.
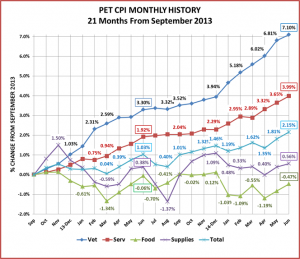
Next, let’s take a look at the monthly history over the last 21 months to get a better feel for the rollercoaster ride in Food and Supplies as well as the striking rise in Veterinary prices. June of 2015 and June of 2014 are outlined so you can see the journey over the last 12 months.
COMMENTS
The late Spring Months generally bring price increases in all segments. 2015 was no exception. Overall we are about 1.1% above the pricing of June 2014. Only Food is below the prices of a year ago. Since it is the largest segment, this is obviously a concern.
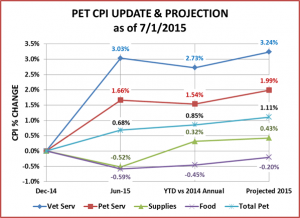
Now, let’s take a slightly different look at the data. The chart below includes a comparison of the 2015 YTD CPI to the 2014 annual CPI and also includes an initial projection of the annual CPI change for 2015. Take a look. You will find a surprise!
COMMENTS – BY INDUSTRY SEGMENT
Pets and Pet Supplies – December was the “high point” of 2014 Supplies prices. This is very unusual considering the pattern of recent years. The result is that although Supply Prices are down from December, the first six months are actually above the same period a year ago. Of course, they are still 4.2% below what they were in June 2009 – 6 years ago.
Here’s the big news! For the first time since I began tracking “Petflation” a year ago, Pet Supplies are projecting a CPI increase for the year…UP ↑0.43%. This may not seem like much. However, except for a miniscule increase of 0.05% in 2011, Supplies prices have been deflating consistently since 2009. The deflation came as a result of the commoditization of more and more product categories and put ever increasing pressure on manufacturers and retailers.
Believe me, this increase is not a “done deal”. Price drops traditionally occur in this segment in the July to September quarter, as well as in December. Last year saw a precipitous drop in July and August (1.75%) but an unusual increase in December. It would take a combined drop of over 2% in these months to overcome expected increases in the Fall months …and deflate prices in 2015. We’ll just have to wait and see.
NonVet Services – The price increases in this segment have been moderating – in the range of 2-2.5% annually. Recently we have started to see slowed growth in purchases. The sales growth in this segment is coming from households with income over $120K. Price increases should slow in the second half producing an annual CPI increase of 1.99%
Veterinary Services – The Veterinary Petflation rate of over 3% is exceptionally high compared to the other segments. However, it has actually moderated in recent years. From 1999 to 2009 the average annual Veterinary price increase was 6.0%. The cumulative effect of these increases in conjunction with the recession was that 2011 and 2012 produced actual decreases in the amount of Veterinary Services sold and the annual adjusted growth rate since 2010 has slowed to 0.9%. Like the Service Segment, the growth is limited to high income households over $120K. Based upon recent years, prices should almost flatten out for the balance of 2015 producing an annual CPI increase of approximately 3.24%
Pet Food – This largest segment has become the biggest concern. Prices rose in December of 2014 but then came the huge price drop in January – the largest in 17 years. However, it goes beyond that. Retail pet food prices have actually been flat to trending down since March of 2013. In 2014 the annual Food CPI decreased 0.3% from 2013. The only other annual decrease in history occurred in 2010 as a result of the recession.
As of June, the Food segment has regained about ½ of the CPI that it lost in the first 4 months. However, it is still projected to be down ↓-0.2% for the year. Remember, the CPI numbers from the U.S. Government include both food and treats so deflation is a bit more complex than if it were food alone.
Last year there was a big drop in July while all the other second half months were up or stable in price. December is also a big “if” this year. Last year’s December increase was unusual. We really do have to “wait and see” until yearend on this segment.
Total Pet Market – Services, especially Veterinary, increase their upward spiral. There may be some moderation – at least in NonVet Services. The Supply segment is showing some positive trends for the first time since 2009. That leaves only Food to “turn around”. The projected increase in the Total Pet CPI for 2015 is 1.11%.
If Food prices can get back to the positive side and Veterinary price increases drop below 3.0% the result would be a truly healthy Total Pet Industry with an average CPI increase in the range of 1.3 to 1.5%.
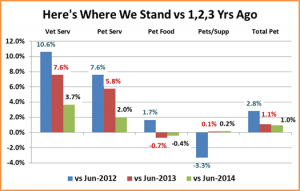
One Last Chart – that compares our June numbers to recent history:
2013 and 2014 were a tough years from a pricing perspective. 2015 is shaping up to be a little better. There are some critical waypoints approaching. We’ll keep you up to date.


