U.S. PET FOOD SPENDING – $26.7B; MID-YEAR UPDATE…EXPANDED

The USBLS just released their Mid-Year Update of the Consumer Expenditure Survey covering the period 7/1/2014 to 6/30/2015. The following charts and observations on Pet Food Spending were prepared from calculations based upon data from that report and earlier ones.

The most recent report shows Pet Food Annual spending at $26.68 B. (Food & Treats). The first chart will help put that into perspective with recent history.

PetFood1

This chart, with its rolling 12 month totals, gives a good overview of the recent trend in Pet Food Spending. However, for the best comparison, we should look at like time frames:

  • 2014 vs 2013: Sales up $1.1B (+4.8%)
    • By Half Year vs previous year: Jan>Jun 14 down $-.09B; July>Dec 14 up $1.19B
  • Mid Yr 2015 vs Mid Yr 2014: Sales up $3.8B (+16.6%)
    • H/H’s increased 1.4M (1.1%), but Pet Food Spending per H/H increased 15.4%…Still a big number!
    • By Half Year vs previous year: July>Dec 14 up $1.19B; Jan>Jun 15 up $2.61B
  • There was a period of minor price deflation beginning in December 2013 and continuing through May of 2014 which could be a factor in the 2014 first half drop of -$0.09B.
  • Prices rose slightly in the second half of 2014 and were stable in early 2015. This contributed to the second half turnaround in 2014 (+$1.2B) and the outstanding growth in the first half of 2015.(+$2.6B)
  • Question: Prices had a record plunge in July ’15. What will be the impact on $? We’ll know in September.

Let’s take a closer look at the latest numbers. Here’s what they look like by age group:

PetFood2

Age Group Observations

  • The growth is being driven by the old and young…especially 55>64 and 25>34. However there is significant growth in the <35 group (Millennials) and the 55>74 group (Mostly Boomers). One big factor in the small decrease in the 45>54 age group is that there are 267,000 fewer households.
  • There are 600K more >75 H/H’s. This may indicate that 75+ is the threshold for declining pet ownership.

Does money matter? Here’s a look at Pet Food Spending by Major Income Groups:

PetFood3

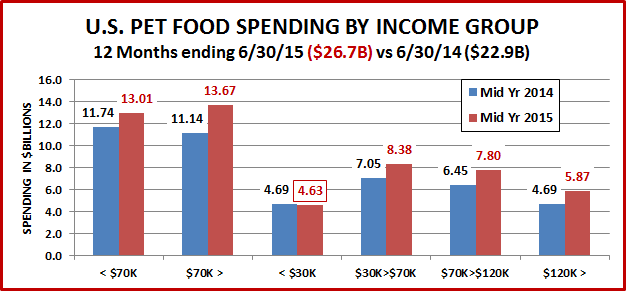
Income Group Observations

  • When you look at the under/over $70K groups, there has been a turnaround. The over $70K group now accounts for more than 50% of Pet Food spending. They are only 34.8% of U.S. Households.
  • There was strong growth in all the over $30K groups – ranging from 19 to 25%.
  • The under $3OK group is showing the only decrease in spending and it is only -$60M (-1.2%)
  • I quickly looked at other demographic groups to search for more insight into the under $30K decline:
    • Over 75 yrs of age – Down 41.6%
    • African Americans – Down 18.8% (Note: All other Racial/Ethnic groups had increased Pet Food spending except for Asian Americans, but they have a high H/H income)
    • Single Parents, Retirees, the Under 25 age group and many other lower income demographics were all showing increased Pet Food Spending, which undoubtedly helped to mitigate the overall drop in spending by the H/H’s with less than $30K in gross income.
  • It is not a good idea to rush to judgment without a more in depth review, but the question of low or declining pet ownership among the elderly and African Americans has come up numerous times before and merits a closer look.

Final Comment

This report is quite frankly great news for the industry. If you have a Pet, you invariably buy Pet Food. Increased Pet Food spending may reflect the movement to more premium foods but it also is an excellent indicator that the number of U.S. pet households is strong and growing. In an earlier post on Pet Products we noted that our spending on Pet Food & Supplies showed a 50 year commitment to our pets – from age 25 to 75. With this report, we saw a 30.6% increase in Pet Food Spending from the Under 25 age group. Admittedly, their spending numbers are still small. However, they are moving up – quickly. I’m sure that you’ll all join me in welcoming these young Millennials aboard the “Pet Parent Express”. We know that they will enjoy it and it’s a ride that lasts a lifetime!

U.S. SPENDING DEMOGRAPHICS for PET PRODUCTS: Food & Supplies…Winners, Losers

There is no getting around it. Pets are big part of our lives and our spending in America. However, there are distinct differences in the demographics of spending between the industry segments. The Prices in the Service Segments, especially Veterinary have been strongly inflating. Sharply higher prices affect the spending of a wider range of groups. Veterinary Spending was up $3B from 2013 despite a $1B drop in spending from consumers making $50K or less. Both the Food and Supply segments have been deflating in recent years so a lower H/H income is less of a factor. Also Pet Products (Food & Supplies) are a “must spend”. If you have a pet, you spend money on Pet Products . For this report we’ll take the services out of the mix and just look at Pet Products.

First, let’s “bundle” segments together to reach a dominant market share of Pet Products spending (80%). Like Total Pet Spending, Homeowners, Metro Area Dwellers, H/H’s with 2 or more people, White Not Hispanic and H/H’s with income over $30K are all groups which exceed 80% of Pet Products spending. Let’s dig a little deeper.

“Which of the 80+ individual segments are performing best in Pet Products?” The chart below identifies the best and worst performing segments in key demographic categories. The performance of each segment was determined by comparing the share of total pet spending to the share of households. Ex: If a segment accounts for 10% of households but generates 15% of Pet Spending the score is 15/10=1.5 = 150%…a great performer. However, if the situation was reversed, 10/15=.67 = 67%…not so good.

PetProdWinners-Losers-1

Married Couples with children, Homeowners vs renters, Rural vs Center City, Larger family H/H’s, White Not Hispanic, the 45-54 yrs age group… Some of the best and worst performers are exactly what one would expect.

  • African Americans are the lowest of the under-performing groups. The most recent American Housing Survey indicated that Pet Ownership by African Americans H/H’s was about 50% of the national average!
  • 2 of the fastest growing occupations in the U.S. are Service Workers (+1M) and Self-employed (+300K). Both had increases in Pet Products Spending per H/H but the Service Workers spending increase did not keep up with the 7% increase in the number of H/H’s.
  • Higher Income and higher education both are harbingers of increased pet product spending. However, pet ownership crosses all income and education levels. The lowest performers are still relatively high.
  • The Under 25 age group…Getting people started as “pet parents” must be an industry priority.

We have identified the best/worst performing segments. Which ones are “on the move”- the segments within each category with the biggest $ gain or loss (or smallest gain) in Pet Products Spending from 2013-14.

PetProdWinnersLosers-2

POINT #1 –When we looked at Total Pet Winners & Losers, 8 of the 10 categories had negative segments. For Pet Products, only 4 of 10 categories have any negative segments…at all! This is great news! Let’s take a look!

Income – Although higher incomes fueled the increase, every major income group spent more on Pet Products.

Occupation – The Self-employed group grew by 339K in numbers and their Pet Product Spending per H/H went up 26%. The Tech, Sales, Clerical group numbers fell by 339K and their Pet Product Spending per H/H dropped by 17%. They were the only occupational group with a drop in Pet Products Spending per H/H.

Race/Ethnic – 70% of H/H’s (White) account for 87% of Pet Products Spending. African Americans were the only racial/ethnic group with a decrease in Pet Products Spending…despite a 535K increase in H/H’s.

Highest Education in H/H – All education groups had an increase in spending. The group with less than a college degree is leading the way in the increase…a nice surprise.

H/H Size – It just takes 3 or maybe 1. Even singles had a significant increase in their spending. Two person H/H’s showed the only decrease. As you will see in the next category, these twosomes were not married couples.

H/H Composition – Married Couples with children drove the increase. No groups had a negative number. The “Married couple only” group was flat in spending. Even single parents showed an increase.

Region – Spending was up in all Regions. However, the Midwest was up $2.1B and the West…only $0.2B.

Area Type – Consumers in areas with under 2500 population, both inside and outside of Metro areas, are showing the most growth. Suburbs, the biggest spending segment is showing the slowest growth. In fact, spending per H/H is actually down slightly.

Housing Tenure – Homeowners are at the top with +$2.0B, but even Renters had a $1B increase (+16%).

Age – Good news. The 25>34 age group is showing the biggest growth. Bad news. The richest, highest spending segment, 45>54 is down. Much of this comes from a drop in numbers but their spending per H/H is also down

Major Issues: 1.The ongoing concern of more racial/ethnic diversity in Pet Ownership. 2. Getting the under 25 age group started. 3. Two big spending groups are slipping – the 45>54 age group and consumers residing in the suburbs. Both are spending less per H/H. The ongoing deflation in Pet Products could be a factor. Innovative, new products is certainly one way to motivate these firmly established “pet parents” to spend more.