Retail Channel Monthly $ Update – January Final & February Advance

Time for our monthly update on U.S. retail sales by channel. The current COVID-19 crisis has caused turmoil in the Retail Marketplace. Consumer spending behavior has changed and continues to evolve. In this report we will track the changes and migration between channels. We will do that with data from two reports provided by the U.S. Census Bureau.

The Reports are the Monthly Retail Sales Report and the Advance Retail Sales Report. Both are derived from sales data gathered from retailers across the U.S. and are published monthly at the same time. The Advance Report has a smaller sample size so it can be published quickly – approximately 2 weeks after month end. The Monthly Final Report includes data from all respondents, so it takes longer to compile the data – about 6 weeks. Although the sample size for the Advance report is smaller, the results over the years have proven it to be statistically accurate with the final monthly reports. The biggest difference is that the full sample in the Final report allows us to “drill” a little deeper into the retail channels.

We will look at the latest release of both reports. We will begin with the Final Retail Report from January and then move to the Advance Retail Report for February. Remember, January and February 2020 were pre-pandemic, but we will continue our detailed comparison of 2021 to both 2020 and 2019 to track the ongoing evolution of the retail market.

Both reports include the following:

  • Total Retail, Restaurants, Auto, Gas Stations and Relevant Retail (removing Restaurants, Auto and Gas)
  • Individual Channel Data – This will be more detailed in the “Final” reports and we fill focus on Pet Relevant Channels

The information will be presented in detailed charts to facilitate visual comparison between groups/channels of:

  • Current Month change – % & $ vs previous month
  • Current Month change – % & $ vs same month in 2020 and 2019
  • Current YTD change – % & $ vs 2020 and 2019
  • Monthly and Year To Date $ will also be shown for each group/channel

First, the January Final. U.S. Retail hit bottom in April then began to recover, hitting record $ in December. January $ fell but still set a monthly record. Here are the major retail groups. (Data in all graphs is Actual, Not Seasonally Adjusted)

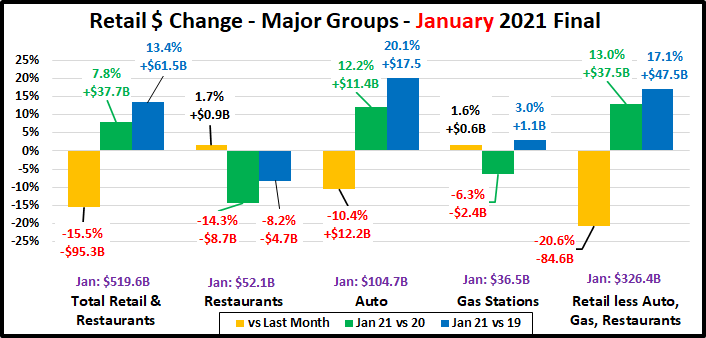
The final total is $9.8B more than the Advance report projected a month ago. All Groups were up but most of the positive change came from Relevant Retail: +$6.2B; Restaurants: +$0.9B; Auto: +$1.8B; Gas Stations: +$1.0B. Only Gas Stations and Restaurants were up vs December, but Total Retail still set a January record. Total $ales finished strong in December and had a good start in 2021 thanks to another strong month from Relevant Retail and Auto. Restaurants and Gas Stations continue to struggle. Relevant Retail is still the driving force in the recovery.

Now, let’s see how some Key Pet Relevant channels were doing in January.

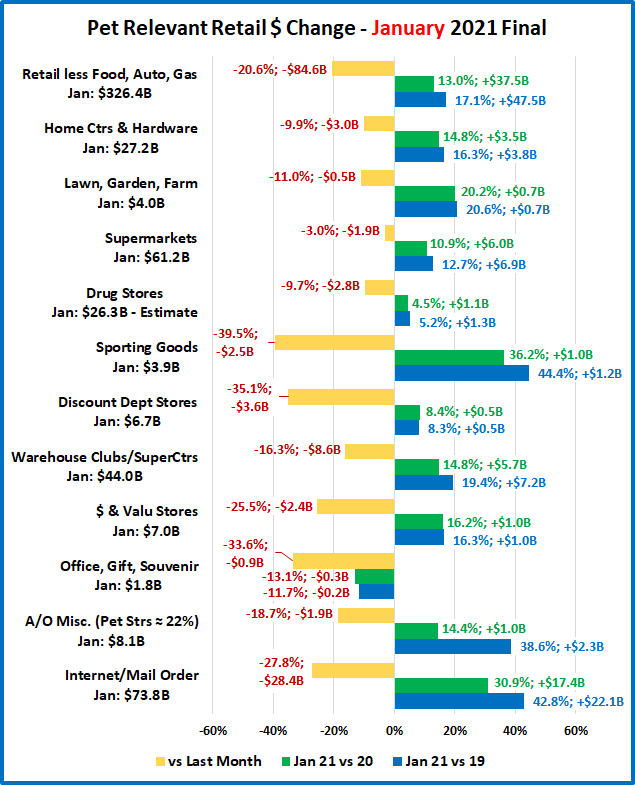
  • Overall– All 11 channels were down vs December, but 10 of 11 were up both vs 2020 and 2019. A great start.
  • Building Material Stores – Their lift continued into the new year. We should note that the bulk of the ongoing surge came as a result of pandemic spending patterns developed in 2020. They’re still showing double digit % increases. Sporting Goods stores are not in this group, but they have a similar spending pattern. Sales took off in May, hitting a record peak in December. The lift continued in 2021 – up 36.2% over 2019 and 44.4% over 2020.
  • Food & Drug – Supermarkets finished 2020 up +$77.7B. Sales dipped slightly in January but are still +10.9% vs 2020. Drug Stores ended up +$17B (+5.7%) for 2020. Their $ also fell in January but are still +4.5% vs 2020.
  • General Merchandise Stores – $ in all channels fell a lot from December. However, Clubs/SuperCtrs, $ Stores and even Discount Dept. Stores had a strong January. Last year they were up a combined $1.5B from 2019. This year they are up $7.2B from 2020. Value has become even more important due to the pandemic.
  • Office, Gift & Souvenir Stores– Sales plummeted in January. Their struggles continue. Recovery is a long way off.
  • Internet/Mail Order – The pandemic has accelerated this channel’s growth. In January they were up $22.1B (+42.8%) vs 2019. 78.7% of that growth (+$17.4B) came from the pandemic lift spending pattern set in 2020.
  • A/O Miscellaneous – This is a group of small to midsized specialty retailers – chains and independents. It includes Florists, Art Stores and Pet Stores (22 to 24% of total $). Pet Stores were usually essential, but most stores were not. Stores began reopening in May and the $ grew. Their 2020 total sales were up +11.6%. January sales are +$1.0B (+14.4%) vs 2020. However, that is less than last year when they were +$1.2B (+21%) vs 2019.

The Relevant Retail Segment began recovery in May and reached a record level in December. $ plummeted in January but still set a monthly record. The key drivers in the continued strong growth of this group were and are the Internet, Supermarkets, SuperCtrs/Clubs/$ Stores and Hdwe/Farm. Now, here are the Advance numbers for February.

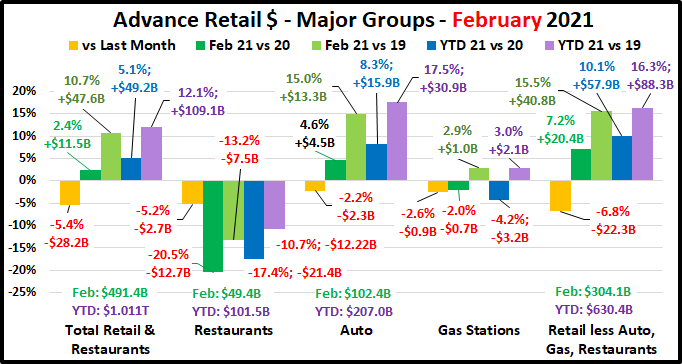
2020 will always be a memorable year for both its traumas and triumphs. In April & May we experienced the 2 biggest retail spending drops in history. Then sales began to recover and in October YTD Total Retail turned positive for the 1st time since February. In December, Total Retail broke the $600B barrier – a historic first. Monthly sales records continued in January and now February. The primary drivers of this are Relevant Retail and Auto. Restaurants are the only big group still suffering across the board. As we progressed through 2020 and now into 2021, we have seen real evidence of the strength and resiliency of the U.S. Retail Market.

Total Retail – Spending fell in February but still was a record high for the month. $ were up 2.4% vs 2020 but 10.7% vs 2019. Most of the lift came last year. YTD $ are also showing strength but this was mainly due to a spectacular January.

Restaurants – This is the only group in which spending was down in all measurements. Last February sales were up vs January and February 2019. The Pandemic changed that. YTD sales are also down -10.7% from 2019. However, this was primarily due to the -$12.7B drop in February $ from 2020. Recovery is still a long way off.

Automobile & Gas Stations – Staying home causes your car to be less of a focus in your life. Auto Dealers combated this attitude with fantastic deals and a lot of advertising. It worked. They finished 2020 up 1% vs 2019 and have returned to a strong positive pattern in 2021. Gas Station $ales are a mixed bag. They were still behind 2020 in February and YTD but ahead of 2019 sales in both measurements. It looks like they are beginning their comeback.

Relevant Retail – Less Auto, Gas and Restaurants – When you look at the individual channels in this group, you see a variety of results due to many factors – non-essential closures, binge buying, online shopping and a consumer focus on “home”. However, overall, April 2020 was the only month in which spending was down vs 2019. Monthly $ales exceeded $400B for the first time ever in December ($411B). They finished 2020 up $251B, +6.8%. Sales fell in January but have continued to set monthly records through February. They are up $20.4B, +7.2% vs February 2020 and  +$57.9B, +10.1% YTD. Relevant Retail has now posted positive numbers versus last year and YTD for 10 consecutive months and their average YTD growth rate since 2019 now stands at +7.8%. The primary drivers continue to be Nonstore, Grocery, SuperCenters/Clubs/$ Stores plus a never ending “spring lift” from Hardware/Farm and Sporting Goods.

Now let’s look at what is happening in the individual retail channels. Relevant retail was down vs January but continues to set monthly sales records. Let’s see where the $ came from. These groups are less defined than in the Final Monthly reports and we will look across the whole market, not just pet relevant outlets. We will continue to track 2021 monthly and YTD sales vs both 2020 and 2019.

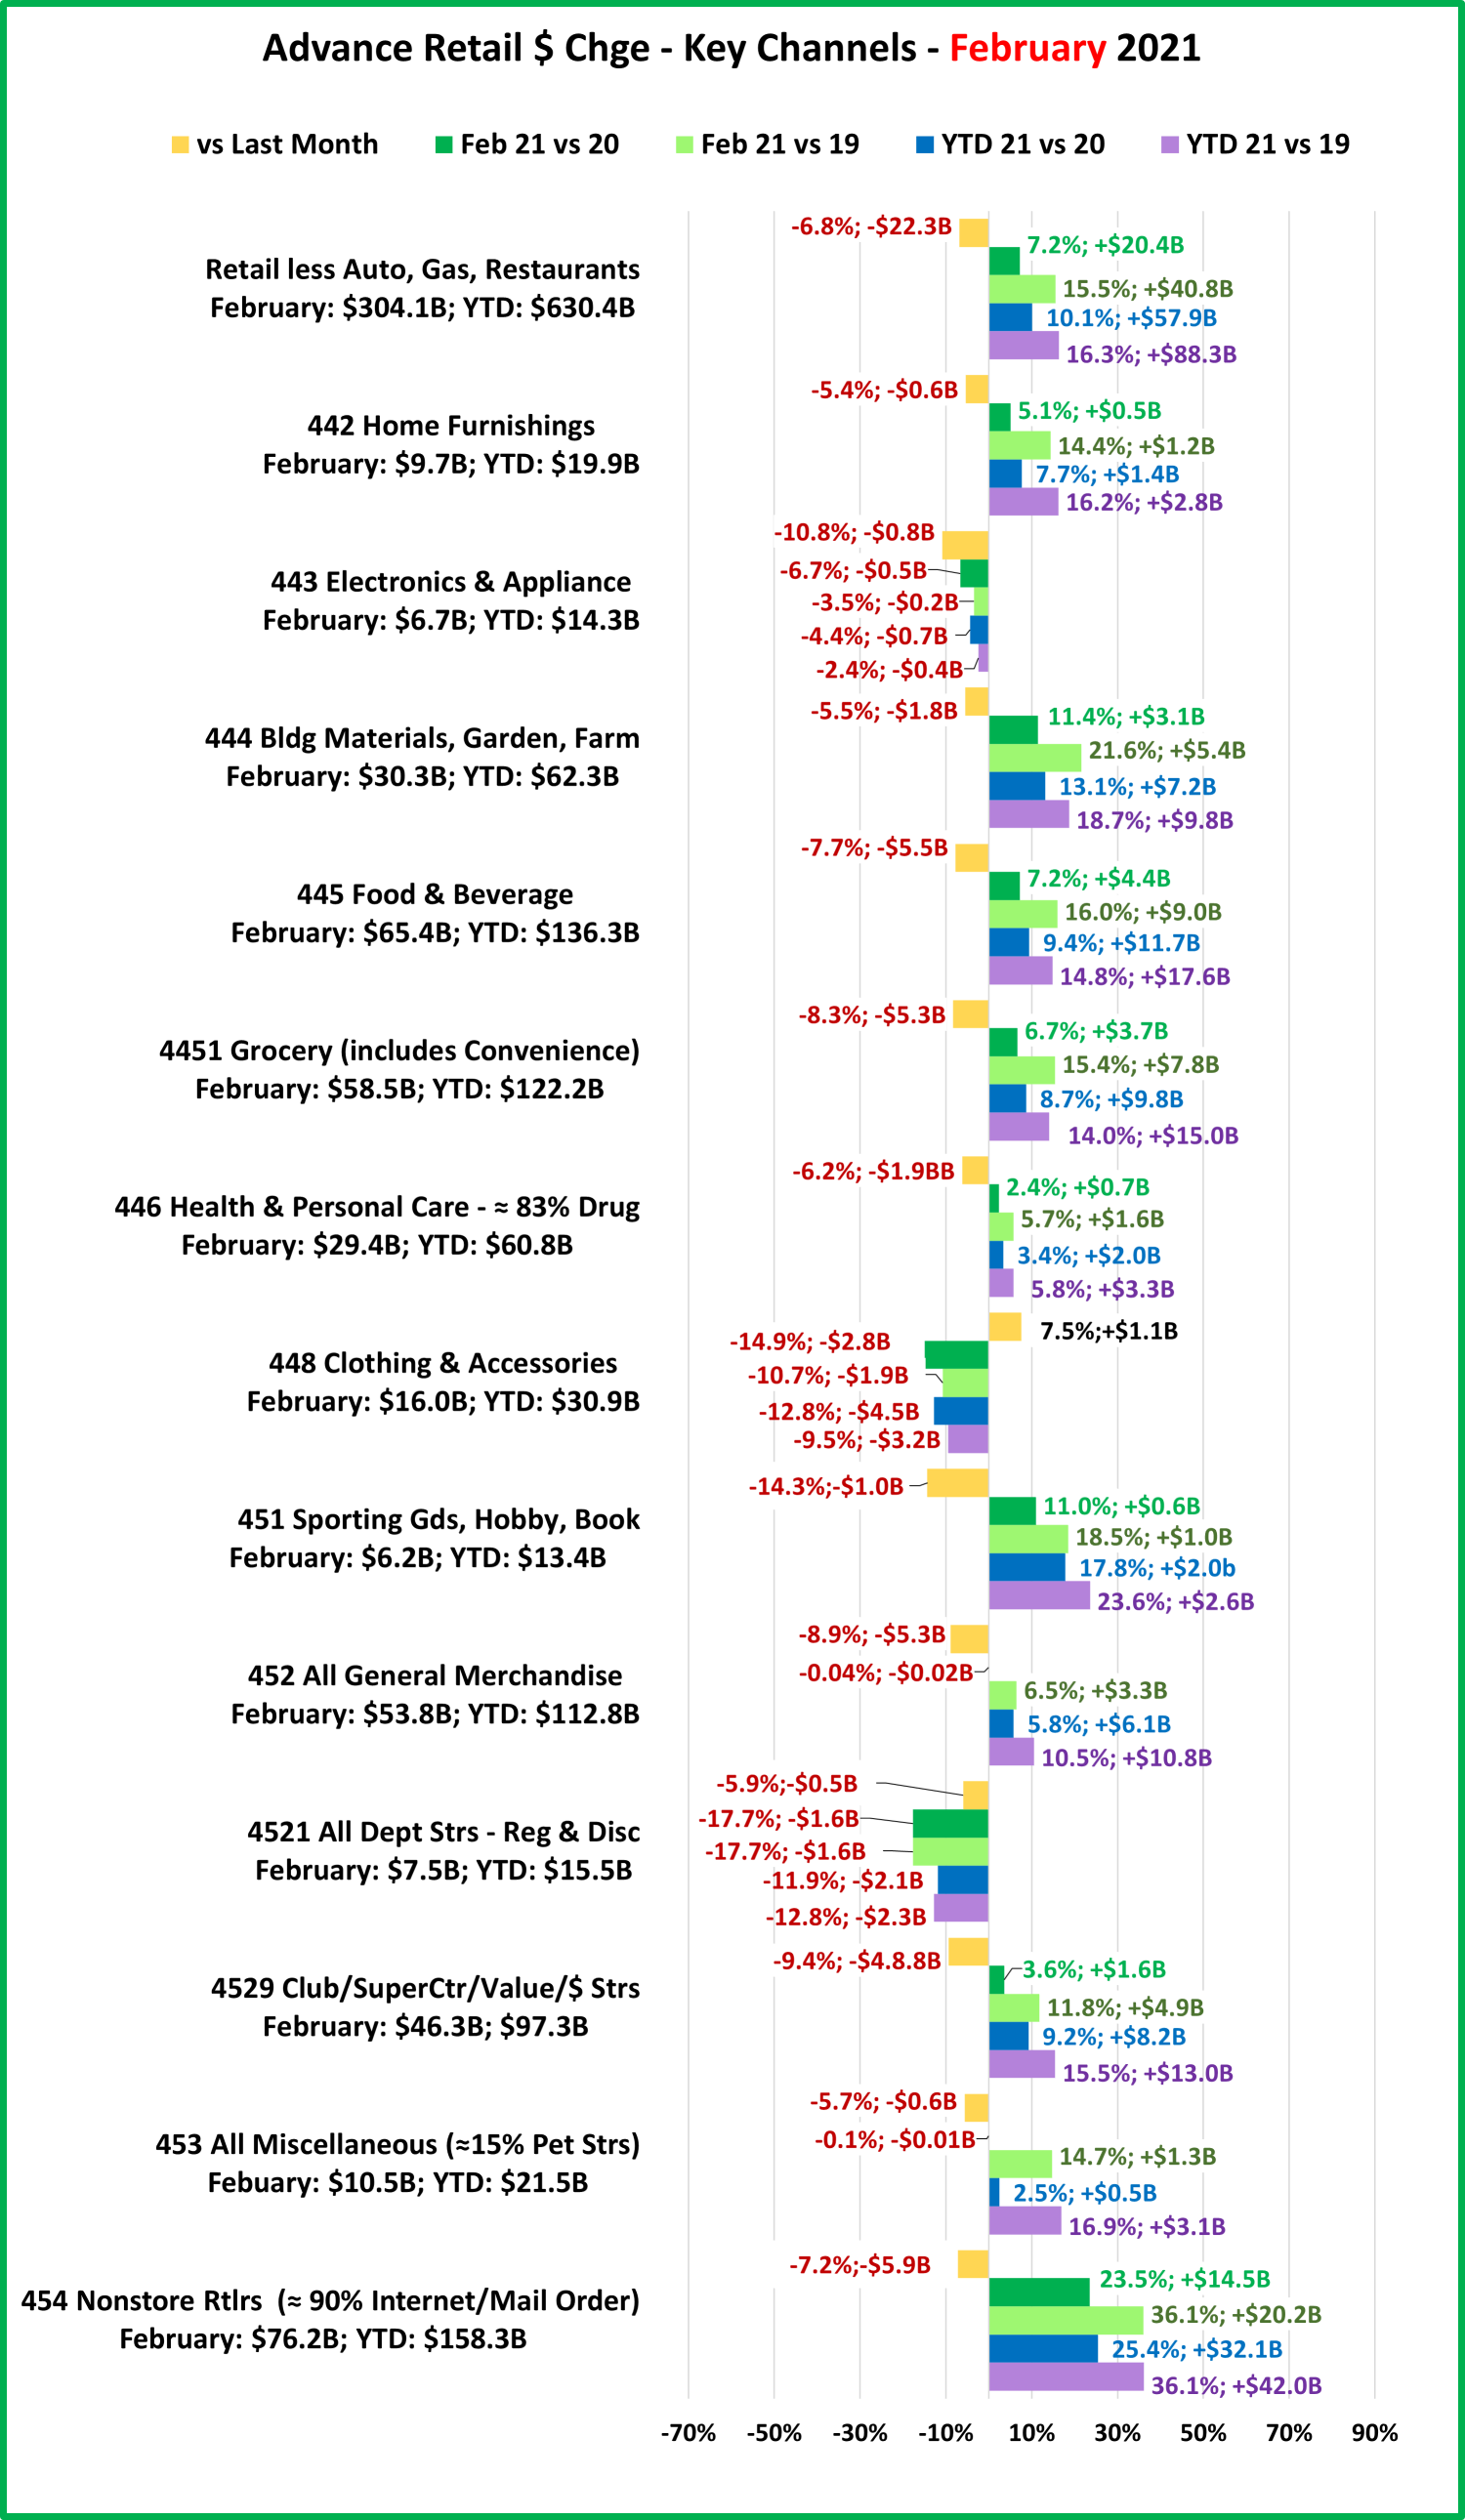
Sales in 12 of 13 channels were down vs January. 8 channels beat February 2020 $ and 10 beat February 2019 $. In YTD $ales, 10 channels beat both 2020 and 2019.

After April’s widespread closures there was a retail surge in May, but things truly opened up in June/July. In Aug/Sept, sales slowed but growth began again in October and peaked with a record December. Relevant Retail finished  +$252.9B vs 2019 and has started 2021 strong, +10.1% YTD. Essential channels are responsible for the continued lift, primarily:

  • Nonstore Retailers – Online shopping continues to grow in households and $.
  • Food & Beverage, especially Grocery– Restaurant $ are still down so consumers continue to eat & drink at home.
  • Bldg Materials/Garden/Farm– Their “Spring” lift continues unabated as consumers focus on their home.
  • SuperCtrs/Club/Value/$ Strs – In 2020 they kept the whole Gen Mdse channel positive. Their growth slowed in February but their continued success clearly shows that value is still a major consumer priority.

Regarding the Individual Large Channels

General Merchandise Stores – Sales dropped so much from January that they were down vs February 2020. This was due to the continued negative performance by Department Stores and slowed growth by Club/SuperCtr/$ stores, +3.6% in February, down from +9.6% in January.

Food and Beverage, plus Health & Personal Care Stores – In February, growth slowed to +6.7% in the Grocery segment, compared to +11.3% in January. Sales in the Health, Personal Care group finished 2020 at +1.7%. They started 2021 even better, +3.3% in January, but that slowed to +2.4% in February. Drug Store $ remains the key to health/personal care.

Clothing and Accessories; Electronic & Appliances; Home Furnishings – Home Furnishings began their recovery in January and are now positive in both monthly and YTD $ vs 2020 and 2019. Electronic & Appliance stores remain negative across the board, but the gap is narrowing. Clothing Stores continue to be hard hit by the pandemic, but they were the only channel to increase sales vs January. There is still hope.

Building Material, Farm & Garden & Hardware – Their Spring lift began on time in 2020 and it has essentially never stopped. They have greatly benefited from consumers turning their focus to their home needs. They finished 2020 +53B (+13.8%). In February they were up 11.1% vs 2020 and +13.1% YTD.

Sporting Goods, Hobby and Book Stores – Book and Hobby stores are open but make no mistake, Sporting Goods stores have driven the lift in this group. Consumers turned their attention to personal recreation and sales in Sporting Goods outlets took off. The group ended 2020 +5.5% vs 2019. Sales fell in February after a record January performance, but they were still +11.0% vs February 2020 and +17.8% YTD.

All Miscellaneous Stores – Pet Stores are in this group and deemed essential but most other stores are not, so closures hit this group particularly hard. Sales hit bottom at -$3.8B in April then began to rebound. They finished with a strong December and ended 2020 down $1.0B, -0.7%. January sales were +6.9% vs 2020 but February sales were actually down -0.01% vs 2020. Their $ are +2.5% YTD so they are recovering but it may not be a fast process.

NonStore Retailers – 90% of the volume of this group comes from Internet/Mail Order/TV businesses. The COVID-19 crisis accelerated the movement to online retail. In February 2020 NonStore $ were 8.6% YTD. In December monthly sales exceeded $100B for the 1st time. They ended 2020 at +21.9%, +$173.9B YTD. Their increase was 69% of the total $ increase for Relevant Retail Channels. Their 2020 performance far exceeded their 12.9% increase in 2019 and they started off 2021 even better. February is +23.5% vs 2020 and YTD $ are +25.4%. Remember, this is their slowest season.

Note: Almost without exception, online sales by brick ‘n mortar retailers are recorded along with their store sales in their regular channel. Whether they are up or down, their online sales are included in the totals.

Recap – 2020 was a year of ups and downs – April and May were the 2 biggest year over year monthly sales declines in history while December saw sales break $600B for the first time. Restaurants, Auto and Gas stations were impacted the most. Auto had recovered by yearend and started 2021 out strong. Gas Stations had a terrible 2020 but are now showing mixed results in 2021. Restaurants continue to show the most negative impact from the pandemic. The Relevant Retail segment has been the only ongoing positive, but for some segments in this group there is still a long way to go. Total Retail Sales ended the year +$37B (+0.6%) vs 2019. Through February Relevant Retail and Auto are both +10% vs 2020, which has pushed Total Retail to +5.1%. For Gas Stations and especially Restaurants the problems continue. As the battle to return to normal goes on, we will continue to provide regular updates. The March data should be especially interesting as we will compare 2021 to 2020 (Pandemic Impact Begins) and to 2019 (Old Normal).

Attending Global Pet Expo 2021? – The Show is “Virtual”, But You Still Need a Plan!

The first Global Pet Expo (APPMA) occurred 63 years ago with 17 exhibitors in 30 booths. The industry and the show have both come a long way since then.  Although the show is virtual this year due to the impact of the COVID-19 pandemic, there is still much for 2021 attendees to see and experience:

  • Over 200 separate exhibitors and the list is still growing – with companies from the U.S. and around the world – still a Global experience!
  • As always, the New Product Showcase will be a major attraction.
  • There will still be thousands of attendees with opportunities for virtual networking.
  • The opportunity to choose from 39 targeted educational seminars – 23 hours of classes.
  • Not 5 miles of aisles but get your fingers ready to do a lot of walking on your keyboard!

The show is open for 26 hours so let’s put this in “virtual” perspective and… “Do the Math!”

If you don’t attend any seminars, visit the New Product Showcase, stop to have a virtual chat with someone or to eat, drink or to go to the bathroom, you can spend about 6 minute and 55 seconds with each exhibitor. That’s a lot more than usual but now you will be competing for appointment times. You still definitely need a plan!

Global Pet Expo still has it all… and more. Attendees will find a broad selection of products while Exhibitors have the opportunity to reach a wide range of buyers across all retail channels.

First and foremost, Global is about Pet Products – Food, treats and a vast array of Supply categories. A regular flow of New Products is always critical to keep businesses and the whole industry strong and growing. Obviously, you must take the time to visit the New Product Showcase. You should also sign up for any relevant classes, network with other industry professionals and…”virtually” walk the whole show.  There are many more new products being “launched” in exhibitor showrooms as there are on display in the New Product Showcase. Plus, even with the lower exhibitor count over 22% of the exhibitors were not at GPE 2020. Global is about gathering information and making decisions to improve your business – whether they are made on the spot or put on your “must do” list.

Every business can improve in terms of products. If you are a retailer, what sections of your store are not doing as well as you hoped and need a “facelift” or conversely, what areas are growing and need products to fill additional space? Category managers for distributors and retail chains may only be interested in targeted visits to exhibitors relevant to their “categories”. Representatives may be looking for new manufacturers…in specific product categories. Manufacturers could be looking to find distributors to handle their products or just looking to “check out” the competition. In regard to products, there is always something to see…for everyone!

And Global is the place to see it. It’s all there! With so much to see and do, time is perhaps the most valuable commodity at the show. How do you make the most of your time on the show platform? Here’s an idea.

In 2014 I first designed a tool in Excel, the Super Search Exhibitor Visit Planner to make “working Global & SuperZoo easier and more productive for ALL attendees – retailers, distributors, reps, groomers, vets…even exhibitors. I have updated the data and produced a tool for every GPE and SuperZoo since then…including GPE 2021.

The “update” is not just exhibitor lists but also to the product category offerings for every exhibitor. I reviewed every available exhibitor profile, but I also visited hundreds of websites and conducted separate internet searches to “validate” the product offerings. It is not 100% accurate, but it is close.

What does the SuperSearch do?… It searches for and produces a list of Exhibitors by product categories.

  • From the simplest – “give me a list that I can look at on my phone or tablet.”
  • To the most complex…”can do a simultaneous search for multiple specific product categories, allowing you to personally narrow down the initial results and see the “final” targeted result.” The GPE Super Search Exhibitor Visit Planner does both…and more…and does it quickly! Take a look at the Quick Start Guide. You will see that it looks complex but is really quite simple.

GPE 2021 Super Search Exhibitor Visit Planner – Quick Start Guide

First: When you download the Excel file, Remember to Enable Editing & Macros!

The GPE Super Search Exhibitor visit planner is designed to make your time on the show platform more efficient and more productive. With the Super Search you can conduct up to 5 separate and distinct product category searches simultaneously with consolidated results produced in alphabetical order to facilitate your “journey”. There are detailed instructions for reference and to help you understand the nuances of the tool. However, it is really very simple so let’s get started. (Note: No Floor Sections or Booth #s in 2021) Here is the Dashboard where you set up your searches.

On the dashboard, the first things to note are the numerous category columns. There are no preassigned sections as yet in 2021 so these columns may be hidden to save some space but there are 11 different Exhibitor or Animal Types and 33 Dog and/or Cat Product categories. You can search exhibitors for any combination of these.

Let’s take a specific example running 3 simultaneous searches for several Dog/Cat categories:

  • Toys
  • Treats
  • Catnip & Litter (Must sell both)

Now referring to the Dashboard, let’s take it by the numbers:

  1. This column is where you activate each search. Type in a “Y” (Cells C3>C7 will auto-capitalize) This search “line” becomes active.(cell turns green) In our example we are running 3 searches, so we have 3 “Y”s.
  2. Now we enter a 1 in the correct column for each search line. Search Line 1: Toys; Search Line 2: Treats.
  3. In Search Line 3 we want exhibitors that sell both Catnip and Litter, so we put a 1 in both of these columns.
  4. Now we just “click” the Execute Search Button. The searches are done simultaneously, and the results combined into a single list in alphabetical order.
  5. There are no Booth #s in this “virtual” year so this button is not relevant.
  6. Your sort should appear in alphabetical order, but you can always click the Alpha Sort Button to be sure.
  7. To Clear all your search categories and start a new search, Click the Clear Criteria Button. Then click Execute (#4) again and you will be back to the full list.

Note: Any Search Line with a Y and no 1’s in any column will always deliver the entire list regardless of what is selected in other lines. Change the Y back to an N in unused search lines. Now a sample of the results:

Company A – Has Toys Only; Company B has Dog Treats Only; Company C is on the list for Treats and also has Catnip, but no Litter. This is not unusual as Catnip is often a Treat; Company D has Treats & Toys. Company E has both Catnip and Litter and in fact, actually has it all!

Note: The Super Search highlights your search categories, so you know “why you are there”. However, it also shows all categories that are available. Some might “pique” your interest while you are visiting the exhibitor showroom.

In 2021, since there are no booth #s you will review the exhibitors alphabetically. The Super Search also allows you to “cut down” the list during your review. (Pg 2; Point #11 – “U Pick ‘em” in Detailed Instructions) But First, I suggest that you “play” with the Super Search to get a “feel” for the tool, and then review the Detailed Instructions. With your “play” experience, the detailed instructions will become a “quick read” and a valuable reference. You will soon be “up to speed” on the full capabilities of Super Search. Good Luck and Good “Hunting” at GPE 2021!

Ready to Start Planning?

Use the links below to download the Super Search Tool (Be Sure to Enable Editing/Macros/Content if asked by your computer), the Quick Start Guide and the Detailed Instructions. Then GET STARTED!

NOW DOWNLOAD THE SEARCH TOOL

(For the Excel file to work on your computer, be sure to enable saving/macros/editing/content if asked.)


NOTE: Each Super Search has a date in the file name. The first file was dated 3/8. The latest file is dated 3/23. There were a lot of additions since 3/22 – mostly media, organizations and business services providers. They are highlighted in light gray. There were also 3 name changes, highlighted in orange. MORE CHANGES ON DAY 1 – Highlighted in yellow! 


GLOBAL PET EXPO 2021…Packed with Opportunities!

The premiere event of the U.S. pet industry gets under way on March 24th. This is the 63rd show (my 33rd) in a tradition that began in 1958. Both the show and the industry have grown spectacularly since then, until a Global Pandemic produced a true worldwide crisis. With Pet Parents often stuck at home, they have turned more of their attention to their Pet Children. During this time consumers have focused on essential spending. Since there is no doubt that Pets are an essential part of U.S. families, it is no surprise that the Pet Product segments of the industry have grown even stronger.

That brings us to trade shows, specifically GPE 2021. Until December, it was scheduled to be an in person event. However, it became obvious that this was not practical or even possible, so it was made virtual – Global Pet Expo Digital Access. Both the exhibitor count and the number of registered attendees are down significantly but continue to grow. As of February 26, there were 189 Exhibitors. Normally, there are 1000+. The number of registered attendees is also smaller. However, that will grow significantly. Remember, you don’t have to plan a trip, just show up online. A quick review of the buyers showed that companies responsible for selling 90+% of the Pet Products sold in the U.S. will be attending. That raises a question for the companies who have chosen not to exhibit. “Can you really afford to not exhibit at this show?” I guess that they’ll wait and see.

Before we start our preview of what you will see at GPE 2021, I would like to put some recent events into perspective. Normally, the health and progress of an industry are largely dependent upon the choices and decisions made by the participants. Since 2018, outside influences have had a major impact on the pet industry. It began with the FDA warning on grain free dog food. This was followed by the added tariffs which drove Supplies prices up. Finally, we are currently in the midst of a global pandemic which has radically affected the lives of both people and businesses. No one had control over these events. However, you have control of how you react to them. Businesses must be prepared to adapt to a changing environment or face extinction. That is the choice to be made.

Now let’s look at GPE 2021. I am not aware of special sections and there is no way to tell since there is no “floorplan”. However, we can note a big change in the number of International exhibitors. In a normal year there would be over 250, about 25%. In 2021 there are less than 25. As you recall, many Chinese exhibitors had to drop out of GPE 2020 due to travel restrictions. There are also less 1st time exhibitors. Usually, there are 300 who didn’t do the previous year’s show, about 30%. This year, less than 40 weren’t at GPE 2020. Although the event is virtual, it appears that COVID-19 had a big impact.

I will be publishing my Super Search exhibitor visit planner to help guide your time on the virtual show floor. I have researched the product category offerings of every exhibitor. Let’s take a look at the results from this year’s research.

First, we’ll Compare Exhibitor Types – By function: By Animal type (Data is based on the exhibitor list as of 2/26/21) Note: Distributors were removed from the animal type count to more accurately reflect product category coverage.

I included the actual booth count for 2021 but not the change in numbers from 2020. Because of the huge drop in the number of exhibitors, the change in share is a better way to compare the 2 years.

  • Dogs Still Rule …and their kingdom is growing. About 7 of every 8 exhibitors sell dog products.
  • Cats continue to gain shareIn 2021, Cat Products are offered by 62% of exhibitors. Up from 40% in 2014.
  • Fish/Aquatic – In 2020 this category was down 42% from 2017. It continues to fade.
  • Other Animals – Horses & Reptiles lost a little in share, but Birds and Small Animals held their ground.
  • Business Services – Besides wellness products, this has been the other big trend in the Industry. Private label/OEM has become important and reflects the changing needs in the industry. 18 exhibitors is a small number, but it is twice as many as in 2014.
  • Distributors – Although the share is small, it is double that of last year and provides national coverage.
  • Gift/Gen Mdse – This category has been declining since 2016. These products are not a big priority in the pandemic.

Dogs and Cats are the undisputed royalty of Pet and they are even more of a focus in these trying times. Because of their huge impact on the industry, I have divided the products designed for them into 33 subcategories. Let’s see how this year’s GPE Top 15 (17 due to a tie) are doing. The rank was determined by the number of exhibitors, less distributors.

There was a shuffling in the rankings as only 4 held their place, including the Top 3. Furniture dropped out of the top 15 and was replaced by Dental, Rawhide and Scratching. (Remember, because of the tie, there are 17 on the list)

  • Treats are still #1 and gained share. 1 in 2 exhibitors offers treats. (Many supplements are in treat form.)
  • OTC Meds/Supplements/Devices also continues to gain strength and share. In 2014 their share was 11%.
  • Food and Feeding Accessories – Food made a big increase in rank and share so Accessories dropped in rank.
  • Toys, Scratching – It’s not all about health and nutrition. Toys held their rank and Scratching gained ground.
  • Collars, Leads & Harnesses – They held their share but fell 1 spot in rank due to the Food lift.
  • Beds/Mats – They had the biggest drop in share and fell 2 spots to 8th
  • Apparel – This less essential category had the 2nd biggest drop in share but the biggest drop in rank, 8th to 13th.
  • Waste Pickup, Shampoo, Stain & Odor, Grooming Tools – All these categories gained in share and all but Grooming Tools gained in rank. Obviously, cleanliness is also a big aspect of the trend to a healthier life for pets.
  • Rawhide & Dental – These categories made huge gains in rank and share. Dogs definitely need to chew.
  • Carriers & Crates, Litter Acc. – Both gained share. Litter Accessories fell in rank due to big gains from other categories.

Pet Parents’ concern for the overall health and wellness of their “pet children” remains the biggest trend.

The last chart details the specifics for all 33 of the Dog/Cat product categories that I defined. Of note: All the data inputs for this report and the SuperSearch tool come from  visits to over 200 websites. They’re not 100% accurate, but pretty close. Which categories are of interest to your business?

GPE 2021 is smaller and virtual but it still showcases the World of Pets and is Packed with Opportunities in products, services and education to fulfill your needs. Speaking of Education, there are 39 targeted sessions offered during the afternoons of every show day. They are live but many will be available on demand thanks to the virtual nature of the show. However, to reap all these benefits, you still need a plan. Exhibitors must showcase the “right” items. Attendees need to strategically analyze their data, determine what they need to improve their business, develop a plan to find the products to fulfill their needs, then…execute the plan. Although your fingers will be “doing the walking” during GPE 2021, your time is still limited. As always, time is still our most valuable commodity. The GPE 2021 SuperSearch Tool will be available by 3/8 and regularly updated. It should help you make more efficient use of your time at the show. Try it out and…the best of luck at GPE Digital Access and for the balance of 2021!

Hope to see you in person in 2022 in Orlando!