2020 Pet Services Spending was $6.89B – Where did it come from…?

Next, we will look at Pet Services. It is by far the smallest Segment and after a $1.73B, 20.1% decrease, it got a lot smaller and returned to the level of 2016 – 2017. After the great recession, Services’ annual spending slowly but steadily increased. During this time, the number of outlets offering Services strongly grew as brick ‘n mortar retailers looked for a way to combat the growing influence of online outlets. After all, you can certainly buy products, but you can’t get your dog groomed on the Internet. This created a highly price competitive market for Pet Services. In 2017 there was a slight increase in visit frequency, but Pet Parents just paid less. This resulted in a 1.0% decrease in Services spending. In 2018 consumer behavior changed as a significant number decided to take advantage of the increased availability and convenience of Pet Services and spending literally took off, +$1.95B (+28.9%), by far the biggest increase in history. In 2019 Pet Parents, especially the younger ones, value shopped, and spending turned down $0.10B. That brought us to 2020 and the onset of the pandemic. Because Services outlets were often deemed nonessential, they were subject to restrictions and closures. This drove the huge drop in spending.

We’ve seen that the pandemic caused binge buying in Food, while it slowed the more discretionary Supplies segment. Services  spending is arguably the most discretionary of any Pet Expenditure. Let’s look deeper into 2020 demographics.

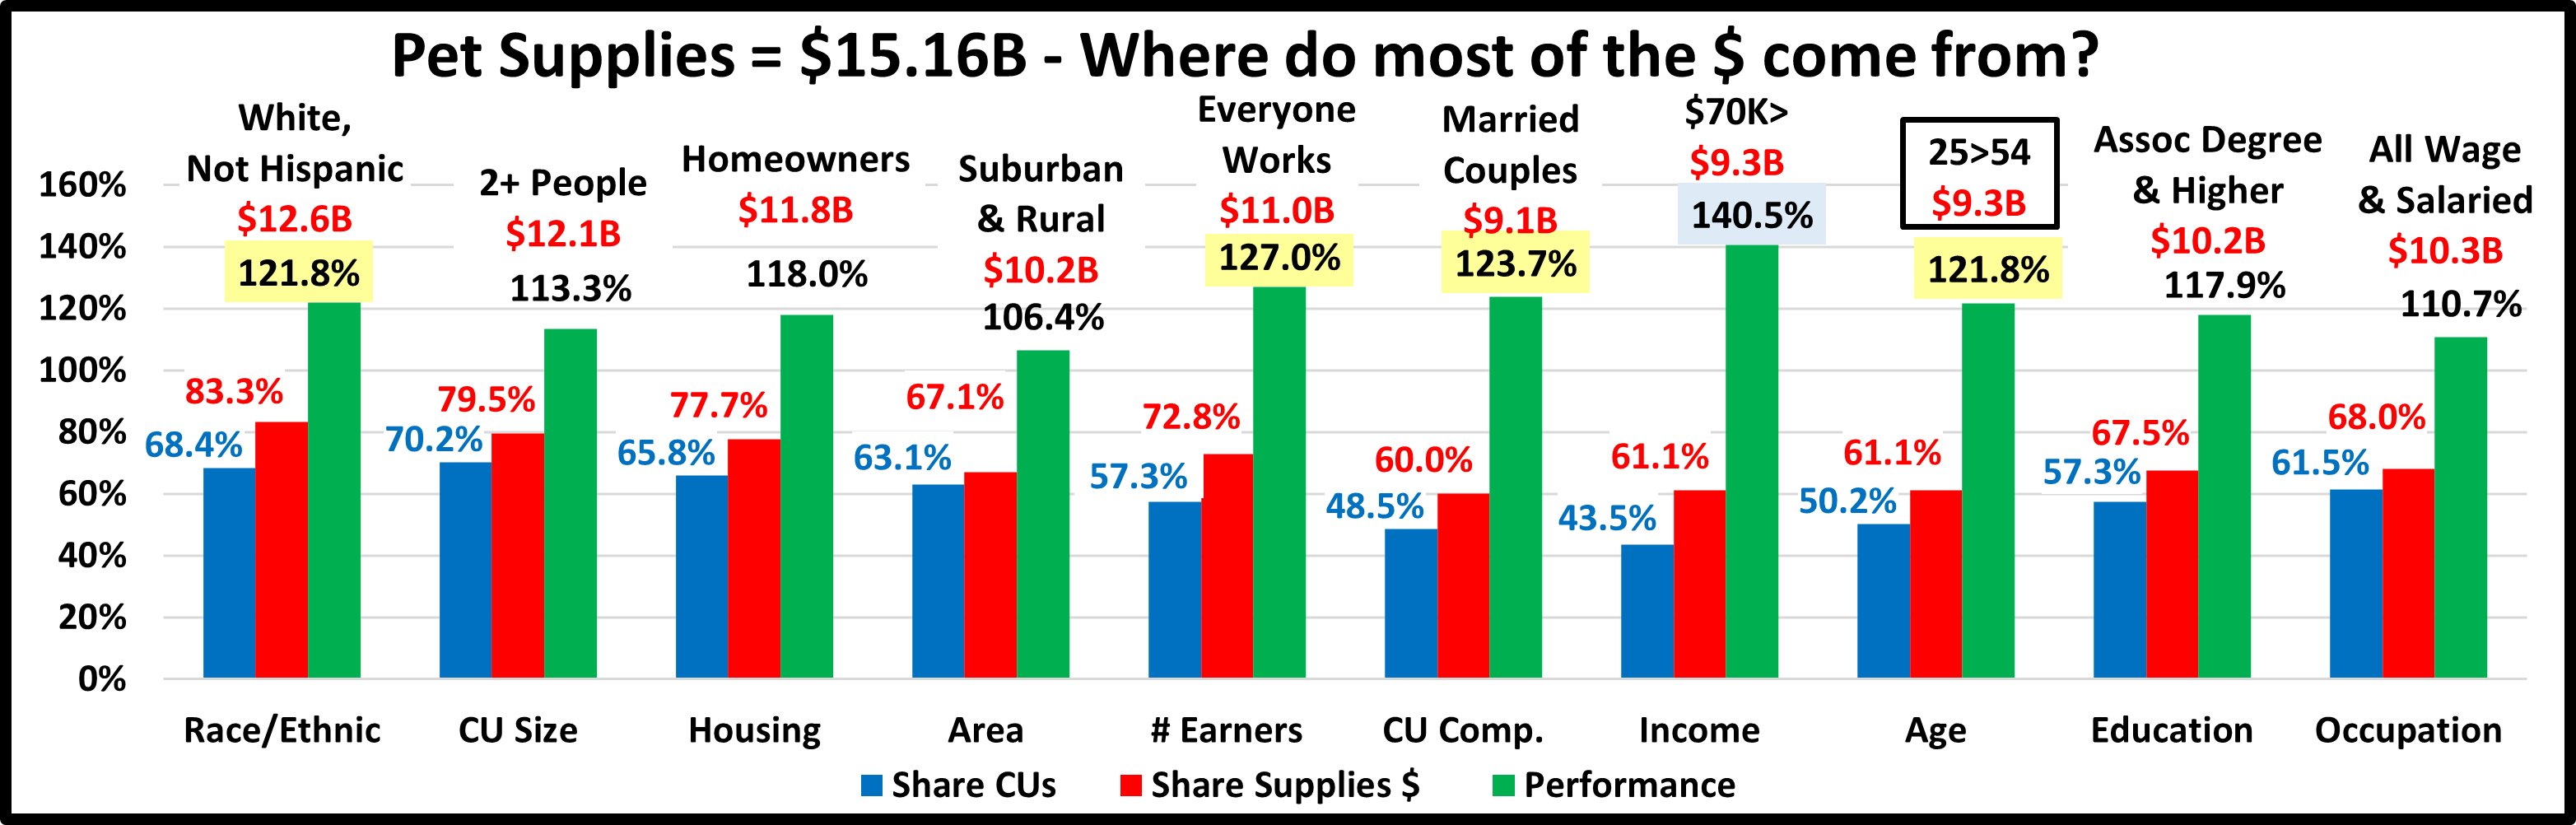
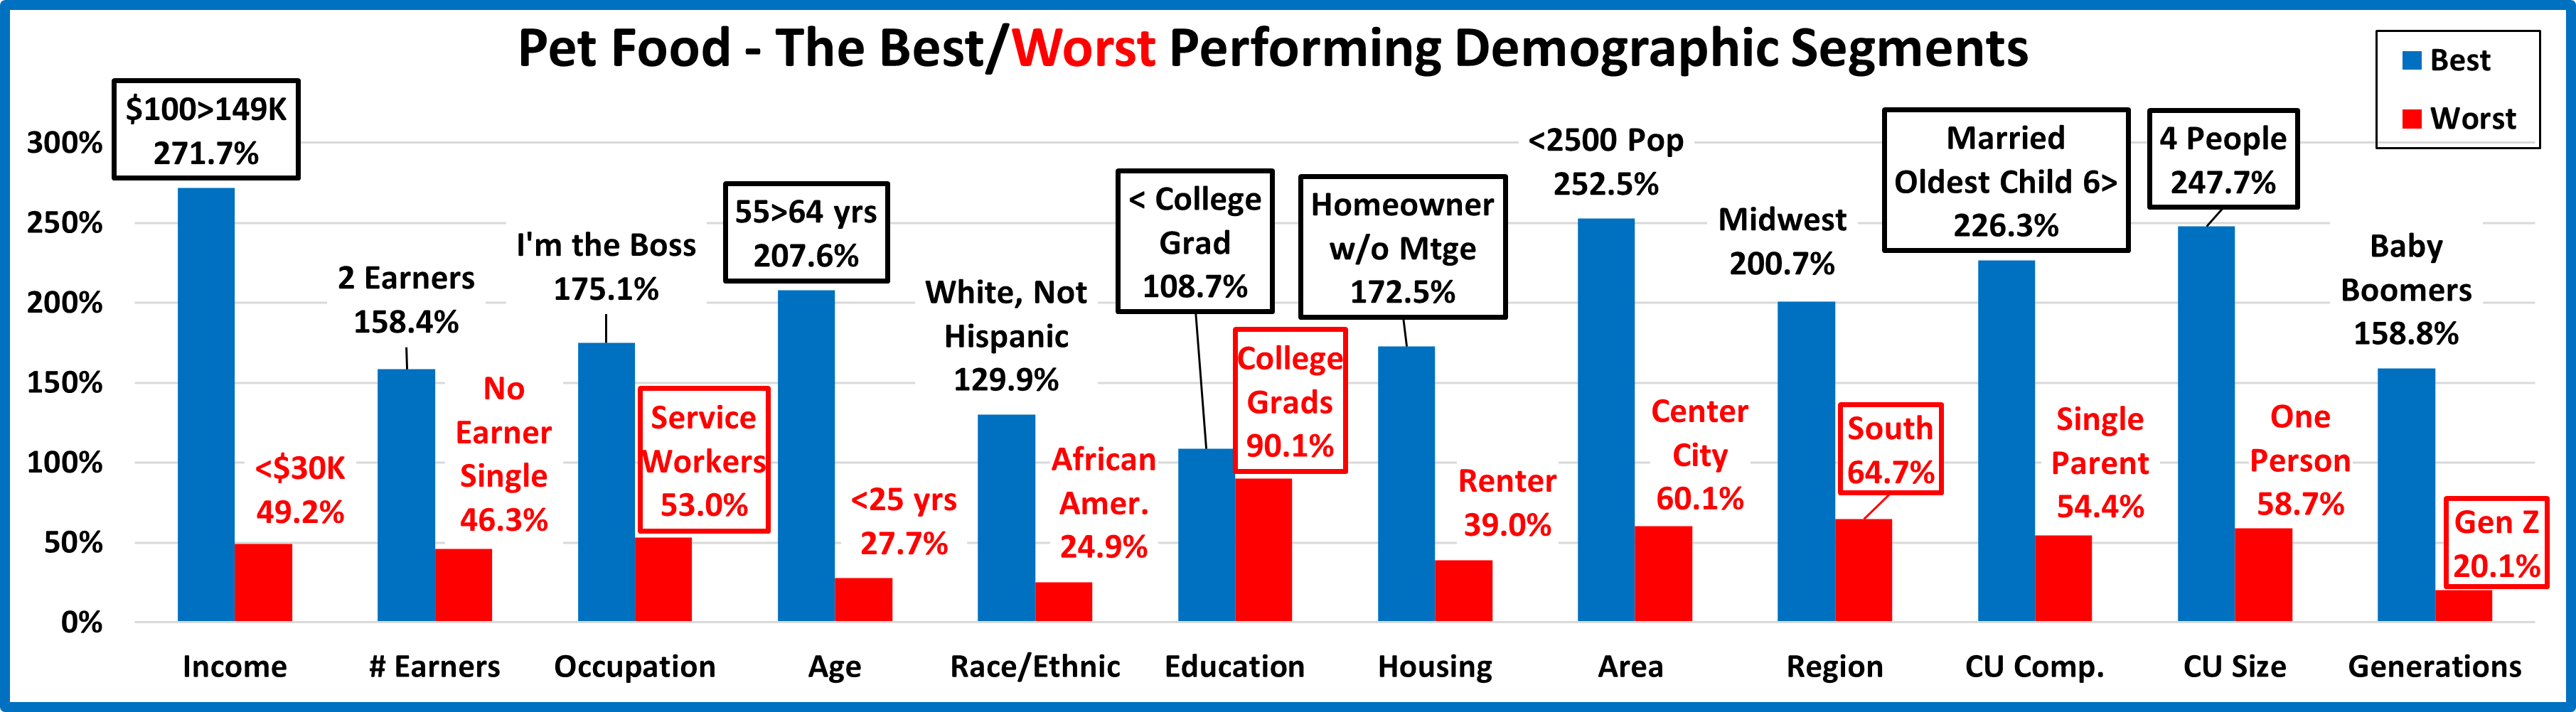
Let’s start by identifying the groups most responsible for the bulk of Services spending in 2020 and the $1.73B decrease. The first chart details the biggest Pet Services spenders for each of 10 demographic categories. It shows their share of CU’s, share of Services spending and their spending performance (Share of spending/share of CU’s). In order to better target the bulk of the spending we had to alter the groups in two categories – education and area. The performance level should also be noted as 5 of 10 groups have a performance level above 120%. This is the same as Supplies and Total Pet but less than the 6 for Veterinary and far less than the 8 for Food. Last year they also had only 5 over 120%, down from their peak of 7 in 2018. This indicates that there continues to be a little less disparity between the best and worst performing segments in 2020. Although performance is down from 2019, Income is still the biggest factor in Services Spending. The categories are presented in the order that reflects their share of Total Pet $ which highlights the differences of the 8 matching groups. One big difference is that higher education is a much bigger factor in Services $.

  1. Race/Ethnic – White, not Hispanic (87.9%) up from 87.3%.This big group accounts for the vast majority of spending in every segment. Services Spending became slightly less diverse in terms of race and ethnicity in 2020 as their performance grew from 127.4% to 128.5% and they remained in 4th place in terms of importance.
  2. Housing – Homeowners (78.3%) down from 84.5%. Homeownership is a big factor in spending in all industry segments. The Homeowners’ share of Services fell to the lowest level of any segment in 2020. Their performance plummeted from 132.6% to 119.3% and they dropped out of the 120+% club. Plus, Renters spent 10.5% more.
  3. # in CU – 2+ people (78.3%) up from 75.9% The share for 2+ CU’s is over 75% for all segments and Services is now 2nd to Food’s 82.5%. Their performance also increased from 108.7% to 111.6% and they moved up to 8th from 9th in importance. Only 4 person CUs spent more. 2+ CUs primarily gained ground because Singles had a 50% bigger drop.
  4. Area – City/Suburbs >2500 (83.3%) down from 87.1% in share, while performance fell from 106.9% to 102.7%, last place. Services is an Urban Segment so it makes sense that they would be the most impacted by pandemic related restrictions and closures. Led by Rural, the areas under 2500 population actually spent more on Services.
  5. # Earners – “Everyone Works” (69.9%) up from (67.6%) All adults in the CU are employed. Income is important so a high market share is expected. Their performance grew to 122.0% from 115.6% and they rejoined the 120% club at #5. Only CUs with 3+ Earners spent more. However, when all adults in a CU work, Services become more needed.
  6. CU Composition – Married Couples (62.8%) up from 61.4%. Married couples are a big share of $ and have 120+% performance in all segments. Their performance increased to 129.4% from 125.7% and they moved up from 5th to 3rd in terms of importance to Services spending. In 2020, kids were the key. Only Married Couples with children over 6 and Single Parents spent more.
  7. Income – Over $70K (69.2%) down from 75.0% This group’s performance rating is 159.2%, down markedly from 180.7%. However, CU income is still the single most important factor in increased Pet Services Spending. Only the $50>69K and $150>199K income groups spent more. With a $ drop due to closures and restrictions, it’s to be expected that the group that spent the most pre-pandemic would shoulder the brunt of the negative impact.
  8. Age – 35>64 (62.5%) up from 61.2%. Their performance grew minimally from 117.0% to 117.1% All age groups spent less. The <35 group had the smallest drop, -$0.06B. The 35>64 yr-olds spent -$0.97B less and the $ for 65+ fell -$0.70. The big drop by the oldsters combined with the small drop by the youngsters kept things on par with 2019.
  9. Education – College Grads (68.5%) down from 72.2% Income generally increases with education. Services spending moves up with each increasing level of education. College Grads spend the most so they were most impacted by the pandemic. Performance fell from 162.6% to 146.6% but a college education is still the 2nd most important factor.
  10. Occupation– All Wage & Salaried (66.8%) down from 69.8% – Only Self-Employed spent more. All white and blue collar work groups along with Retirees had a 20+% drop in Services’ spending. As expected, the high income Managers & Professionals who regularly spend the most on Services had the biggest drop, -$0.76B. All Wage & Salaried workers’ performance rating decreased from 114.5% to 108.7%. Services spending became a little more balanced in terms of Occupation but for the wrong reason.

We changed 2 of the groups for Services – Education and Area, to better target the biggest spenders. We should also note that Income is still more important to spending in Services than in any other segment but # Earners was the only income related category to gain in importance. Marriage also grew in importance but spending became a little more balanced in most categories with gains by renters and larger CUs.

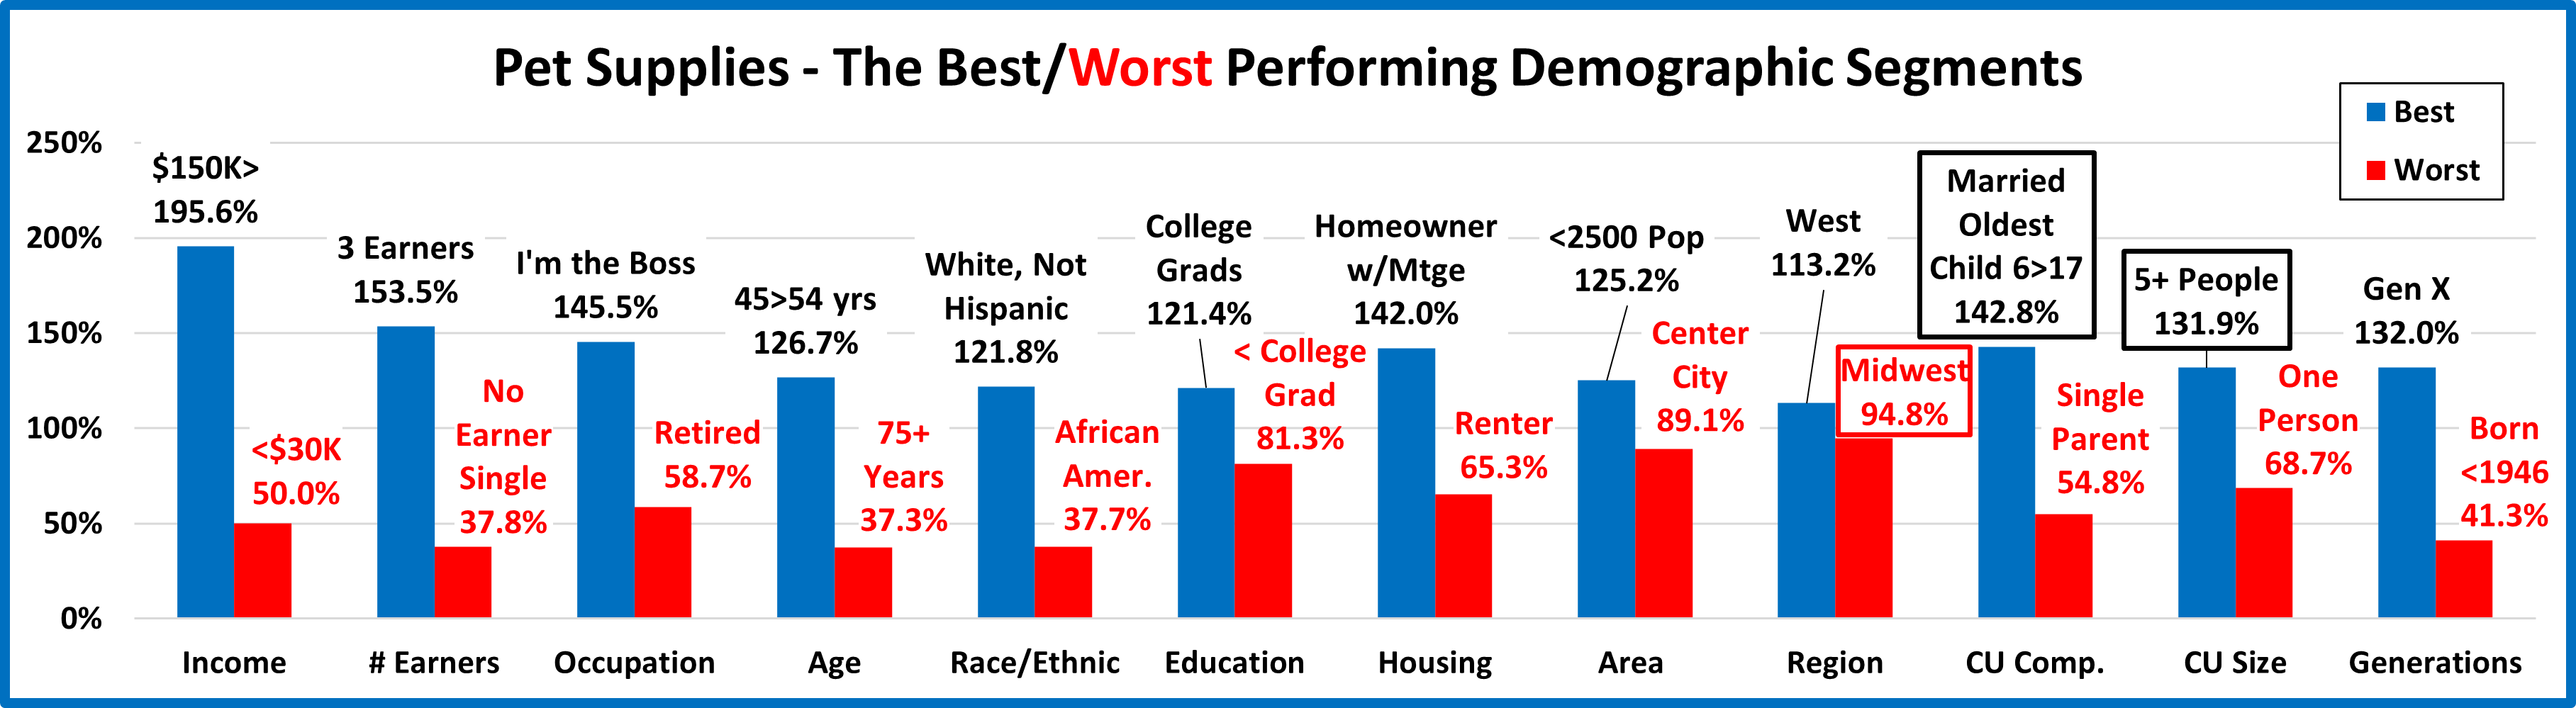
Now, we’ll look at 2020’s best and worst performing Pet Services spending segments in each category.

Most of the best and worst performers are not a surprise. There are 7 that are different from 2019 – 3 of the best and 4 of the worst, the same as last year. The 3 new winners are more family oriented. The high income Gen Xers, including 45>54 yr-olds stayed on top but you can see a move away from the oldest Americans. 75+ yr-olds, those Born before 1946 and No Earner, singles all moved to the bottom. Changes from 2019 are “boxed”. We should note:

  • Income is even more important to Pet Services. While the 283.8% Performance by the $150K> group is about the same as last year’s 284.3%, it is still the best performance by any group in any Industry segment.
  • # Earners – Winner and loser are new. They are the segments with the highest and lowest incomes. Not a surprise.
  • Generation – Gen X retained Top Spot and the oldest group, born before 1946 replaced Millennials at the bottom. Gen X had the only 100+% performance but the younger groups all improved while the older groups lost ground.
  • Age – 45>54, the highest income group. is by far the best performer. All groups from 25>64 perform at 100+%. The lowest performers were at both ends of the age spectrum.
  • Area –Suburbs 2500> kept the lead in $ and performance. Services is an Urban segment but the gap narrowed a bit in 2020. Suburbs 2500> performed at 109.3, up from 106.9%. Areas <2500 performed at 88.3%, up from 69.6%.
  • CU Composition – Children mattered in 2020. Married couples with children and even Single Parents spent more on Services. Marriage is the key. Married Couples only and those with children of any age all perform over 100%.

In Pet Services spending performance, income is still the major factor. After the youth movement in 2018, spending skewed towards older groups in 2019. This was reversed in 2020 as the younger groups basically held their ground while the older CUs drove the big decrease.

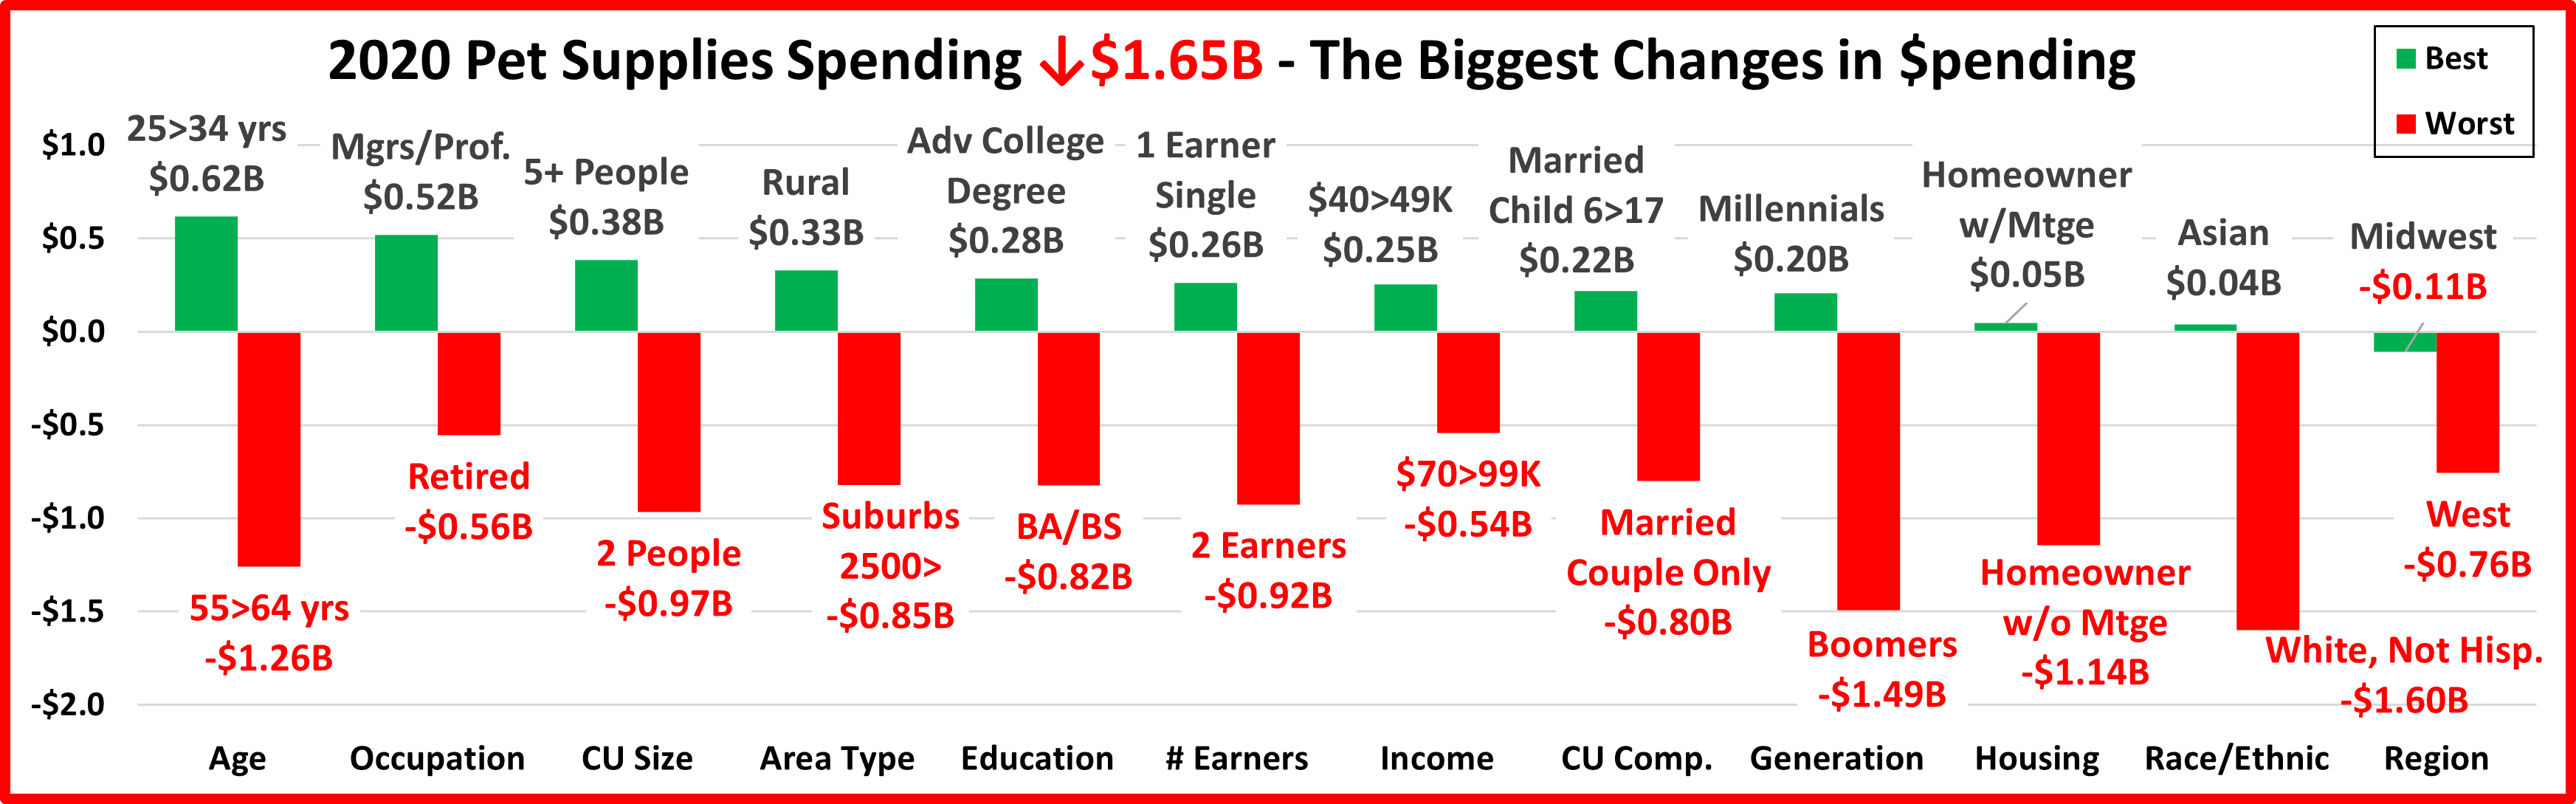
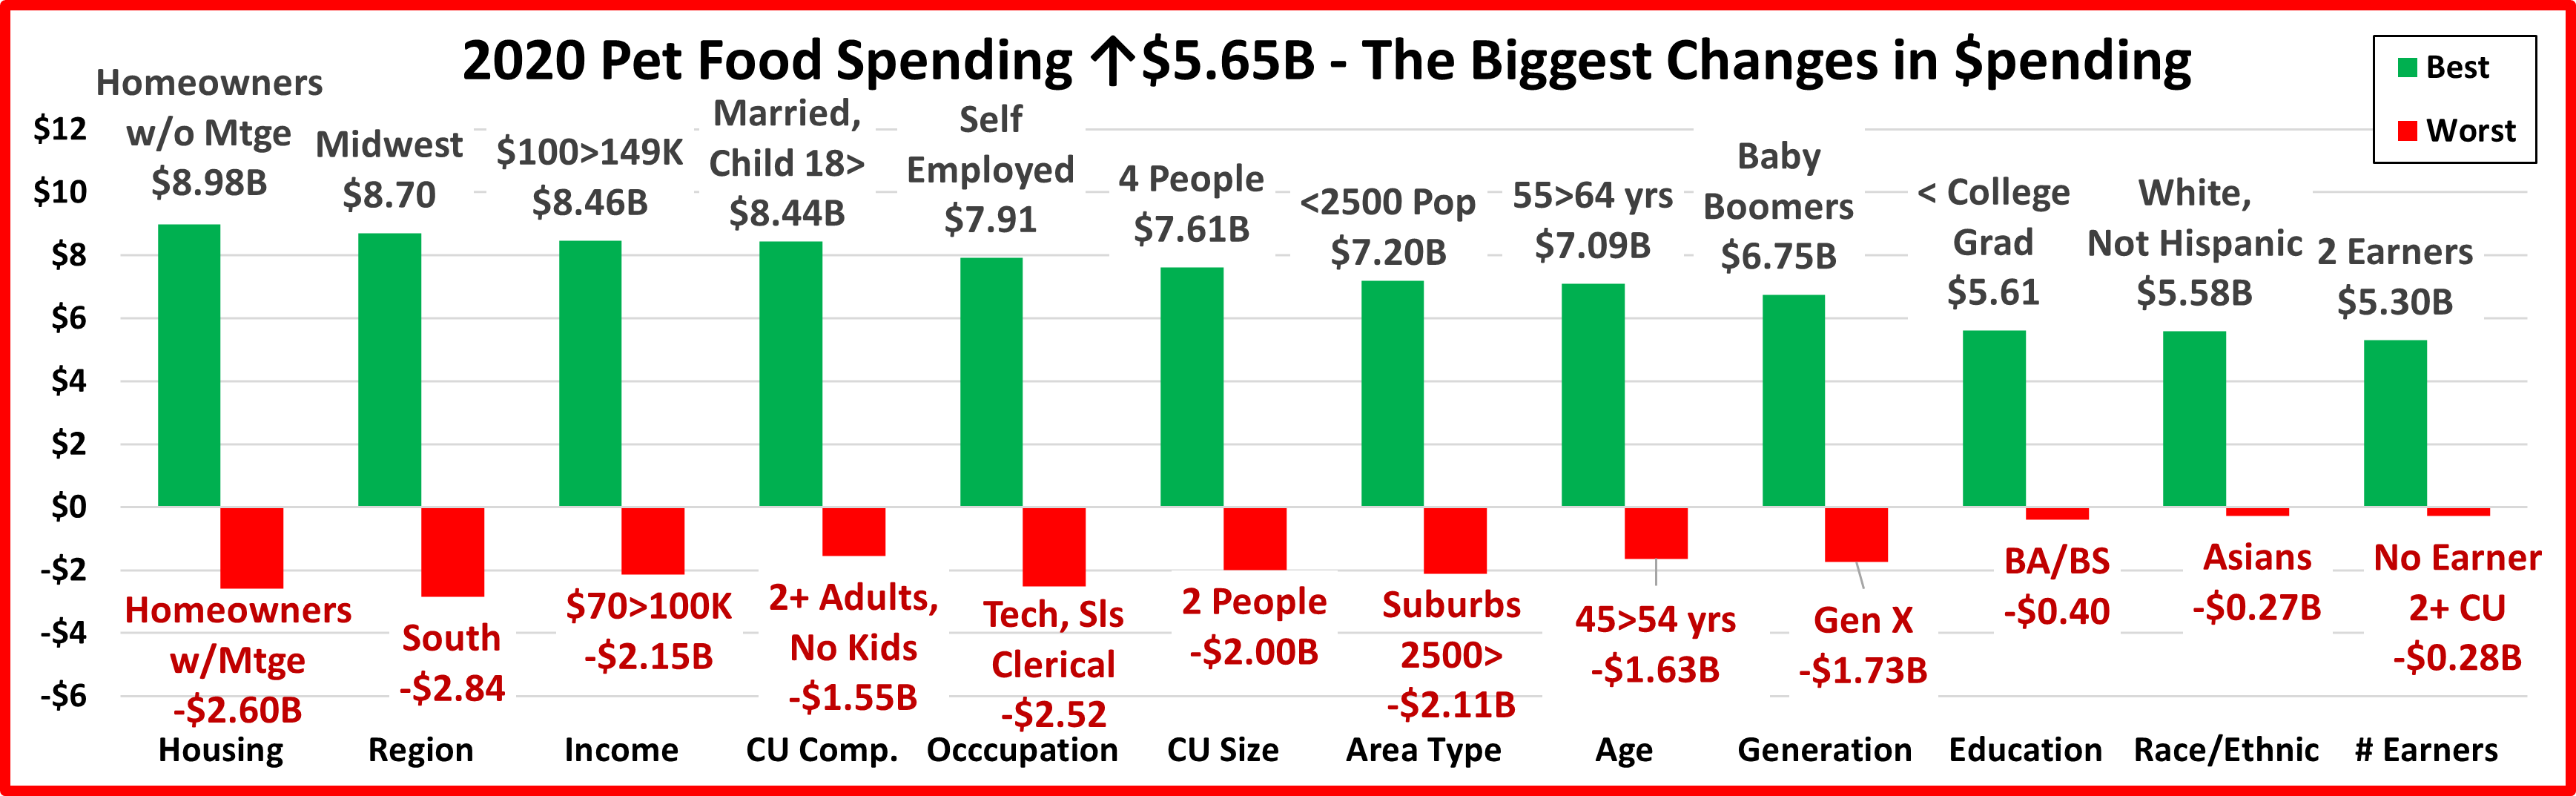
It’s time to “Show you the money”. Here are segments with the biggest $ changes in Pet Services Spending.

The pandemic closures and restrictions drove Pet Services Spending down $1.73B. In this chart you immediately see a difference from last year. In 2020 there were 3 categories in which all segments spent less on Services. In 2019, there were none. In 2019 the changes by the winner and loser tended to cancel the other out. In 2020, the changes by the losers were radically larger than the winners. The tumult that began in 2019 continued in 2020. Again, there were only 2 repeats and 8 of 24 segments switched from first to last or vice versa. In 2019 there were 9 flips. Here are the specifics:

  • # in CU – Both the winner and loser are new.
    • Winner – 4 People – Pet Services Spending: $1.19B; Up $0.15B (+14.2%)                                  2019: 5+ People
    • Loser – 2 People – Pet Services Spending: $2.49B; Down $1.10B (-30.6%)                                2019: 3 People
    • Comment: The winners in both 2019 and 2020 reflect the growing strength of the younger generations.
  • CU Composition – Married, oldest child 6>17 kept their spot at the top.
    • Winner – Married, Oldest Child 6>17 – Services: $1.31B; Up $0.15B (+12.5%)                       2019: Married, Oldest Child 6>17
    • Loser – Married, Couple Only – Services: $1.80B; Down $0.95B (-34.6%)                                2019: Married, Oldest Child <6
    • Comment – This reflects the strength of the 25>54 year olds. It also demonstrates the importance of “family”, especially children. All married groups with children over 6 spent more. The loser was more likely to be older.
  • Housing – Renters flipped from last to first and were the only segment to spend more.
    • Winner – Renter – Services: $1.48B; Up $0.14B (+10.5%)                                                                  2019: Homeowner w/o Mtge
    • Loser – Homeowner w/Mtge – Services: $3.80B; Down $1.16B (-23.4%)                                      2019: Renter
    • Comment – Homeowners w/mtge spend the most so they have the most to lose and they did.
  • Occupation – Mgrs & Professionals, the biggest Services spenders were again the group with the biggest decrease.
    • Winner–– Self-Employed – Pet Services Spending: $0.71B; Up $0.14B (+24.3%)                          2019: Retired
    • Loser – Mgrs & Professionals – Pet Services Spending: $2.79B; Down $0.76B (-21.4%)             2019: Mgrs & Profess.
    • Comment – The highest income Self-Employed group spent more in every industry segment.
  • Area Type – Big Suburbs flipped from 1st to last. It’s the 1st time since 2016 that Center City didn’t either win or lose.
    • Winner – Rural – Pet Services Spending: $0.38B; Up $0.13B (+50.7%)                                            2019: Suburbs 2500>
    • Loser – Suburbs 2500> – Pet Services Spending: $3.33B; Down $0.95B (-22.2%)                        2019: Center City
    • Comment – Rural was the only group to spend more on Services but they increased spending in all segments.
  • Income – The winner flipped from last to first.
    • Winner – $50 to $69K – Pet Services Spending: $0.74B; Up $0.12B (+18.6%)                                2019: $30>39K
    • Loser – $100 to $149K – Pet Services Spending: $1.19B; Down $0.79B (-40.0%)                            2019: $50 to $69K
    • Comment – Last year we had an up/down spending rollercoaster in income groups. In 2020 only $50>69K & $150>199K spent more. The winning $50>69K group only spent more on Services. The losing group cut back on the more discretionary Supplies and Services to help fund their $9.6B increase in Food & Veterinary.
  • Generation – Gen Z is a surprise, but they had an increase because many are just beginning as Pet Parents.
    • Winner – Gen Z – Services: $0.13B; Up $0.07B (+118.8%)                                                                    2019: Born <1946
    • Loser – Boomers – Services: $2.19B; Down $0.59B (-21.3%)                                                                2019: Gen X
    • Comment – Boomers had the biggest decrease, but it was only slightly larger than Gen X or those born before 1946. Gen Z spent more but the drop by Millennials was minimal, only -$0.16B, 9% of the total decrease.
  • Education – College Degree flipped from 1st to last.
    • Winner – HS Grads – Pet Services Spending: $3.30B; Up $0.05B (+8.9%)                                        2019: Adv. College Degree
    • Loser – Adv. College Degree – Services Spending: $0.93B; Down $1.04B (-31.7%)                        2019: HS Grad w/some College
    • Comment – Only those with no college courses, including those w/o a high school diploma spent more. They only account for 10.6% of Services $ but that’s up significantly from 7.4% in 2019.
  • # Earners– Like the Occupation category, the 2 highest income groups provided both the winner and the loser.
    • Winner – 3+ Earners – Pet Services Spending: $0.57B; Up $0.04B (+56.0%)                                  2019: No Earner, Single
    • Loser – 2 Earners – Pet Services Spending: $2.25B; Down $0.85B (-14.4%)                                     2019: 1 Earner, Single
    • Comment – All but 3+ Earner CUs spent less. No Earner, Singles had the biggest % decrease, -44.7%.
  • Race/Ethnic – Both the 2019 winner and loser flipped.
    • Winner – Hispanic – Services: $0.52B; Down $0.01B (-2.6%)                                                            2019: White, Not Hispanic
    • Loser – White, Not Hispanic – Services: $6.06B; Down $1.47B (-19.6%)                                        2019: Hispanic
    • Comment– All groups spent less. Hispanics are 2nd in spending but the total minority share of Services $ is 12.1%.
  • Age – The 75+ yr olds flipped from 1st to last.
    • Winner – <25 yrs – Pet Services Spending: $0.16B; Down $0.03B (-14.3%)                                     2019: 75+ yrs
    • Loser – 75+ yrs – Pet Services Spending: $0.34B; Down $0.42B (-55.1%)                                           2019: 35>44 yrs
    • Comment: In 2018, all age groups spent more on Services. In 2019 all groups under 45 yrs old spent less, while all groups over 45 spent more. In 2020 all age groups spent less but the <35 group was down only -$0.06B while the 35>64 yr olds were -$0.97B and the 65+ group spent -$0.7B less.
  • Region – The Midwest lost and has now flipped for three consecutive years.
    • Winner – South – Pet Services Spending: $2.65B; Down $0.30B (-10.2%)                                       2019: Midwest
    • Loser – Midwest – Pet Services Spending: $1.23B; Down $0.59B (-32.5%)                                       2019: Northeast
    • Comment – In 2018 all regions spent more. In 2019 it was only the Midwest and West. In 2020 all spent less.

We’ve seen the winners and losers in terms of change in Services Spending $ for 12 Demographic Categories. Income still matters and the younger groups, especially those with children have come to the forefront. Spending has become more balanced but for the wrong reasons. Here’s some data which shows the monumental change from the 2018 peak.

  • Sales:
    • 2018: $8.72B
    • 2019: $8.62B
    • 2020: $6.89B
  • % Segments Spending More:
    • 2018: 88%
    • 2019: 49%
    • 2020: 21%
  • Avg Biggest Increase:
    • 2018: $1.04B
    • 2019: $0.25B
    • 2020: $0.05B
  • Avg Biggest Decrease:
    • 2018: -$0.02B
    • 2019: -$0.27B
    • 2020: -$0.89B

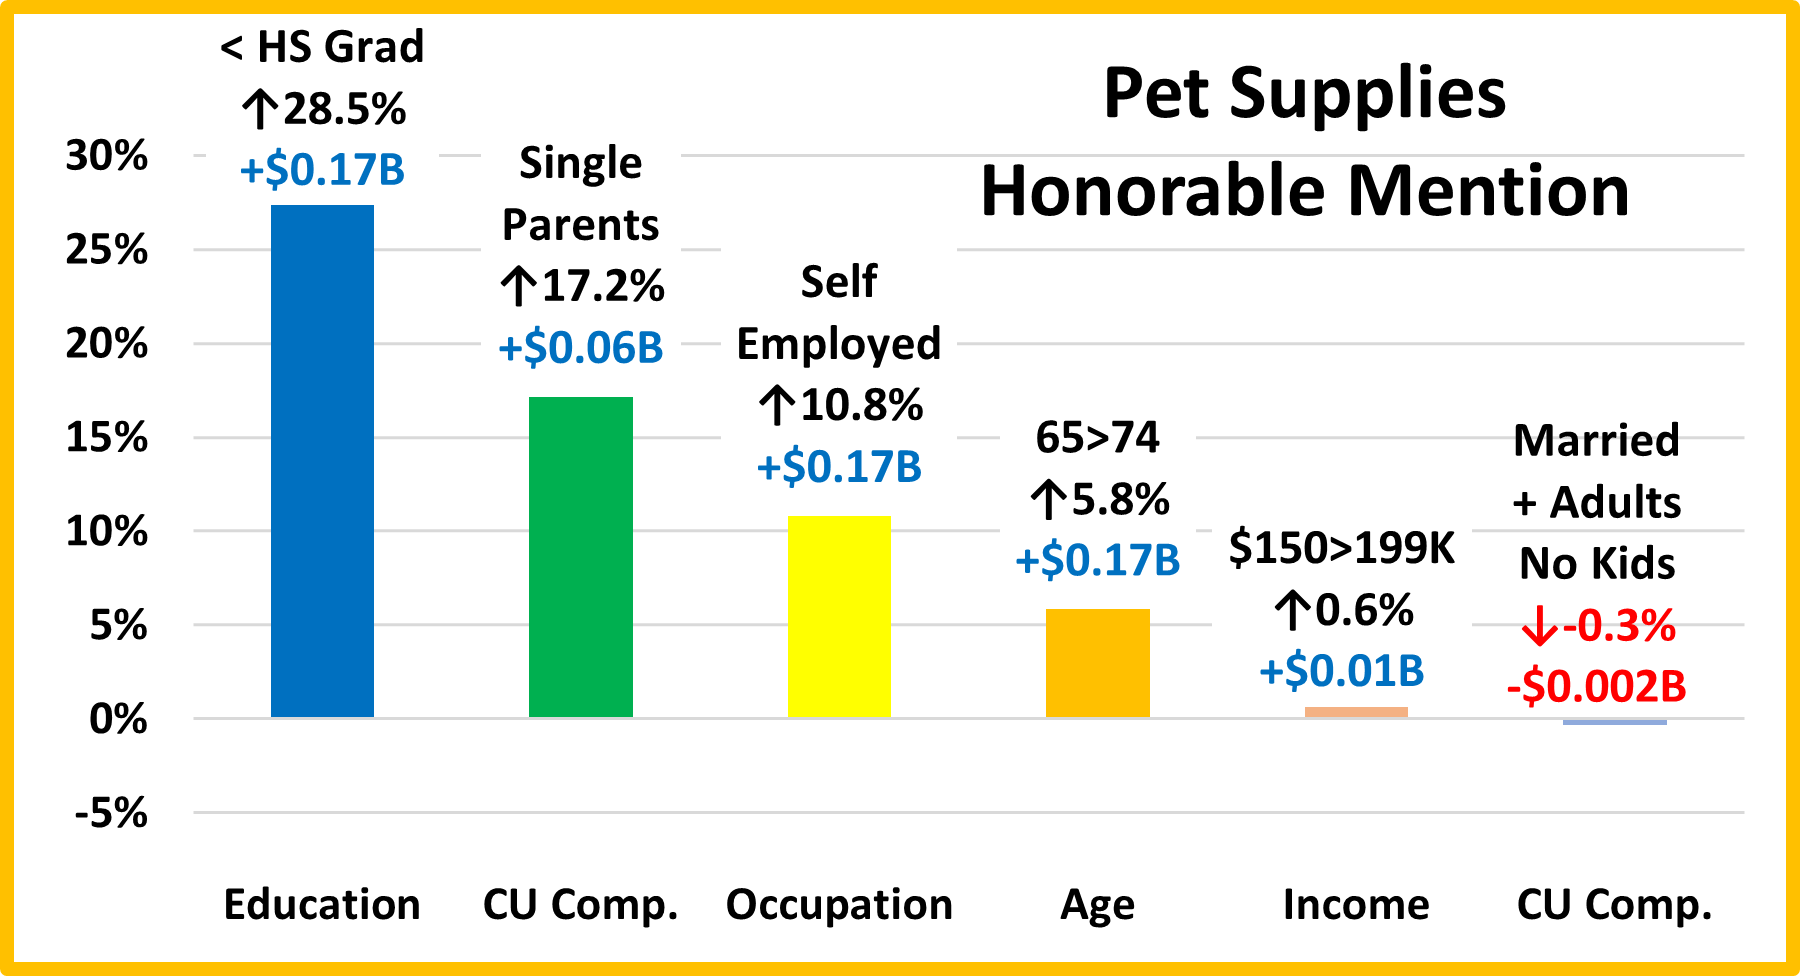
We found the winners in performance and $, but there were others who performed well but didn’t win. They deserve….

HONORABLE MENTION

As you see on the chart, sometimes we had to include both 2nd and the 3rd place finishers to reach our 6 positive segment goal. Higher income is important, but the results were mixed in 2020. The $50>69K group won but there were also positive performances by the $150>199K and $30>39K groups. In a reversal from last year, CUs with kids spent more unless you were married and your oldest child was under 6. This also included single parents. The only area spending increase came from Rural areas but urban areas with a population of 100>249K also posted an increase. A College Degree is more important in Services Spending than in any other industry segment. In 2020 those with only a High School diploma and those who didn’t finish high school were the only 2 education segments to spend more on Services. Only 21% of all demographic segments spent more on Services so our choices for Honorable Mention were limited.

Summary

For years, Services’ spending slowly but steadily increased. However, the number of outlets offering Services was radically increasing. In 2017, this competitive pressure caused Pet Parents to shop for value and spending fell 1%. In 2018, the abundance of outlets and competitive prices finally had their intended impact. Many more consumers took advantage of the convenience of Pet Services and spending literally took off. In 2019 Consumers held their ground at the new higher level but we saw turmoil similar to 2017. Again, value shopping likely contributed to the small decrease.

2020 brought the pandemic and Services outlets were often deemed nonessential so they were subject to restrictions and closures. Services are definitely needed by some groups. However, for most demographics, Services are a convenience and spending is very discretionary in nature. The reduced availability and the pandemic driven focus on the “needed” segments – Food and Veterinary caused a 20% drop in Services $. High Income is still important in Services spending, but we saw mixed results in 2020. However, the $70K> group still has its highest performance in Services.

Performance is an important measurement. There were 5 categories with high performing big groups, the same as 2019. This is equal to Supplies, but less than Veterinary (6) & Food (8). This indicates a little less disparity in Services Spending.

  1. Income
  2. Higher Education
  3. CU Composition
  4. Race/Ethnicity
  5. # Earners

The Housing category dropped out and was replaced by # of Earners. These changes were caused by the spending again skewing a little younger. The younger crowd is more likely to have all adults in the CU working. They also are more like to rent than own their home. Renters had the only increase in the Housing segment and pushed Homeownership below the 120% marker. While Spending did move a little younger, Gen X and Boomers are still the top 2 spenders.

A radical increase in the number of outlets caused a competitive market which broadened the appeal of Services and drove a record increase in 2018. Value shopping caused a small decrease in 2019 but Services stayed at the new “normal” level. The pandemic changed all that. Outlets closed and people stayed home so DIY became the new trend even in Pet Services. Services did become more demographically balanced, but it was due to the huge drop in spending by those who normally spent the most, not by any big increases. As Retail America recovers from the 2020 pandemic, we assume that many services outlets will re-open. However, to get back to the previous high level of spending, Pet Parents will also have to move away from DIY and back to “I need help with my pet children, and I have the money to pay for it.” Services were hit the hardest by the pandemic in 2020. We’ll see what happens in 2021.

At Last – The “Ultimate” Pet Services Spending Consumer Unit consists of 4 people – a married couple with 2 kids. The oldest child is 6>17. They are White, but not of Hispanic origin. At least one of them has an advanced College Degree. They are 45 to 54 years old and both work in their own business which generates an income of over $200K. They live in a large suburb of a metropolitan area of 2.5>5 MM in the Western U.S. and are still paying off their mortgage.

Retail Channel Monthly $ Update – March Final & April Advance

The pandemic started in March 2020. In the Retail sector, we have seen both record drops and record highs. The market has generally recovered but now we are being hit by extreme inflation. This can affect retail sales, so we’ll continue to track the retail market with data from two reports provided by the Census Bureau and factor in the CPI from US BLS.

The Census Bureau Reports are the Monthly and the Advance Retail Sales Reports. Both are derived from sales data gathered from retailers across the U.S. and are published monthly at the same time. The Advance Report has a smaller sample size so it can be published quickly – about 2 weeks after month end. The Monthly Final Report includes data from all respondents, so it takes longer to compile the data – about 6 weeks. Although the sample size for the Advance report is smaller, the results over the years have proven it to be statistically accurate with the final monthly reports. The biggest difference is that the full sample in the Final report allows us to “drill” a little deeper into the retail channels.

We begin with the Final Report for March and then move to the Advance Report for April. Our focus is comparing 2022 to 2021 but also YTD 2019. We’ll show both actual and the “real” change in $ as we factor inflation into the data.

Both reports include the following:

  • Total Retail, Restaurants, Auto, Gas Stations and Relevant Retail (removing Restaurants, Auto and Gas)
  • Individual Channel Data – This will be more detailed in the “Final” reports, and we fill focus on Pet Relevant Channels

The information will be presented in detailed charts to facilitate visual comparison between groups/channels of:

  • Current Month change – % & $ vs previous month
  • Current Month change – % & $ vs same month in 2021
    • Current Month Real change – % vs same month in 2021 factoring in inflation
  • Current YTD change – % & $ vs 2021
    • Current YTD Real change – % vs 2021 factoring in inflation
  • Current YTD change vs 2019 – % & $
    • Current Real change YTD vs 2019 – % factoring in inflation
  • Monthly & YTD $ & CPIs which are targeted by channel will also be shown. (CPI details are at the end of the report)

First, the March Final. February is the normal Retail $ bottom for the year and sales turned up in March. Overall, the growth is slowing, and Auto sales actually dropped vs March 2021. Obviously, factoring in inflation paints a different picture of the situation. Here are the major retail groups. (All $ are Actual, Not Seasonally Adjusted)

The March Final is $4.2B more than the Advance Report. All but Auto were up. Restaurants: +$6.3B; Auto: -$5.5B; Gas Stations: +$0.4B; Relevant Retail: +$3.0B. All groups are up from the February bottom. Growth is slowing but all but Auto are up vs 2021 & 2019. When you look at the “real” numbers you get a different view. The Auto/Gas groups are really down in all measurements. Restaurants are strong due to a late recovery but also note that half of the inflation in this group came before 2022. Total and Relevant Retail are starting to see the impact of inflation as Real sales are down or flat vs 2021. Relevant Retail has the best performance since 2019 as 69% of their 31% growth is “Real”.

Now, let’s see how some Key Pet Relevant channels did in March.

Overall – All 11 were up vs February. Vs March 2021, 6 reported more $ but only A/O Misc. was really up. In YTD, 7 reported increases but only 4 were real. Vs 2019, Only Office/Gift was “really” down, the only decrease vs 2019.

  • Building Material Stores – Their Spring lift has started but it is not as strong as last year. Home Ctr/Hdwe is up vs 21 but Farm stores are down for the month & YTD. The Bldg/Matl group has an inflation rate over 10% which produced all negative real numbers. The pandemic caused consumers to focus on their homes which produced sales growth over 30% since 2019 in both channels. Importantly, 2/3rds of this lift was real. The chart shows that almost all of the lift came from 20>21, prior to the inflation wave. Avg Growth Rate: HomeCtr/Hdwe: 11.8%, Real: 8.0%; Farm: 10.3, Real: 6.6%
  • Food & Drug – Both channels are truly essential. Except for the food binge buying in the pandemic, they tend to have smaller fluctuations in $. However, they are radically different in inflation. The rate for Grocery products is 4 times higher than for Drugs/Med products. Sales for Drug Stores are down vs March 2021 but 84% of their growth since 2019 is real. The Real Sales for Supermarkets are down for the month and YTD. Also, only 31% of their growth since 2019 is real. Avg Growth Rate: Supermarkets: +6.1%, Real: +2.0%; Drug Stores: +4.2%, Real: +3.7%.
  • Sporting Goods Stores – They also benefited from the pandemic in that consumers turned to self-entertainment, especially sports & outdoor activities. Their Spring lift has started but it’s not as strong as last year. Their current inflation rate is almost 8% but it was also high in 20>21, +4.8%. However, 73% of their 48.9% lift since 2019 is real. Their Avg Growth Rate was: +14.2%; Real: +10.7%.
  • Gen Mdse Stores – All channels had strong growth out of the February “bottom” but vs 2021 they don’t look good. Clubs/SupCtrs & $/Value stores are up slightly YTD vs 2021 but all other measurements vs 2021 – published or real, are negative. Disc. Dept Stores were struggling before COVID and only 9% of their 8% growth since 2019 is real. For the other channels, it averages 47%. Avg Growth Rate: SupCtr/Club: 5.7%, Real: 2.8%; $/Value Strs: +6.1%, Real: +3.2%; Disc. Dept.: +2.6%, Real: 0.2%
  • Office, Gift & Souvenir Stores – Their recovery didn’t start until the spring of 2021. Sales are up vs 2021, but real sales are flat or down, including a real 6.6% drop from 2019. Their true recovery is still a long way off. Avg Growth Rate: +0.2%, Real: -2.3%
  • Internet/Mail Order – The sales growth of the “hero” of the Pandemic is slowing. Real March sales vs 2021 are even down. However, 91% of their 81.9% growth since 2019 is real. Their Avg Growth Rates is: +22.1%, Real: +20.4%. As expected, they are by far the growth leaders since 2019.
  • A/O Miscellaneous – This is a group of specialty retailers. Pet Stores are 22>24% of total $. In May 2020 they began their recovery which reached a record level by December 2021 as annual sales reached $100B for the first time. Sales continue exceptionally strong in 2022. In fact, they are the only channel on the chart with all positive measurements. Plus, 88% of their 61.6% growth since 2019 is real. Their Avg Growth Rate is: +17.3%, Real: +15.6%. They are 2nd in growth since 2019 to the internet, which is somewhat surprising.

There is no doubt that high inflation is an important factor in Retail. In actual $, 8 channels are up in YTD sales over 2021 but only 5 are up for the month. When you factor in inflation, the number with any “real” growth falls to 4 YTD & 1 monthly. Inflation is starting to have a growing impact at the channel level. Now, the Advance numbers for April.

We have had memorable times since 2019. Some big negatives, including the 2 biggest monthly drops in history but a lot of positives in the Pandemic recovery. Total Retail reached $600B in a month for the first time and broke the $7 Trillion barrier in 2021.  Relevant Retail was also strong as annual sales reached $4T but in fact, all big groups set annual sales records in 2021. Now radical inflation has entered the game with the largest increase in 40 years. This can first reduce the amount of product sold but not $ spent. In April there was a  small overall increase from March, but the amount sold fell in all but Restaurants. If it continues, it can actually reduce consumer spending which is now happening in Auto.

Overall – Inflation Reality is starting to set in. The monthly increase vs the previous year is much smaller than it has been. The still recovering Restaurants and Gas Stations are up double digits but Auto $ are actually down. Although April set a new $ record for the month, the real monthly and YTD sales vs 2021 for all but restaurants are down or flat.

Total Retail – Every month in 2022 has set a monthly sales record. April $ are $684B. In a normal year, sales should stay at or near that level until dipping slightly in September. However, 2022 is not normal. Sales are flat vs March but are still up 8.7% vs April 2021 and 11.3% vs YTD 2021. When you factor in 13% inflation, both measurements are down for the 2nd consecutive month and only 46.4% of the 32.1% growth since 2019 is real. The Avg Growth Rate is: +9.7%, Real: +4.7%. Inflation is making an impact.

Restaurants – They were hit hard by the pandemic and didn’t truly start to recover until March 2021. Sales in the last 9 months of 2021 exceeded $70B and 2021 was the biggest year in history, $876B. January sales fell from December but have turned up since then setting new all-time monthly records in March and now April ($86.4B). They are the only big group that is positive in all measurements. Their inflation is high at 7.1% for April and 6.7% YTD but it is the lowest of any big group. Also, only 51.4% of their 29.0% growth since 2019 is real. This is due to the fact that inflation started earlier in this group, +5.9% in 2021. Here is their Avg Growth Rate: +8.9%, Real: +4.7%. Although they only account for 12.6% of Total Retail sales, their positive performance significantly helps to improve the overall retail numbers.

Auto (Motor Vehicle & Parts Dealers) – This group actively worked to overcome the stay-at-home attitude with great deals and a lot of advertising. They finished 2020 up 1% vs 2019 and hit a record $1.48T in 2021. In 2022 sales fell in January, turned up in Feb/Mar then fell again in April. They are unique in that their March and now April sales are below 2021. These are the only reported sales negatives by any group vs 2021. This is bad but their real sales numbers are much worse. Extraordinarily high inflation has pushed their real sales down -15+% in all measurements vs 2021, the worst performance of any group. Plus, only 16% of their 29.4% growth since 2019 is real. Their Avg Growth Rate: +9.0%, Real: +1.5%. It is very likely that the drops in the reported $ales in March & April are tied to extreme inflation.

Gas Stations – Gas Stations were also hit hard. If you stay home, you drive less and obviously need less gas. This group started recovery in March 2021 and reached a record $584B for the year. Sales fell in January and February then turned up in March & April. They have the biggest increases vs 2021 and 2019 but it is not reality. Gasoline inflation is in all of the headlines and is by far the highest of any expenditure category. It is over 42% for 2022 vs 2021 and has even caused consumers to buy less than they did in 2019. Avg Growth Rate: +12.7%, Real: -2.4%. It’s a textbook example of the initial impact of inflation. Consumers are spending more but buying less, even less than they bought 3 years ago.

Relevant Retail – Less Auto, Gas and Restaurants – This the “core” of U.S. retail and accounts for 60+% of Total Retail Spending. There are a variety of channels in this group, so they took a number of different paths through the pandemic. However, their only down month was April 2020. They finished 2020, up +7.1% and 2021 got even better as they reached a record $4.50T. They have led the way in Total Retail’s recovery which became widespread across the channels. Sales fell in January and February, turned up in March, but were basically flat in April. All months in 2022 set new records but their YTD numbers are now below their 9.7% avg growth. Now, we’ll look at the impact of inflation. 68.2% of their 32.1% growth since 2019 is real. However real sales vs 2021 are down -1.6% for the month and flat YTD. This shows that inflation is only a 2022 problem. Their Avg Growth Rate: +9.7%, Real: +6.8%. The performance of this huge group is critically important. This is where Retail America shops. Real YTD sales are up only 0.2% but the amount of products that consumers bought in March & April was actually less than 2021. They just paid more. That’s not good.

The impact of inflation is truly beginning to Hit home. Auto and Gas Stations have no monthly or YTD real growth. Relevant Retail is really down for the 2nd straight month and basically flat YTD. Restaurants have the only positive real numbers. This adds up to real monthly and YTD drops for Total Retail. We are now in Phase II of inflation. Consumer spending increases but the amount bought declines. With 2 straight down months, the Auto Group may be moving into Phase III, when consumers actually cut back on spending. If inflation continues, the situation will only get worse.

  • Relevant Retail: Avg Growth Rate: +9.7%, Real: +6.8%. Only 5 channels were up vs March but 8 were up vs April 2021. This was enough to set an April $ales record but you see the negative impact of inflation in the “real” numbers.
  • All Dept Stores – This group was struggling before COVID, and the pandemic hit them hard. They began to recover in March 2020 and have continued to grow through April 2022. Their YTD numbers turned positive vs 2019 in April but are still down in real terms vs both 2019 & 2021. Avg Growth: +0.3%, Real: -2.3%.
  • Club/SuprCtr/$ – They fueled a big part of the overall recovery because they focus on value which has broad consumer appeal. Inflation is a big factor in their current numbers. While April Sales are up vs 2021 and YTD, their real numbers are down and only 46.5% of their 18.7% lift from 2019 is real. Avg Growth: +5.9%, Real: +2.8%.
  • Grocery – These stores are essential and depend on frequent purchases, so except for the binge buying in 2020, their changes are generally less pronounced. Inflation has hit Groceries hard. Monthly and YTD increases vs 2021 are strong but real sales are actually down and only 28.5% of the growth since 2019 is real. Avg Growth: +6.3%, Real = +1.9%.
  • Health/Drug Stores – At least the drug stores in this group are essential, but consumers visit far less frequently than Grocery stores. Most of their COVID ride has been rather calm. Their inflation rate is low but enough to push April sales down vs 2021. However, 89% of their small 13.5% growth from 2019 is real. Their Avg Growth is: +4.3%, Real: +3.8%.
  • Clothing and Accessories – They were nonessential, and clothes mattered less when you stayed home. That changed in March 2021 and resulted in explosive growth which has continued through 2022. $ are up only slightly from March but they’re positive in all measurements and 92% of growth from 2019 is real. Avg Growth: 4.8%, Real: 4.5%.
  • Home Furnishings – They were also less impacted by COVID. Sales dipped Mar>May in 2020. Then as consumers’ focus turned to their homes, furniture became a priority. Inflation on Furniture is extremely high so all of the real numbers for 2022 are negative and only 36% of their growth since 2019 is real. Avg Growth: +7.2%, Real: +2.7%.
  • Electronic & Appliances – Look at the graph. This channel has problems beyond the pandemic. Sales fell in Apr>May of 2020 and didn’t reach 2019 levels until March 2021. Their sales are down across the board vs 2021. April deflation did help turn their sales positive vs 2019 but only 11% is real. Avg Growth: +0.3%, Real: +0.03%.
  • Building Material, Farm & Garden & Hardware –They truly benefited from the consumers’ focus on home. This year’s spring lift looks to be lower than 2021 and when you factor in strong, double-digit inflation, the amount sold is significantly lower for both April and YTD. 63.6% of their 37.1% sales growth since 2019 is real. Their Avg Growth is: +11.1%, Real: +7.3%.
  • Sporting Goods, Hobby and Book Stores – Consumers turned their attention to personal recreation and sales in Sporting Goods outlets took off. Book and Hobby Stores recovery was slower. YTD sales are up 0.4% but all other measurements are down vs 2021 and last month. Inflation in this group is lower than most groups and most of it comes from Sporting Goods. 78% of their 36.2% growth since 2019 is real. Their Avg Growth is: +10.9%, Real: +8.7%.
  • All Miscellaneous Stores – Pet Stores have been a key part of the strong and growing recovery of this group. They finished 2020 +0.9% but sales took off in March 21. They set a new monthly $ales record in December and now in April. They are #1 in April & YTD lifts vs 2021 and their YTD growth since 2019 is 2nd only to NonStore. Plus, 84% of the 46.1% growth since 2019 is real. Their Avg Growth is: +13.5%, Real: +11.5%.
  • NonStore Retailers – 90% of their volume comes from Internet/Mail Order/TV. The pandemic accelerated the online spending movement. They ended 2020 +21.4%. The growth continued in 2021. In December monthly sales exceeded $100B for the 1st time and they broke the $1 Trillion barrier for the year. Their Growth has slowed in 2022 but all measurements are positive. 90% of their 76% increase since 2019 is real. Their Avg Growth is: +20.7%, Real: +18.9%.

Note: Almost without exception, online sales by brick ‘n mortar retailers are recorded with their regular store sales.

Recap – The Retail recovery from the pandemic was largely driven by Relevant Retail. While the timing varied between channels, by the end of 2021 it had become very widespread. In late 2021 and now in 2022, a new challenge came to the forefront – extreme inflation. It isn’t the worst in history, but it is the biggest increase in prices in 40 years. Moreover, each month it is getting worse. On the surface, the impact is almost invisible. Sales in the total market and in the Relevant Retail group continue to grow but the growth has slowed markedly in April. In our summary of the big groups, we said that the market had entered phase II of strong inflation – spending grows but the amount purchased falls. The channels in the graph above illustrate this perfectly and show how widespread that it has become. 8 of 11 channels are up vs April 2021 and 10 are up YTD. However, when you factor in inflation, only 4 are up for April and 4 for YTD. Inflation is real and there are real and even worse consequences if it continues.

Finally, here are the details of the specific CPIs used to calculate the impact of inflation on retail groups and channels. This includes special aggregate CPIs created with the instruction and guidance of personnel from the US BLS. I also researched data from the last Economic Census to review the share of sales by product category for the various channels to help in selecting what expenditures to include in specific aggregates. Of course, none these specially created aggregates are 100% accurate but they are much closer than the overall CPI or available aggregates.

I’m sure that this list raises some questions. Here are some answers to some of the more obvious ones.

  1. Why is the group for Non-store different from the Internet?
    • Non-store is not all internet. It also includes Fuel Oil Dealers, the non-motor fuel Energy Commodity.
  2. Why is there no Food at home included in Non-store or Internet?
    • Online Grocery purchasing is becoming popular but almost all is from companies whose major business is brick ‘n mortar. These online sales are recorded under their primary channel.
  3. 6 Channels have the same CPI aggregate but represent a variety of business types.
    • They also have a wide range of product types. Rather than try to build aggregates of a multitude of small expenditure categories, it seemed better to eliminate the biggest, influential groups that they don’t sell. This method is not perfect, but it is certainly closer than any existing aggregate.
  4. Why are Grocery and Supermarkets only tied to the Grocery CPI?
    • According to the Economic Census, 76% of their sales comes from Grocery products. Grocery Products are the driver. The balance of their sales comes from a collection of a multitude of categories.
  5. What about Drug/Health Stores only being tied to Medical Commodities.
    • An answer similar to the one for Grocery/Supermarkets. However, in this case Medical Commodities account for over 80% of these stores’ total sales.
  6. Why do SuperCtrs/Clubs and $ Stores have the same CPI?
    • While the Big Stores sell much more fresh groceries, Groceries account for ¼ of $ Store sales. Both Channels generally offer most of the same product categories, but the mix of actual products is substantially different.

Petflation 2022 – April Update: +8.1%, 97.6% of National Inflation Rate

Inflation continues to make headlines. There have been year over year increases in the monthly Consumer Price Index (CPI) larger than we have seen in decades. In April the CPI was up 8.3% vs 2021, only down slightly from 8.5% in March. Food at Home (groceries) prices continue to surge, up 10.8% over 2021. March was +10%. These are the only double-digit YOY monthly percentage increases in this category since 1981. As we have seen in recent years, even minor price fluctuations can affect consumer pet spending, especially in the more discretionary pet segments. With that in mind, we will continue to publish monthly reports to track petflation as it evolves in the marketplace.

Total Pet prices were 4.1% higher in December 2021 than in December 2020, while the overall CPI was up 7.0%. In March 2022, Total Petflation was up +7.5% vs 2021 and the overall CPI was +8.5%. The gap significantly narrowed. In April, Petflation was 8.1%, 97.6% of the national rate of 8.3%. Now, the gap is virtually nonexistent. Let’s look a little deeper. This and future reports will include:

  • A rolling 24 month tracking of the CPI for all pet segments and the national CPI. The base number will be pre-pandemic December 2019 in this and future reports, which will facilitate comparisons.
  • Monthly comparisons of 22 vs 21 which will include Pet Segments and relevant Human spending categories. Plus
    1. CPI change from the previous month
    2. Inflation changes for recent years (20>21, 19>20, 18>19)
    3. Total Inflation for the current month in 2022 vs 2019
    4. Average annual Year Over Year inflation rate from 2019 to 2022
  • YTD comparisons
    1. YTD numbers for the monthly comparisons #2>4 above

In our first graph we will track the monthly change in prices for the 24 months from April 2020 to April 2022. We will use December 2019 as a base number in this and future reports so we can track the progress from pre-pandemic times through an eventual recovery. Inflation is a complex issue. This chart is designed to give you a visual image of the flow of pricing. You can see the similarities and differences in patterns between segments and compare them to the overall U.S. CPI. The current numbers plus those from 12 and 24 months earlier are included as are the yr-end numbers for 2020 & 2021.This will give you some key waypoints for comparisons.

The pandemic began in March but hit home in April. Even the national CPI deflated, but not the Services segments. There are 2 different patterns between the Services and the Products segments. Veterinary and Services prices generally inflated after mid-2020, a pattern similar to the overall CPI. Food and Supplies prices generally deflated until late 2021. After that time, inflation took off. In March the rate of increase over the prior month slowed for Services and Supplies but accelerated for Food and Veterinary. In April, Supplies deflated but the others grew. Here are some things to note:

  • U.S. CPI – The inflation rate was below 2% through 2020. It turned up in January 2021 and continued to grow through April 2022. 89% of the overall 12.5% increase since 2019 occurred in the last 16 months.
  • Pet Food – Prices stayed generally below December 2019 levels from April 2020 to September 2021, when they turned up. There was a sharp increase in December. 88% of the 6.7% total has happened since November.
  • Pet Supplies – Remember that Supplies prices were high in December 2019 due to the added tariffs. They had a “deflated” roller coaster ride until mid-2021 when they returned to December 2019 prices and essentially stayed there until 2022 when they turned sharply up reaching a new all-time pricing high in January, beating the 2009 record. They continued to set new price records in February and March, but prices turned down -0.1% in April.
  • Pet Services – Normally inflation is 2+%. Perhaps due to closures, prices increased at a lower rate in 2020. In 2021 consumer demand increased but there were fewer outlets. Inflation grew in 2021 with the biggest lift coming in Jan>Apr. Inflation got even stronger in 2022, slowed a little in March, then turned up again in April
  • Veterinary – Inflation has always been something that you can count on in Veterinary Services. Prices began moving up in March 2020 and grew consistently through the 2021 recovery. Then a pricing surge began in December which pushed them past the overall CPI with total inflation since 2019 reaching +15.5% in April.
  • Total Pet – The blending of the segment patterns made the Pet Industry appear calm compared to the overall market. That ended in December 2021 as prices surged for all segments. In April inflation grew in all but Supplies.

Next, we’ll turn our attention to the Year over Year inflation rate change for the month of April and compare it to last month, last year and to previous years. We’ve added some human categories to put the pet numbers into perspective.

Overall, Prices vs 2021 were up 8.3% vs 2021 with the Grocery increase now hitting 10.8%. There are some small positives. Only 3 of 9 categories had increases over 1% from last month, down from 5 in March…. And Pet Supplies prices actually fell 0.1% from March. There is a little hope.

  • U.S. CPI – Prices are up 0.6% from last month. In March the increase was 1.3%. Inflation was 8.3%. The targeted rate is <2%. We remain 4 times higher than the “target”. Inflation is getting worse, but the increase rate has slowed.
  • Pet Food – Prices are up 1.2% vs March and 7.0% vs April 2021. They are being measured against a deflationary year, but that increase is more than triple the pre-pandemic 2.2% increase from 2018 to 2019.
  • Food at Home – Prices are up 1.3% from March. The increase from 2021 is 10.8%, which is the largest increase in any month since 11.1% in November 1980 and the largest April increase since 12.3% in 1979. Inflation for this category since 2019 is 27% more than the national CPI.
  • Pets & Supplies – Prices fell 0.1% from a record high in March. Current prices go against deflated prices in 2021 but their increase only trails Food at Home, Veterinary and the Total CPI. Note: They have the lowest increase since 2019
  • Veterinary Services – April prices grew 0.8% from March. This pushed them up 9.8% from 2021, trailing only Food at Home, but more than twice their increase in past years. They stayed on top in the increase since 2019, +18.6%.
  • Medical Services – Prices sharply increased at the start of the pandemic in 2020 but then inflation slowed and returned to a more normal rate in 2021. It appears to be turning up again in 2022.
  • Pet Services – Inflation slowed in 2020 but began to grow in 2021 & 2022. Prices are up 1.7% from March and 5.9% from 2021, down slightly from a record 6.5% increase in February, but still about double the rate of 2019 & 2020.
  • Haircuts & Other Personal Services – Prices are +.4% from March and 5.1% from 2021. They are +15.0% since 2019.
  • Total Pet – Inflation is growing and is 3+ times the rate of last year. Veterinary is a big driver but all segments contributed to the +8.1%, which is almost equal to the 8.3% U.S. CPI. Inflation has caused problems in the past by reducing the frequency of purchase in Supplies, Services and Veterinary. Super Premium Food has been generally immune as consumers are used to paying big bucks and it is needed every day. We’ll see if consumers are still willing to pay the higher prices for more discretionary products and services at the same frequency as they did in the past.

Now here’s a look at Year to Date numbers. How does 2022 compare to previous years…so far?

The increase from 2021 to 2022 is the biggest for 7 of 9 categories. The average annual increase since 2019 is over 3% for all but Pet Food & Pet Supplies. This is due to deflation in 2021.

  • U.S. CPI – The current increase is double the average increase from 2019>2022, but over 4 times the average annual increase from 2018>2021. Inflation is a big problem that started recently.
  • Pet Food – Inflation is growing stronger, especially after deflation in 2021.
  • Food at Home – The 2022 YTD inflation beat the U.S. CPI by 15%. You can see the impact of supply chain issues.
  • Pets & Pet Supplies – Despite an April dip, prices are up sharply in 2022. Although the 2021>22 increase is being measured against a deflationary 2021, it is very significant and 2nd to Veterinary in the Pet Industry segments.
  • Veterinary Services – Has the most inflation since 2019 and is the only segment on the chart in which the inflation rate has consistently grown each year throughout the pandemic and recovery. No matter what, just charge more.
  • Medical Services – Prices went up significantly at the beginning of the pandemic, but the rate has slowed since and has now essentially returned to pre-pandemic levels.
  • Pet Services – February was the largest year over year monthly increase in history. The rate slowed in March but turned up again in April. The current YTD increase remains 2nd only to 6.4% in 2009. Demand has grown for Pet Services while the availability has decreased, a formula for inflation.
  • Haircuts & Personal Services – The services segments, essential & non-essential were hit hardest by the pandemic. After a small decrease in March, prices turned up 0.4% in April. The YTD rate is now down slightly from 2020>21 but still 60% more than 2018>19. Consumers are paying 14.7% more than in 2019. This usually reduces the frequency.
  • Total Pet – When we first looked at the pandemic impact on Petflation. We saw basically two different patterns. Prices in the Services segments continued to increase, and the rate accelerated as we moved into 2021. The product segments – Food and Supplies, were on a different path. They generally deflated in 2020 and didn’t return to 2019 levels until mid-year 2021. Food prices began a slow increase, but Supplies remained stable until we neared yearend. In 2022, everything changed as Food and Supplies prices turned sharply up. In April, the inflation rate grew in all segments but Supplies. This pushed the YTD CPI increase vs 2021 for Total Petflation to 6.4%, 80% of the extraordinarily high 8.0% rate in the overall market. It was only 72.5% of the National rate in March.

Inflation is surging in the Pet Market. Will it impact spending? Let’s put it into perspective. The 6.4% YTD increase in Total Pet is far below the 9.6% record set in 2009 but 4 times larger than the 1.5% avg since then. Although pet spending continues to move to higher income groups, the impact of inflation varies by segment. Supplies is the most affected as many categories are price sensitive. Super Premium Food has become widespread because the perceived value has grown. Higher prices just push people to value shop. Veterinary prices have strongly inflated for years, resulting in a reduction in visit frequency. Spending in the Services segment is driven by higher incomes, so inflation is less impactful. Hopefully, Supplies prices will continue to fall but we’ll just have to wait and see the impact of the strong Petflation.

2020 Pet Supplies Spending was $15.16B – Where did it come from…?

Next, we’ll turn our attention to Pets and Supplies. We’ll see definite differences from Pet Food as the spending in the Supplies segment is more discretionary in nature. There are other factors too. Spending can be affected by the spending behavior in other segments, especially Food. Consumers often trade $ between segments. However, the biggest factor is price. Many supplies categories have become commoditized so pricing changes (CPI) can strongly impact Consumers’ buying behavior in this segment. In the 2nd half of 2016, deflation began, and Supplies started a 24 month spending lift, totaling $4.97B. Prices turned up in mid-2018 due to new tariffs and Supplies $ fell a record -$2.98B in 2019. In 2020 prices fell in the Spring but most Supplies weren’t considered a pandemic necessity, so sales continued to drop, -$1.65B.

Let’s see which groups were most responsible for the bulk of Pet Supplies spending in 2020 and the $1.65B decrease. The first chart details the biggest pet supplies spenders for each of 10 demographic categories. It shows their share of CU’s, share of Supplies spending and their spending performance (Share of spending/share of CU’s). The Age group is different from Total Pet and Food. It’s younger, especially from Food. The categories are presented in the order that reflects their share of Total Pet Spending. This highlights the differences in importance. All 10 of the groups have over a 60% market share. The big difference is we only have 5 groups with performance over 120%, down 2 from 2019. That’s the same as Total Pet but 3 less than Pet Food. Higher income and # of Earners are the 2 most important categories but Supplies spending, unlike Pet Food, is becoming a little more balanced across many demographics.

  1. Race/Ethnic – White, not Hispanic (83.3%) down from (84.6%) This large group accounts for the vast majority of spending in every segment. Their share fell and their performance rating was down from 123.4% to 121.8% but they remain #4, in terms of importance in Supplies Spending. Minority groups account for 31.4% of all CUs but spend only 16.7% of Supplies $. This is actually their biggest share of any category. The drop was less severe for lower income Hispanics and African Americans because they are more focused on essential supplies. Asians actually spent more.
  2. # in CU – 2+ people (79.5%) down from (79.8%) Their Supplies performance was 113.3%, down from 114.3%. All CU sizes but 5+ spent less. Double digit decreases by 2 & 3 person CUs drove down the 2+ CU share and performance. However, all groups but 1 person CU’s still performed above 100%.
  3. Housing – Homeowners (77.7%) up from (76.6%) Homeownership is a big factor in pet ownership and spending in all segments. However, due to an increases in CUs, their performance dropped to 118.0%, from 120.1%,. They stayed in 6th place in terms of importance for increased Pet Supplies spending but dropped out of the 120+% Club. Homeowners w/Mtges spent 0.6% more but Renters and Homeowners w/o Mtges had double digit % decreases.
  4. Area – Suburban + Rural (67.1%) down from (68.0%) All areas but Rural spent less. The Suburban drop was so large that we had to add Rural to the big group in order to reach our 60% goal. Even with this positive addition the new group lost a little share and their performance fell to 106.4%, from 106.7% in 2019.
  5. # Earners – “Everyone Works” (72.8%) up from (70.0%) Their performance grew from 119.6% to 127.0% and they moved up from #7 to #2 in importance. In this group, all adults in the CU are employed. Income and now # Earners is very important in Supplies $. The gains were driven by a big lift by working singles, the only group to spend more.
  6. CU Composition – Married Couples (60.0%) down from (60.9%) Their performance also dropped from 124.6% to 123.7% but they stayed 3rd in importance. Only Married Couples with the oldest child 6>17 and Single Parents spent more. The Married group was driven down primarily by a $1.33B decrease in spending by Couples only and those with at least one child over 18.
  7. Income Over $70K (61.1%) down from (62.6%) Although performance fell from 150.8%, to 140.5%, income is still the most important factor in increased Pet Supplies Spending. The $40>49K group spent 24% more and the $150>199K group was +0.6%, the only increases. The $70K> lost ground because they had a bigger decrease than <$70K. A 4% increase in CUs along with the 2020 movement away from discretionary spending has pushed the performance of this high income group in Supplies down to its lowest level for any industry segment.
  8. Age – 25>54 (61.1%) up from (54.5%) This is a new, younger group as a spending lift by the 25>34 yr-olds pushed their spending past that of the 55>64 yr-olds. The performance level increased to 121.8% from 109.5% but the change in range caused the age category to fall from 2nd in importance to a tie for 4th. Supplies $ traditionally skew towards the younger groups. However, the 65>74 yr-olds also spent more so Supplies spending became more balanced across the age groups.
  9. Education – Associates Degree or Higher (67.5%) down from (67.6%) Higher Education lost market share and their performance level decreased from 121.6 to 117.9%, largely because of an increase in the number of CUs. They fell from 5th to 7th  in importance. The only increases came from the opposite ends of the Education spectrum. The less than High School diploma group spent $0.17B more and those with Advanced College Degrees were +$0.28B.
  10. Occupation – All Wage & Salary Earners (68.0%) up from (65.6%) – The performance of this group was 110.7%, up from 107.5%. Only the 2 highest income segments, Mgrs/Professional & Self-Employed spent more. A big drop in spending by Retirees drove up the share and performance of all wage/salary earners in Supplies spending.

Pet Supplies spending skews younger than both Total Pet and Food. The spending decrease continued in the pandemic  as consumers focused on needs rather than the more discretionary Supplies. They often traded $ as the groups with the biggest increases in Food had the biggest decreases in Supplies $. Also, the drop from 7 to 5 groups with 120+% performance indicates reduced disparity between segments.

Now, we’ll look at 2020’s best and worst performing Pet Supplies spending segments in each category.

Almost all of the best and worst performers are those that we would expect. In Pet Supplies spending, there are only 3 that are different from 2019. That is 3 less than Total Pet and 7 less than Pet Food. It is actually the lowest number for any Industry segment. As we move deeper into the data, we will start to see even more differences between the Industry Segments. Changes from 2019 are “boxed”. We should note:

  • Income matters in Supplies spending.
    • The $150K> was group the top performer in all segments but Food, where $100>149K won. However, this highest income group had its lowest performance level in Supplies.
    • All of the 12 winners for best performance were either 1st or 2nd in income of any segment in the category.
  • Region – The West won again and this year was the only region with performance over 100%. The Midwest replaced the South at the bottom. However, spending was more regionally balanced with the lowest performance at 94.8%.
  • CU Composition – Last year’s winner had an oldest child over 18. Spending skewed a little younger this year. Marriage was the “key”. Only Singles and Single Parents performed below 100%.
  • # in CU – 5+ People CUs was the only size to increase Pet Supplies spending so they earned their spot. Once again, only Singles perform below 100% so in Pet Supplies spending, it still just takes 2.

It’s time to “Show you the money”. Here are segments with the biggest $ changes in Pet Supplies Spending.

In 2019, Tarifflation caused a record $2.98B drop in Supplies spending. 2020 brought the pandemic and pet parents focused on “needs” so the more discretionary Supplies segment fell $1.65B. In the chart, there are 7 repeats from 2019 – 2 winners and 5 losers. 2 segments switched from last to first or vice versa. This is far less turmoil than last year when there were only 2 repeats but 9 “flips”. There is another improvement. In 2019 all segments in 9 of 12 categories spent less. In 2020, there was only 1 – Regions. Back in 2017, the good old days, every segment in 10 categories increased spending. In the 1st year of the pandemic the spending decline has slowed but not stopped. Here are the specifics:

  • Age – Only the 25>34 and 65>74 groups spent more.
    • Winner – 25>34 yrs – Pet Supplies Spending: $2.80B; Up $0.62B (+28.3%)               2019: <25 yrs
    • Loser – 55>64 yrs – Pet Supplies Spending: $2.73B; Down -$1.26B (-31.5%)              2019: 35>44 yrs
    • Comment: The 45>64 yr olds spent $1.71B less on Supplies.
  • Occupation – Managers & Professionals flipped from last to first.
    • Winner – Managers & Professionals – Pet Supplies Spending: $5.65B; up +$0.52B (+10.1%)        2019: Blue Collar
    • Loser – Retired – Pet Supplies Spending: $1.90B; Down -$0.56B (-22.7%)                                           2019: Mgrs/Professionals
    • Comment – Only Self-Employed and Managers & Professionals spent more. All other occupational groups and Retirees had double digit percentage decreases and their spending fell at least $0.5B.
  • # in CU – The winner flipped from the smallest CUs to the largest.
    • Winner – 5+ People – Pet Supplies Spending: $2.02B; Up +$0.38B (+23.3%)                              2019: 1 Person
    • Loser – 2 People – Pet Supplies Spending: $5.43B; Down -$0.97B (-15.1%)                                 2019: 2 People
    • Comment: Only 5+ CUs spent more. 2 person CUs stayed at the bottom. Their Supplies spending has fallen $2.5B, -31.5% since 2018. That’s 54% of the total 2018>2020 spending drop for the Supplies Segment.
  • Area Type– Another big change – Rural won this year. Last year it was Center City. Big Suburbs stayed at the bottom.
    • Winner – Rural – Pet Supplies Spending: $1.40B; Up +$0.33B (+30.3%)                                           2019: Center City
    • Loser – Suburbs 2500> – Pet Supplies Spending: $6.59B; Down -$0.85B (-11.4%)                         2019: Suburbs 2500>
    • Comment – In 2019, all segments spent less. In 2020, only Rural Areas spent more.
  • Education – Advanced College Degrees won, a big flip from the 2019 winner – less than High School grads.
    • Winner – Advanced College Degree – Pet Supplies Spending: $4.08B; Up +$0.28B (+7.5%)           2019: < HS Grads
    • Loser – BA/BS Degree – Pet Supplies Spending: $4.52B; Down $0.82B (-15.4%)                                2019: BA/BS Degree
    • Comment – BA/BS Degrees repeated as loser. In 2019, all segments spent less. In 2020, Advanced Degrees and those without a High School diploma spent more. Everyone in between spent less.
  • # Earners – 1 Earner, Single kept their spot at the top.
    • Winner – 1 Earner, Single – Pet Supplies Spending: $2.38B; Up +$0.26B (+12.3%)                  2019: 1 Earner, Single
    • Loser – 2 Earners – Pet Supplies Spending: $6.59B; Down -$0.92B (-12.3%)                              2019: 1 Earner, 2+ CU
    • Comment – Income is a big factor and the # of Earners is becoming more important. In 2020 only 1 Earner, Single CUs spent more. The “Everyone Works” group grew in share and performance because they had a smaller decrease than CUs where not all adults were employed.
  • Income – For the 2nd consecutive year, the winner was below the average CU income level but the gain was small.
    • Winner – $40>49K – Pet Supplies Spending: $1.27B; Up +$0.25B (+24.9%)                               2019: $30>39K
    • Loser – $70 > 99K – Pet Supplies Spending: $2.32B; Down -$0.54B (-19.0%)                              2019: $50>69K
    • Comment – The $100>149K group also spent a little more, +0.01B (+0.6%). Everyone else spent less. The over $70K group continues to generate over 60% of Supplies $. However, the biggest spenders continue to be the biggest losers as their % drop was twice that of the <$70K group.
  • CU Composition – Married Couples Only flipped from 1st to last n 2019. In 2020 they held on to the bottom spot.
    • Winner – Married, Oldest Child 6>17 – Supplies: $2.36B; Up $0.22B (+10.1%)                    2019: Married, + Adults, No Kids
    • Loser – Married, Couple Only – Supplies: $3.70B; Down -$0.80B (-17.8%)                             2019: Married, Couple Only
    • Comment – Single Parents also had a small spending increase. Married Couples Only are definitely the big losers. They account for 24% of Supplies $. Their spending from 2018>2020 is -$2.35B, 51% of Supplies’ Total decrease.
  • Generation – Millennials held their spot at the top for the 3rd consecutive year.
    • Winner – Millennials – Supplies: $4.12B; Up +$0.20B (+5.2%)                                                    2019: Millennials
    • Loser – Baby Boomers – Supplies: $4.41B; Down $1.49B (-25.3%)                                              2019: Gen X
    • Comment – This win by Millennials was driven by the 25>34 group. Gen X turned it around with a small 0.4% increase. All other generations, younger and older, spent less.
  • Housing – The 2nd and last flip as Homeowners w/Mtge moved from last to first.
    • Winner – Homeowner w/Mtge – Supplies: $8.35B; Up +$0.05B (+0.6%)                                2019: Renter
    • Loser – Homeowner w/o Mtge – Supplies: $3.43B; Down -$1.14B (-25.0%)                           2019: Homeowner w/Mtge
    • Comment – Renters also had a double digit % decrease in Supplies $. Some of the $ saved by Homeowners w/o Mtges on Supplies went toward funding their huge increase in Pet Food spending.
  • Race/Ethnic – Asian Americans are truly a surprise winner.
    • Winner – Asian Americans – Supplies: $0.40B; Up +$0.04B (+10.7%)                                     2019: African Americans
    • Loser – White, Not Hispanic – Supplies: $12.63B; Down $1.60B (-11.2%)                               2019: White, Not Hispanic
    • Comment – Although their share of Pet Supplies $ has fallen from 86.3% in 2018 to 83.3%, White, Not Hispanics still drive this discretionary segment. They have the highest % of pet ownership and the second highest income. The interaction of these two factors is very clear in the Racial/Ethnic category. Whites have the most to lose and they did. Asians have the highest income. A 64¢/Month spending increase on Supplies wouldn’t even be noticed.
  • Region – Both the winner and loser are new.
    • Winner – Midwest – Pet Supplies Spending: $3.06B; Down -$0.11B (-3.4%)                            2019: Northeast
    • Loser – West – Pet Supplies Spending: $3.90B; Down -$0.76B (-16.3%)                                     2019: South
    • Comment – In 2018, all regions spent more on Supplies. In 2019 they all spent a lot less. In 2020 the decreases for the Midwest and South were minimal but all Regions again spent less. They were the only Demographic Category in 2020 in which all segments decreased spending on Supplies.

We’ve now seen the winners and losers in Pet Supplies Spending $ for 12 Demographic Categories. In 2020, the pandemic priorities caused the spending decline which began in 2019 to continue. However, things got a little better. In 2019, only 3 of 96 segments had increases and 9 of 12 categories had no segments that spent more on Supplies. In 2020, 18 segments spent more and only 1 category had no segments with an increase. In performance, we saw many expected winners and 10 of 12 were the same as 2019. However, not every good performer can be “the” winner and some of these “hidden” segments should be recognized for their performance. They don’t win an award, but they deserve…

HONORABLE MENTION

In 2019, all numbers from these segments were negative. In 2020, 5 are positive but all merit some recognition in a tough, pandemic year. Most are unexpected and a very eclectic mix. Those without a High School diploma had a good year, including in Pet Supplies. Single Parents are perennial losers. In 2020 they demonstrated that they are also committed to their Pet Children. 2020 was the year of “bosses”, especially self-employed. They spent more in every industry segment and had the largest increase of any occupation in Total Pet Spending. In many categories the Pet Supplies spending leaders were virtual opposites. Age was one of these as the 65>74 yr-olds stood with the 25>34 yr-olds in spending more on Supplies. The high income $150>199K is certainly no surprise. Their increase is truly minimal, but they were the only income segment other than $40>49K group to post an increase in Supplies $. That brings us to Married Couples w/Other Adults but No Kids. They didn’t quite make it to the plus side but were very close. 2020 was a bad year for Pet Supplies. However, it was a slight improvement over 2019.

Summary

While Pet Food spending has shown a definite pattern, Pet Supplies have been on a roller coaster ride since 2009. Many Supplies categories have become commoditized and react strongly to changes in the CPI. Prices go up and spending goes down…and vice versa. Supplies spending has also been reactive to big spending changes in Food. Consumers spend more to upgrade their Food, so they spend less on Supplies – trading dollars. We saw this in 2015. In 2016 the situation reversed. Consumers value shopped for Food and spent some of the “saved” money on Supplies.

That brought us to 2017. Both Supplies and Food prices deflated while the inflation rate in both of the Services segments dropped to lows not seen in recent years. Value was the “word” and it was available across the market. Perhaps the biggest impact was that the upgrade to super premium Food significantly penetrated the market. This could have negatively impacted Supplies Spending, but it didn’t. Supplies’ spending increased in 93% of all demographic segments.

2018 started out as expected with a $1B increase in Supplies and a small lift in Food. Then the government got involved. In July the FDA issued a warning on grain free dog food and spending dropped over $2B. New tariffs were implemented on Supplies and spending flattened out then turned down $0.01B in the 2nd half. Because of shipping timing, the full retail impact of Tariffs was delayed until 2019 when spending fell -$2.98B, affecting 97% of all demographic segments.

Among the demographic categories in which a consumer has some control, Higher Income & Marriage are still very important while Homeownership and Higher Education lost ground. In 2020 Income stayed on top and # of Earners and being a “boss” grew in importance. Supplies Spending also skewed a little younger.

The 2019 decline due to Tarifflation slowed but continued in 2020. 88% of the best/worst performers in 2019 kept their position in 2020. The pandemic caused consumers to focus on needs. That resulted in big spending lifts for Food and Veterinary and big drops in Supplies and Services. Pet Parents traded $. The best illustration of this is that 8 of the 12 segments with the biggest decrease in Supplies $ had the biggest increase in Food and/or Veterinary $. Some good news is that Supplies spending became more balanced. The performance gap between best and worst narrowed by 10.25%.

Prices are still important in Supplies $. They deflated in the spring of 2020 and stayed down until Mid-yr 2021 when they turned up again. We’ll see how this trend impacted spending in the more normal environment of 2021.

Finally – The “Ultimate” Pet Supplies Spending CU consists of 5 people – a married couple, with an oldest child over 18. They are 45>54 yrs old. They are White, but not of Hispanic origin. At least one has an Advanced Degree. Both of them work in their own business and one child just started a part time, after school job. They’re doing well with an income over $200K. They live in a small suburb, adjacent to a big city in the Western U.S. and are still paying off their mortgage.

2022 Retail Sales Revisited – The Impact of Runaway Inflation

Inflation continues to make headlines as the prices for many products have risen over 2021 at the highest rate in 40 years. In recent years, the year over year inflation rate has hovered at about 2%. That’s why the March inflation number of 8.5% over 2021 has gotten so much attention.

It got my attention too. I decided to look a little closer at the expenditure categories and the methodology used by the US Bureau of Labor Statistics to compute the CPI (Inflation). I am also enamored by the Monthly Retail Sales report produced by the Census Bureau. This is the most accurate and timely measurement of the sales in the U.S. Retail market. However, we must note that the data only comes from outlets classified as retailers or restaurants & bars. Outlets whose primary business is Services, from Movie Theaters to Hair Salons, are not included. They have their own report. The outlets in the Monthly Retail report are “all about” products. A few of these channels may provide a small number of services but in the overall scheme of things the $ are inconsequential. Pet Stores are one of the retail outlets included in the report and they offer Pet Services. However, according to the most recent Economic Census, Pet Services only account for 6% of Total Pet Stores’ sales. The vast majority of true Retail outlets offer no services.

So how is the CPI market basket divided between Commodities (Products) and Services? The relative importance of expenditures is validated from data gathered in the annual Consumer Expenditure Survey, which is managed by the US BLS but executed by Census Bureau personnel. The base relative importance is updated every 2 years in December of odd numbered years. It is revised monthly, but the base is the key starting point.

In December 2021 The Relative Importance was

      Total CPI: 100;  Services: 60.9;  Commodities: 39.1

I was taken by surprise by these numbers. I had no idea that Services were 50% more important than Commodities in measuring inflation. Let’s look at the March 2022 year over year inflation numbers again:

     Total CPI: +8.54%;  Services: +5.12%;  Commodities: +14.17%

Obviously, for those involved in the retail trade, inflation is significantly worse than even what is being trumpeted in the headlines. Much has been said about overall inflation being the worst in 40 years. I downloaded the CPI data for Commodities. They have monthly numbers going back to 1956. The 14.17% YOY inflation rate in March was the highest for any month in the entire 66-year database. Another thing is very clear. Just using the overall CPI rate for retail is not accurate. I researched commodities and it turns out that the All Commodities aggregate accurately reflects Total Retail. At the end of the report, I have a condensed listing of CPI expenditure categories so that you can check my reasoning.

But now let’s take a look at 2022 Total Retail Sales, including the 4 Major Groups – Restaurants, Auto, Gas Stations and Relevant Retail. We show the sales change from 2021 for each month and YTD.

As we hear in all the news flashes. Despite inflation, sales are up. The gains by Gas Stations and Restaurants are spectacular but remember they were the hardest hit by the pandemic and recovery came late. You can also see that the overall increase slowed significantly in March. Gas Stations maintained their rate of increase but Auto actually had a slight decrease in Sales. The YTD numbers look good for all.

Now let’s see what inflation looks like so far this year.

Before we get into the numbers, let’s talk about the expenditure categories that I used. We talked about All Commodities being a match for Total Retail. There are also 2 existing indexes that match 2 of the big groups. Motor Vehicles & Parts is a perfect match for Auto and Gas Stations are all about Motor Fuel Sales. The other 2 aggregates were created by me with the detailed help, guidance and approval of a great person at the US BLS. For Restaurants, I aggregated Food & Alcohol away from home. For Relevant Retail I removed the categories linked to Restaurants, Auto and Gas Stations from the All Commodities Group.

The numbers are concerning. Inflation in the Services segment is high, but nothing compared to Auto & Gas. Relevant Retail is much better than All Commodities but about equal to the national numbers which are so scary. Now, let’s apply inflation to the sales numbers. This will give us a measurement of the amount of product sold, not just $.

I can’t recall ever seeing such a radical difference. It’s hard to believe that we are talking about the same products being sold in the same outlets over the same period of time. March 2022 was the worst monthly Commodity inflation in history…or at least in the last 66 years. The impact is very clear across the board but anything to do with cars has been down in the amount sold every month this year. Restaurants is the only group doing well but they’re still recovering. For Relevant Retail, the March price explosion turned real sales negative for March and dropped the YTD sales increase down to +1.2%. March Real sales for Total U.S. Retail were also down but YTD actually turned negative too. I don’t know what to say but whatever that can be done, needs to be done … right now!

There is one faint glimmer of hope. In my research, I found that the months with the 3 worst average YOY Commodity inflation rates are March, February & January, in that order. An immediate turn around won’t happen but hopefully, the worst is over.

Now, as promised here is a condensed list of CPI Expenditure Categories. The highlighting shows how I matched the commodity categories with the big groups. If you look very closely, you will see fuel oil as a category is included in both Total & Relevant Retail. That might raise some questions. However, if you look at the NAICS codes for Retail Businesses, you’ll see that the company that delivers propane to your farm is classified as a Non-Store Retailer, just like internet businesses.

Take a look. Let me know if you see any expenditure categories that if aggregated, would be a better CPI match for an important retail channel.

2020 Pet Food Spending was $36.84B – Where did it come from…?

As we continue to drill ever deeper into the demographic Pet spending data from the US BLS, we have now reached the level of individual Industry segments. We will start with Pet Food, the largest and arguably most influential of all. We have previously noted the trendy nature of Pet Food Spending. In 2018 we broke a pattern which began in 1997 – 2 years up then spending goes flat or turns downward for a year. We expected a small increase in 2018 but what we got was a $2.27B decrease (-7.3%). This was due to the reaction to the unexpected FDA warning on grain free dog food. A pattern of over 20 years was broken by 1 statement. The grain free warning lost some credibility and spending rebounded in 2019, +$2.35B (+7.1%). In 2020 the market was hit by an even bigger outside influence – the pandemic. The impact varied by segment. In Pet Food, it created a wave of panic buying out of fear of shortages, resulting in a $5.65B (18.1%) lift.

First, we’ll see which groups were most responsible for the bulk of Pet Food spending and the $5.65B increase. The first chart details the biggest pet food spenders for each of 10 demographic categories. It shows their share of CU’s, share of pet Food spending and their spending performance (Share of spending/share of CU’s). 3 groups are different from Total Pet – 45>74, < College Grads & the newly created “I’m the Boss” group. The categories are presented in the order that reflects their share of Total Pet Spending. There is one big difference. In 2020 Pet Food spending, older age produced a higher share than higher income. While higher Income performed better in Food, it finished 2nd in importance to being “a boss”. The importance of higher education also plummeted. While Pet ownership is widely spread across demographic segments, in 2020 Pet Food spending was much more targeted in virtually all categories. As you will see in our analysis, that target was older, less educated but still with a high income – younger Baby Boomers. In 2019, Pet Food accounted for 65% of Pet Products $ and 40% of Total Pet. In 2020 the Food share rose to 70.8% in Products and 44.0% of Total Pet. The pandemic caused Pet Parents to focus on “needs” and at the top of that list was Pet Food.

  1. Race/Ethnic – White, not Hispanic (88.8%) – up from 87.0%. This large group accounts for the vast majority of spending in every segment. They gained in share and their performance increased to 129.9% from 126.9%, but this category fell from #4 to #6 in terms of importance in Pet Food Spending demographic characteristics. While Hispanics, African Americans and Asian Americans account for 31.6% of U.S. CU’s, they spend only 11.2% of Pet Food $. This is down from 17% in 2018. African Americans were the only minority to spend more on Pet Food in 2020, +0.5B which generated a $0.06B, lift for all minorities, about 1% of the +$5.6B increase by White, Not Hispanics.
  2. Housing – Homeowners (86.7%) – up from 81.9%. Homeownership is a huge factor in pet ownership and more pet spending. In 2020, homeowners gained allmost 5% in share and their performance grew from 128.5% to 131.7%. However, homeownership fell from 3rd to 5th in terms of importance for increased pet Food spending. It was a great year for Homeowners w/o a mortgage but spending fell for renters and especially for those with a mortgage.
  3. # in CU – 2+ people (82.5%) – up from 80.2%. The share of market for 2+ CU’s is over 80% for Pet Food and Total Pet. Last year they had 80+% in only Pet Food. Their performance grew from 114.9% to 117.5% but their rank fell from 6th to 9th. 5+ CUs were the only segment to increase in number and 4 person CUs drove the lift. Only CUs of 4 or more people performed above 100%. This is a big change from recent years. Singles performance also fell sharply, which helped drive the 2+ group’s increase. In 2020, more people meant more Pet Food spending.
  4. Area – Suburban + Rural (77.8%) up from 75.5%. Their performance grew from 118.6% to 123.4%. (7th) It was a bad year for large Suburbs (2500>) and a great year for Rural. We had to add the Rural and Suburban numbers together to reach our target of 60+%. Areas under 2500 population now account for 18.9% of CUs but 47.6% of Pet Food $.
  5. # Earners – “Everyone Works” (70.7%) – up from 66.4%. This was a big increase from last year and their performance also grew sharply from 113.6% to 123.3%. They only rank 8th but they now are in the 120+% club.
  6. CU Composition – Married Couples (71.1%) – up from 63.0%. They gained in share and their performance grew from 129.0% to 146.6%, but they fell from 2nd to 3rd. Only Married couples with an oldest child over 6 spent more.
  7. Income – Over $70K (65.3%) – up from 60.9%. Their performance rating also grew from 146.9% to 150.2% but they fell from 1st to 2nd in importance. High income is still very important in Pet Food Spending. In fact, the bar was raised in 2020. $100K+ CUs now account for 55% of Pet Food $. In 2019 their share was 42%. The $70>100K group had a bad year and other factors like occupation came to the forefront in the pandemic. Pet ownership is common across all income levels but in 2020 higher income remains critically important in Pet Food Spending.
  8. Age – 45>74 (68.6%) – up from 62.6%. This older group replaced 35>64 yr-olds and their performance grew from 124.3% to 132.2% so the “Age” category ranked #4 in importance. 45>64 is in both groups and 55>64 was the big driver. The change came because the 65>74 share grew from 15.7% to 16.1% while 35>44 fell from 16.0% to 11.9%.
  9. Education – Less than College Grads (57.9%) – up from 50.4%. Higher Education continues to fall in importance in Pet Food Spending as those without a degree gained share and their performance grew from 90.6% to 108.7%. Higher education, specifically a college degree, is now the least important factor in increased Pet Food Spending.
  10. Occupation – I’m the Boss – Mgrs/Profess/Self-Employed (58.5%) – up from 38.7% – Spending by Blue Collar workers and lower level White Collar workers fell while the spending by the “Bosses” took off. Their performance grew from 123.2% to 175.1% and amazingly moved Occupation to the top spot in Pet Food Spending importance.

Only 7 of the big spenders for Pet Food are the same as those for Total Pet and they generally performed better in Food. This is a marked contrast from past years. In 2020, Pet Food Spending grew $5.65B and all 7 of the matching groups gained in both share and performance. Pet Food spending became much less balanced which is best illustrated by the need for 3 new big groups and the fact that the performance of 8 of the groups exceeds 120%.

Now, we’ll look at 2020’s best and worst performing Pet Food spending segments in each category.

Many of the best and worst performers are the ones that we would expect but 2020 produced some surprise winners – <College Grads, Homeowners w/o Mtges, Married, Oldest Child 6>, 4 People CUs, and 1 surprise loser – College Grads. There are 10 that are different from 2019. This is 3 more than last year and 4 more than for Total Pet this year. Changes from 2019 are “boxed”. We should note:

  • Income is important in every segment, but the Food winner makes less than the winner in other segments. However, the Food segment’s influence is so strong that it pushed the Total Pet winner down to $100>149K.
  • Occupation – Service Workers replaced Retirees at the bottom, but you still see the importance of Income in Food.
  • Age – The 55>64 yr olds (high income “Boomers”) returned to the top but the <25 group stayed on the bottom.
  • Education – In 2020, having a College Degree truly did not matter in Pet Food Spending.
  • Housing – Owning a home is always important. In 2020, some of the extra $ available from having a paid off mortgage were used to spend more on Pet Food.
  • CU Composition – Married, Couples Only had won for 5 years in a row. Now, having older kids is more important.
  • CU Size – 2 Person CUs used to be the perennial winner. Last year it was 3 people and in 2020 it moved up to 4.
  • Generation – Boomers remain the best performers in Pet Food, but the youngest replaced the oldest at the bottom.

It’s time to “Show you the money”. Here are segments with the biggest $ changes in Pet Food Spending.

There are just 3 repeats from 2019 so 21 of the 24 segments (88%) are new, including 5 that flipped from 1st to last or vice versa. The winner and loser in Education and Housing are surprising but the biggest trend to note is the size of the increases in the winners. This shows the overall increase in Pet Food spending in 2020 was not widespread like 2019 but rather driven by very specific groups. Here are the specifics:

  • Housing – Homeowners w/Mtges flipped from first to last.
    • Winner – Homeowners w/o Mtge – Food: $17.18B; Up $8.98B (+109.4%)               2019: Homeowners w/Mtge
    • Loser – Homeowners w/Mtge – Food: $14.75B; Down $2.60B (-15.0%)                     2019: Renters
    • Comment – Renters also spent less so the Food increase came solely from Homeowners with a paid off mortgage. However, it wasn’t driven by Retirees. 90% of the increase in Food $ came from those still working.
  • Region – The 2019 winner and loser flipped positions.
    • Winner – Midwest – Pet Food Spending: $15.72B; Up $8.70B (+123.9%)                          2019: South
    • Loser – South – Pet Food Spending: $9.19B; Down $2.84B (-23.6%)                                   2019: Midwest
    • Comment – Last year all regions spent more. This was the 3rd consecutive year in which the spending change, whether up or down, was the same for all regions. In 2020, that pattern changed as only the Midwest and West spent more.
  • Income – The income winner continues to trend down. $100>149K group won. In 2019, it was the $150>199K group.
    • Winner – $100 to $149K – Pet Food Spending: $14.38B; Up $8.46B (+142.9%)                 2019: $150 to $199K
    • Loser – $70 to $100K – Pet Food Spending: $3.75B; Down $2.15B (-36.4%)                        2019: $30 to $39K
    • Comment – Truly a spending rollercoaster: <$40K: +$1.52B;$40>99K:-$3.07B;$100>149K:+$8.46K; $150>199K: -$1.68B;$200K>: +$0.43B.
  • CU Composition – CU’s with Children, especially older children, came to the forefront.
    • Winner – Married, Oldest Child 18> – Food: $11.74B; Up $8.44B (+256.1%)                 2019: Married, Couple Only
    • Loser – 2+ Adults, No Kids – Food: $3.20B; Down $1.55B (-32.6%)                                  2019: Single Parents
    • Comment – In 2019, 85% of the increase came from all adult CUs – Singles & 2+ CUs, married or unmarried – just no kids. In 2020, the spending behavior essentially flipped. Singles again spent more but overall, CUs with kids, including Single Parents, spent $8.81B more while all adult CUs with no kids spent $3.16B less.
  • Occupation – Self-Employed won for the 3rd consecutive year.
    • Winner – Self-Employed– Pet Food Spending: $11.29B; Up $7.91B (+234.2%)                  2019: Self-Employed
  • Loser – Tech, Sales, Clerical – Pet Food Spending: $2.99B; Down $2.52B (-45.8%)                      2019: Retired
    • Comment – Those with more control, Self-Employed, Managers & Professionals and Retirees, spent more. With the exception of Service Workers, who spent 1.8% more, all other occupations, blue and white collar, spent less.
  • # in CU – After 2 straight wins, 3 People CUs was replaced at the top by 4 person CUs.
    • Winner – 4 People – Pet Food Spending: $11.56B; Up $7.61B (+192.8%)                         2019: 3 People
    • Loser – 2 People – Pet Food Spending: $10.77B; Down $2.00B (-15.7%)                          2019: 5+ People
    • Comment: Although Singles again had an increase, the movement to larger CUs continues as 4+ CUs spent $9.3B more. The previously magic “2” number continues to decline.
  • Area Type – In 2020, driven by Rural, the lower population areas continued to spend more.
    • Winner – All Areas <2500 – Pet Food Spending: $17.54B; Up $7.20B (+69.7%)                    2019: Suburbs <2500
    • Loser – Suburbs 2500> – Pet Food Spending: $11.12B; Down $2.11B (-15.9%)                     2019: Center City
    • Comment – Only Cities with a population above 5 million and areas with a population under 2500 spent more. The larger Suburbs, 2500+ people, took the biggest hit, -$2.11B. Their share of Pet Food $ fell from 42% to 30%.
  • Age – The highest income group, 45>54 flipped from the top to the bottom.
    • Winner – 55>64 yrs – Pet Food Spending: $14.63B; Up $7.09B (+94.0%)                                2019: 45>54 yrs
    • Loser – 45>54 yrs – Pet Food Spending: $5.45B; Down $1.63B (-23.1%)                                  2019: <25 yrs
    • Comment: Although the 55>64 yr olds drove almost all of the increase, there was another spending rollercoaster. <25: -$0.37B; 25>34: +$0.87B; 35>54: -$2.24B; 55>74: +$7.41B; 75>: -$0.02B.
  • Generation – Boomers are back on top, while Gen X flipped from 1st to last.
    • Winner – Baby Boomers – Pet Food Spending: $19.31B; Up $6.75B (+53.7%)                        2019: Gen X
    • Loser – Gen X – Pet Food Spending: $8.29B; Down $1.73B (-17.3%)                                          2019: Born <1946
    • Comment – Much of the Pet Food spending lift was an emotional reaction to the pandemic so it is not surprising that Boomers, the 1st pet parents, led the way. Another rollercoaster – Gen Z, Gen X and those born before 1946 all spent less while Millennials and Boomers spent more.
  • Education – Higher education has been becoming less important in Pet Food spending. The trend continues.
    • Winner – <College Grad – Food Spending: $21.33B; Up $5.61B (+35.7%)                             2019: HS Grads
    • Loser – BA/BS Degree – Food Spending: $7.75B; Down $0.40B (-4.9%)                                2019: <HS Grad
    • Comment – Driven by those with an advanced degree, College Grads did spend $0.04B more. However, almost all of the 2020 spending lift came from those without a degree.
  • Race/Ethnic – White, Not Hispanic kept their position at the top.
    • Winner –– White, Not Hispanic – Pet Food Spending: $32.73B; Up $5.58B (+20.6%)           2019: White, Not Hispanic
    • Loser ––- Asians – Pet Food Spending: $0.43B; Down $0.27B (-38.4%)                                    2019: Hispanic
    • Comment – The U.S. is slowly becoming more racially/ethnically diverse but White, Not Hispanic is still by far the biggest spender in every Pet Industry Segment. In 2020 their share of Food spending hit 88.8%, the largest in any segment. African Americans also spent more on Pet Food in 2020, but Asians and Hispanics spent less.
  • # Earners – 2 Earner CUs kept their place at the top and accounted for 94% of the Pet Food Spending lift.
    • Winner –– 2 Earners – Pet Food Spending: $18.28B; Up $5.30B (+40.8%)                               2019: 2 Earners
    • Loser – No Earner, 2+ CU – Pet Food Spending: $2.48B; Down $0.28B (-10.3%)                    2019: 1 Earner, 2+ CU
    • Comment – As we have seen, an income over $100K is important as it occupation. While everyone works CUs now perform above 120%, the real key to increased Pet Food spending is having 2 or more earners.

We’ve now seen the “winners” and “losers” in terms of increase/decrease in Pet Food Spending $ for 12 Demographic Categories. 1n 2019, the rebound lift from the FDA warning was widespread. In 2020, the big spending lift due to the pandemic occurred in very specific segments. Most of America remains firmly committed to high quality Pet Food. However, super premium Food comes with high prices, so income has grown in importance in Pet Food spending. I suspect that the internet and value shopping will become even more important in this segment. We have identified the winning segments in performance and $ increase but they were not alone. Not every good performer can be a winner. Some “hidden” segments should also be recognized for performance. They don’t win an award, but they get…

HONORABLE MENTION

5+ Person CUs came in 2nd to 4 person CUs but this is also representative of the movement in food spending to larger CUs. Single Parents have the lowest performance in the category, but it is improving. African Americans have the lowest income and lowest percentage of pet ownership, but they are still committed to the wellbeing of their Pet Children. In recent years, Millennials have led the way in Pet Food spending trends. Their behavior was then followed by their Boomer parents. In 2020, the situation was reversed as many got on board with the move by the older group. Managers and Professionals have very high income and often lead the way in spending trends, especially in the era of super premium foods. In 2020, they finished second behind the incredible lift by the self-employed group.

Summary

Pet Food has been ruled by trends over the years. The drop in 2018 due to the FDA grain free warning broke a pattern of 2 years up followed by 1 year of flat or declining sales which had been going on since 1997. This trendy nature increased with the first significant move to premium foods in 2004. The Melamine crisis in 2007 intensified the pattern and resulted in a series of “waves” which became a tsunami with the introduction of Super Premium Foods.

The 25 to 34 yr old Millennials were the first to “get on board” with Super Premium in the second half of 2014. In 2015 a substantial portion of consumers began to upgrade to this new trend. The result was a $5.4B spending increase. These consumers were generally more educated, often worked as managers or were self-employed and had higher incomes. One negative was that they often paid for the upgrade by spending less in other segments. In 2016 the anticipated drop in spending happened. The “upgraded” group began value shopping for their new food and found great deals online and in some stores. They spent some of the $3.0B “saved” Food dollars in other segments but not enough to make up for the drop in Food. Total Pet Spending was down $0.46B. In 2017 we were ready for a new “wave”. Thanks to a very price competitive market, what we got was a deeper penetration of Super Premium foods. This group of upgraders was mostly middle-income, not college educated and often Blue-collars workers. Most also were in the 55>64 year old age group. The result was a $4.6B increase but this time there was no trading $ with other segments.

In 2018 we were “due” a small annual increase in Pet Food and spending in the first half was up $0.25B. Then the bottom dropped out as spending fell $2.51B in the second half in reaction to the FDA warning on grain free dog food. It turned out that the big decrease in pet food spending came directly from the groups who had fueled the big 2017 increase. This turmoil was illustrated by the fact that 71% of the demographic groups with the biggest change in Pet Food $ switched from first to last or vice versa from their position in 2017.

That brought us to 2019. The impact of the FDA warning faded as there was little evidence to back it up. Pet Parents either returned to Super Premium or chose even higher priced options. Supplement $ also grew as the health and wellbeing of their Pet Children remained the #1 priority. Pet Food $ grew $2.35B with 75% of demographic segments spending more. Education became less important but income and related categories mattered more. Pet Food Spending became a little less demographically balanced in 2019 and the 2020 Pandemic accelerated this trend. Fear of shortages led to binge buying and a $5.65B increase. This behavior was driven by very specific groups, including 55>64 yr old Boomers, Self-Employed & Managers, Homeowners w/o Mtges, $100>149K incomes and less populated areas. This spending disparity was manifested in the fact that the performance of 8 of 10 big spending groups exceeded 120% while 49% of all segments spent less. The retail market strongly recovered in 2021. We’ll see if/how this impacted Pet Food $.

Finally – 2020’s “Ultimate” Pet Food Spending CU is 4 people – a married couple, with at least 1 child over 18. They are 55>64 years old and White, but not of Hispanic origin. Neither graduated from college but they both work in their own business. They earn $100>$150K but have paid off the mortgage on their house in a rural area in the Midwest.