2024 Pet Products Spending was $63.95B – Where did it come from…?
We looked at the Total Pet Spending for 2024 and its key demographic sources. Now we’ll start drilling down into the data. The first stop in our journey of discovery will be Pet Products – Pet Food and Supplies. These are the industry segments that are most familiar to consumers. They are stocked in over 200,000 outlets, plus the internet. Every week over 19,900,000 households buy food and/or treats for their pet children. Pet Products accounted for $63.95B (53.8%) of the $118.87B in Total Pet $ in 2024. This was down -$4.57B (-6.7%) from the $68.52B that was spent in 2023. However, inflation in 2024 was only 0.2% so the “real” drop was -6.9%. Pet Food had a huge drop after the record increase in 2023. Supplies also has been on a spending rollercoaster. After falling in 2020, there was a record surge in 2021. Spending fell in 2022, but there were small lifts in both 2023 & 2024.
Overall, in 2024 Pet Food spending fell -$5.46B while Supplies spending increased $0.89B. We’ll combine the data and see where the bulk of Pet Products spending comes from.
We will follow the same methodology that we used in our Total Pet analysis. First, we will look at Pet Products Spending in terms of the 10 demographic category groups that were responsible for 60+% of Total Pet spending. Then we will look for the best and worst performing segments in each category and finally, the segments that generated the biggest dollar gains or losses in 2024.
The first chart details the biggest pet product spenders for each demographic category. It shows their share of CU’s, share of pet products spending and their spending performance (spending share/share of CU’s). All but 2 of the biggest spending groups are the same as Total Pet. To reach 60%, Education added Associates & Area replaced Center City with Rural. The categories are in the order that reflects their share of Total Pet Spending. This highlights a lot of differences. Only 1 is the same rank – Area, and the group is different. However, we should note that, like Total Pet Spending, Income is the highest performing demographic characteristic. In Pet Products there are only 4 groups with a performance rating of 120+%, the same as last year and 3 less than Total Pet in 2024. This reflects the fact that Pet Products spending, especially on Food, is spread more evenly across the category segments.

- Housing – Homeowners (80.8%) up from 77.9%. Controlling your “own space” has long been the key to pet ownership and more pet spending. Their performance rose from 119.7% to 124.4% but they stayed 4th in terms of importance for increased pet products spending. They are still in the 120% club but now without rounding up their performance. Only Homeowners w/o Mtge spent more on Pet Products in 2024, a strong $2.18B, +12.6% lift. The decrease for Renters was -$2.85B, -18.8% while the drop for Homeowners w/Mtge was -$3.90B, -10.8%. They only gained in share & performance because their -3.2% decrease was less than half of the national -6.7% drop.
- Race/Ethnic – White, not Hispanic (82.6%) up from 81.1%. They are the largest in spending share and account for 79+% of the spending in every segment. Their performance rose from 122.2% to 125.0% but they stayed 3rd in terms of importance in Pet Products Spending demographic characteristics. Only Asian Americans spent more, +35.2%. The biggest $ drop was -$2.72B by Whites but African Americans spent -$1.72B, -44.6% less. Minorities are 33.9% of U.S. CU’s, but they only spend 17.4% of Pet Products $, down from 18.9% in 2023 but up 35.9% from 12.8% in 2020. Pet ownership is relatively high in Hispanic households, but it is significantly lower for African Americans and Asians.
- Area – Suburban & Rural (73.1%) down from 73.4%, but their performance grew from 112.1% to 112.6%. Suburban CUs are the biggest product spenders but all areas spent over $1B less. Center City is still by far the worst performer but they had the smallest drop, -$1.05B, -5.8%. The performance lift was due to more Center City CUs.
- Income – Over $70K (68.8%, up from 64.7%). Pet Parenting is common in all income groups but money is a big driver in the spending for all industry segments. Plus, their performance rose to 131.5% from 128.2%, CU income continues to be the single most important factor in increased Pet Products Spending. As a rule, Income ↑= Pet Products Spending ↑. 2024 didn’t always follow that rule. Only incomes $40>99K and $200K> spent more. $200K had the biggest $ lift, +$1.36B but $40>49K led in %, +15.2%. Biggest Drops: $<40K, -$4.86K; $150>199K, -$2.09B.
- # in CU – 2>4 people (70.2%) up from 67.1%. The share for Pet Products is lower than for Total Pet, 72.5%. However, If you put 2 people together, pets very likely will follow and you must spend money on food and supplies. Their 116.6% performance is up from 112.7%. Only 2 People CUs spent more, +$0.64B, +2.6%. The biggest drop was Singles, -$3.10B. This was the most important factor in the group’s share/performance lifts.
- Occupation – All Wage & Salary Earners (61.2%) down from 62.4%. Their performance also fell from 102.4% to 99.1%. Only Mgrs/Professionals and All Others (Unlisted) spent more. Mgr/Prof were +0.91B, +4.4%. Biggest Drops: Tech/Sls/Clerical, -$2.62B; Blue Collar, -$1.13B. The Wage & Salary group is no longer “earning their share”.
- Education – Assoc Degree> (69.5%) up from 66.5%. The performance of the expanded group also rose from 114.0% to 117.8%. However, Education fell from 5th to 7th in importance in Pet Products spending. The lifts in share & performance were due to widespread -$1B drops while Associates had a $0.54B increase. The only other lift was $0.13B by HS Grads w/some college. The biggest drops were -$2.40B by BA/BS & -$1.88B by HS Grads.
- CU Composition – Married Couples (62.6%) up from 60.0%. Their performance rose from 127.8% to 130.5% but they stayed 2nd in importance. Only Married, with an Oldest Child 18> (+$0.77B) and Couples Only (+$0.21B) spent more. Share/Performance grew because Married were -$1.08B (-2.6%) while All Others were -$3.49B (-12.7%).
- # Earners – 2+ CU, 1 or 2 Earners (59.7%) up from 57.1%. Their performance is 119.2%, up from 113.7%. This group reinforces that income is a big driver but the # of earners is much less important. The lift in share and performance was due to their -$0.95B (-2.4%) drop being much less the -$3.62B (-12.3%) by other segments. 2 Earners had the biggest lift, +$0.70B (+2.7%). The only other increase was close, +$0.68B, (+11.3) by No Earner, 2+ CUs. Along with the biggest lift, the biggest drop was also in the big share group. The 1 Earner, 2+ CUs spent -$1.65B (-12.3%) less.
- Age – 35>64 (61.3%) up from 56.4%. Their performance also rose from 108.0% to 118.2%. Only 45>64 (Mostly Gen X) and 75+ had increases. All other age groups, but 35>44 (-$0.67B) spent over $1B less. The biggest drop was -$2.12B by 65>74. The biggest lift was +$0.66B (+5.1%) by 45>54 but 55>64 was a close second at +$0.57B.
For Pet Products, only the Education & Area spending groups are different than Total Pet, but there are other differences. Pet Products spending behavior was totally dominated by the big drop in Pet Food $. Money matters most for both but with only 4 members of the 120 Club, compared to 7 for Total Pet, Products spending is more balanced.
Now, let’s drill deeper and look at 2024’s best and worst performing Products spending segments in each category.

Most of the best and worst performers are the ones that we would expect. However, there are 10 that are different from 2023, the same as last year but 4 more than Total Pet this year. Changes from 2023 are “boxed”. We should note that only 2 of the Product winners are different from Total Pet. Down from 6 in 2023. With the big drop in Food, the spending behavior became more consistent.
The average performance of the 2024 Product winners was 133.5%, up from 130.4%. The average for the losers was 64.7%, up from 57.9% . The gap between best and worst grew from 65.7% to 75.9%, even above 75.4% in 2022. This indicates that Pet Products spending became less balanced across America in 2024. We should also note:
- Generation, Age – Gen X replaced the Boomers on top. Gen Z (<25) fell to the bottom replacing Born <1946 (75+).
- Education – Adv. Degree replaced BA/BS on top. <HS replaced HS Grads at the bottom. Education matters.
- Income, # Earners – $200K> replaced $150>199K & 2 Earners replaced 3+ Earners, minor high income changes. The importance of income is reinforced in many categories like Age, Occupation and Education.
- CU Composition – Married, Child 18> are back on top. All Married CUs but Child <6 perform at 100+%.
- Race/Ethnic – White, Not Hispanic are the perennial winners. African Americans have the lowest income and low pet ownership. They replaced the high-income Asians, who are increasing pet ownership and spending.
- Region – The West has high income and lots of space. They replaced the Midwest on top.
- Occupation – Self-Employed has the highest income & are bosses. In 2023, They replaced Managers on top. Service Workers have the lowest income of any worker and often a difficult life. Stayed on bottom. No Surprise
It’s time to “Show you the money”. Here are segments with the biggest $ changes in Pet Products Spending.

Now, we’ll see who drove Pet Products spending down. There are no repeats from 2023, and 12 Segments flipped from first to last or vice versa. This is much more turmoil than 2023 which had 5 repeats but only 4 flips. Most of the winners are not surprising but in Area, all segments spent less. 2023 had 5 categories where all segments spent more. You see that the drops are much bigger. 78% of 96 demographics spent less. In 2023, 86% spent more. Here are the specifics:
- Housing – The winner and loser flipped, and both had double digit % change.
- Winner – Homeowner w/o Mtge – Products: $19.44B; Up $2.18B (+12.6%) 2023: Homeowner w/Mtge
- Loser – Homeowner w/ Mtge – Products: $32.21B; Down $3.90B (-10.8%) 2023: Homeowner w/o Mtge
- Comment– Renters were -$2.85B (-18.8%) and had the only drop in Supplies, -$0.15B.
- Generation – Gen X flipped to the top and replaced Millennials.
- Winner – Gen X – Products Spending: $20.81B; Up $1.66B (+8.7%) 2023: Millennials
- Loser – Baby Boomers – Products Spending: $19.92B; Down $3.14B (-13.6%) 2023; Gen X
- Comment – Gen X moved to the top after 2 annual drops. Only Gen X spent more on Food, +$1.66B. All but Gen Z, -$0.35B, had small lifts in Supplies. The biggest was +$0.48B, by Millennials.
- Income – The loser and winner are both new, but very expected.
- Winner – $200K> – Products Spending: $12.77B; Up $1.36B (+11.9%) 2023: $30>39K
- Loser – <$30K – Products Spending: $5.85B; Down $2. 74B (-31.9%) 2023: $40>49K
- Comment – A spending rollercoaster: <$40K = -$4.86B; $40>99K = $1.30B; $100>199K = -$3.08B; 200K> = $1.36B Food & Supplies Spending Matches: <$40K = Both Down; $70>99K = Both Up
- Region– The South flipped to the top. Only they spent more on Food and they had the biggest lift in Supplies, $0.91B
- Winner – South – Products Spending: $22.87B; Up $1.06B (+4.9%) 2023: Northeast
- Loser – Midwest – Products Spending: $13.86B; Down $3.28B (-19.1%) 2023: South
- Comment – All regions, but the South spent less but only the Midwest spent less on Supplies.
- Occupation – Mgrs & Professionals flipped to the top and replaced Retirees.
- Winner – Mgrs & Professionals – Products Spending: $21.48B; Up $0.91B (+4.4%) 2023: Retired
- Loser – Tech/Sls/Clerical – Products Spending: $8.69B; Down $2.62B (-23.2%) 2023: Mgrs/Professionals
- Comment – Only Managers/Professionals and All Other/Unemployed spent more but only A/O had a lift in Food. Mgrs were +$1.25B in Supplies, but 5 of 8 spent more. Tech/Sls/Cler had the biggest drops in Food & Supplies.
- Education – BA/BS flipped to the bottom and were replaced on top by Advanced Degrees.
- Winner – Advanced Degree – Products Spending: $17.48B; Up $0.89B (+5.4%) 2023: BA/BS Degree
- Loser – BA/BS Degree – Products Spending: $19.80B; Down $1.96B (-9.0%) 2023: Associate Degree
- Comment – Only Adv. Degrees spent more. Less than HS Grads had the biggest % drop, -46.1%, while Associate Degrees were only down -0.9%. Overall, <College were -$3.50B, -11.6% and College Grads were -$1.07B, -2.8%
- CU Composition – Singles flipped to the bottom, replacing Single Parents.
- Winner – Married, Child 18> – Products: $7.46B; Up $0.77B (+11.6%) 2023: Singles
- Loser – Singles – Products: $11.85B; Down $3.10B (-20.8%) 2023: Single Parents
- Comment – Married, Oldest Child 18>, Married, Couple Only and 2+ Adults, No Kids were the only segments to spend more on Products, Food & Supplies. Overall, Married couples were down -2.6% in Products (Avg: -6.7%) They had a drop in Food & lift in Supplies. 24 was very bad for Singles. Prod: -20.8%; Food: -29.2%; Supp: -0.2%.
- # Earners – Both the winner and loser are new, but only 2 segments spent more.
- Winner – 2 Earners – Products Spending: $26.43B; Up $0.70B (+2.7%) 2023: 1 Earner, Single
- Loser – 1 Earner, 2+ CU – Products Spending: $11.75B; Down $1.65B (-12.3%) 2023: 3+ Earners
- Comment – While income matters most, the # of Earners is still not a major factor in Pet Products spending as 1 Earner segments won in 22/23. In 24, 2 Earners won in $, but No Earner, 2+ CUs had the biggest % lift, +11.3%.
- Age – The 65>74 yr-olds flipped from first to last and were replaced on top by 45>54.
- Winner – 45>54 yrs – Products Spending: $13.52B; Up $0.66B (+5.1%) 2023: 65>74 yrs
- Loser – 65>74 yrs – Products Spending: $10.01B; Down $2.12B (-17.5%) 2023: 55>64 yrs
- Comment: Only 45>64 & 75> had Product $ lifts. 45>64 spent more on Food. 55>64 & 75> spent more on Supplies. Only 55>64 spent more on both. 65>74 was +$2.35B on Food in 23 and -$2.42B in 24.
- # in CU – 1 Person flipped to the bottom and was replaced on top by 2 People.
- Winner – 2 People – Products Spending: $25.35B; Up $0.64B (+2.6%) 2023: 1 Person
- Loser – 1 Person – Products Spending: $11.85B; Down $3.10B (-20.8%) 2023: 4 People
- Comment: Only 2 People CUs had a lift in Products or Food. They were joined in Supplies by 4 People, +$0.94B.
- Race/Ethnic – The 2023 winner & loser, White, Non-Hispanics and Asians both flipped.
- Winner – Asian – Products Spending: $2.18B; Up $0.57B (+35.2%) 2023: White, Not Hispanic
- Loser – White, Not Hispanic – Products Spending: $52.85B; Down $2.72B (-4.9%) 2023: Asian
- Comment – Only Asians spent more. African Americans were (-44.6%) and Hispanics (-9.2%). All but Asians spent -$1.2>$2.9B less on Food. Asians were +$0.55B. All had had lifts in Supplies spending. The biggest was +$0.48B by Hispanics. Asians had the smallest, only +$0.02B.
- Area Type – Center City flipped to the top with the smallest drop. All spent less. In a good year, all often spend more
- Winner – Center City – Products Spending: $17.19B; Down $1.05B (-5.8%) 2023: Suburbs 2500>
- Loser – Rural – Products Spending: $18.13B; Down $2.27B (-11.1%) 2023: Center City
- Comment – All spent less on Food. Only Suburbs spent more on Supplies, +$1.48B but their Food $ were -$2.73B.
We’ve now seen the winners and losers in terms of increase/decrease in Pet Products $ for 12 Demographic Categories. 2024 was not a good year for Pet Products Spending. Food $ fell -$5.46B after a record lift in 2023. Supplies spending had a Binge in 21, a Bust in 22, a $1.1B lift in 23 and a $0.89B increase in 24. The 2024 result was a -6.7% drop in which 78% of 96 demographic segments spent less on Pet Products, a radical change from 86% spending more in 2023. In 2024 the good performances were limited, but not every good performer can be a winner. Some of these “hidden” segments should be recognized for their outstanding effort. I’ve found 6. They don’t win an award, but they deserve…
Honorable Mention
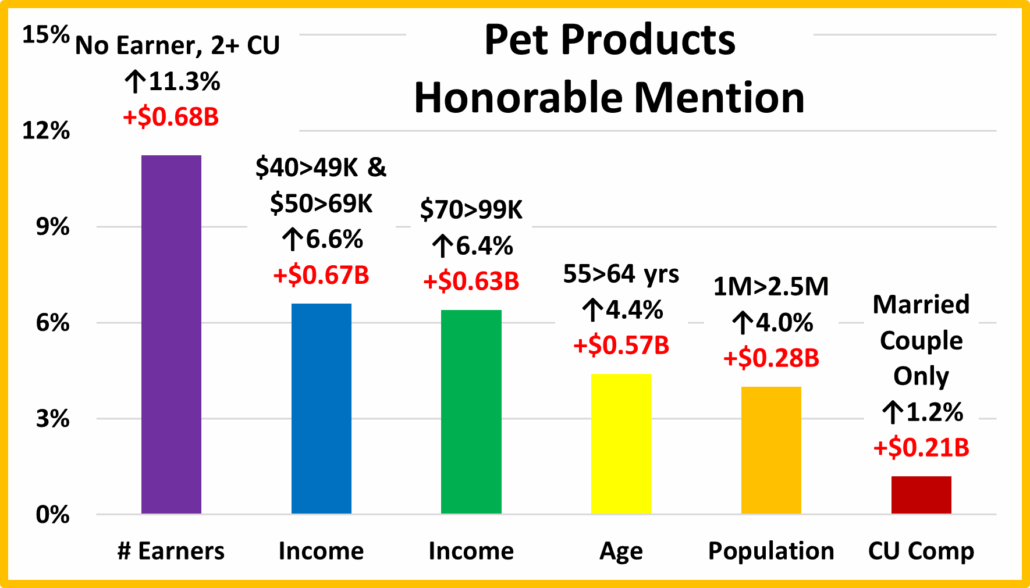
Pet Products spending was down -$4.57B in 2024 from a $5.5B decrease in Food and a small lift in Supplies. The drop in Pet Products spending was widespread as 78% of 96 demographic segments spent less. Income was still the most important factor, and spending became a little less balanced. It was not easy to find members for our honorable mention group. Gen Z ended their 2-year Pet Products spending surge and were -28% in Product $. <$40K incomes were -$4.86B but the 3 groups in the $40>99K range had 6% lifts and earned Honorable Mention. No Earner, 2+CUs had an 11.3% increase in Product $ so they returned to the list. The number of Earners is definitely much less important than income. but so is being “the Boss”. The 55>64 yr-olds were down in Food & Supplies in 2023. In 2024, both flipped to positive. In 2024, Center City was down -$1.05B in Product Spending. The biggest drop was -$1.21B by cities with a population of 2.5>4.9M. The only size with an increase was 1>2.5M. The lift was small, but they made the list. Married, Couple Only are often high profile but not in 2024. A lift in Food overcame a drop in Supplies so they earned their spot. The drop in Pet Products spending was definitely widespread so there were fewer “heroes”, but we found them.
Summary
Pet Products spending has seen a lot of turmoil since 2015. Consumers upgraded to Super Premium Food and cut back on Supplies in 2015. In 2016 they value shopped for Food and Spent some of the saved money on Supplies. In 2017 availability and value increased so they spent $7B more. In 2018 the FDA warning on dog food caused many consumers to downgrade and new tariffs on Supplies flattened growth. Products $ fell -$1B. In 2019 Pet Food spending rebounded to a record level but higher prices in Supplies hit home. Supplies Spending fell $2.98. Pet Products $ fell -$0.64B.
2020 brought the COVID pandemic. Pet Parents binge bought Pet Food in the 1st half of the year. As Pet Parents focused on “needs”, discretionary Supplies $ dropped significantly. However, Pet Products spending still grew by $3.99B to $52B.
In 2021, the Food binge was not repeated so spending fell, but Pet Parents caught up on purchasing all the Supplies that they had postponed buying. The result was a record increase in Supplies and a $6.21B increase in Pet Products $.
2022 was more normal. Pet Food spending increased $4.29B, +12.5% & Supplies spending fell -7.8%, producing a $2.42B, +4.2% lift. Pet Products $ were $60.63B. The lift was widespread as 70% of demographics spent more. The $ moved towards their older members in the 45>54 yr-old age group. However, the youngsters also made their presence felt as Gen Z more than doubled their Pet Products spending. Spending also became more demographically balanced. The most visible feature of this change was in the big groups doing at least 60% of the dollars. In order to reach the 60% minimum, the Education group was downgraded from College Grads to those with an Associate’s Degree or more. However, the balancing act was not limited to Education. 10 of 12 categories narrowed the gap between their best and worst performing segments. Overall, the average gap narrowed from 92.3% in 2021 to 75.4% in 2022. It definitely improved
In 2023, Food had a record lift and Supplies $ rose 4.9%. The $7.89B (+13.0%) lift was widespread. 86% of demographics had increases. While Income remains the most important factor, Pet Products spending continued to become a little more balanced. Overall, the disparity between Best & Worst performers fell from 75.4% in 2022 to 65.7% in 2023. The gap narrowed in all but Area & Region. Gen Z’s growth continued, and they were joined by the 65>. 2023 was great.
2024 was a bad year for Pet Products. A $5.47B drop in Pet Food $ overwhelmed an $0.89B lift in Supplies to produce a 23>24 change of -$4.57B, -6.7% in Products. The drop was widespread as 78% of Demographic Segments spent less and spending became a little less balanced as the Best/Worst disparity rose to 75.7%.
Finally,… The “Ultimate” 2024 Pet Products Spending CU is 3 people, a married couple with a child 18>. They are Gen Xers in the 45>54 age range and are White, but not Hispanic. At least one has an Advanced College Degree. They own their own business and both work, producing a CU income of $200K>. They still have a mortgage on their house located in a Rural area with a population <2500 in the West.