U.S. PET SUPPLIES SPENDING $16.28B (↓$1.43B): MID-YR 2020 UPDATE

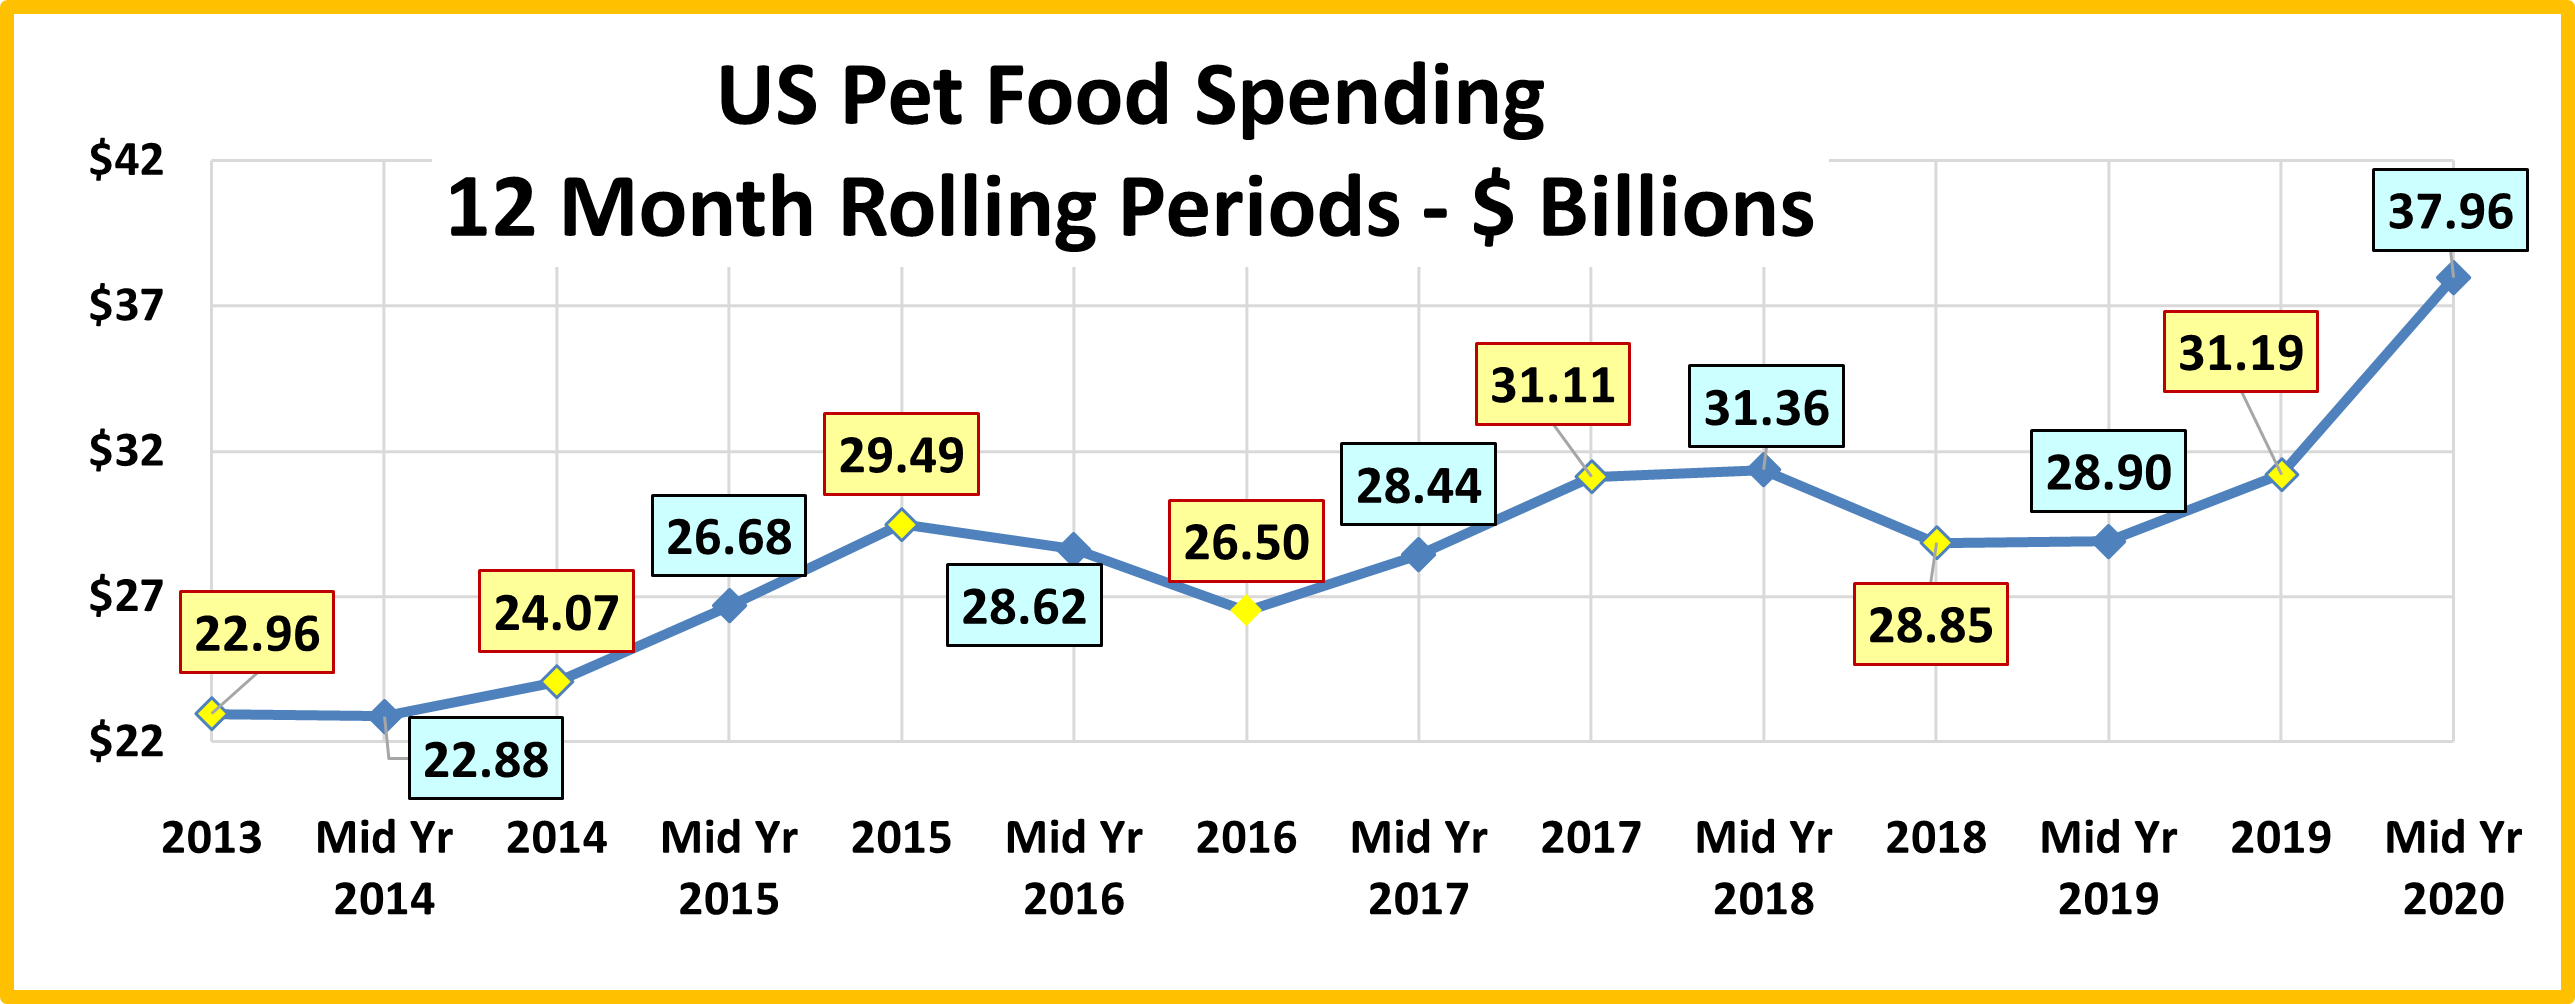
In our analysis of Pet Food spending, we saw that spending grew in the 2nd half of 2019 then skyrocketed in the beginning of 2020 largely due to Pandemic Panic buying. There was no Panic in Pet Supplies and spending continued its steady decline from its 2018 peak. Mid-Year 2020 Pet Supplies spending was $16.28B, down $1.43B (-8.1%). The continuing spending drop in 2020 puts spending in this segment below the level of 3 years ago in Mid-Yr 2017. The following chart should put the recent spending history of this segment into better perspective.

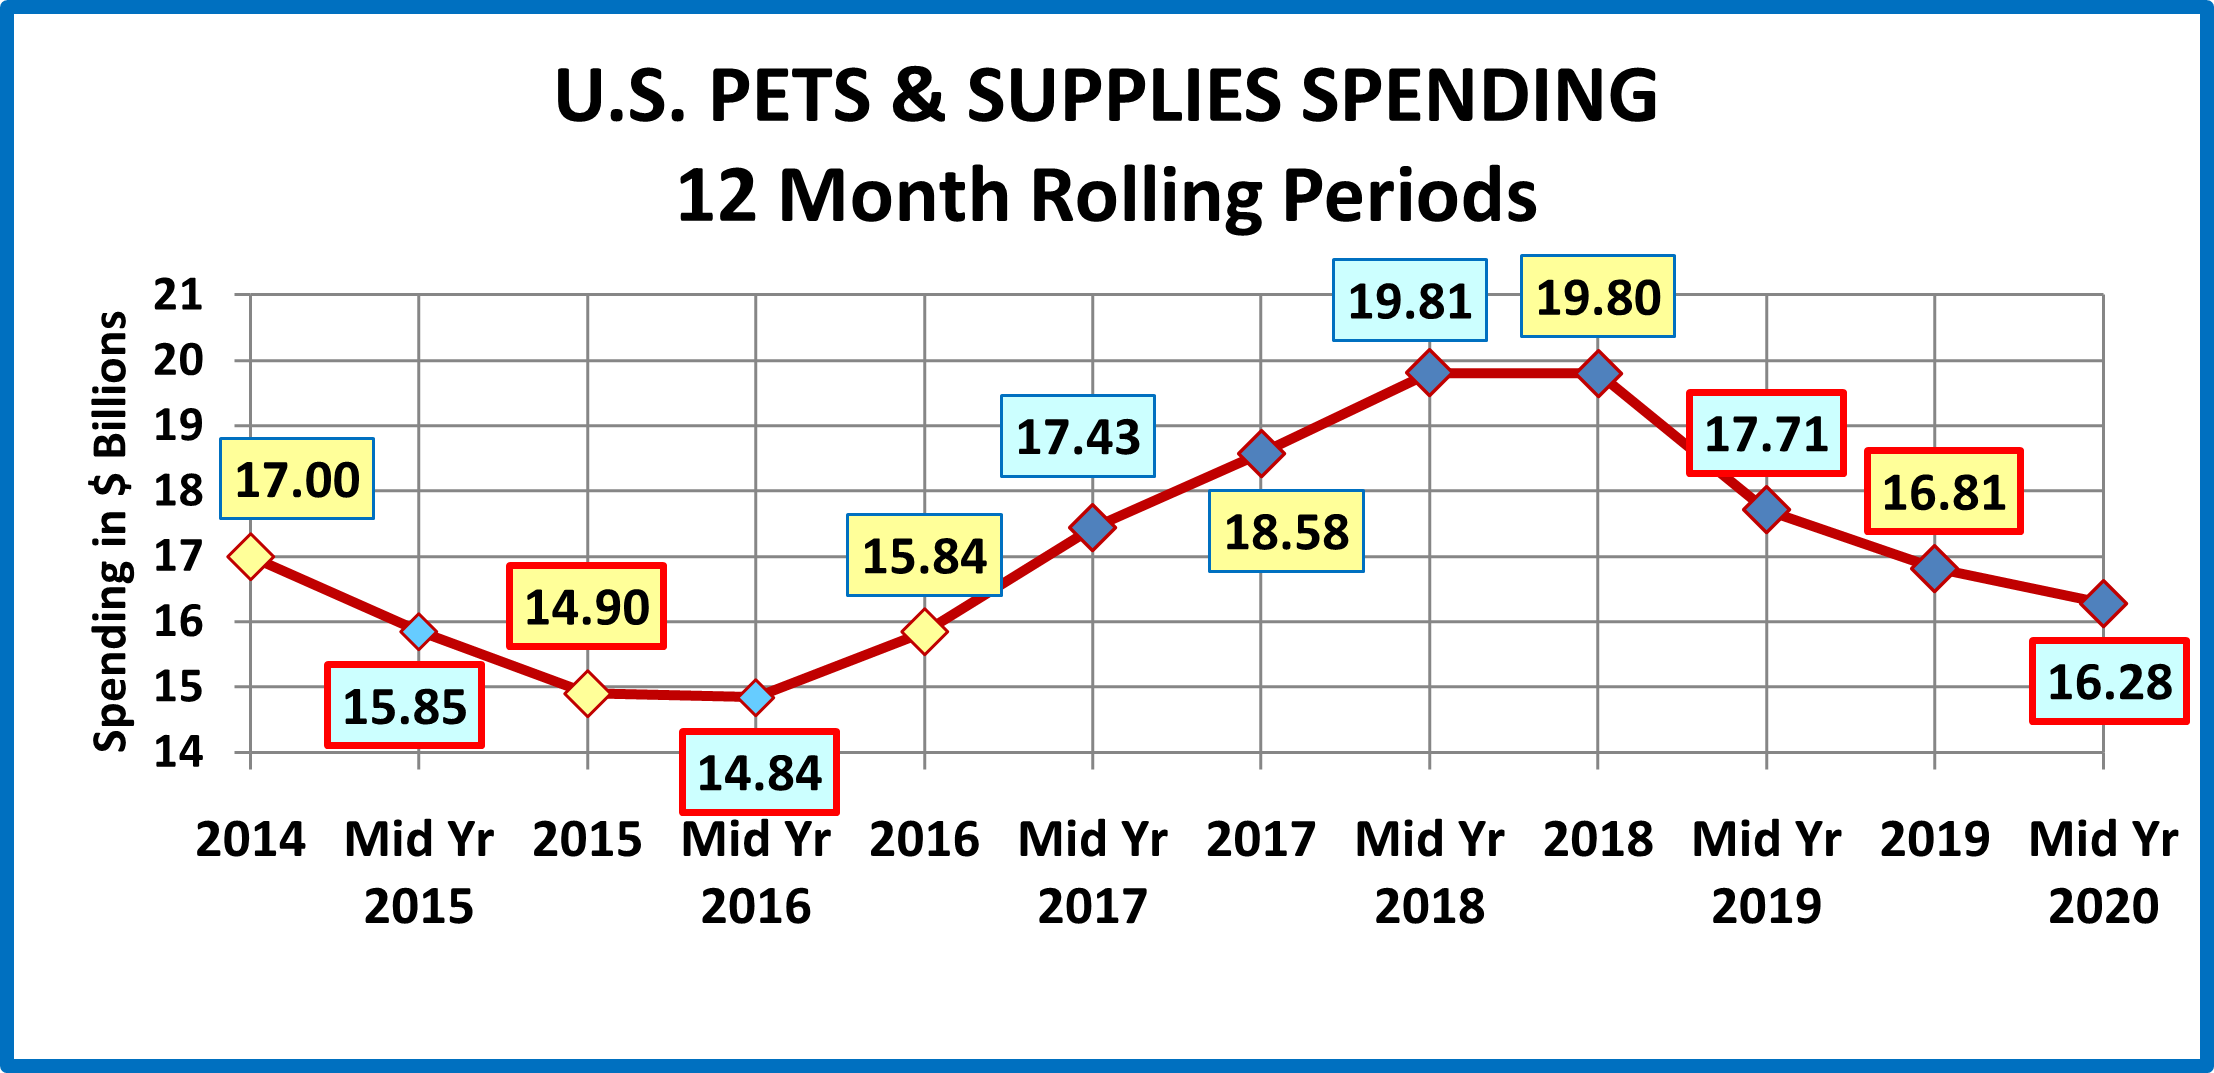
Here are this year’s specifics:

  • Mid Yr 2020: $16.28B; ↓$1.43B (-8.1%) from Mid Yr 2019. The -$1.43B came from:
    • Jul > Dec 2019: ↓$0.90B
    • Jan > Jun 2020: ↓$0.54B

Like Pet Food, Pet Supplies spending has been on a roller coaster ride. However, the driving force is much different. Pet Food is “need” spending and has been powered by a succession of “must have” trends. Pet Supplies spending is largely discretionary, so it has been

impacted by 2 primary factors. The first is spending in other major segments. When consumers ramp up their spending in Pet Food, like upgrading to Super Premium, they often cut back on Supplies. However, it can go both ways. When they value shop for Premium Pet Food, they take some of the saved money and spend it on Supplies. The other factor is price. Pet Supplies prices reached their peak in September of 2009. Then they began generally deflating and in March 2018 were down -6.7% from 2009. Although it is not a hard and fast rule, Price inflation in this largely discretionary segment can retard sales, usually by reducing the frequency of purchase. On the other hand, price deflation generally drives Supplies spending up. Innovation can “trump” both of these influencers. If a new “must have” product is created, something that significantly improves the pet parenting experience, then consumers will spend their money. The perfect example of this is the successive waves of new food trends. Unfortunately, we haven’t seen much significant innovation in the Supplies segment recently.

Recent history gives a perfect example of the Supplies roller coaster. In 2014 Supplies prices dropped sharply, while the movement to Super Premium Food was barely getting started – Supplies spending went up $2B. In 2015, consumers spent $5.4B more on Pet Food. At the same time, Pet Supplies prices went up 0.5%. This was a “killer” combination as Supplies spending fell $2.1B. In 2016 consumers value shopped for Food, saving $2.99B. Supplies spending stabilized by mid-year then increased by $1B in the second half when prices fell sharply. Consumers spent some of their “saved” money on Supplies. Supplies prices continued to deflate throughout 2017. Food spending increased $4.61B in 2017 but this came from a limited group, generally older CUs, less focused on Supplies. The result was a $2.74B increase in Supplies spending. This appeared to be somewhat of a break with the overall pattern of trading $ between segments.

In the first half of 2018 Pet Food spending slowed to +$0.25B. Supplies’ prices switched from deflation to inflation but were only up 0.1% versus the first half of 2017. During this period Supplies Spending increased by $1.23B. Prices began to climb in the second half of 2018 due to impending new tariffs in September. By June 2019 they were 3.4% higher than 2018. The impact of the tariffs on the Supplies segment was very clear. Spending became flat in the second half of 2018, then took a nosedive in the 1st half of 2019, -$2.09B. Prices stayed high for the rest of 2019 and spending fell an additional -$0.9B. In 2020 prices turned up again through March before plummeting, -3.8% by June. Spending dropped an additional -$0.54B. Initially, the pandemic had no positive impact on Supplies spending. We expect that to change in the second half. More time with their pets and lower prices usually means more Supplies spending.

Let’s take a closer look at the data, starting with the two most popular demographic measures – age and income. The graphs that follow will show both the current and previous 12 months $ as well as 2019 yearend. This will allow you to track the spending changes between halves.

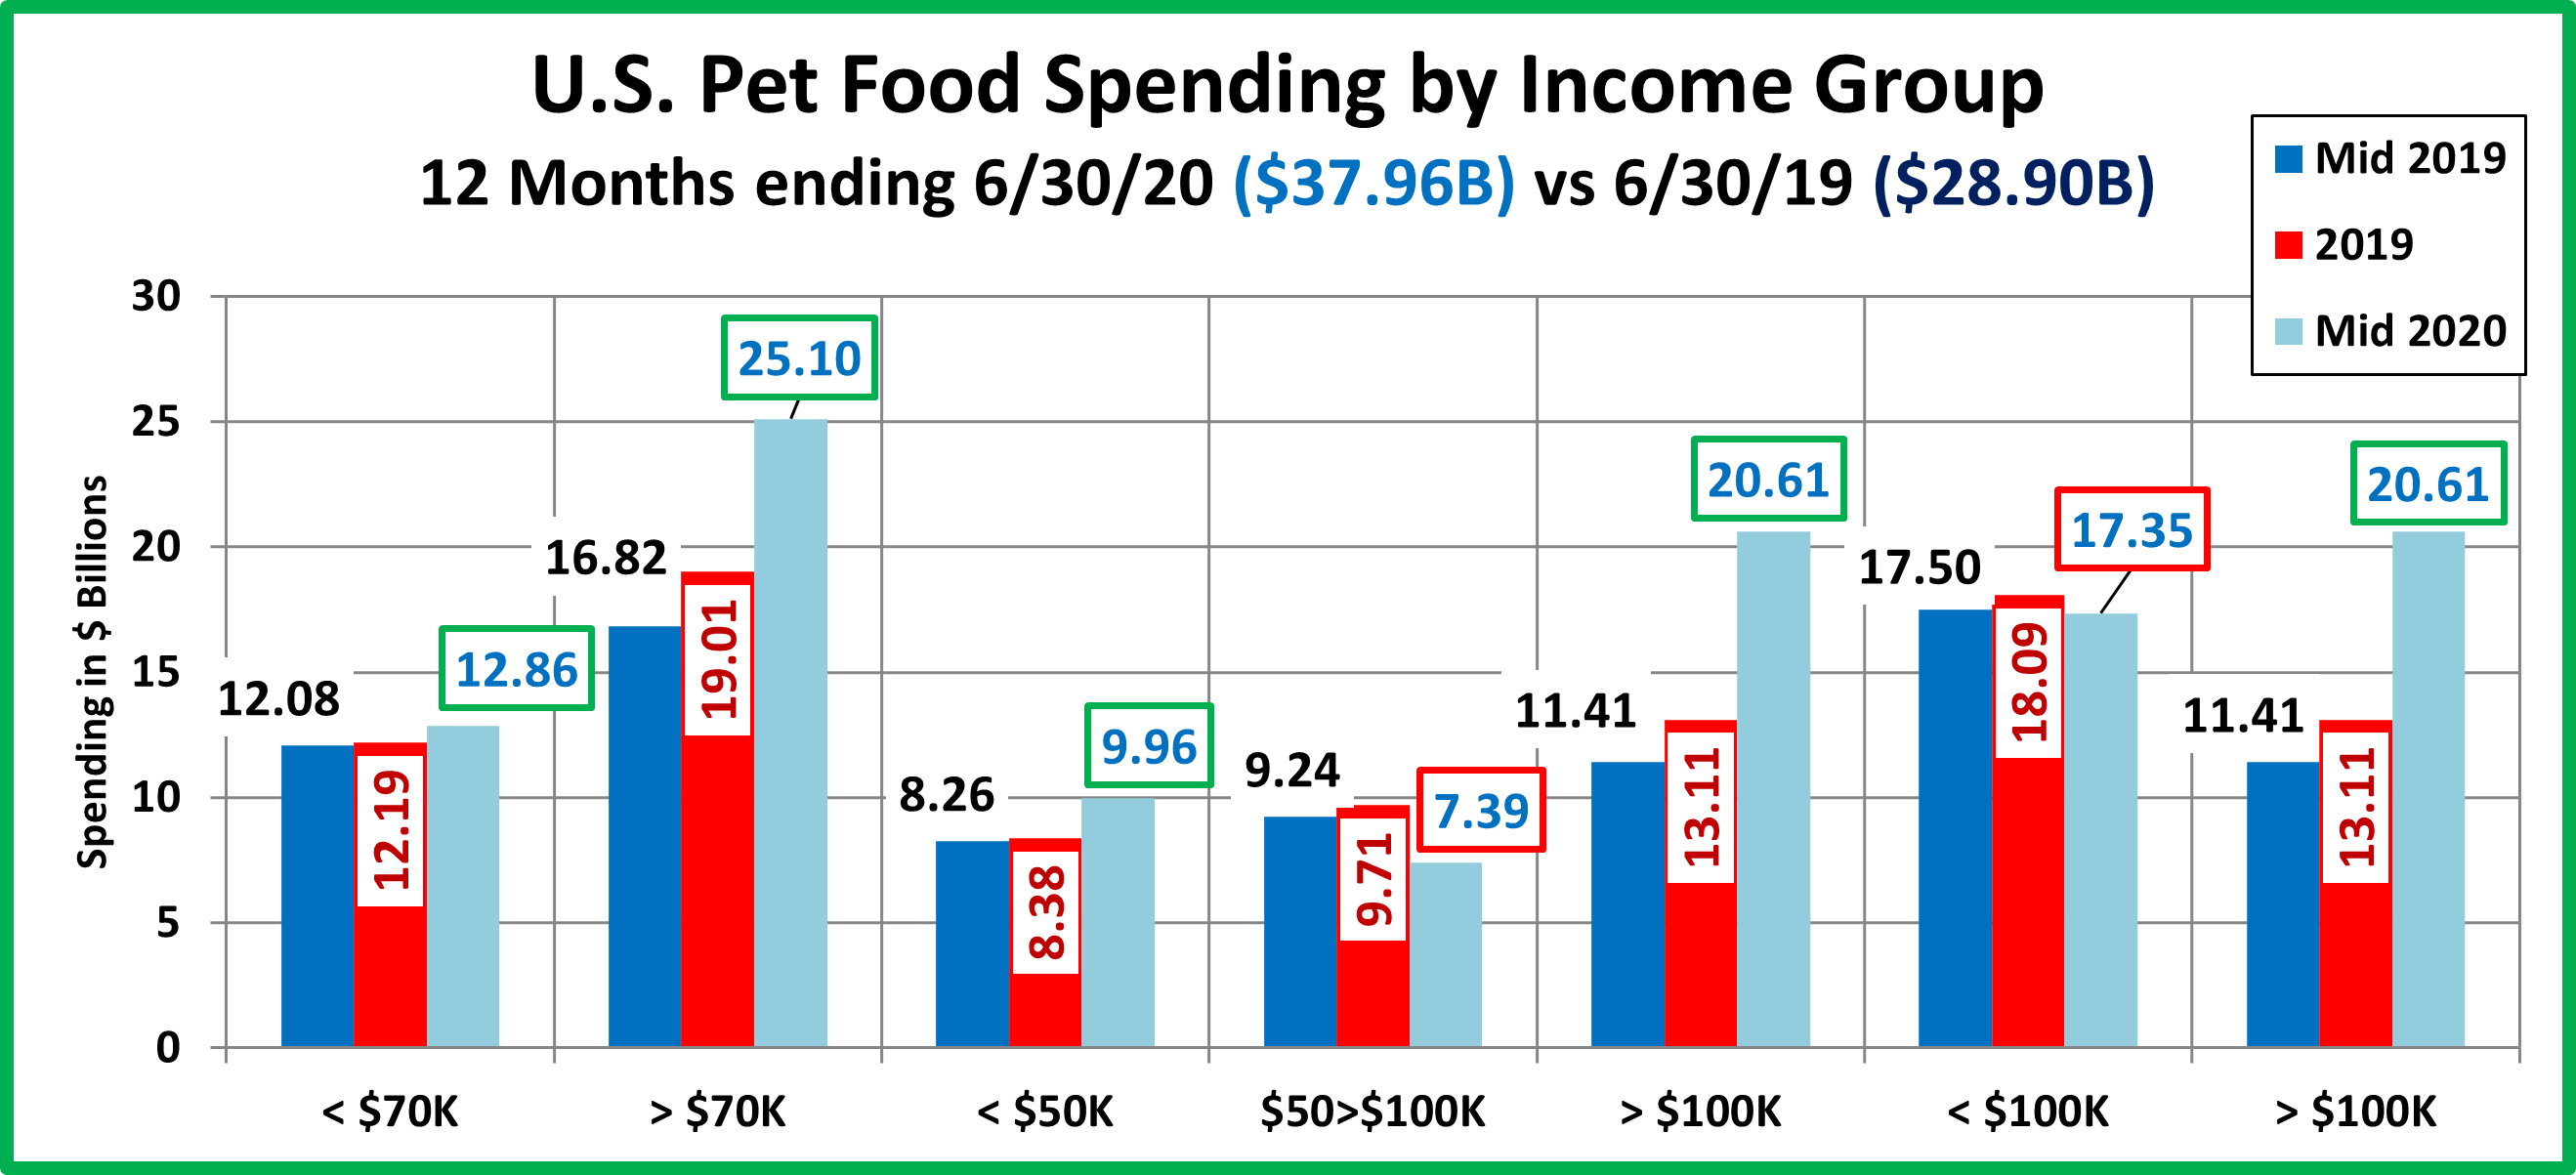
The first graph is for Income, which has been shown to be the single most important factor in increased Pet Spending, especially in Pet Supplies and both of the Service segments.

Here’s how you get the change for each half using the $50>70K group as an example:

Mid-yr Total Spending Change: $1.58B – $2.43B = Down $0.85B (Note: green outline = increase; red outline = decrease)

  • 2nd half of 2019: Subtract Mid-19 ($2.43B) from Total 2019 ($1.93B) = Spending was down $0.50B in 2nd half of 2019.
  • 1st half of 2020: Subtract Total 2019 ($1.93B) from Mid-20 ($1.58) = Spending was down $0.35B in 1st half of 2020.

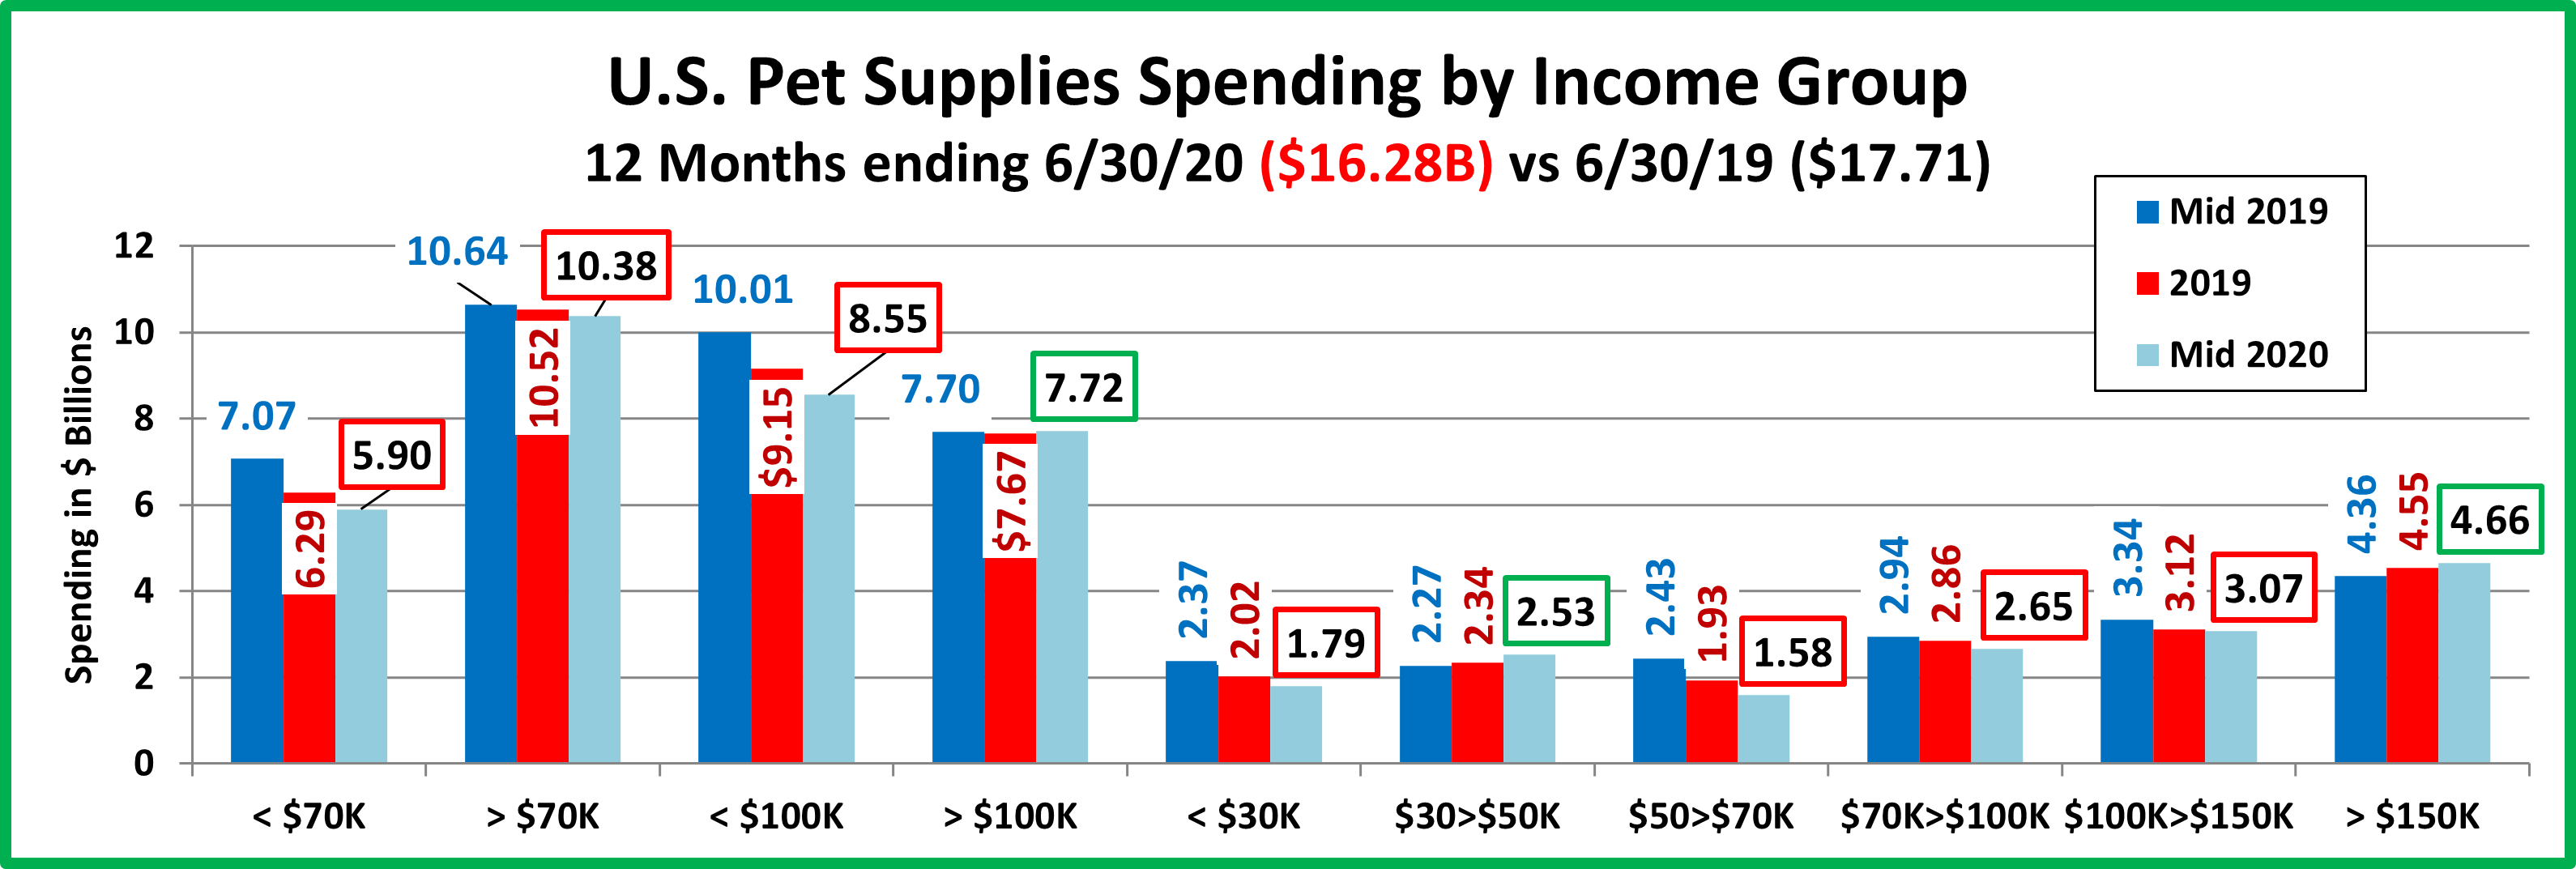
  • I added an under/over $100K measurement to the graph. As you can see, the share of Supplies spending “flips” based upon the $70>$100K group. That means that the “break even” dividing line is probably slightly above the average CU income of $83.8K. The Supplies $ of CUs above average, 33% is equal to the 67% of CUs below average.
  • There are only 2 spending patterns in the individual segments – drops in both halves or increases in both halves.
  • The decrease in Supplies Spending was widespread across income groups. Both over and under $70K trended down while over $100K was basically flat. The two segments with increases were an unlikely pair – $150K+ and $30>$50K. The higher income group is to be expected but the lower income group is a surprise. $30>50K is the income range for Retirees but it’s not them. It is likely driven by the younger crowd.
  • The spending movement, whether up or down, is gradual. In most cases the $ changes in each half are very close.
  • The two factors, high prices and the onset of the pandemic had very little impact on the over $100K group. It was basically “business as usual”. The biggest negative came from the <$30K and the $50>$70K groups. Their spending fell -$1.43B, likely due to a reduced purchase frequency. There’s no Supplies binge spending yet. Maybe that will come in the 2nd half of 2020 with the big drop in prices?

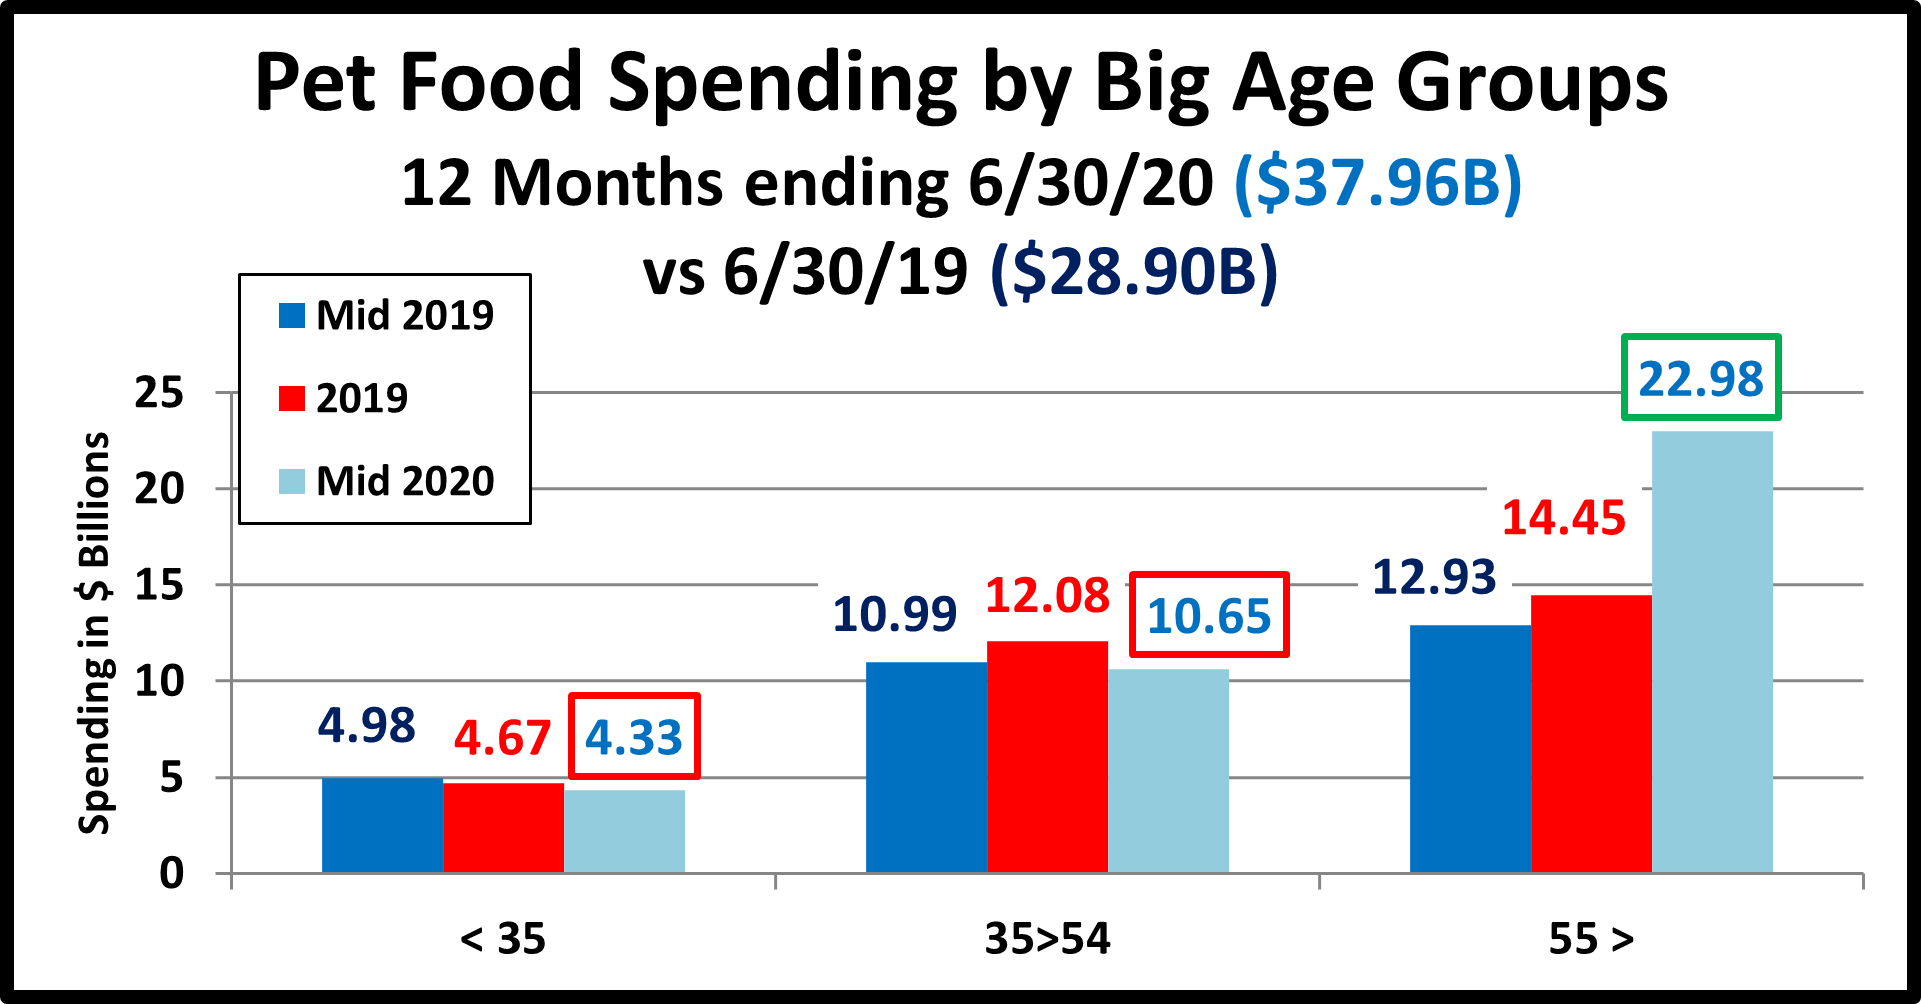
Now let’s look at Pet Supplies spending by Age Group.

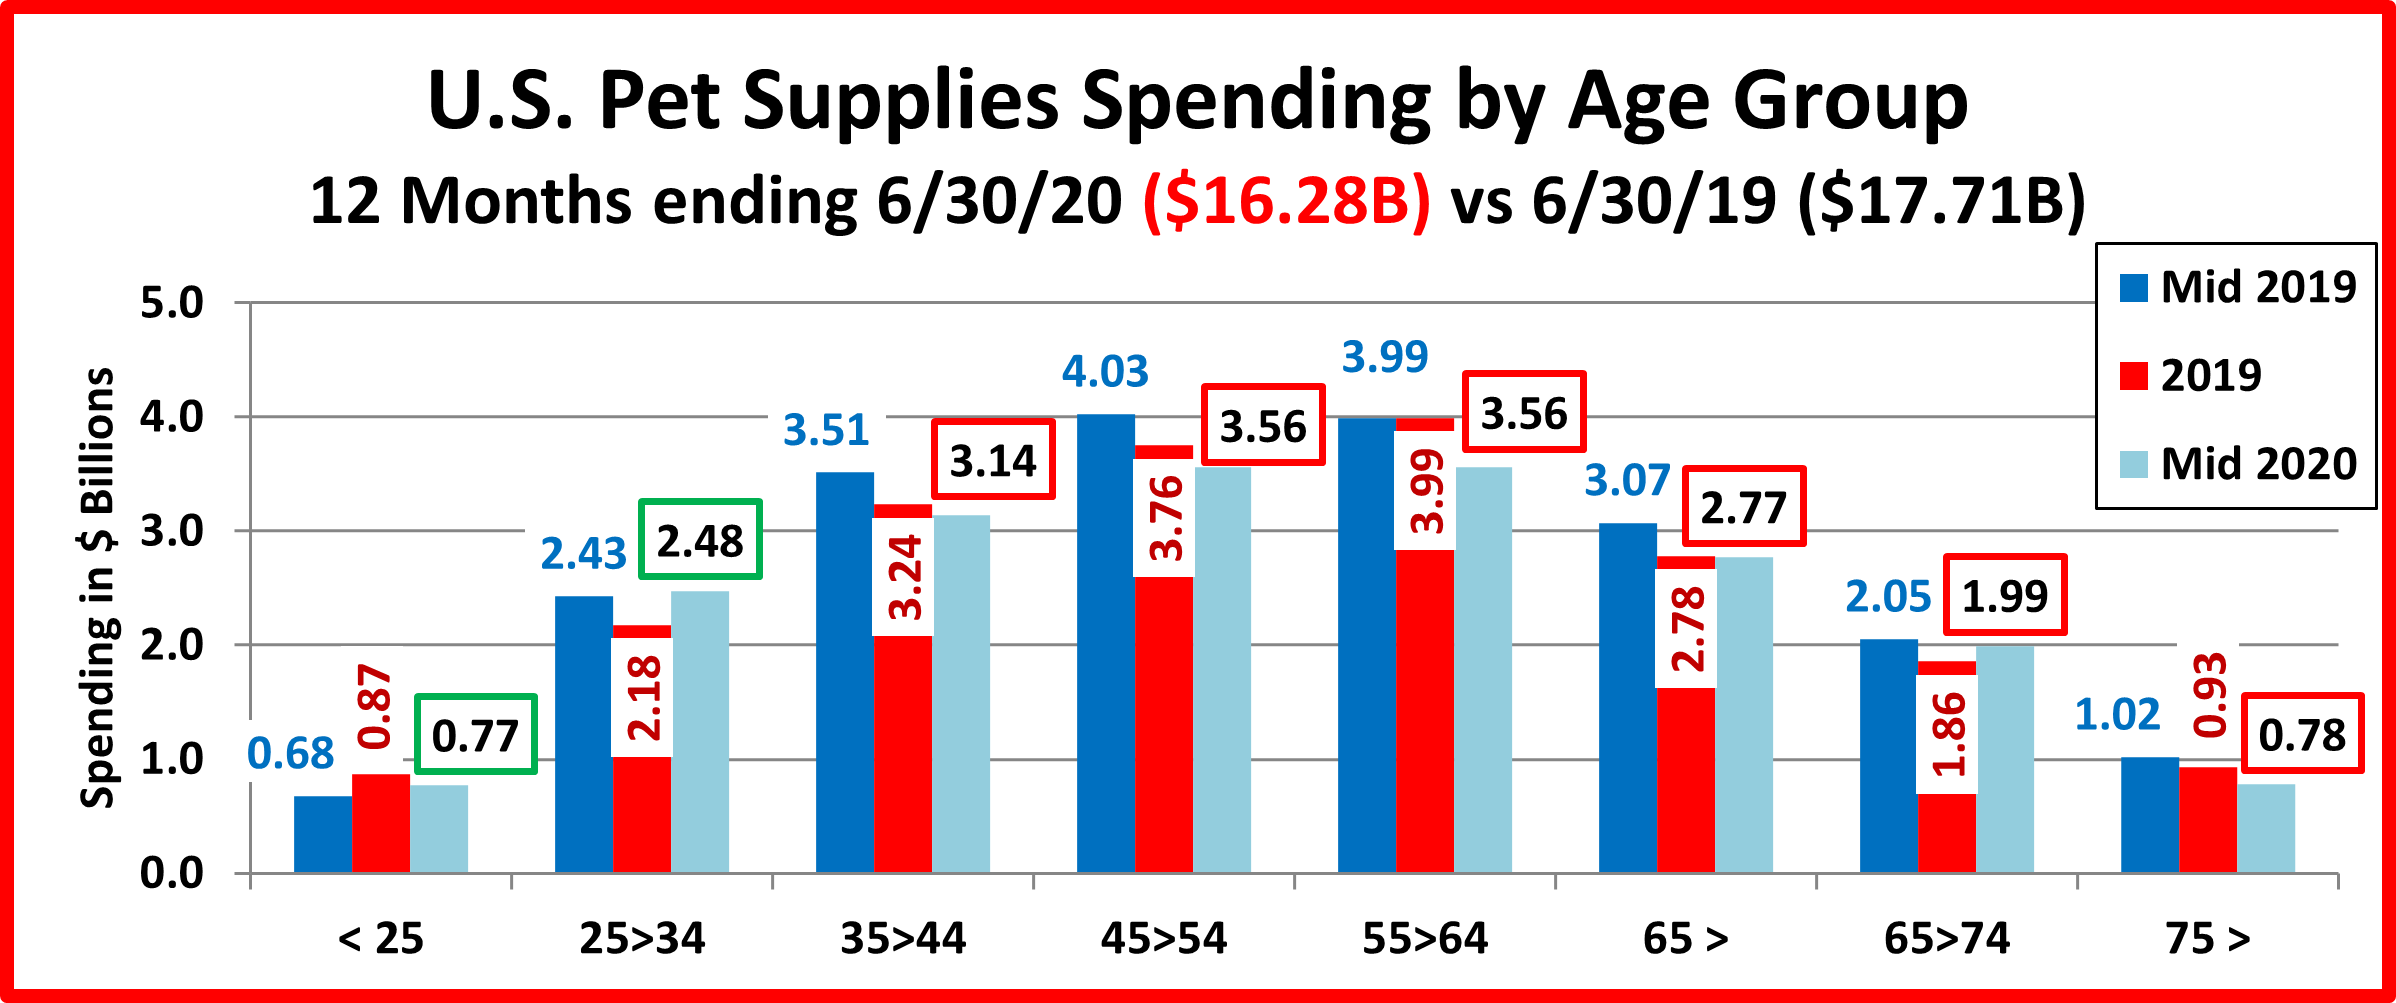
  • Generally, the over 35 group spent less while under 35 spent a little more but there was a mix of patterns.
  • The <25 and 25>34 year olds had opposite patterns for the halves. If there was any “binge” pet supplies spending due to the pandemic, it came from the 25>34 year old Millennials.
  • The 35>54 yr olds, Gen X, were down in both halves, probably due to value shopping and slightly reduced frequency.
  • The 55> group also had a mixture. The 75> were down in both halves. The Boomers were divided. The 65>74 yr olds had a small pandemic lift while spending dropped sharply for the 55>64 group. This drop was correlated to helping to pay for their huge panic buy of Pet Food.

Now let’s look at what is happening in Supplies spending at the start of 2020 across the whole range of demographics. In our final chart we will list the biggest $ moves, up and down by individual segments in 11 demographic categories.

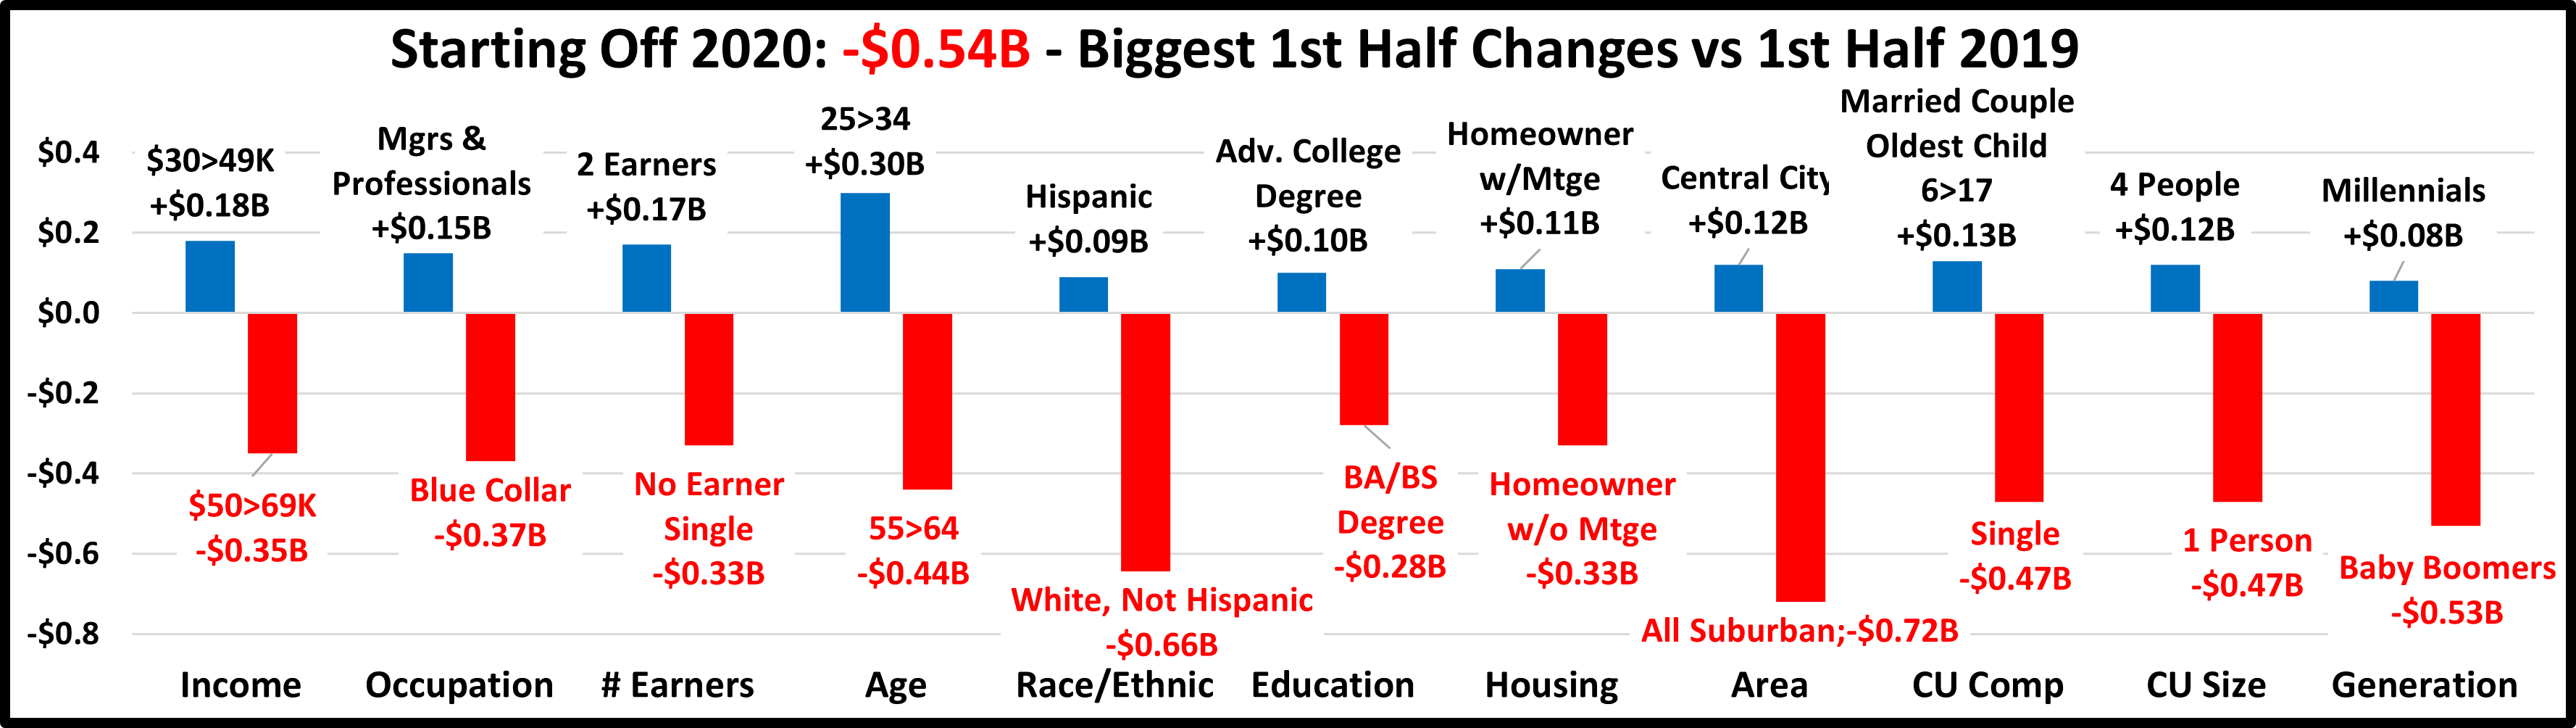
  • The first thing that you notice is that the biggest decreases are radically larger than the biggest increases.
  • The decrease is widespread but not as bad as last year when in 5 of the 11 categories all segments spent less on Supplies. In the 1st half, 27 segments, 33% spent more. This is up from 22 in the 2nd half of 2019 and much better than 8 last year. There’s a long way to go but things are slowly improving in the Supplies segment.
  • There are some “usual suspects” in the winners – Mgrs/Professionals & Adv College Degree and losers – Singles & Blue Collar. There are also some surprise winners – $30>49K & Hispanic and losers – BA/BS & Suburban. However, most of the winners & losers reflect the young vs old pattern that we saw in the age analysis.
  • The young positives are reflected in these winners – 25>34, Center City, 4 people, Married, oldest child 6>17, 2 earners and of course, Millennials. The older losers are no earner singles, homeowner w/no mtge, 55>64, suburban and of course, Baby Boomers.
  • Here’s a hidden positive. Minorities were +$0.12B in the 1st half. African Americans were down slightly, -$0.01B but Asians and Hispanics spent $0.13B more.

The 24 month Spending winning streak for Supplies which began in the second half of 2016 came to an end in the second half of 2018. During that time spending on Pet Supplies increased $4.97B (+33.5%). It was also widespread across America. Of 82 separate demographic segments, only 1 spent less on Supplies in that period – the Greatest Generation. This 92+ year old group has now become too small to be accurately measured.

What are the market conditions that affect Supplies spending? We have to first note that the world changed for Supplies because of the great recession. Prices have generally deflated since then and spending in the segment became more sensitive to changes in price. Prices go up…spending drops, usually due to reduced purchase frequency. Prices go down… spending turns up. This situation did not exist prior to the recession.

The other factor is spending in other segments, especially Food. Pet spending comes out of “one bucket”. A big increase in one segment can result in a cut back in others and big savings can generate more spending. The recent upgrade to Super Premium Food was such a big $ commitment that it magnified this effect.

In 2018, something new was added – outside influence. The FDA warning on grain free dog food had an immediate, negative impact on the Food segment. For Supplies, it was added tariffs. Prices in the Supplies segment began to turn up in the Spring. By June 2019, they were 3.4% higher than 2018. Supplies spending flattened out then plummeted in the 1st half of 2019. Prices stabilized at the high level and Supplies $ continued to fall. Then came the start of the pandemic. This spurred huge panic buying in food but not supplies. In fact, the huge lift in Food probably contributed to Supplies continued decline. I expect Supplies to rebound strongly in the 2nd half . We’ll get the data in September.

Retail Channel Monthly $ Update – April Final & May Advance

In May 2020  the Retail market began its recovery after hitting bottom in April. The road back has been long and complex and Consumer spending behavior continues to evolve. In this report we will track the changes, migration between channels and the retail recovery with data from two reports provided by the U.S. Census Bureau.

The Reports are the Monthly Retail Sales Report and the Advance Retail Sales Report. Both are derived from sales data gathered from retailers across the U.S. and are published monthly at the same time. The Advance Report has a smaller sample size so it can be published quickly – about 2 weeks after month end. The Monthly Final Report includes data from all respondents, so it takes longer to compile the data – about 6 weeks. Although the sample size for the Advance report is smaller, the results over the years have proven it to be statistically accurate with the final monthly reports. The biggest difference is that the full sample in the Final report allows us to “drill” a little deeper into the retail channels.

We will begin with the Final Retail Report for April and then move to the Advance Retail Report for May. Remember, the retail impact of the pandemic began in March 2020, peaked in April, then recovery started in May. We will compare 2021 to both 2020 and 2019 to document the progress that the retail market has made towards a full recovery.

Both reports include the following:

  • Total Retail, Restaurants, Auto, Gas Stations and Relevant Retail (removing Restaurants, Auto and Gas)
  • Individual Channel Data – This will be more detailed in the “Final” reports and we fill focus on Pet Relevant Channels

The information will be presented in detailed charts to facilitate visual comparison between groups/channels of:

  • Current Month change – % & $ vs previous month
  • Current Month change – % & $ vs same month in 2020 and 2019
  • Current YTD change – % & $ vs 2020 and 2019
  • Monthly and Year To Date $ will also be shown for each group/channel

First, the April Final. Retail hit bottom in April but began recovery, hitting record $ in December. In January & February $ fell but were still records for those months. Sales skyrocketed in March, setting a new all time $ record. In April $ fell a bit but it were still the 2nd best in history. Here are the major retail groups. (All Data is Actual, Not Seasonally Adjusted)

The final total is $9.1B more than the Advance report projected a month ago. Led by Relevant Retail, all groups were up. The specifics were: Relevant Retail: +$5.8B Auto: +$1.9B; Restaurants: +$1.2B; Gas Stations: +$0.2B. Sales vs March were mixed but Total Retail $ were still the 2nd highest of all time. Total $ales broke $600B for the 1st time in December and has now done it 3 times. Auto has the strongest recovery and is in fact prospering – annual YTD growth rate since 2019 is +12.8%. Except for the spending dips by 2 groups vs March, all but Restaurants were positive in all other measurements. Restaurants are still slightly negative vs 2019 but the Retail recovery is strong.

Now, let’s see how some Key Pet Relevant channels were doing in April.

  • Overall– 8 of 11 channels were down vs March but 9 of 11 were up vs April 2020 and 10 vs April 2019. In YTD $, 10 were up vs 2020 and 10 vs 2019. 9 were up vs both. April was down vs March, but still strong.
  • Building Material Stores – Their amazing lift continues. The ongoing surge came as a result of pandemic spending patterns developed in 2020. Consumers began focusing on their homes. Now we’re moving into the 2021 Spring lift, with Farm Stores again leading the way. Sporting Goods stores are not in this group but have a similar spending pattern. Sales took off in May, hit a record peak in December and continued strong into 2021, peaking in March. April $ fell slightly but are +124% vs 2020 and +58% vs 2019. YTD they are even +53% vs 2019.
  • Food & Drug – Supermarkets were +$77.7B in 2020. $ are down vs March and YTD 2020 due to last year’s binge buying. They are still up over 13% vs April 2019 and YTD 2019. Drug Stores ended up +$17B (+5.7%) for 2020. Their $ fell in April after a setting a record in March. All other measurements are positive and YTD $ are +5.8%.
  • General Merchandise Stores – $ in all channels fell in Jan & Feb then spiked in March. In April, sales in all but $ stores declined. Discount Store were having problems even before the pandemic, but now even they seem to have largely recovered, +8.7% YTD vs 2019. Clubs/SuperCtrs and $ Stores remain strong. These channels promote value. Their success vs both 2020 and 2019 reinforces its importance in Consumer spending decisions.
  • Office, Gift & Souvenir Stores– $ declined slightly from March but were +159% vs April 2020. The pandemic hit them hard. They are still down vs 2019 – monthly and YTD. Recovery is a long way off, but things are improving.
  • Internet/Mail Order – Although $ dropped in April the pandemic continues to accelerate this channel’s growth. In April of 2020, their YTD growth rate was +17.1%. In April 2021, it is +25.4% – a 48.5% increase.
  • A/O Miscellaneous – This is a group of small to midsized specialty retailers – chains and independents. It includes Florists, Art Stores and Pet Stores (22>24% of total $). Pet Stores were usually essential, but most stores were not. In May 2020 they began their recovery. Their 2020 total sales were up +11.6%. Although April $ were down from March, YTD sales are +31.4% vs 2020 and +46.9% vs 2019. This rivals the Internet. It’s looking good!

The Relevant Retail Segment began recovery in May, reached a record level in December, then $ fell in Jan & Feb. March sales set a record for the month, then the $ fell slightly in April. Almost all channels are showing growth. Currently the key drivers are the Internet, SuperCtrs/Clubs/$ Stores and Hdwe/Farm. Now, here are the Advance numbers for May.

2020 will always be a memorable year for both its traumas and triumphs. In April & May we experienced the 2 biggest retail spending drops in history, but the problems actually began in March. Retail sales began to recover in June and in October, YTD Total Retail turned positive for the 1st time since February. In December, Total Retail broke the $600B barrier – a historic first. While sales fell from their December peak, monthly sales records were set in both January and February. Then they took off again in March, breaking $600B again while setting a new monthly sales record of $633.1B. April sales were down slightly but were the second highest in history. Restaurant $ were down slightly from 2019. This was the only negative vs 2020 or 2019 for any group. In May, Auto had a slight, -0.1% decrease from April. All other groups increased sales. The result was yet another Total Retail spending record, $644.4B. Restaurants were still down slightly YTD vs 2019. Once again, this was the only negative for any big group vs 2020 or 2019. Some other areas of the economy are still suffering, and some spending behavior has changed but the overall Retail marketplace has strongly recovered.

Total Retail – In March, Total Retail hit $633.1B, a record for the most spending in any month in any year. In April, $ales dipped to $616.7B but were still $218.4B more than April 2020 – a record increase, which was more than double the size of last year’s record drop. That brings us to May. As we said, sales set another new record, $644.4B. Moreover, the current YTD average annual sales growth rate since 2019 is 8.7%, the strongest ever in records going back to 1992. Total Retail has not just recovered. It is stronger than ever.

Restaurants – This is the only big group with any negative measurements vs 2020 or 2019 . Last February YTD sales were up 8.1% vs 2019. The Pandemic changed that. Restaurants started to close or cease in person dining in March and sales fell -$33.3B (-52.5%) compared to March 2019. Sales bottomed out in April at $30.1, the lowest April sales since 2003. Sales started to slowly increase in May but never reached a level higher than 88% compared to the previous year. 2021 started off slowly. Through February,  YTD sales were down -16.7% from pre-pandemic 2020 and -10.0% from 2019. In March sales took off and grew steadily in April and May. Sales in both months exceeded 2019. YTD their $ are ahead of 2020 but still $6.3B (-2.0%) behind 2019. They are not “there yet” but their recovery is gaining strength.

Auto (Motor Vehicle & Parts Dealers)   – Staying home causes your car to be less of a focus in your life. Sales began to fall in March and hit bottom in April. Auto Dealers began combating this “stay at home” attitude with fantastic deals and a lot of advertising. It worked. They finished 2020 up 1% vs 2019 and have returned to a strong positive pattern in 2021. The “attitude” grew amazingly positive in March and slowed only slightly in April & May as sales exceeded $143B in all 3 months, by far the 3 biggest months in history. To show how well consumers responded to their campaign you just need to look at the data. This group has exceeded $110B in monthly sales only 11 times in history. 9 of those occurred after the onset of the pandemic.  YTD Avg Annual Growth Since 2019 = +13.0% – the best performance of any big group.

Gas Stations – Gas Station $ales have been a mixed bag. If you drive less, you visit the gas station less often. Sales turned down in March 2020 and reached their low point in April. They moved up but generally stayed about 15% below 2019 levels for the rest of 2020. In February they were still behind 2020 in monthly and YTD $ but ahead of 2019 in both measurements. In March, sales skyrocketed. They increased slightly in April and May and were 56.7% above May 2020. They have been positive in all measurements vs both 2019 and 2020 since March. Their comeback continues but there is another factor that must be considered – inflation. Gas prices can be pretty volatile. They dipped in the first 2 months of the pandemic but then returned to more normal levels for the balance of 2020. They began strongly inflating in 2021. In fact, the May 2021 prices were 56.9% above May 2020. That means that 100% of the 56.7% year over year lift in May came from higher prices. Analyzing retail can be complicated. YTD Annual Avg Growth Rate Since 2019 = +2.9%

Relevant Retail – Less Auto, Gas and Restaurants – This is what we consider the “core” of U.S. retail and has traditionally accounted for about 60% of Total Retail Spending. When you look at the individual channels in this group, you see a variety of results due to many factors – non-essential closures, binge buying, online shopping and a consumer focus on “home”. However, overall, April 2020 was the only month in which spending in this group was down vs 2019. Monthly $ales exceeded $400B for the first time ever in December ($407B). They finished 2020 up $260B, +7.1%. Their performance was the only reason that Total Retail was able to finish 2020 with positive numbers, +0.5%. Sales fell in January and February but set monthly records. In March they turned sharply up again, then dipped slightly in April but May brought the 2nd highest $ of all time. Currently, they are up $56.0B, +17.4% vs May 2020 and  +$260.2B, +17.5% YTD. We should note that that while December 2020 is still #1, March ($374.7B), April ($366.8B) and May ($378.9B) of 2021 are three of the five highest monthly totals of all time. It is also important that the Relevant Retail group has posted positive numbers versus last year and YTD for every month since April 2020 and their average YTD growth rate since 2019 now stands at +10.0%. Through May virtually all channels have now turned positive vs both 2020 and 2019. However, the primary drivers throughout the pandemic were and continue to be Nonstore, Grocery, SuperCenters/Clubs/$ Stores plus a never ending “spring lift” from Hardware/Farm and Sporting Goods.

Now let’s look at what is happening in the individual retail channels to see where the $ are coming from. May beat both April and March, and you will see that one of the increases vs 2020 was again literally “off the charts”. The groups are less defined than in the Final Monthly reports and we will look across the whole market, not just pet relevant outlets.

Sales in 10 of 13 channels were up vs April and 11 were up vs May 2020 $. Only 1 was down vs 2020 YTD while a different channel was down vs 2019 numbers. (Relevant Retail YTD Avg Annual Growth Rate since 2019 = +10.0%)

After hitting bottom in April 2020, Relevant Retail has now beaten the previous year’s $ for 13 consecutive months. The group set an all-time record of $407B in December and finished  2020 +$260B vs 2019. 2021 started strong, with record sales in every month. March > May ranked #2, #4 & #5 of all time. Essential channels are still the primary drivers:

  • Nonstore Retailers – The biggest driver. Online shopping continues to grow in # of households and in $.
  • Food & Beverage – Grocery– Restaurant $ are improving but consumers continue to eat & drink more at home.
  • Bldg Materials/Garden/Farm– Their “Spring” lift continues unabated as consumers focus on their home.
  • SuperCtrs/Club/Value/$ Strs – They keep the GM channel positive. Value is still a major consumer priority.

Regarding the Individual Large Channels (Includes YTD Avg Annual Growth Rate since 2019)

General Merchandise Stores – Sales bounced back in May and all numbers are positive. Department Stores $ remain up vs 2020 but down vs 2019. They were having problems before the Pandemic. After dipping to +7.5% in February, the growth rate by Club/SuperCtr/$ stores has remained near the current 8.7%. These stores are still the key to this channel.

  • YTD Avg Annual Growth: All GM = +6.9%; Dept Stores = -1.8%; Club/SuprCtr/$ = +8.7%

Food and Beverage, plus Health & Personal Care Stores – Sales in Grocery were down in March>May from 2020 – No surprise, as these were 2020 binge months – especially March. The Health, Personal Care group finished 2020 at +1.8%. 2021 has started even better. With strong March > May sales, YTD they are +11.2% vs 2020 and +9.3% vs 2019.

  • YTD Avg Annual Growth: Grocery = +6.7%; Health/Drug Stores = +4.5%

Clothing and Accessories; Electronic & Appliances; Home Furnishings – March, April and May have been spectacular for all these channels. The increase vs May 2020 was again literally off the chart for Clothing. All of these groups were up vs April and remain positive in all measurements vs 2020 or 2019 for the 3rd consecutive month.

  • YTD Avg Annual Growth: Clothing = +2.7%; Electronic/Appliance = +2.3%; Furniture = +10.2%

Building Material, Farm & Garden & Hardware – Their Spring lift began on time in 2020 and has never stopped. They have greatly benefited from consumers focusing on their home needs. They finished 2020 +53B (+13.8%). Sales took off in March, set a record in April then dipped slightly in May. They are +21.1% YTD vs 2020. Avg Annual Growth = +15.0%

Sporting Goods, Hobby and Book Stores – Book & Hobby stores are open but Sporting Goods stores have driven the lift in this group. Consumers turned their attention to personal recreation and sales in Sporting Goods outlets took off. The group ended 2020 +5.5% vs 2019. The growth accelerated in 2021. January > May set monthly records and March had the most $ of any non-December month in history. May YTD they are +55.2% vs 2020. YTD Avg Annual Growth = +17.3%

All Miscellaneous Stores – Pet Stores were deemed essential but most other stores were not, so closures hit this group particularly hard. Sales hit bottom at -$3.8B in April then began to rebound. They finished with a strong December and ended 2020 down $1.0B, -0.7%. In March sales took off and the channel set a new all-time monthly record of $14.3B in May. Their YTD sales are now 33.2% above 2020 and 24.0% more than 2019. It appears that their recovery has become very real. YTD Avg Annual Growth = +11.4%

NonStore Retailers – 90% of the volume of this group comes from Internet/Mail Order/TV. The pandemic accelerated the movement to online retail. In February 2020 NonStore $ were 8.6% YTD. In December monthly sales exceeded $100B for the 1st time. They ended 2020 at +21.4%, +$162.9B. This was 63% of the total $ increase for Relevant Retail Channels. Their 2020 performance far exceeded their 12.9% increase in 2019 and every month in 2021 has produced record $. May was -0.2% vs April but still +8.2% vs 2020 and YTD $ are +21.0%. YTD Avg Annual Growth = +18.2%

Note: Almost without exception, online sales by brick ‘n mortar retailers are recorded with their regular store sales.

Recap – 2020 was quite a year. April & May had the 2 biggest year over year sales decreases in history while December sales broke $600B for the first time. 2021 may become even more memorable. March>May became the 3 biggest $ales months in history with the 3 largest year over year monthly sales increases ever. The total increase was +$513B, almost triple (2.93 times) the -$175B decrease from March>May 2020. At yearend 2020, Restaurants, Auto and Gas Stations were still struggling but Auto had largely recovered. Relevant retail had segments that also struggled but overall, they led the way for Total Spending to finish the year +0.5% vs 2019. 2021 has started out even more positive. The Auto Segment is setting sales records. Gas Stations $, with help from inflation, are now all positive and YTD Restaurant $ are only slightly below 2019. As documented in the report, the recovery in Relevant retail has become real for virtually all channels and monthly sales continue to set records. Retail has recovered. The new question is, “How high can the $ go?”

U.S. PET FOOD SPENDING $37.96B (↑$9.06B): MID-YEAR 2020 UPDATE

Overview of Pandemic Impact on the Survey & Data

The Pandemic has had a tremendous impact on consumers. It also impacted information gathering, including the Consumer Expenditure Survey which is managed by the US BLS and conducted by Census Bureau personnel. After March 8th nothing was done in person. In person Interviews moved online or to phone calls. Hard copy diaries were no longer collected. This process was also moved online or to phone calls where consumers read their diaries to agents over the phone. This had little impact on the interview reports. Initially there was a 5% drop in the response rate but that soon returned to normal. The Diary collection was a different story. The response rate plummeted by 50%. The US BLS immediately added additional households to the survey to make up for nonrespondents. Things improved as consumers and workers adjusted to the new normal, but the initial months were difficult. Through conscientious selection of participants, the US BLS was able to generate unbiased results. The variation for Total Spending in the 2020 report was 0.94% which is actually better than 2019’s 1.2%. That’s not to say that there were not some exceptions. Pet Food was one. The variation is within acceptable levels but is still substantially higher than 2019. We will address this in the Pet Food spending report that follows.

To put Pet Food spending into better perspective, let’s look at the impact of COVID on Consumer income & spending.

INCOME – Avg CU income $83.9K, +3.3%; 61% of the increase did occur in the 2nd half of 2019.

  • Total U.S. Income – $11.0T, Up $318B (+3.0%); 2nd Half 2019 was +$254B; 1st Half 2020 was +$64B.

SPENDING – Avg CU Spending – $61.7K, Down -1.1%; 2nd Half 2019 was +1.0%; 1st Half 2020 was -2.0%  

  • Total U.S. Spending – $8.1T, Down $116B (-1.4%); 2nd Half 2019 was +$108B; 1st Half 2020 was -$224B.

#CUs – 131.4M, Down 403K, -0.3% from a year ago but down 873K, -0.7% from the yearend 2019 all-time high of 132.2M. The onset of the Pandemic slowed the increased in income, but spending flipped negative, which is not unexpected.

Now Pet Food Spending

The report shows Pet Food (& Treat) Annual Spending at $37.96B, up $9.06B (+31.4%). The following charts and observations were prepared from calculations based upon data from that report and earlier ones. The first chart will help put the $37.96B into historical perspective and truly show you the roller coaster ride that is Pet Food Spending.

Here are the current numbers:

  • Mid 2020: $37.96B; $9.06B (+31.4%) from Mid-2019. The net +$9.06B in Mid 2020 came from:
    • Jul>Dec 2019: Up $2.30B from
    • Jan>Jun 2020: Up $6.76B from 2019.

Historical research has shown that Pet Food spending has been on a roller coaster since 2000, with 2 years up, followed by a flat or even declining year. This up and down “ride” has been driven by a succession of Food trends. The most recent were “Natural” in 2011 and “Super Premium” in 2014. Another factor was added in 2013 – deflation. As consumers opted for higher quality, more expensive pet food, competition became more intense, with the Internet now becoming a key player. 2013 was a definitely a game changer for this segment as it began an extended period of deflation which continued through 2018. Midway through 2018, Pet Food prices were still 2.3% lower than in 2013.

The spending drops in 2013 and 2016 were driven by pet parents value shopping for their recently upgraded pet food.

As it turns out, 2014 brought out yet another new factor in Pet Food spending. For over 30 years Baby Boomers have been the leaders in the Pet Food, both in spending and in adopting new products. They still spend the most, but it turns out that the 25>34 year old Millennials led the movement to Super Premium in late 2014. The older groups, especially Boomers followed in 2015 and spending rose $5.4B. At the same time, the Pet Food spending of the 25>34 yr olds dropped. At first, we thought they had rolled back their upgrade. However, it turns out they were leading the way in another element of the trend to Super Premium – value shopping. The Boomers once again followed their lead and spending fell -$2.99B in 2016. For consumers, the Super Premium upgrade movement consisted of 3 stages:

  1. Trial – The consumer considers the benefits vs the high price and decides to try it out. Usually from a retail outlet.
  2. Commitment – After a period of time, the consumer is satisfied and is committed to the food.
  3. Value Shop – After commitment, the “driver” is to find a cheaper price! – The Internet, Mass Market, Private label

This brought us to 2017. Time for a new “must have” trend. That didn’t happen but the competitive pricing situation brought about another change. Recent food trends have been driven by the higher income and higher education demographics. However, the “value” of Super Premium was established and now more “available”. Blue Collar workers led a new wave of spending, +$4.6B, as Super Premium more deeply penetrated the market. After the big lift in 2017, 2018 started off slowly, +$0.25B. Then came the FDA warning on grain free dog food. Many of the recent Super Premium converts immediately rolled back their upgrade and spending fell -$2.51B. This 2018 decrease broke a 20 year spending pattern. In the 1st half of 2019, Pet Food spending remained stable at the new lower level. In the second half of 2019 we started to see a recovery from the overreaction to the FDA warning and spending increased by $2.3B. Then came 2020. The recovery was continuing but a new outside influence was added which had a massive impact on U.S. consumers – the COVID-19 pandemic. In March nonessential businesses were closed. This also produced a wave of panic buying in some truly essential product categories. In the Pet Industry there is only 1 truly essential category – Pet Food. Coupled with the FDA “recovery” and the ongoing movement to Super Premium, this produced an incredible $6.76B lift in Pet Food Spending in the 1st half of 2020.

Let’s look at Pet Food spending by the 2 most popular demographic measures – age & income. The graphs are divided into larger groups than usual. This helps to mitigate any reporting anomalies. They still show both the current and previous 12 months $ as well as 2019 yearend. This will allow you to track the spending changes between halves.

The first graph is Income, which has been shown to be the single most important factor in increased Pet Spending. Here’s how you get the change for each half using the $70K+ group as an example:

$70K+ Mid-yr Total Spending Change: $25.10B – $16.82B = Up $8.28B (green outline = increase; red outline = decrease)

  • 2nd half of 2019: Subtract Mid-19 ($16.82) from Total 2019 ($19.01B) = Spending was up $2.19B in 2nd half of 2019.
  • 1st half of 2020: Subtract Total 2019 ($19.01B) from Mid-20 ($25.10B) = Spending was up $6.09B in 1st half of 2020.

  • We see 2 distinct spending patterns. Both have a small increase in the 2nd half of 2019 which is then followed either by a bigger lift or a drop in the 1st half of 2020. The $50>$100K group is the driving force behind the 1st half drop and it was big enough to bring the whole <$100K group down.
  • Perhaps the most obvious fact is the spending disparity due to income. Prior to the Super Premium era, $70K was the “halfway point” in Pet Food spending. In 2013 the under $70K group accounted for 67.8% of CUs and 51.3% of Pet Food spending (Performance: Share $/Share CUs = 75.7%). In the Mid-year 2019 report they had fallen to 59.1% of CUs and 41.8% of Pet Food $ (Performance = 70.7%). In this year’s report their share of CUs continued to drop to 57.0% but their share of Pet Food $ plummeted to 33.9% (Performance = 59.5%). Today’s true halfway point is probably about $120K but I added an under/over $100K measurement to get closer to the halfway point.
  • < $70K > Surprisingly, the Pet Food spending patterns for both groups are the same. Both show a small lift in the second half of 2019 as spending begins to recover from the negative impact of the FDA warning. A larger lift then happens in the 1st half of 2019. The FDA recovery continued but we also see the panic spending due to the onset of the pandemic. Obviously, this binge buying came mostly from higher incomes, who could more easily afford it.
  • < $50K This lowest income group closely matches the spending pattern of the highest income, $100K+ group. While income is increasingly becoming the most important factor in Pet Food Spending, it is not the only factor.
  • $50 > $100K – This middle income group was going along fine, recovering from the FDA warning in the 2nd half of 2019. Then came the pandemic and their spending dropped in the 1st half of 2020. The -$2.31B decrease was big enough to drive their spending for the 12 month period down -$1.85B (-20.0%). Based upon the numbers for <$70K and <$50K groups this drop in spending was equally divided between $50>$70K and $70>$100K. Even in “normal” times these low to middle income groups face a lot of pressure trying balance their manifold responsibilities with their take home pay.
  • $100K+ High income is increasingly becoming “where it’s at” in all Pet Spending. In Mid-2020, it went through the roof for Pet Food, +$9.2B (+80.6%). This is where the binge buying of Super Premium Foods happened.
  • < $100K > Although the actual halfway point for this year’s Pet Food spending is probably about $120K, $100K is much closer than $70K. The $100K+ group has 28.3% of CUs but 54.3% of Food $. (Performance = 191.9%) That’s great performance but 1 year ago it was 149.0%, which is not too bad. If we go back to 2013, the $100K+ group had 18.3% of CUs and 28.7% of Pet Food $. (Performance = $156.3%) This shows that the spending pattern has always been there. However, the single biggest factor is the growth in number of CUs. Since 2013 that has increased by 14.1 million, +61.4%. When you break the $100K income barrier, you spend more on your pets and Super Premium Pet Foods are a great “opportunity” for your added disposable income.

Now let’s look at Pet Food spending by Age Group.

Once again, we have bundled segments into larger groups to mitigate the impact of any larger percentages of variation that may be present in smaller segments.

  • We have 3 groups and 3 different patterns so age has a definite impact on spending behavior.
  • Under 35 – This group had a -$0.65B (-13.1%) drop in spending. The drop was basically equal in both halves of the 12 month period. However, most was driven by the <25 group, especially in the 1st half of 2020. Both the 25>34 and <25 groups spent a little less per CU, which may be due to value shopping, but the decline in spending was primarily due to a 2 million decrease in <25 CUs. 83% of this drop (1.7M) occurred in the 1st half of 2020. They likely moved back home with their parents and took their pets with them. This would explain part of the big lift in the 55+ group. Also, the 55+ yr olds likely spent more on premium foods.
  • 35 > 54 – This is the highest income group, but they also have the highest level of career and family responsibilities. They were finishing their FDA recovery in the 2nd half of 2019, +$1.09B. Then came COVID and Pet Food $ dropped -$1.43B. Their income was unaffected, but they dialed back their total CU spending by 2.7% and Pet Food by 11.6%. Much of the 1st half pet food drop was undoubtedly due to value shopping, likely on the internet.
  • 55 and older – This group, which includes all Baby Boomers, had a spending lift in both halves. The $1.52B increase in the second half of 2019 was largely driven by the ongoing recovery from the FDA warning. The spectacular $8.53B lift in the 1st half of 2020 came from a variety of factors. First and foremost was undoubtedly the panic buying of Super Premium pet foods. Remember, these are primarily Baby Boomers, the first Pet Parents. This type of reaction is to be expected. The other factors were a 2.1 million (+4%) increase in CUs and the 2+ million younger CUs who probably moved back home with their parents, bringing their pets with them. The increase was driven by the 55>64 year olds who have the highest income and were best able to handle the situation.
  • Spending in the under 55 group was up slightly in the 2nd half of 2019 but down in the 1st half of 2020. The over 55 group was up in both halves and were the only driver of the massive 1st half increase.

That gives us the “big picture” for our 2020 Mid-year update of Pet Food spending. In a “normal” year we would drill down into the performance of individual segments. However, the variations caused by the initial pandemic information gathering problems show up in individual segments, especially smaller ones. This has less impact on the total numbers but makes comparing segment performance within categories difficult.

The big lift in the 1st half of 2020 may be a little overstated but it comes as no surprise. We all saw pictures of empty shelves from consumers panic buying certain essential items. In the Pet Industry there is no more essential item than Pet Food and the current preference is for Super Premium. It isn’t called Super Premium for no reason. It costs a lot and usually comes in smaller quantities so stocking for a possible emergency can mean spending big bucks.

It also is no surprise that Boomers are behind the big lift. Their unwavering devotion to their Pet Children is what largely built today’s Pet Industry. In my research of the data, I came across an interesting correlation. The overall variation in sampling for Pet Food spending was within acceptable guidelines. The problem showed up in some individual segments.

Here are a few with exceptionally high Pet Food spending and high variation:

  • 55>64 Yr olds (Boomers)
  • Married Couple, oldest child over 18
  • Self-Employed
  • 2 Earners
  • Income $100>150K
  • Live in area <2500 pop.

Based upon our past knowledge, a CU with these characteristics is basically the ultimate Pet Food spending household. These are Super Pet Parents. They are beyond conscientious regarding their pets so it would be expected that they would be the mostly likely to respond to a survey conducted under the difficult circumstances caused by the pandemic. This could give their big $ Pet Food spending a disproportionate share of the sample and significantly drive up the mean. We should also note that this big variation was in Pet Food and not widespread in their responses. The variation in Total Spending was low for these segments with a high of 3.27%. All others were below 2.5%. This means that the US BLS and Census Bureau successfully conducted a survey that was demographically representative with no overall bias. The pet food spending may be a little high, but it is extremely likely that there was a big lift in the 1st half of 2020.

We are left with the usual answer in the Pet Industry…It was the Boomers. They get the credit for the big lift and possibly the “blame” for the big variation.

Even with new techniques, the sampling response returned to a more normal level in the 2nd half of 2020. We look forward to seeing the full year data for 2020 in September.

PET PRODUCT $ALES ACROSS U.S. RETAIL CHANNELS The Migration of “Pet Parents” – 1992 to 2017

Pets, Pet Food and Supplies sales have shown tremendous retail growth since 1992. According to the Economic Census, which is conducted every 5 years by the U.S. Census Bureau, retail sales totaled $51.32 Billion in 2017 – up from $8.2 Billion in 1992. The spectacular growth was fueled by Americans’ growing love and commitment to their pets. 67% of U.S. Households have a pet – twice as many as have a child under 18.

While the love was growing in our hearts, the sales of pet products were growing at retail. It was not a simple journey –straight to the top. It involved expansion to a variety of different outlets and consumer migration between channels driven by their search for value, convenience and selection.

In this report we will use detailed data from the Economic Census to update our ongoing analysis through 2017.

Here is a visual look at the growth since 1992. I have also included a line on the graph which is adjusted for “petflation” and gives us a better indication of the actual increase in the amount of product sold.

Retail Growth 1992 to 2017

  • 1992 > 2017: Up $43.12B (+525.9%); Avg Growth = 7.6%
    • 1992 > 2012: Up $32.27B (+394.8%); Avg Growth = 8.3%
    • 2012 > 2017: Up $10.85B (+26.8%); Avg Growth = 4.9%

Real Growth 1992 to 2017 (Adjusted for petflation – Pet Food & Supplies CPI)

  • 1992 > 2017: Up $25.16B (+306.8%); Avg Growth = 5.8%
    • 1992 > 2012: Up $17.78B (+216.8%); Avg Growth = 5.9%
    • 2012 > 2017: Up $7.38B (+28.4%); Avg Growth = 5.1%

Note: Most of the growth (76.3%) in Pets, Pet Food and Supplies has been real growth. Pet Products Prices increased 53.8% in the 25 years from 1992 to 2017 compared to an increase of 74.6% in the Total U.S. CPI and a 138.6% increase in Pet Services Prices (Vet & Non-Vet combined) in just the 20 years from 1997 to 2017.

Pricing in Pet Products was an issue from 2007 to 2009 when prices jumped 17% in just two years, in the heart of the recession. Consumers started searching for value. This was a key point in Pet Products channel migration. On the flip side, from 2012 > 2017 Pet Products prices fell -1.25%. Although the growth rate during this period was down from the long term average, the increase in the amount of Pet Products purchased was actually greater than the $ increase.

We’ll stay with the total market and look at some key factors that have affected the overall growth since 1992.

Here’s how each factor changed during each of the five year measurements since 1992.

1992 to 1997 – No growth in outlets or in retailers’ share of overall market. The big growth was increased store volume due to increased consumer product demand – which was filled by expanded departments and bigger pet stores.

1997 to 2002– A 27% increase in number of outlets and a 15% increase in per store volume pushed sales up 45%. A huge increase in the representation of Pet in the overall market as it became available in stores doing over 35% of total retail.

2002 to 2007 – Store count continues to grow – up 18% and the per/store volume goes up even faster – +21%. Sales are up 43%. The overall Retail Market Share of outlets selling products remains stable at 35%.

2007 to 2012 – Another 18,000 stores (+14%) and a huge increase in per store volume (+32.4%). Consumers have started shopping intensely for value since the recession…and they found it as sales increased 50%. It was also easier to find products in a store, as outlets doing 47% of the total U.S. Retail market stocked pet supplies in 2012.

2012 to 2017 – Sales Growth slowed markedly to 26.8%. There were 12.600 more stores but +7.8% was much less than in the past. Pet Products stocking stores also loss share of the overall market but are still over 43%. It looks like this drop occurs regularly every 10 years. The $ lift was primarily due to a 17.7% increase in $ales per store – still relatively strong.

1992 to 2017 – Sales Now $51.3B; Up $43.1B (+525.9%)

  • 160,282 “pet” outlets; Up 74,101 (+86.0%)
  • Outlets stocking “pet” do 43.4% of U.S. Retail.
  • Pet Products do 3.5% of an outlet’s total sales.
  • Pet Products = 1.5% of Relevant Retail; 0.7% in 1992

Now, let’s see how the consumers decided to divide up their Pet Products $.

PET PRODUCTS SALES AND MARKET SHARE BY RETAIL CHANNEL

This chart shows the shows in detail the # of outlets, total pet product $ and market share of the retail channels and segments stocking pet products from 1992 to 2017. Use it as a reference point. Additional charts will follow.

99.3% of Pet Products Sales are done by 5 major Retail Channels. Let’s look at their market share from 1992 to 2017.

Drug Stores were included for historical reference. In 1992, they had a bigger share than Nonstore and Hdwe/Farm combined. Now their $ and share are below Gas Stations. 5 Major channels account for 99.3% of Pet Products $.

Observations

Drug and Health Stores – They were once a small, but notable force in Pet Products sales. However, except for an uptick in 2012, their share of Pet Products $ has generally declined. Their Pet Products Sales are now basically impulse or convenience purchases, a pattern similar to that for Gas Stations and Convenience Stores.

Hardware and Farm – Early growth came from the Farm Store segment. Hardware jumped on board in 2002 and pushed the market share up to 5.4%, capturing 40% of this channel’s pet business. The overall share stayed fairly stable from 2002 to 2012 then plunged in 2017 due to huge drop in Hdwe/Home Centers Pet Products $. While Farm Stores $ have consistently grown since 1992, Hdwe/Home Ctrs have been on a true roller coaster ride since 2002.

Food and Beverage – Supermarkets account for 98% of the business in this channel. In 1992 Supermarkets were the #1 Pet channel, with 42.1% of the business. They increased their business 9.5% in 1997. Unfortunately, overall “Pet” sales took off – up 55%, so their market share fell 30%. Sales stagnated in 2002 and actually dropped in 2007. Needless to say, their market share continued to plummet – down 73% from the 1992 high. Where did the business go? – just about everywhere else, but primarily to General Merchandise Stores and Pet Stores. Then from 2007 to 2012 they executed a remarkable turnaround.  The number of Supermarkets carrying pet products increased by over 70%. They more than doubled their pet sales and gained back 3.6 points in market share. However, 2012 to 2017 brought another turnaround – a negative one. The number of Supermarkets carrying Pet Products fell -12.5% and their Pet Products $ dropped -$725M (-12.2%). Their market share is at an all-time low of 10.2%, which is 76% below 1992. Some of the business may have been lost to SuperCtrs/Clubs or even Pet Stores, but most probably migrated to the Internet.

Nonstore Retailers – This channel includes both mail order and the internet. The increases in pet products $ have been truly astronomical. Sales in 2017 are 100 times what they were in 1992 and their Market share is up over 1500%. Since 2007 and especially since 2012 the growth has been fueled by the internet. In the years up to and including 2012 the internet/mail order share of Pet Products $ mirrored their share of Total Retail $. However, they have stepped up in Pet Products since then. Internet/Mail order now sells 18.8% of Pet Products $, compared to 16.1% of total relevant retail $.

Pet Stores – In 1992 Pet Stores were the second largest retail channel selling pet products. The category caught fire. Big Box Pet Super Stores were developed and built to offer the consumer the wider selection that they sought. In 1997, due to the growth of chains, Pet Stores moved into the #1 position with a 40.5% share of the business. The proliferation of Super Stores resulted in the closing of a number of smaller Independents, so the number of stores and market share dipped slightly to 38.0% in 2002. They were still #1 but now they were being strongly pursued by General Merchandise Stores – not Supermarkets.  More Super Stores, along with a continued high consumer demand, brought their market share back up to 39.0% in 2007. They had maintained the #1 status with a market share of 38 – 40% for over 10 years. Then…the recession happened, and consumers became focused on value. Their store count was the same and sales grew but their market share fell 5.9 points (-15.1%). On the surface, it appears that the bulk of the business went to Grocery and Internet/Mail-order but almost every major channel and a few minor players got a piece of their lost share. Things certainly changed in the period from 2012 to 2017 as the world, including retail began to move increasingly online. Pet Stores not only held their ground, but they also actually had a slight gain in share. They capitalized on Pet Parents desire for personal interaction in pet products purchases along with their desire for the convenience of one stop shopping. More Pet Stores began offering grooming services and some even added Veterinary services. They will never beat Internet product prices, but you can’t get your dog groomed online!

Minor Players – Although their combined market share is under 1%, the widespread appeal of Pets has brought in retailers from a variety of other “Specialty” channels – Home Goods (Furniture), Value Clothing Stores, Sporting Goods, Gift…to name a few. Although their selection is generally limited, they do broaden the consumer availability of certain pet product categories in the overall U.S. Retail Market. The success or failure of their venture into the Pet Products world is usually dependent upon the overall success of the individual retailer. If they are attracting consumers and their business is growing, then they may have some success with Pet. After all it appeals to 67% of U.S. households.

General Merchandise Stores – Currently they are hanging on as the #1 major channel in Pet Products sales. This group enjoyed strong to spectacular growth from 1992 to 2007. The number of outlets grew from 10K to 37K (+250%); sales grew $8B to $9.5B (+533%); market share grew from 19.1% to 35.3% (+83.9%). From 2007 to 2012, the number of outlets continued to grow, and sales increased to $14.2B (+49.5%) but their market share actually fell 0.1%…Yet, they still took over the #1 position in Pet…by just matching the overall market increase. From 2012 to 2017, their number of outlets and sales grew but couldn’t keep up with the internet, so their share fell. There were also some changes within the segments in terms of product mix and classification. This is a large and complex channel and deserves a closer look.

All Department Stores – Stores have been classified as either Traditional Department Stores, like Macy’s or J.C. Penney or Discount Department Stores, like Wal-Mart or Target. For the Economic Census that has changed.

Traditional Department Stores Although they do 8% of this channel’s overall business, they are basically a nonentity in Pet Products. These stores have consistently loss market share as they have done little to meet the consumer’s changing “needs” – including failing to recognize and embrace the Pet Phenomenon in the U.S.

Discount Department Stores – This segment is the one that started the decline in traditional Department Stores. In terms of Pet Market Share, these stores were at their peak in 1992. The commitment to SuperCenters and the rise of Club Stores started their decline. Sales continued to increase until 2002 and there was even a little uptick in market share between 2002 and 2007. From 2007 to 2012 sales flattened out and the number of outlets fell. In 2012 they were surpassed by the Dollar/Value stores in Pet Products’ market share. Between 2012 and 2017 the corporate owners decided to revise the product mix in many of these outlets. The continued growth in sales by Super Centers convinced them to add increasing quantities of fresh groceries to the product mix. Although the fresh offering is not as extensive as Super Centers it became significant. For the Economic Census, it was decided to eliminate the Discount Department Store Classification. Most of the existing outlets were classified as Super Centers. Those with an insignificant fresh grocery segment were lumped in with All Department Stores which included the traditional stores. The result was that Pet Product sales in the all department stores segment now mirrored that of the traditional stores – essentially zero.

SuperCenters & Warehouse Club Stores – This segment has been a retail winner since it came into play in the 90’s. It has shown consistent, even spectacular growth and in every measuring period its % increase in Pet Products $ has surpassed even the impressive growth rate of the overall Pet Products market. In 2007 they moved up in rank to #2, behind only Pet Stores in sales. Their pet products sales and share growth slowed from 2012>2017 and much of the growth from 2012 to 2017 must be attributed to the reclassification of many Discount Department stores. In fact, in 2012 the combined Pet Products $ share of SuperCtr/Clubs and Discount Dept Stores was 29.6%. In 2017, the share of all stores classified as SuperCtr/Club outlets was 27.0%. Like almost everyone else, this group lost $ to the internet.

$ Stores/Value Retailers – This channel was originally occupied by 5&10¢ Stores. They faded and were replaced by these Value Retailers. Since 1997, the store count and Pet Product sales have gone up dramatically. Their appeal and their share of the total market has grown markedly since the recession. In terms of number of outlets selling Pet Products, in 2017 they passed Supermarkets to take over the top spot. Their sales and market share also grew so they now rank #5 in Pet Products sales. Unlike most channels, they gained ground, in the internet wave.

Speaking of the internet wave, let’s take a closer look at the specifics for 2012>2017. First, the major channels Here’s the 2017 market share by Channel: (Arrows show if they are up , down and by how much in share from 2012)

  • GM Strs: 33.6% ↓1.6
  • Pet Stores: 33.3% ↑0.2
  • Nonstore Retailers: 19.0% ↑9.5
  • Food & Bev (Groc): 10.4% ↓4.6
  • Hdwe & Farm: 3.0% ↓2.3
  • All Other: 0.7% ↓1.2

Only Pet Stores held their ground and even gained a little in the Internet tsunami.

Now let’s look at the individual segments in terms of 2017: (Same rules as above)

  • Pet Stores: 33.3% ↑0.2
  • SuperCtrs/Club: 27.0% ↑2.9
  • Internet/MailOrder: 18.8% ↑9.6
  • Supermarkets: 10.2% ↓4.5
  • $ Value Strs: 6.5% ↑0.9
  • Farm Stores: 2.6% ↓0.5
  • Gas/Convenience: 0.5% ↓0.3
  • Hardware: 0.3% ↓1.9
  • Drug Stores: 0.3% ↓0.7
  • Other Nonstore: 0.2% ↔0.0
  • Furniture/Home: 0.1% ↓0.2
  • All Dept Strs: 0.03% ↓5.47

 The story is a bit more complex, and the specifics can be a little bit misleading. The gain by SuperCtrs/Clubs was largely due to the assimilation of many Discount Department Stores into this channel. The combined share of these two channels was 27.0% in 2017. That’s down -2.6% from 29.6% in 2012. There was also another winner – $ Value Stores. Consumers love the value and convenience of these outlets and they continue a rapid expansion in numbers.

The move to the internet is definitely a trend. Let’s look at some major trends that have impacted and continue to affect Pet Product Sales over the 25 years from 1992 to 2017.

There are 3 driving forces in consumer spending behavior:

  • Value (quality + price) – Looking for a deal.
  • Convenience – Make shopping easy.
  • Selection – They want choices. 

With that in mind, let’s look at the trends indicated by our analysis:

  1. The biggest trend is Value. It has shown consistent growth in importance and has been the single biggest factor since 2007. The channels that focus on Value are SuperCtr/Clubs, $ Stores and Internet/Mail order. They are definitely winning.
  2. One Stop Shopping is all about convenience. This is the second biggest driver and explains the ongoing success of SuperCtr/Clubs and the Internet. Supermarkets began this trend in the late 1970s by radically expanding their Gen Mdse sections in an effort to fulfill this consumer need.
  3. Groceries in the store. In 1992 consumers bought most pet products where they shopped for groceries – Supermarkets. In 1997 Supermarkets lost the top spot to Pet Stores. The GM Channel was also growing at this time and SuperCtr/Clubs also offered full grocery sections. Since 2012, consumers have come full circle and once again buy most Pet Products where they shop for groceries.
  4. The rise of Pet Super Stores and chains took off in the 90s. Their huge selection of Pet Products had a great appeal to the new generation of Pet Owners – Now Pet Parents. Pet Stores became the single biggest channel for Pet Products sales in 1997. Their success caused other channels to expand their Pet Sections. Pet Stores lost some ground in 2012 but they held onto the top spot and even gained share in 2017 by offering more Pet Services in store. They appealed to the consumer with 1 stop pet shopping.
  5. Internet – Their success should be no surprise. The game plan for online retailers exactly fits the consumers “wish list”. Great Prices! Shop without leaving home. Plus, a nearly unlimited selection

Summary

The underlying cause behind migration is evolution. In the migration of Pet Products there are two key evolutions taking place. The first is the evolution of Pet Owners to Pet Parents. Pet Parents are much more concerned about fulfilling the wants and needs of their Pet Children. This transformation took hold in the 90’s and accelerated during the early 2000’s when Pet Parents increasingly personified their pets. They began reading labels, became increasingly concerned about nutrition and now generally transfer human needs to their pet children. This movement continues to grow stronger.

The other evolution occurred in the retail marketplace and with all consumers. Consumers became less brand driven in their purchasing behavior and more concerned about value, convenience and selection. The great recession further cemented Value at the top. Online shopping was growing far before the pandemic moved it to the retail forefront.

We see the migratory results of the ongoing evolutions in our analysis.  In the 90s Pet Super Stores grew rapidly because they offered an unparalleled, broad selection of products to the ever increasing number of Pet Parents who were ready, willing and able to buy. Their success caught the attention of other retailers who expanded their Pet Products offerings. SuperCenters and Clubs were also growing strong at this time because these huge stores offered great Value and 1 stop shopping for groceries and a wide selection of GM categories, including Pet.

Everyone wants value but sometimes you don’t want to fight the crowds  – $/Value Stores are the answer. Great everyday prices plus brand name “close outs” in a small footprint store that is easy to navigate. Plus, they carry Pet Products. They continue to add stores and currently have more outlets stocking pet items than any other channel.

That brings us to the Internet, our most recent and largest migration, +9.6% gain in share. Want a bigger selection…. Go online. No one can build a store big enough to stock the selection of products available online…and with no brick and mortar overhead…you can get great value. Plus, you can shop for the best price and get what you want without ever leaving your easy chair…talk about convenient.

At this point, Pet Products have grown in importance and spread across the U.S. retail landscape. Consumer $ales are $51.3B, +525% from 1992. They are available in 160K outlets, up from 86K in 1992. They also account for 1.5% of Total Relevant Retail $, compared to 0.7% in 1992. The migration will continue. Brick ‘n Mortar Businesses need to adapt in the current internet surge. They must have an online presence and offer delivery and same day pickup in store/curbside if possible. Pet Stores have a unique advantage as they can offer pet services and personal interaction with Pet Parents and their pets – which can’t happen online. We’ll see how everyone adapts and what changes the next chapter brings.