2024 Pet Services Spending was $13.65B – Where did it come from…?
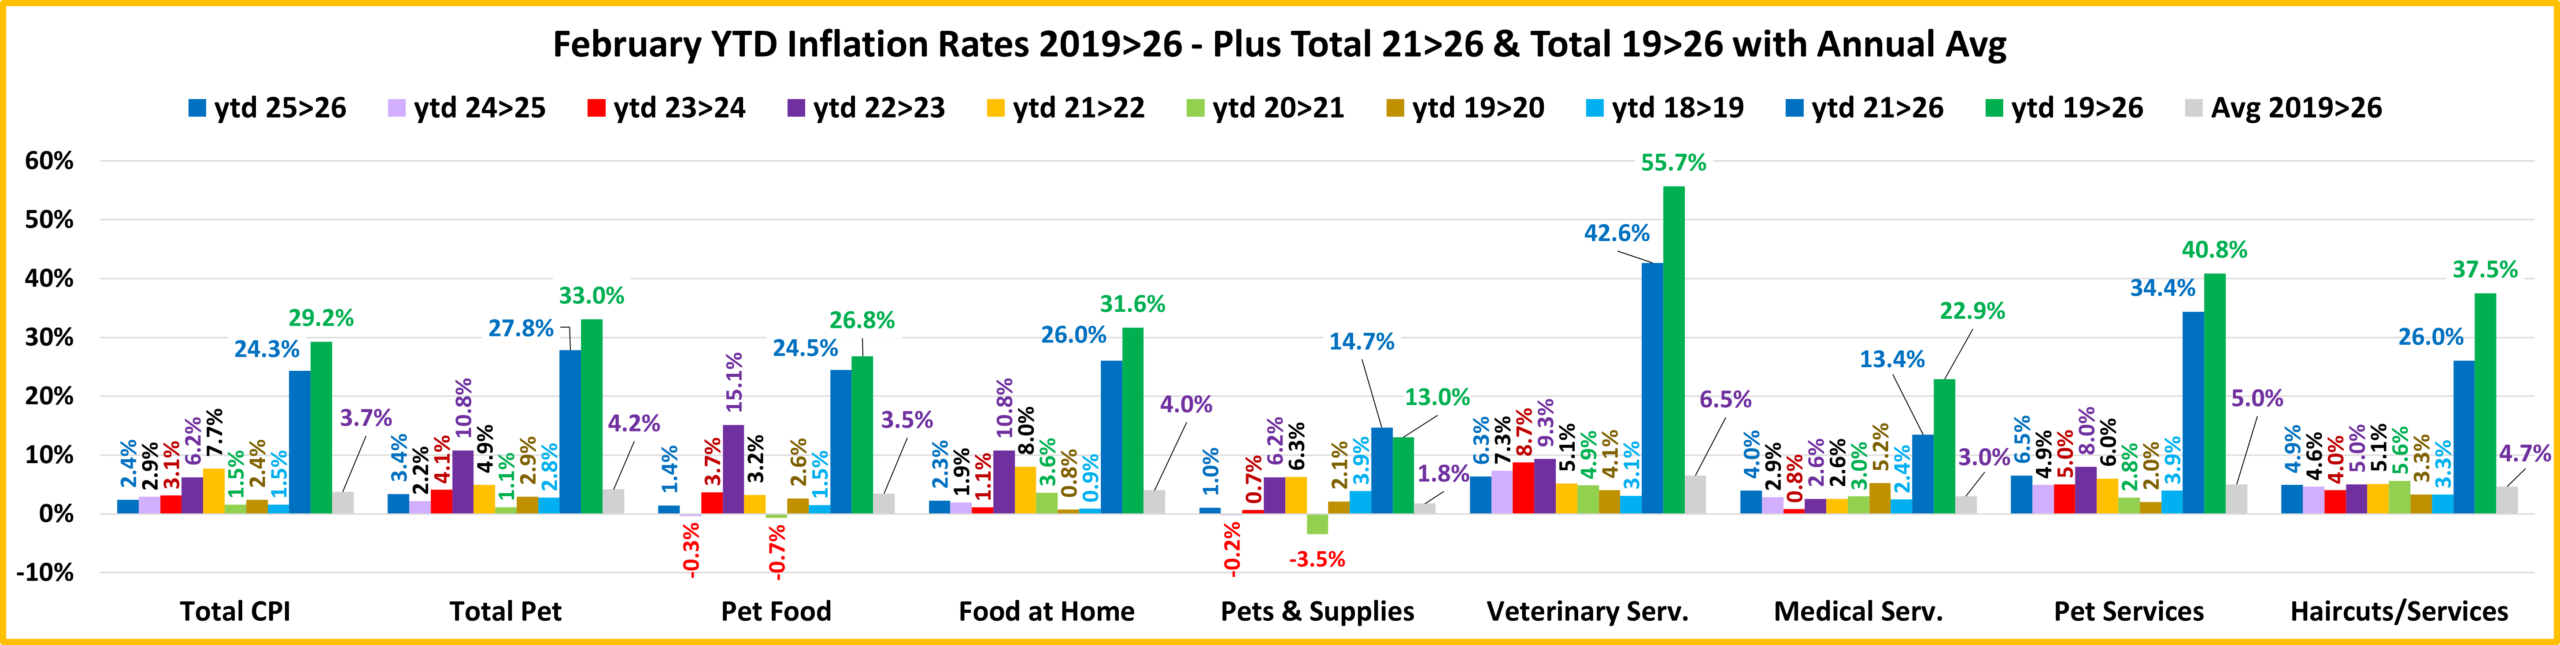
Next, Pet Services. It is by far the smallest Segment, but like Supplies & Veterinary, it had a record increase in 2021. However, unlike them, there was no $ drop in 2022. The lift grew stronger, up $3.26 (+35.8%). After the great recession, Services’ annual spending slowly but steadily increased. During this time, the number of Services outlets grew as brick ‘n mortar retailers looked for a way to combat the growing influence of online outlets. After all, you can buy products, but you can’t get your dog groomed on the Internet. This created a highly price competitive market for Pet Services. In 2017 there was a slight increase in visit frequency, but Pet Parents just paid less. This resulted in a 1.0% decrease in Services spending. In 2018 consumer behavior changed as a significant number decided to take advantage of the increased availability and convenience of Pet Services and spending literally took off, +$1.95B (+28.9%), the biggest increase in history. In 2019 Pet Parents, especially the younger ones, value shopped, and spending turned down $0.10B. In the 2020 pandemic Services outlets were often deemed nonessential and were subject to restrictions and closures which drove a huge drop in $. In 2021 things opened up and Services spending rebounded with 2 consecutive record lifts in 2021 & 2022. In 2023, the growth continued but it slowed, +$1.05B (+8.5%). It slowed even more in 2024, +$0.23B, +1.7%.
Services spending is the most discretionary, but its reach is expanding. Let’s look deeper into the demographics.
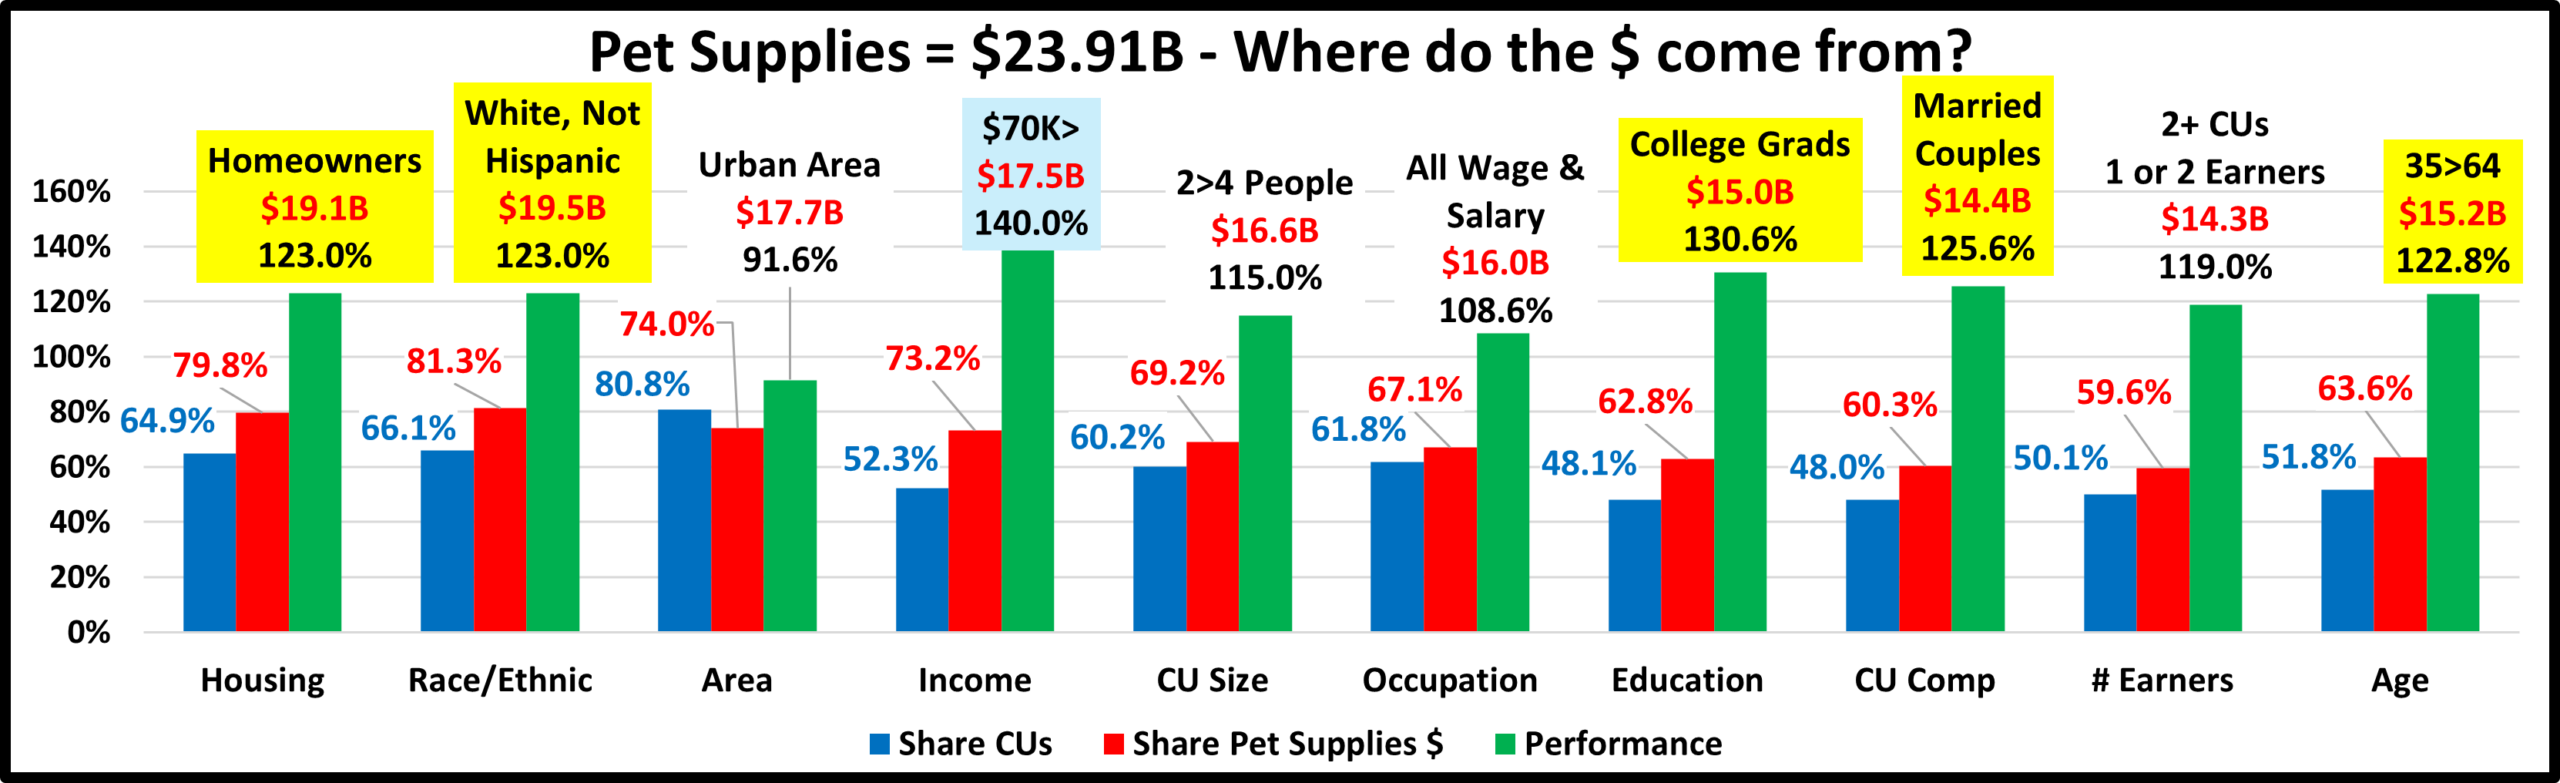
Let’s start by identifying the groups most responsible for the bulk of Services spending in 2024 and the $0.23B increase. The first chart details the biggest Pet Services spenders for each of 10 demographic categories. It shows their share of CU’s, share of Services spending and their spending performance (Share of spending/share of CU’s). In order to better target the bulk of the spending we altered 2 groups – income & housing. In 2023 4 were changed. The performance level should also be noted as 8 of 10 groups have a performance level above 120%. This is 1 more than 2023, but 2 more than Supplies, 3 more than Pet Food and even 1 more than Veterinary and Total Pet. The increase from 2023 indicates that Pet Services spending was likely less balanced in 2024. It again has the biggest disparity between the best and worst performing segments. Income is still the biggest factor in Services Spending. The categories are presented in the order that reflects their share of Total Pet $ which highlights the differences of the 8 matching groups. The biggest share ranking differences from Total Pet is that Education has a bigger share in Services.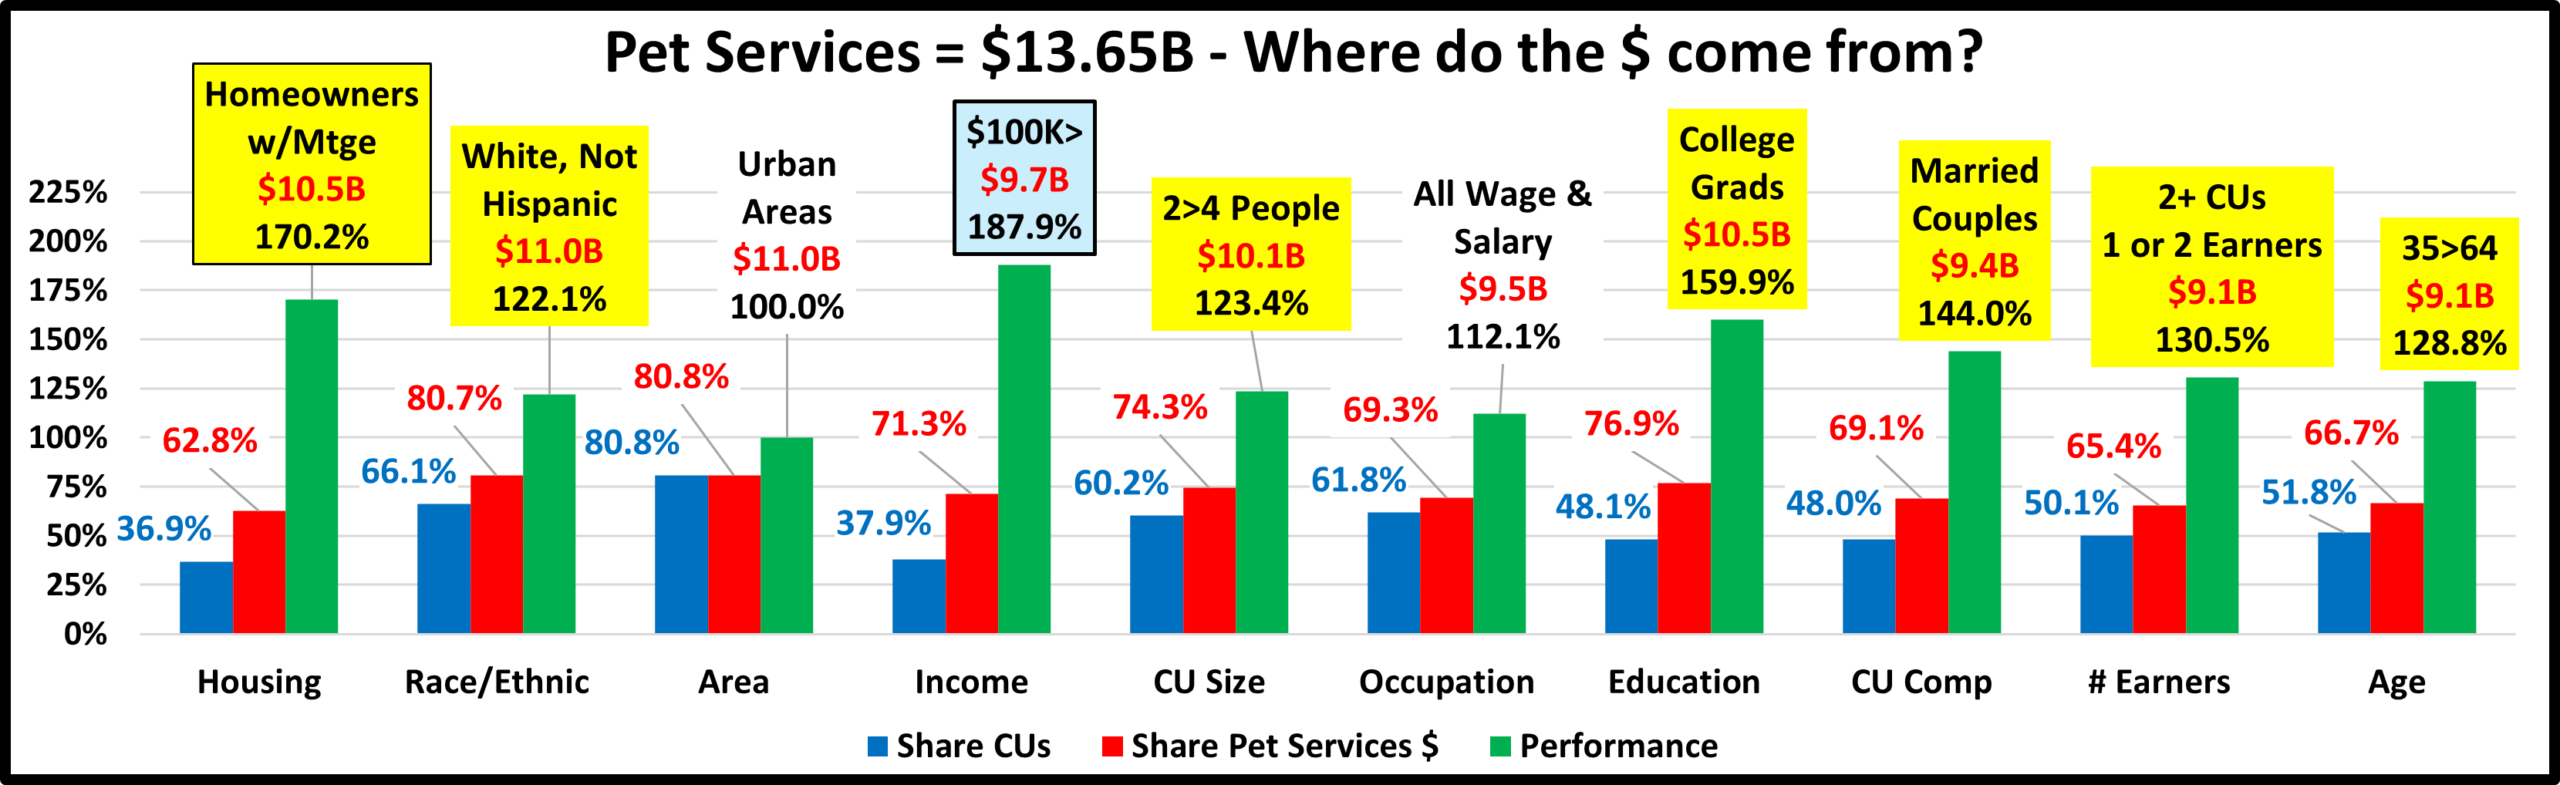
- Housing – Homeowners w/Mtge (62.8%) up from 61.3%. Homeownership is a big factor in spending in all industry segments. This special group was created because those w/Mtge reached the 60% target in 2023. Their performance grew from 162.6% to 170.2% and they stayed #2 in importance. Homeowners without a mortgage (-$0.10B) and Renters (-$0.01B) spent less.
- Race/Ethnic – White, not Hispanic (80.7%) down from 84.2%. This group accounts for most of the spending in all segments. Their performance fell from 126.9% to 122.1% and they dropped from 5th to 8th place in importance. Only Whites spent less. African Americans, +$0.27B & Hispanics, +$0.20B led the way.
- Area – Urban Areas (80.8%) up from 79.2% in share, and performance grew from 97.8% to 100.0%. They finally earned their share of $pending. Services is an Urban Segment. They are the only Pet segment with 100% performance. Only the Suburbs spent more, +$1.48B, but Center City was only -$0.05B.
- Income – $100K> (71.3%) up from 70.7% This group’s performance rating is 187.9%, down from 194.1%. Income is still by far the most important factor in increased Pet Services Spending. Only the $70>99K and $150>199K income groups spent more. At +$0.82B, $150K>199K had the biggest increase. The biggest decrease was -$0.34B by the $100>149K group. The performance decrease was due to a 2.5M increase in $100K> CUs while <$100K fell 1.3M.
- # in CU – 2>4 people (74.3%) up from 71.3% Their performance also increased from 119.2% to 123.4% and CU Size moved up to #6 from #8 in importance. Only 2 & 4 people CUs spent more. The biggest drop was -$0.37B by 3 people CUs. 4 People CUs were +$0.69B, which drove the share/performance lifts and put them in the 120% club.
- Occupation– All Wage & Salary (69.3%) up from 66.2% and their performance rating rose from 108.7% to 112.2%. They stayed #9 in importance. Only Mgrs/Prof and Retirees spent more. Managers & Professionals had the biggest $ increase, +$1.04B, +18.1%. The biggest drop was Self-employed, -$0.36B, -26.3%. These 2 spending patterns were critical in the lifts in share/performance. The Mgrs/Prof lift pushed the Total Wage & Salary Group up to +$0.58B while the Self-employed drop drove the other segments total down to -$0.35B. Hence…the changes
- Education – College Grads (76.9%) up from 72.7%. Income generally increases with education so Services spending grows with increasing education. Performance grew from 152.0% to 159.9% but Education stayed #3 in importance. Only HS Grads (only) & College Grads spent more. College: +$0.75B; <College: -$0.52B.
- CU Composition – Married Couples (69.1%) up from 67.8%. Married couples are a big share of $ and have 100+% performance in all segments. Their performance increased to 144.0% from 140.7% but they stayed #4 in importance in Services spending. Only Singles, Married, Child <6 and Married, Plus Adults spent less. All Married were +$0.33B, while Unmarried were -$0.10. This caused the changes.
- # Earners – 2+ CUs, 1 or 2 Earners (65.4%) up from (61.1%) All adults in the CU don’t necessarily work. Income is important but is slightly below avg for the 1 Earner segment. Their performance rose to 130.5% from 121.7% and # of Earners moved up from #7 to #4 in importance. Only the segments in this big group & No Earner, Singles spent more. The big group was +$0.72B which caused the share/performance lifts.
- Age – 35>64 (66.7%) up from 64.8%. Their performance grew from 124.0% to 128.8%. Age stayed #6 in importance. Only 25>34, 45>54 & 75> spent more. The 45>54 group was +$0.83B, +30.1%. This big lift made up for the -$0.43B drop by other members of this big group and drove the lift in share & performance.
We changed 2 of the groups for Services – Income & Housing to better target the biggest spenders. We should also note that Income is still more important to spending in Services than in any other segment. In the Big Groups, only Race/Ethnic fell in both share and performance. Also, Services now has 8 groups performing at 120+%, up from 7 in 2023 and 6 in 2022. Overall, in 2024 Services spending became less demographically balanced.
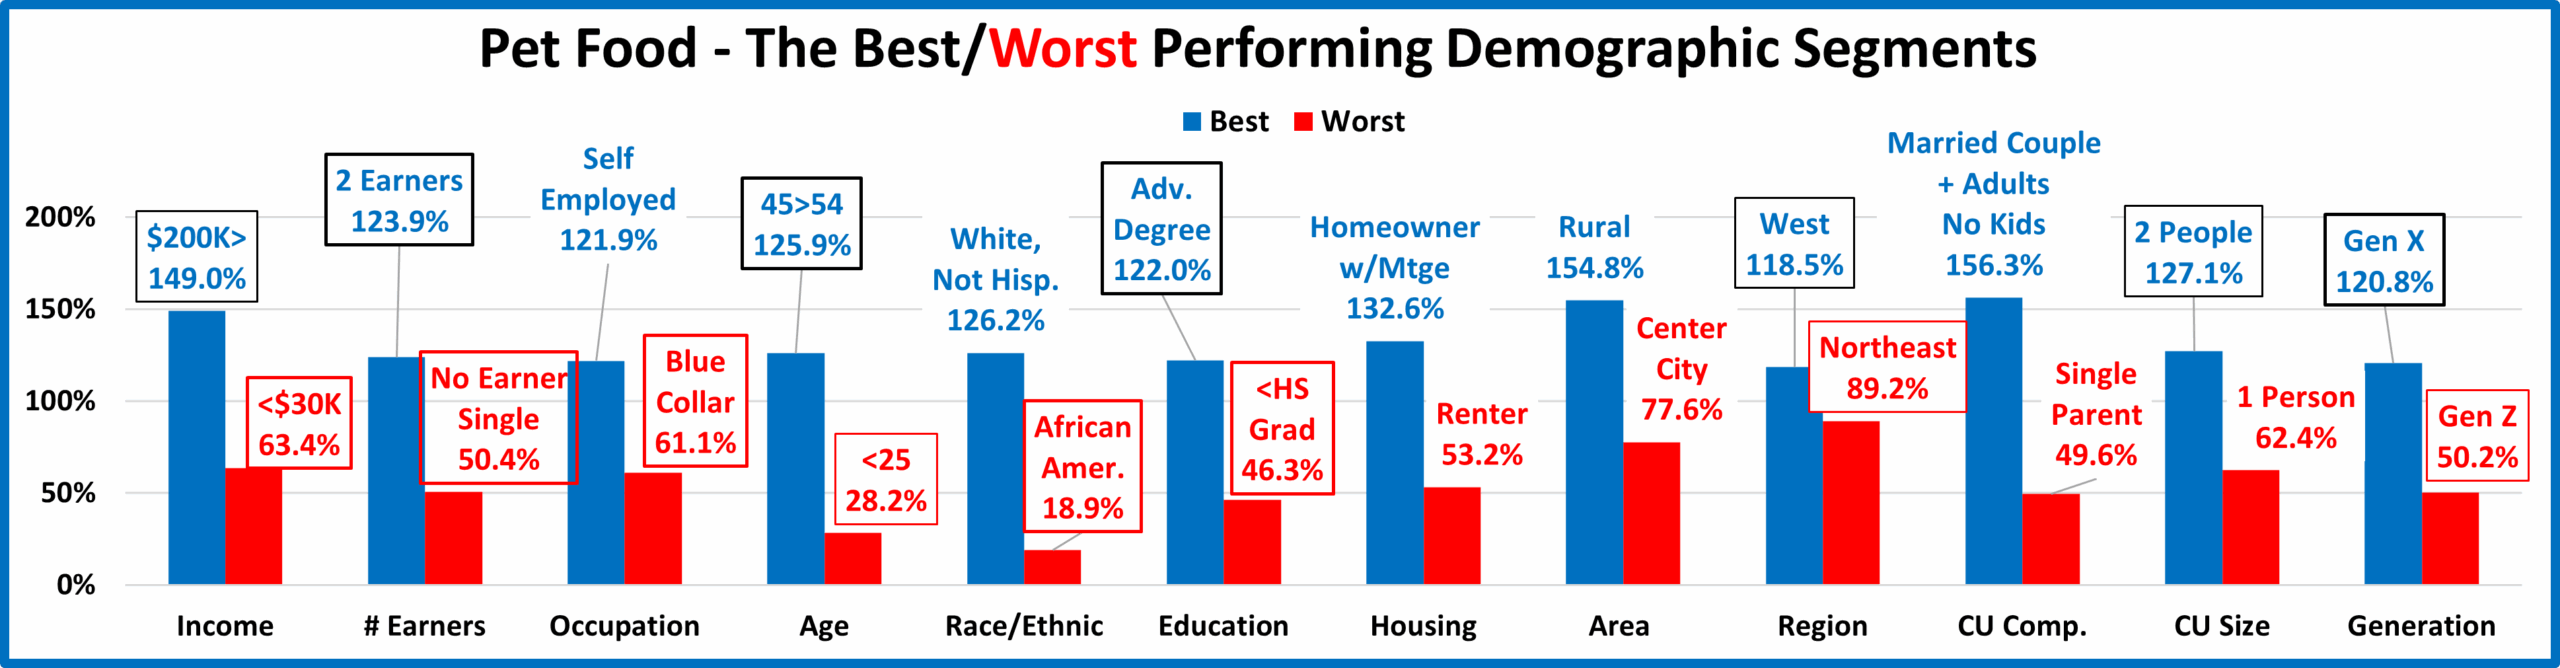
Now, we’ll look at 2024’s best and worst performing Pet Services spending segments in each category.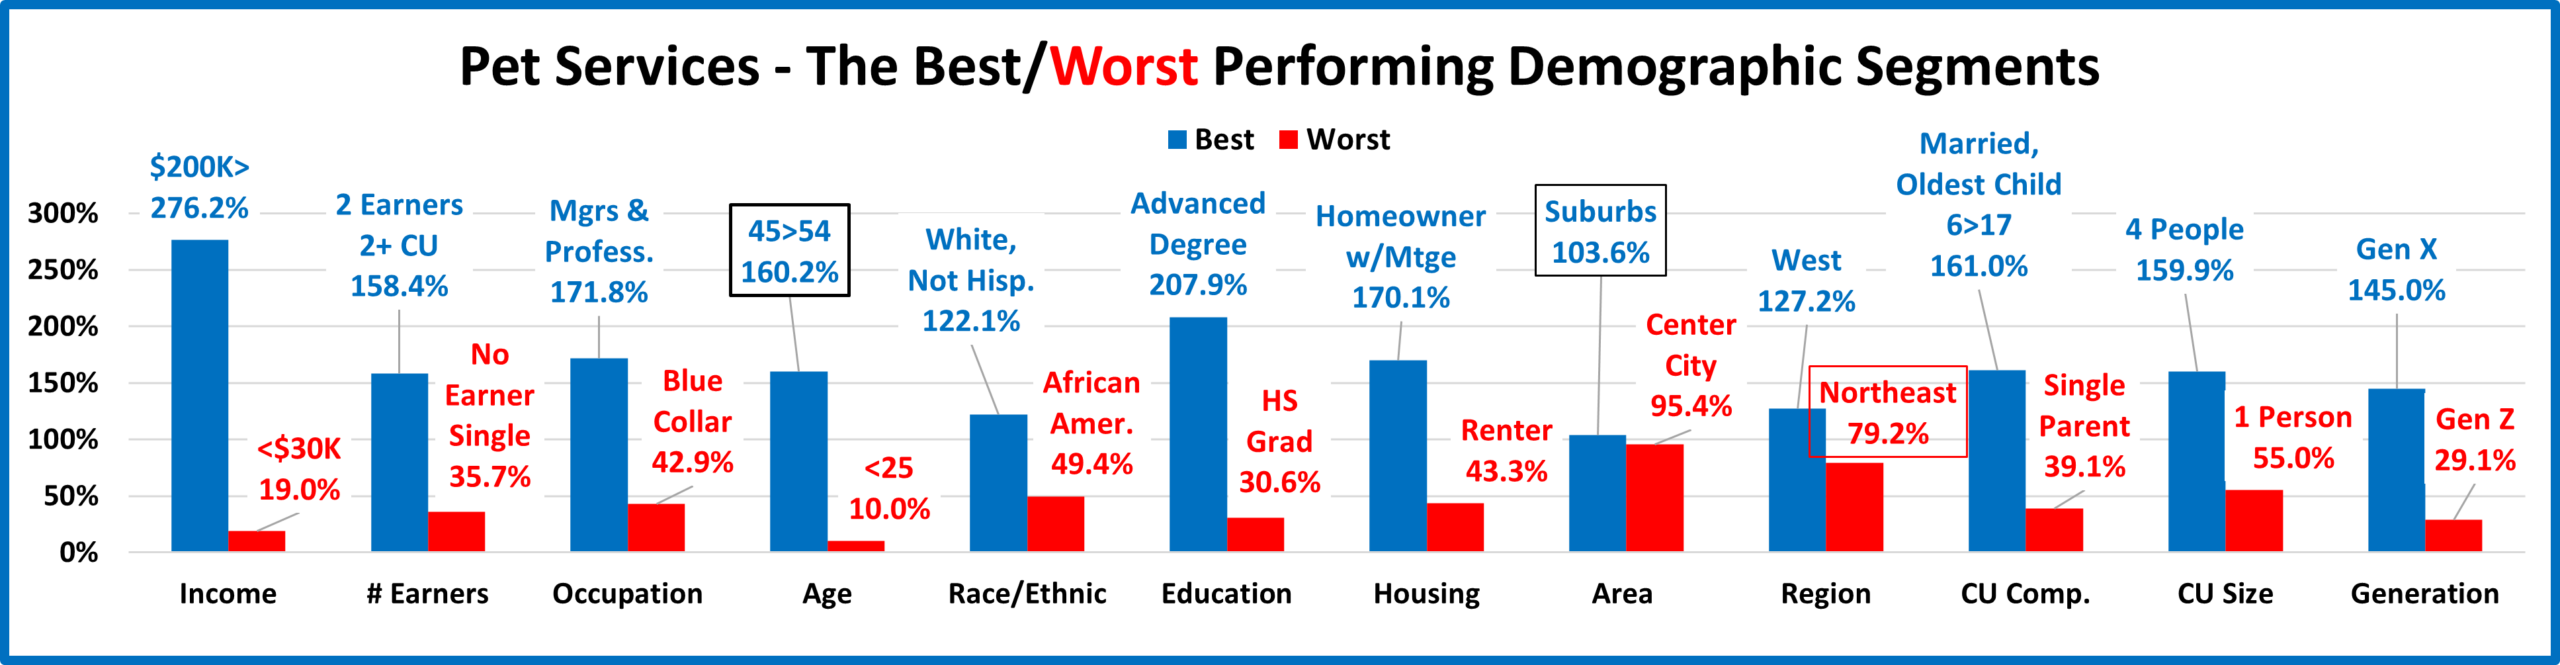
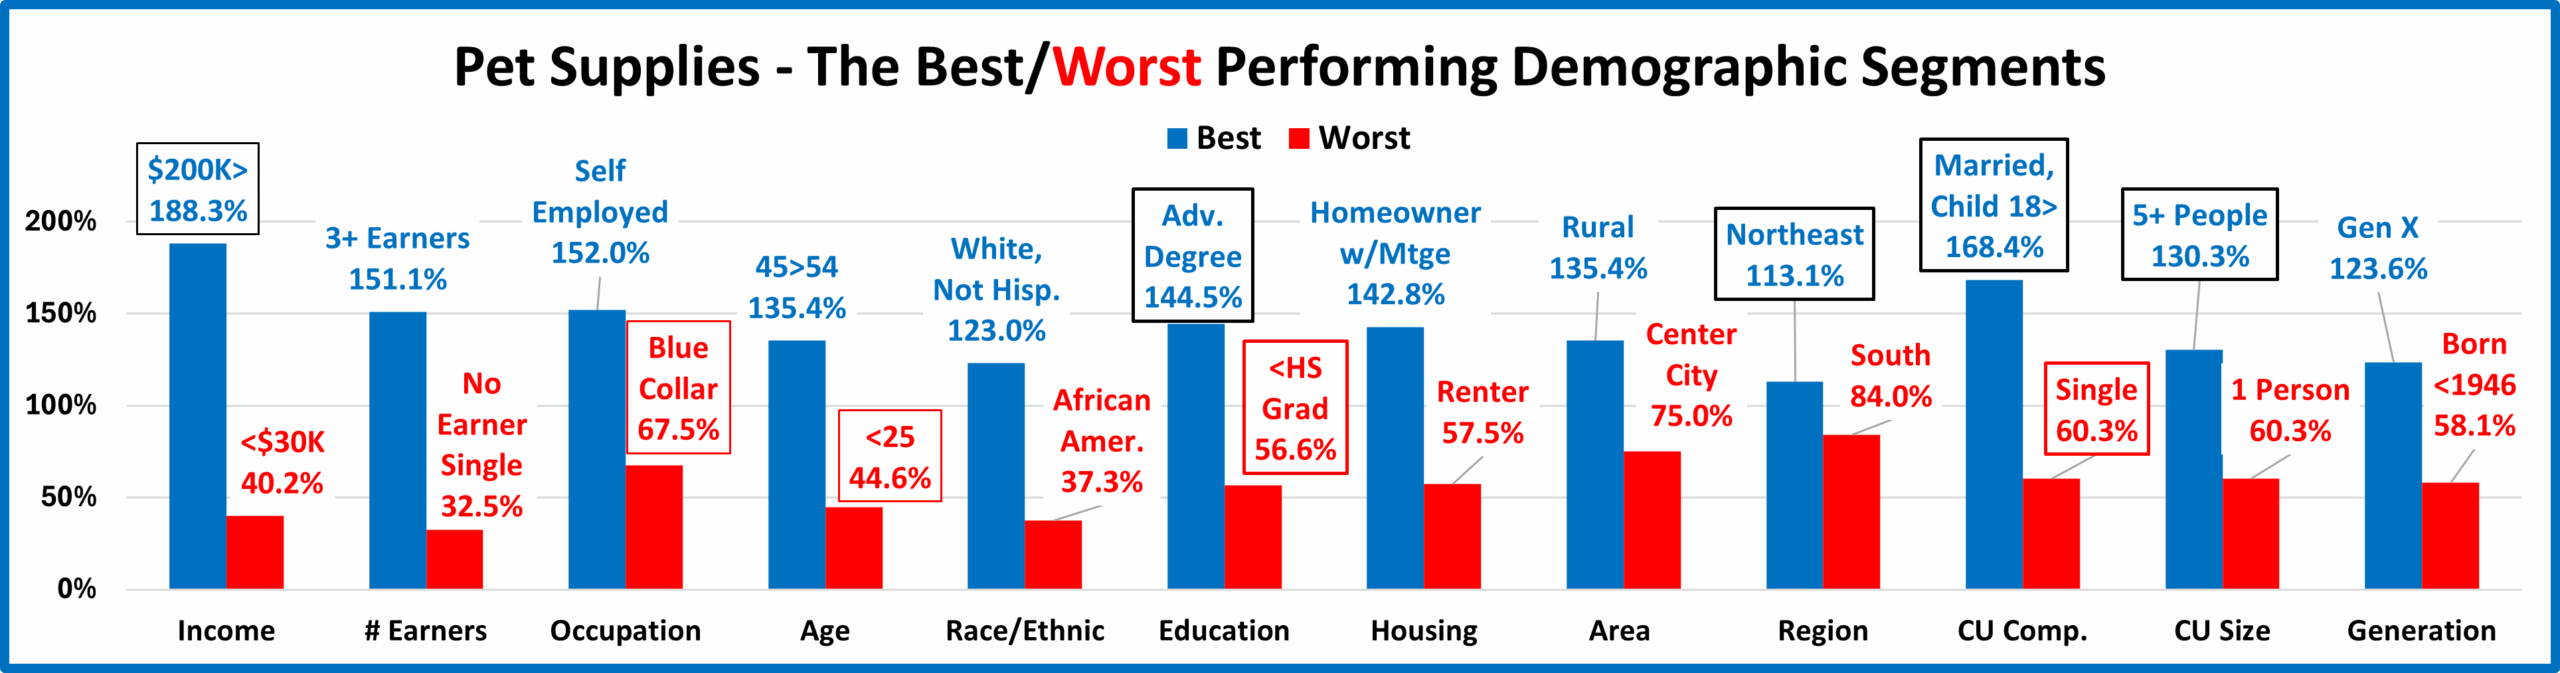
The best & worst performers are not surprising. There are 3 that are different from 2023, 2 Best & 1 Worst, 1 less than last year. CU Comp & Size reinforce the move towards “family” CUs. Income is a big factor for almost all categories. Gen X is still on top, but spending shifted away from 55>64, their oldest members, to 45>54. The average difference between Best & Worst is 119.5%, the highest of any segment and up from 111.8% in 2023. Pet Services spending became a little less balanced in 2024. Changes from 2023 are “boxed”. We should note:
- Income is most important in Services. 276.2%, down from 314.7%, but still the highest by any group in any segment.
- # Earners – 2 Earners stayed on top and No Earner, Singles stayed on the bottom.
- Age – 45>54 is all Gen X. They have the highest income. 35>64 have the 3 highest incomes & performed at 100+%.
- Area – Suburbs replaced Rural on top and Center City performance is now up to 95.4%.
- Region – In 2023, 3 were 100+%. In 2024, only 2 – West & Midwest. Northeast replaced South on the bottom.
- CU Composition – Married, Oldest child 6>17, are again on top while Single Parents remain firmly at the bottom.
- CU Size – The key is having 2+ people in the CU. Only 4 & 2 People perform above 100%. However, 3 & 5+ People are close. Both are 94.1% or higher. 1 Person CUs Services’ performance is 55.0%.
- Generation – Gen X retained the Top Spot and Gen Z stayed at the bottom. Millennials earned their share with 100+% performance, but not Boomers, 80.5%. Born <1946 was next to last with 57.2%.
In Pet Services spending performance, income is still the major factor. Spending began skewing younger in 2018. They slipped a little in 2019, but basically held their ground during the pandemic. In 2021, Boomers, Millennials and younger Gen Xers got on board. In 2022 & 2023, spending skewed towards older Gen Xers. In 2024, it was the Gen X core, 45>54.
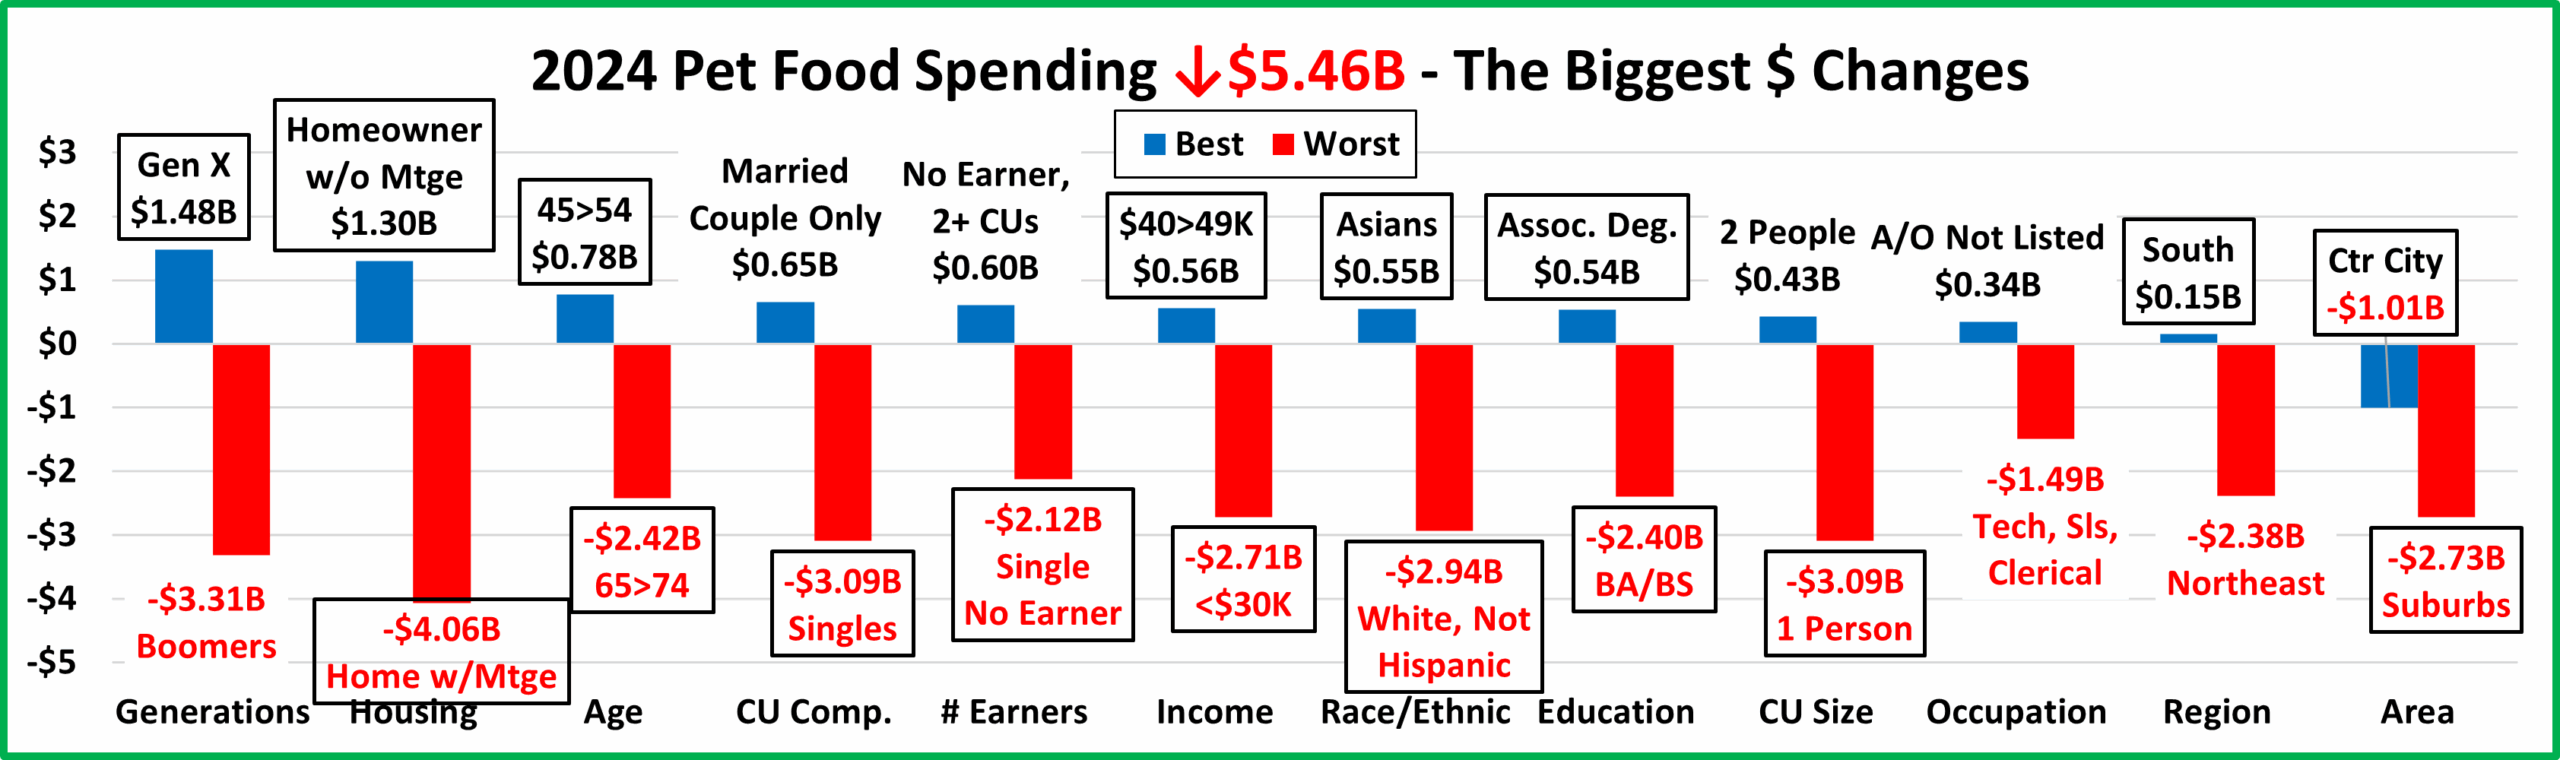
It’s time to “Show you the money”. Here are segments with the biggest $ changes in Pet Services Spending.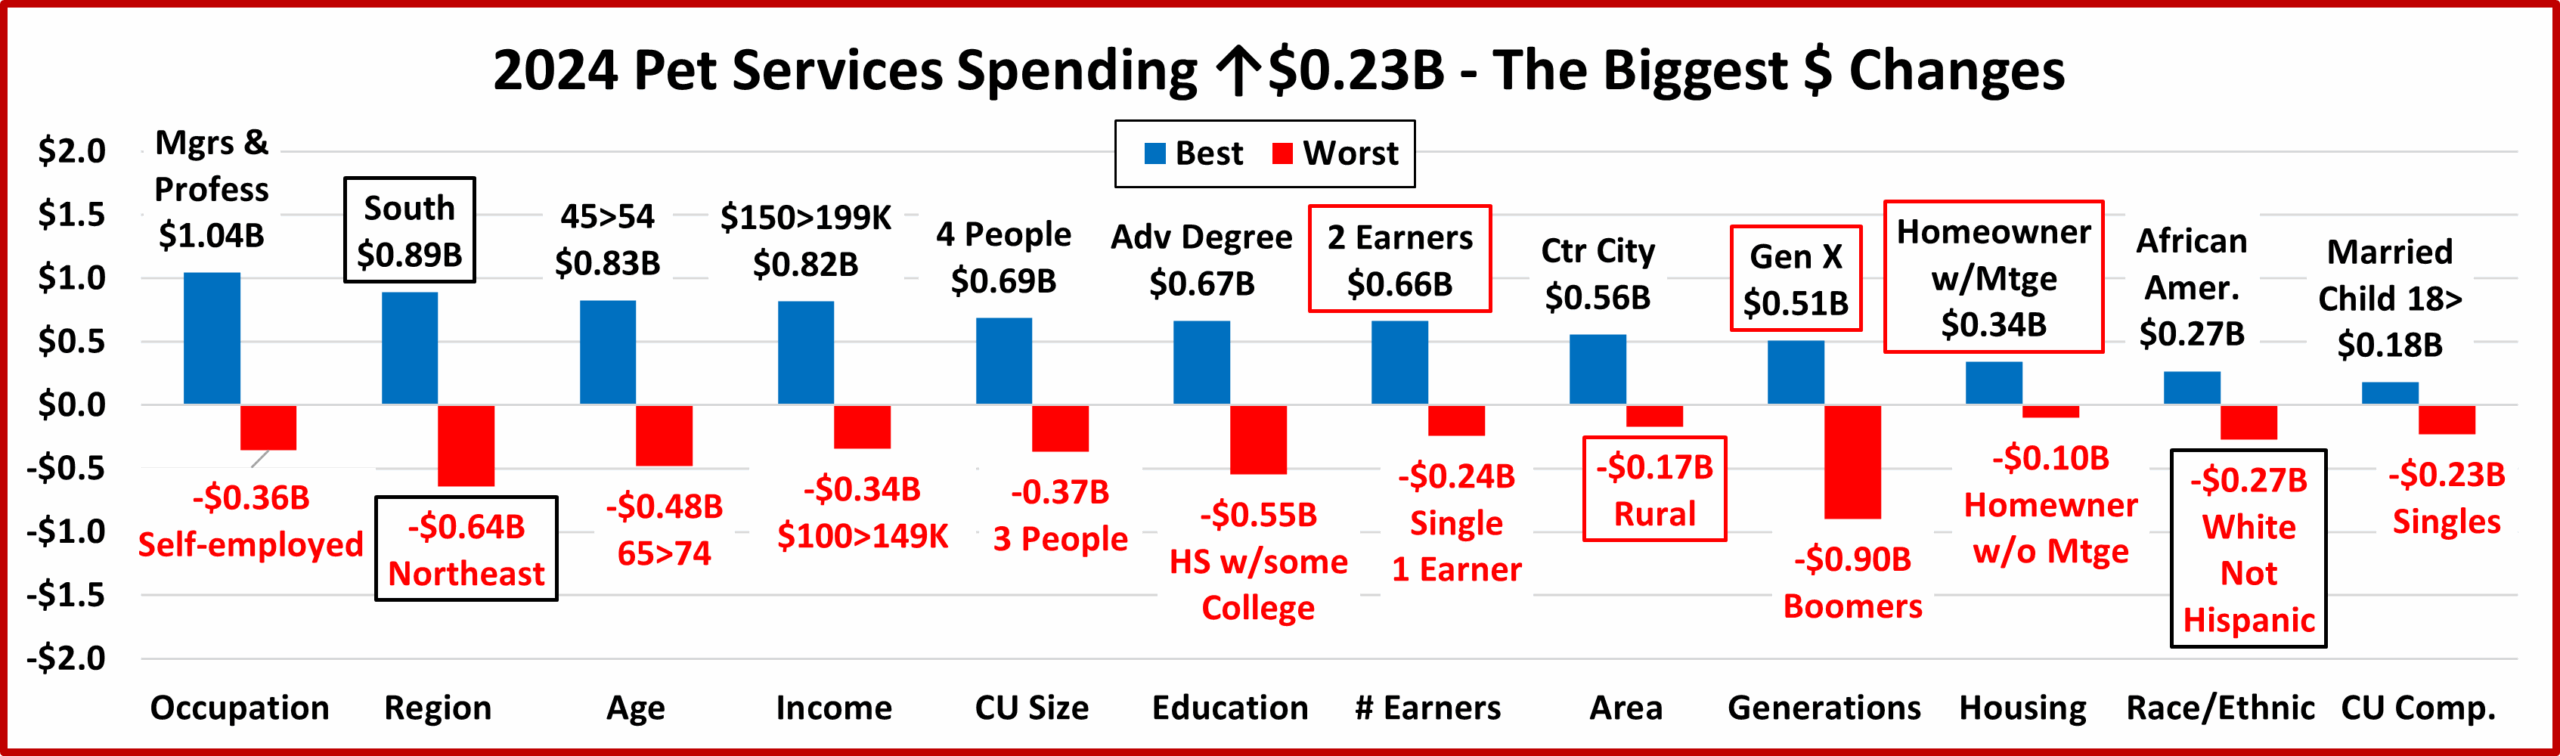
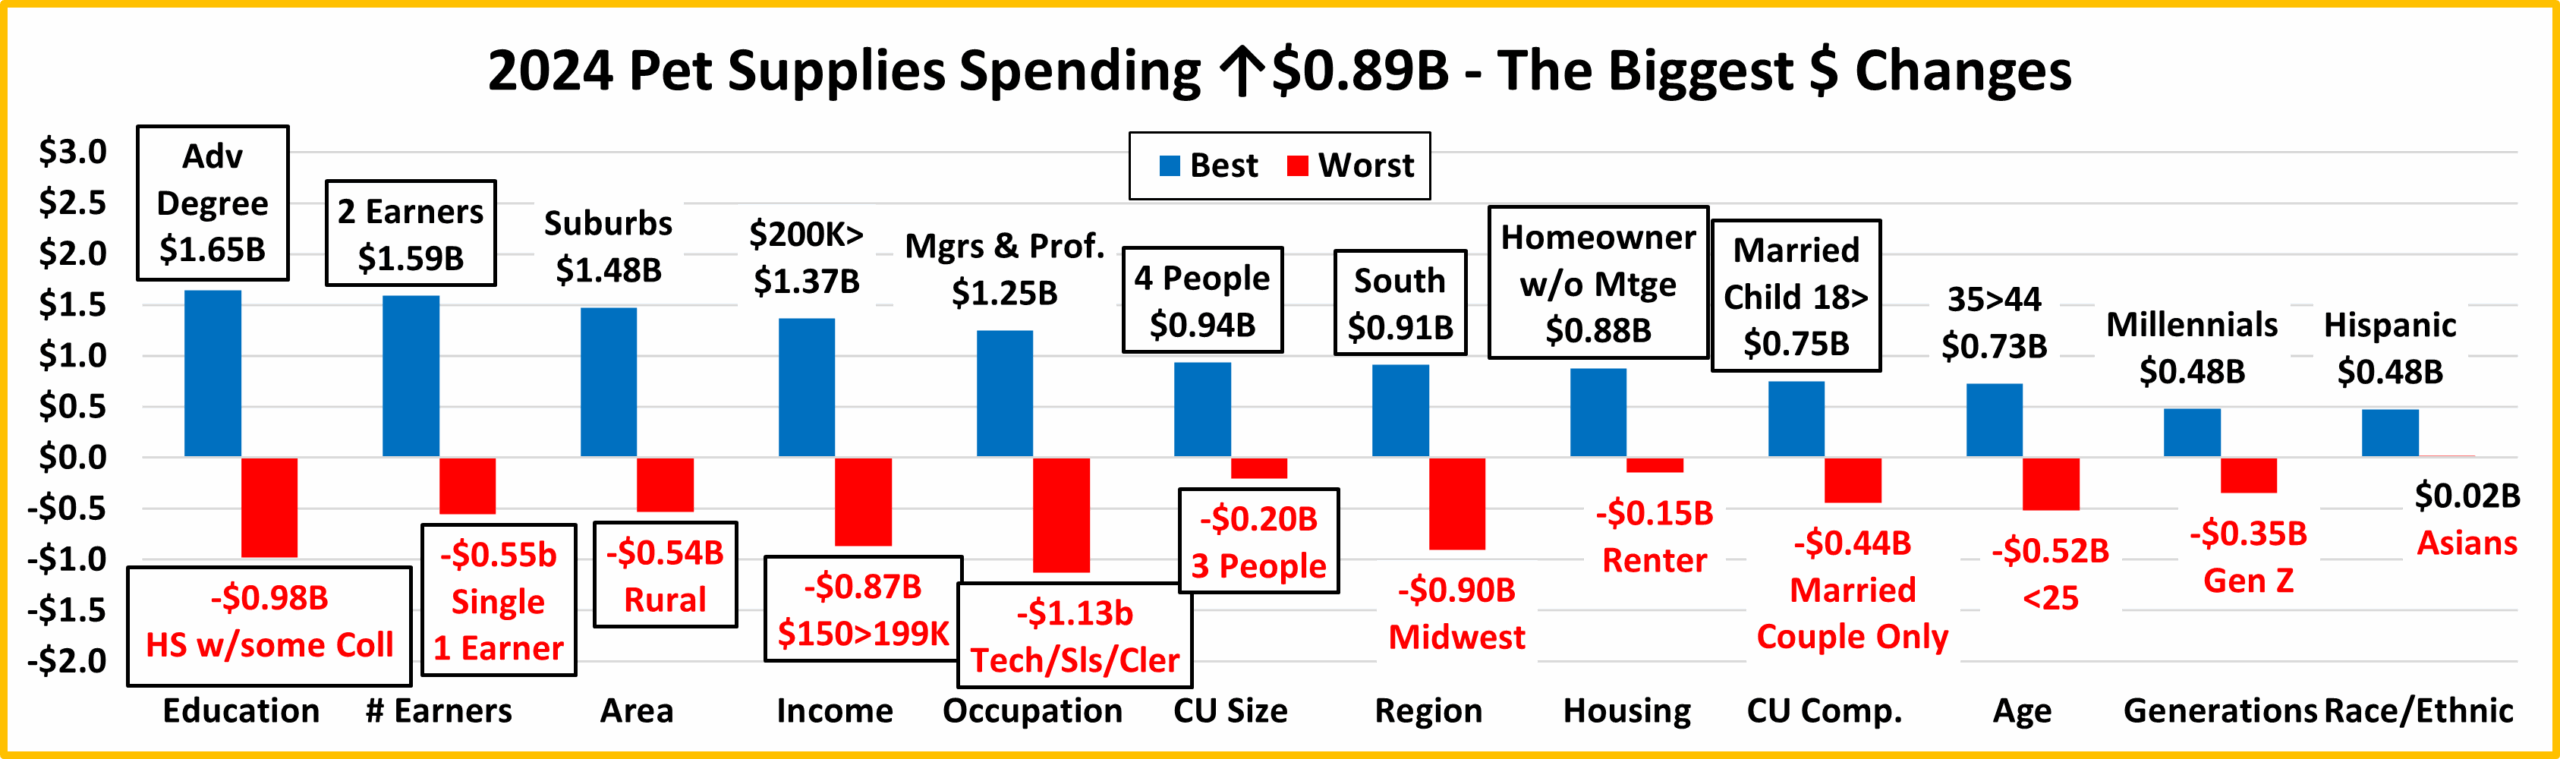
In this chart you immediately see the difference from last year. In 2024 you see a little less stability. There were 4 repeats. In 2023 there were 7. Also, 3 segments flipped from 1st to last or vice versa. In 2023 there were 2 flips. 2021 & 2022 had record increases, but the lift in 2023 was only $1.05B, and fell to +$0.23B, +1.7% in 2024. Plus, there were no categories where all segments spent more. compared to 2 in 2023. Also, 48% of 96 demographic segments spent more, down from 75% in 2023. Another thing is definitely worse. The biggest drop was -$0.90B. In 2023, it was only -$0.58B.
Here are the specifics:
- Occupation – Both winner and loser are new.
- Winner–– Mgrs & Professionals – Pet Services Spending: $6.79B; Up $1.04B (+18.1%) 2023: Retired
- Loser – Self-employed – Pet Services Spending: $1.00B; Down $0.36B (-26.3%) 2023: Tech/Sls/Clerical
- Comment – Retirees also spent a little more, +$0.03B. All others spent less.
- Region – The 2023 Winner & Loser both flipped.
- Winner – South – Pet Services Spending: $4.77B; Up $0.89B (+23.0%) 2023: Northeast
- Loser – Northeast – Pet Services Spending: $1.88B; Down $0.64B (-25.4%) 2023: South
- Comment – In 2021 & 2022, all spent more. In 2023 only the South spent less. In 2024, the West also spent less.
- Age – Both winner and loser are new. No surprises.
- Winner – 45>54 yrs – Pet Services Spending: $3.57B; Up $0.83B (+30.1%) 2023: 55>64 yrs
- Loser – 65>74 yrs – Pet Services Spending: $1.62B; Down $0.48B (-22.9%) 2023: 25>34 yrs
- Comment: In 2022 only the <25 group spent less. In 2023, 25>34 & 65>74 had drops. In 2024, only 25>34, 45>54 & 75> spent more. 45>54 took the lead but 35>64 is still pretty balanced between the 3 groups. They have the 3 highest incomes and account for 51.8% of CUs, but 66.7% of Pet Services spending.
- Income – $150>199K won, no surprise. However, $100>149K was an unexpected loser.
- Winner – $150>199K – Pet Services Spending: $2.55B; Up $0.82B (+47.2%) 2023: $200K>
- Loser – $100>149K – Pet Services Spending: $2.59B; Down $0.34B (-11.8%) 2023: $70 to $99K
- Comment – Only $70>99K & $150>199K spent more, but their lifts totaled +$1.32B, which more than made up for the -$1.09B drop by other segments. Note: In the big income groups, only $70K> & $100K> spent more.
- # in CU – Both the Winner & Loser are new and don’t usually lead in change.
- Winner – 4 People – Pet Services Spending: $2.69B; Up $0.69B (+34.3%) 2023: 5+ People
- Loser – 3 People – Pet Services Spending: $1.91B; Down $0.37B (-16.1%) 2023: 1 Person
- Comment: 2 People also spent +$0.26B more. The 2 & 4 People lifts pushed 2+ CUs up to +$0.46B.
- Education – Both the Winner & Loser are again new. These 2 are not surprising.
- Winner – Advanced Degree – Pet Services Spending: $5.95B; Up $0.67B (+12.6%) 2023: BA/BS Degree
- Loser – HS Grad w/some College – Services Spending: $1.15B; Down $0.55B (-32.2%) 2023: Assoc. Degree
- Comment – All College Grads plus those who are only HS Grads are the only segments that spent more. Amazingly, HS Grads only had a +30.2% lift. College Grads were +0.75B; <College were -$0.52B.
- # Earners– 2 Earners held their spot at the top while 1 Earner, Singles replaced No Earner, Singles at the bottom.
- Winner – 2 Earners – Pet Services Spending: $6.81B; Up $0.66B (+10.7%) 2023: 2 Earners
- Loser – 1 Earner, Single – Pet Services Spending: $1.64B; Down $0.24B (-12.9%) 2023: No Earner, Single
- Comment – Only 2 Earners, 1 Earner, 2+ CUs & No Earner, Singles spent more, but 2 of 3 were +$0.06B or less.
- Area Type – Rural stayed on the bottom while Center City replaced the Suburbs at the top.
- Winner – Center City – Pet Services Spending: $4.57B; Up $0.56B (+13.9%) 2023: Suburbs 2500>
- Loser – Rural – Pet Services Spending: $2.62B; Down $0.17B (-6.1%) 2023: Rural
- Comment – In 2023, all segments spent more. In 2024 only Center City had a lift.
- Generation – Gen X stayed on top and Boomers replaced Born <1946 at the bottom.
- Winner – Gen X – Services: $5.29B; Up $0.51B (+10.7%) 2023: Gen X
- Loser – Boomers – Services: $3.36B; Down $0.90B (-21.1%) 2023: Born <1946
- Comment – In 2022, all generations spent more. In 2023, only Born <1946 spent less. In 2024, only Boomers spent less. Millennials again finished in second place with a strong $0.47B, +13.0% increase.
- Housing – Homeowners w/Mtge stayed on top, while those w/o Mtge replaced Renters on the bottom.
- Winner – Homeowner w/Mtge – Services: $8.57B; Up $0.34B (+4.1%) 2023: Homeowner w/Mtge
- Loser – Homeowner w/o Mtge – Services: $3.00B; Down $0.10B (-3.2%) 2023: Renter
- Comment – Only Homeowners w/Mtges spent more. The drop by Renters was only -$0.01B, -0.4%.
- Race/Ethnic – White, Not Hispanic flipped to the bottom while African Americans replaced them on top.
- Winner – African Americans – Services: $0.88B; Up $0.27B (+43.8%) 2023: White, Not Hispanic
- Loser – White, Not Hispanic – Services: $11.02B; Down $0.27B (-2.4%) 2023: Hispanic
- Comment– Only Whites spent less. All minorities spent more, totaling +$0.51B, +23.9%.
- CU Composition – Both Winner & Loser are new and not surprising.
- Winner – Married, Child 18> – Services: $1.59B; Up $0.18B (+12.6%) 2023: Married, Couple Only
- Loser – Singles – Services: $2.26B; Down $0.23B (-9.2%) 2023: Unmarried, 2+ Adults
- Comment – Only Singles, Married Child <6 & Married, +Adults, No Kids spent less. The increases were all $0.18B or less and the decreases, other than Singles, were -$0.11B or less.
We’ve seen the winners and losers in terms of change in Services Spending $ for 12 Demographic Categories. The growth slowed in 23 after 2 record lifts but was still widespread. In 24, the lift slowed even more and was far less widespread. Here’s some data which shows the evolution from 2019 to 2024. Services were hit hard by the pandemic but recovered stronger than ever with 2 record lifts. In 2024 the situation has become similar to pre-pandemic 2019 but with $5.03B more spending, a 41.6% increase. The avg 19>24 annual lift was +7.2%.
Total $: 2019: $8.62B 2020: $6.89B 2021: $9.10B 2022: $12.36B 2023: $13.42B 2024: $13.65B
% Segmts ↑$: 2019: 49% 2020: 21% 2021: 90% 2022: 93% 2023: 75% 2024: 47%
Avg Big ↑$: 2019: $0.25B 2020: $0.05B 2021: $1.10B 2022: $1.43B 2023: $0.73B 2024: $0.62B
Avg Big ↓$: 2019: -$0.27B 2020: -$0.89B 2021: $0.07B 2022: $0.16B 2023: -$0.16B 2024: -$0.39B
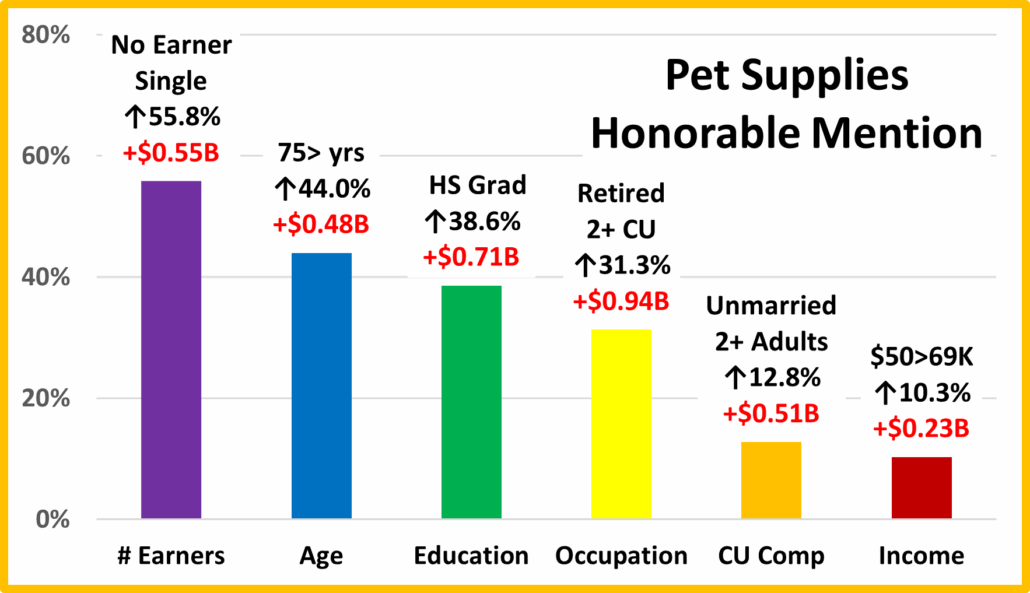
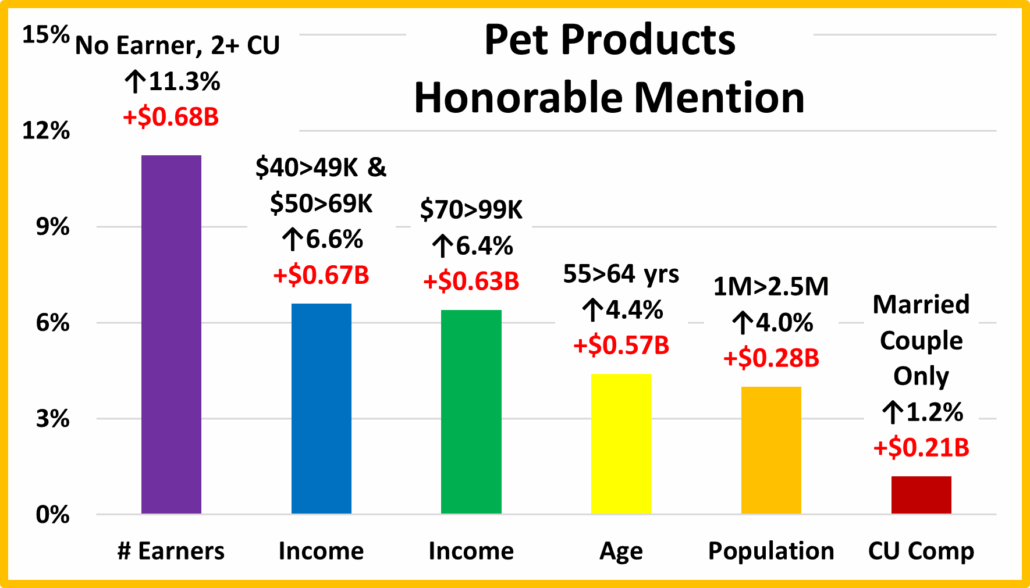
We found the winners in performance and $, but there were others who performed well but didn’t win. They deserve…
Honorable Mention
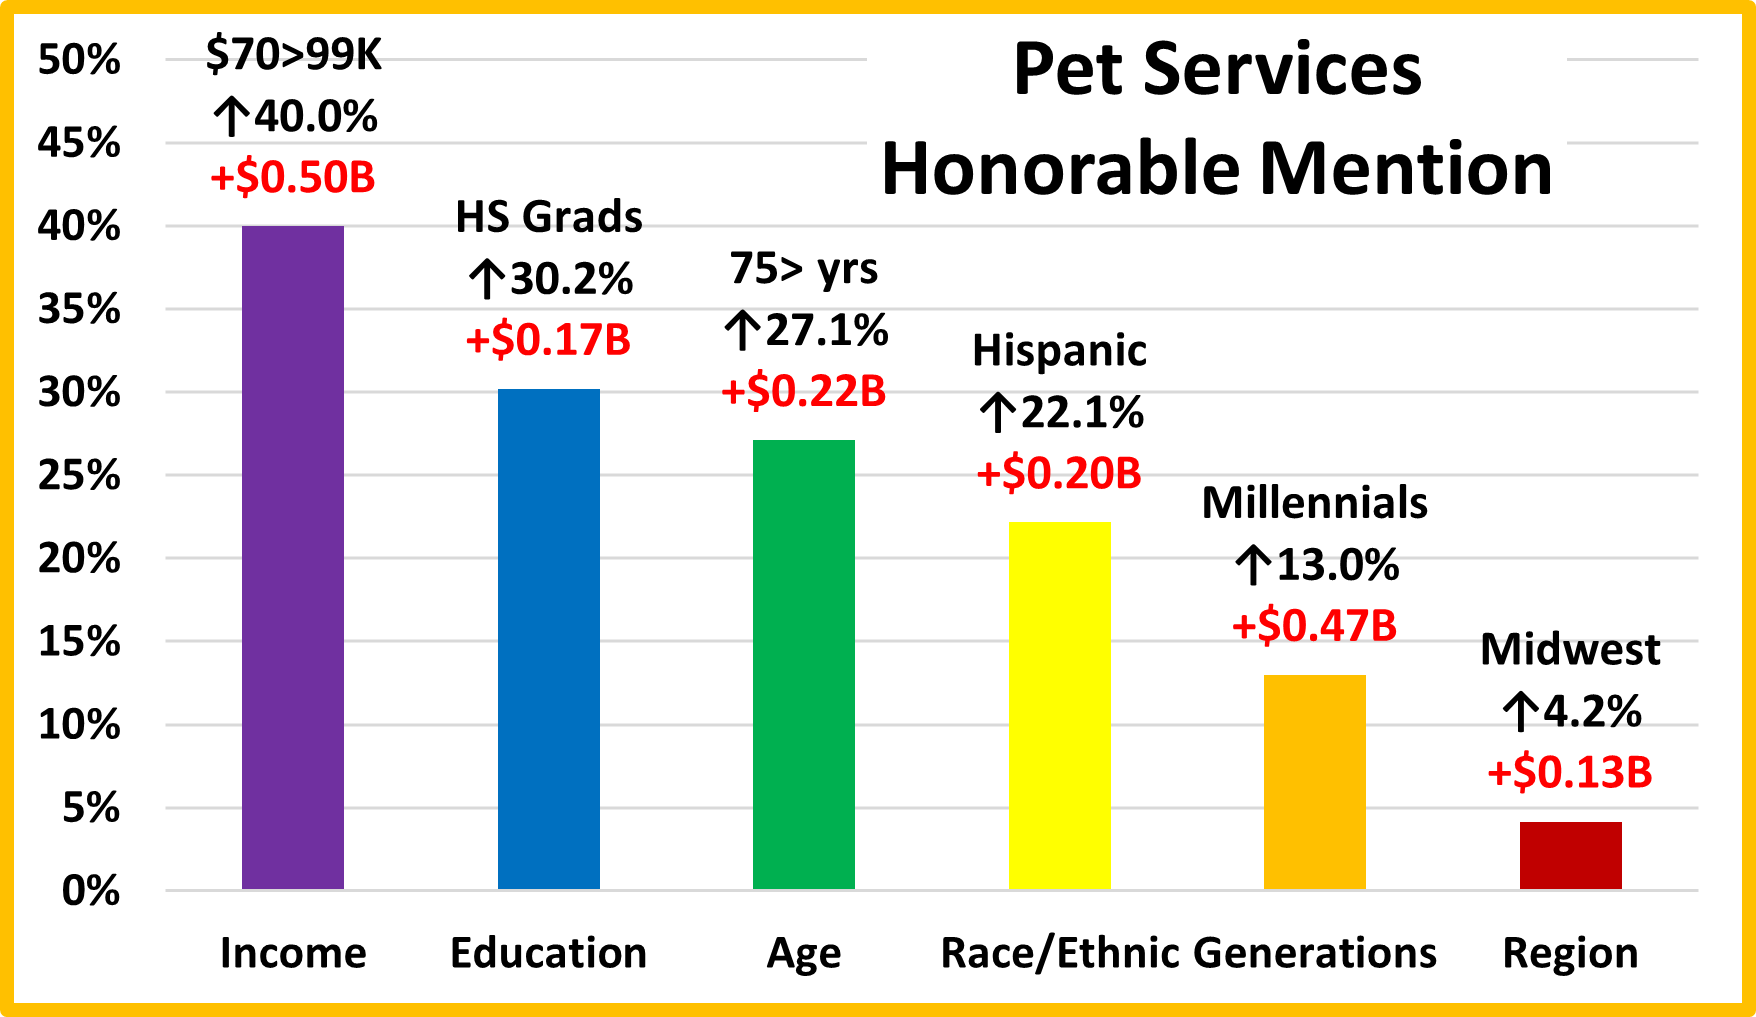
Services is the most driven by high income. The performance of the lower-income segments in this group gives evidence that Service usage is still widespread. $70>99K was up 40% while HS Grads increased their spending by 30.1%. The 75+, 27% lift shows that Pet Parenting is a lifetime commitment. Whites spent less, but all Minorities spent more. The 2 lowest income groups had the biggest lifts – African Americans, +$0.27B; Hispanics, +$0.20B. Millennials aren’t low income or low profile. They are just preparing for their time at the top in Pet Spending. The Midwest has a slightly below avg income, but their Pet Services spending performance is 109.6%. Service prices are high, but they are a great benefit, so many are finding the $.
Summary
For years, Services’ spending slowly but steadily increased. However, the number of outlets offering Services was radically increasing. In 2017, this competitive pressure caused Pet Parents to shop for value and spending fell 1%. In 2018, the abundance of outlets and competitive prices finally had their intended impact. Many more consumers took advantage of the convenience of Pet Services and spending literally took off with a record increase. In 2019 Consumers held their ground, but we saw turmoil similar to 2017. Again, value shopping likely contributed to the small decrease.
In 2020, pandemic Services outlets were often deemed nonessential, so they were subject to restrictions and closures. Services are definitely needed by some groups. However, for most demographics, Services are a convenience, and spending is very discretionary in nature. The reduced availability and the pandemic driven focus on the “needed” segments – Food and Veterinary caused a 20% drop in Services $.
In 2021 the Retail Marketplace opened up again and many Pet Parents strongly returned to their previous Services mantra, “I need help with my Pet “children” and I have the money to pay for it!”. This behavior was widespread as 90% of all demographics spent more on Services, producing a record increase. In 2022 Services showed that it was different from other segments. All had record lifts related to the Pandemic followed by drops, except for Services. 2022 spending didn’t decrease, it grew even stronger, +$3.26B and more widespread as 93% of demographics increased spending. In 2023, growth continued, but slowed considerably, +$1.05B. It slowed even more in 2024, +$0.23B, +1.7%. The lifts were also becoming less widespread as 75% of CUs spent more in 2023. This fell to 48% in 2024. There was another definite negative. Services is the segment where spending is the most driven by income, so it has always had a big disparity between segments. This worsened in 2023 & 2024. Performance differences are a key measurement of disparity. Let’s consider the performance of the big groups. In 2024, there were 8 categories with a 120+% performing big group, up 1 from 2023 and the most of any segment. Services has 1 more than Veterinary (7), 2 more than Supplies (6) and 3 more than Food (5). There is an even better measure of the worsening. In 2024, the average difference between best & worst performers was 119.5%. In 2023 it was 111.8% and only 100.3% in 2022. Another key trend in 2024 was that 35>64 is still the dominant group, but spending is now skewing towards the midrange 45>54 yr olds. They have the highest income, so this makes sense.
Services were hit the hardest by the pandemic, but they had a record, widespread recovery in 2021>22. They are the segment most driven by high income so the high inflation in 2022>24 had less of an impact. It did affect the spending of some financially challenged groups, but in 2024, Services spending seems to have returned to a pattern similar to 2019.
At Last – The “Ultimate” Pet Services Spending Consumer Unit consists of 4 people – a married couple with children 6>17. They are 45>54 yr-old Gen Xers and White, but not of Hispanic origin. They both work and at least one of them has an Advanced College Degree and is a Manager or Professional. They have an income of over $200K. They live in a suburb with a population over 2500 in the Western U.S. and are still paying off their home mortgage.