2024 Pet Supplies Spending was $23.91B – Where did it come from…?
Next, we’ll turn to Pets & Supplies. We’ll see differences from Pet Food as the Supplies spending is more discretionary. There are other factors too. Spending can be affected by other segments as consumers often trade $ between segments. However, the biggest factor is price. Many categories are now commoditized so price changes can impact buying. In the 2nd half of 2016, deflation began, and Supplies started a 24-month lift, totaling $5B. Prices turned up in mid-2018 due to new tariffs and Supplies $ fell a record -$3B in 2019. In the 2020 pandemic, Supplies weren’t a necessity, so sales fell, -$1.7B. In 2021, Pet Parents caught up with their children’s needs and Supplies spending exploded, +$8.65B. In 2022, the “binge” was not repeated, and inflation was 7.7%. Spending fell -$1.86B. In 2023, inflation fell to 2.6% and Supplies $ grew $1.08B, 4.9% to $23.02B. In 2024, inflation slowed to 0.9%, but Supplies $ only grew $0.89B, +3.9% to $23.91B.
Let’s see which groups were most responsible for the bulk of Pet Supplies spending in 2024 and the $0.89B lift. The first chart details the biggest pet supplies spenders for each of 10 demographic categories. It shows their share of CU’s, share of Supplies spending and their spending performance (Share of spending/share of CU’s). All groups are the same as Total Pet. The groups are presented in the order that reflects their share of Total Pet Spending. This highlights the differences in share. There is also a difference in performance. There are 6 groups with performance of 120% or more, the same as 2023, but 1 less than Total Pet and 1 more than Pet Food. The stability in the number of 120+% groups indicates that in 2024 there was no major change in spending balance for Supplies.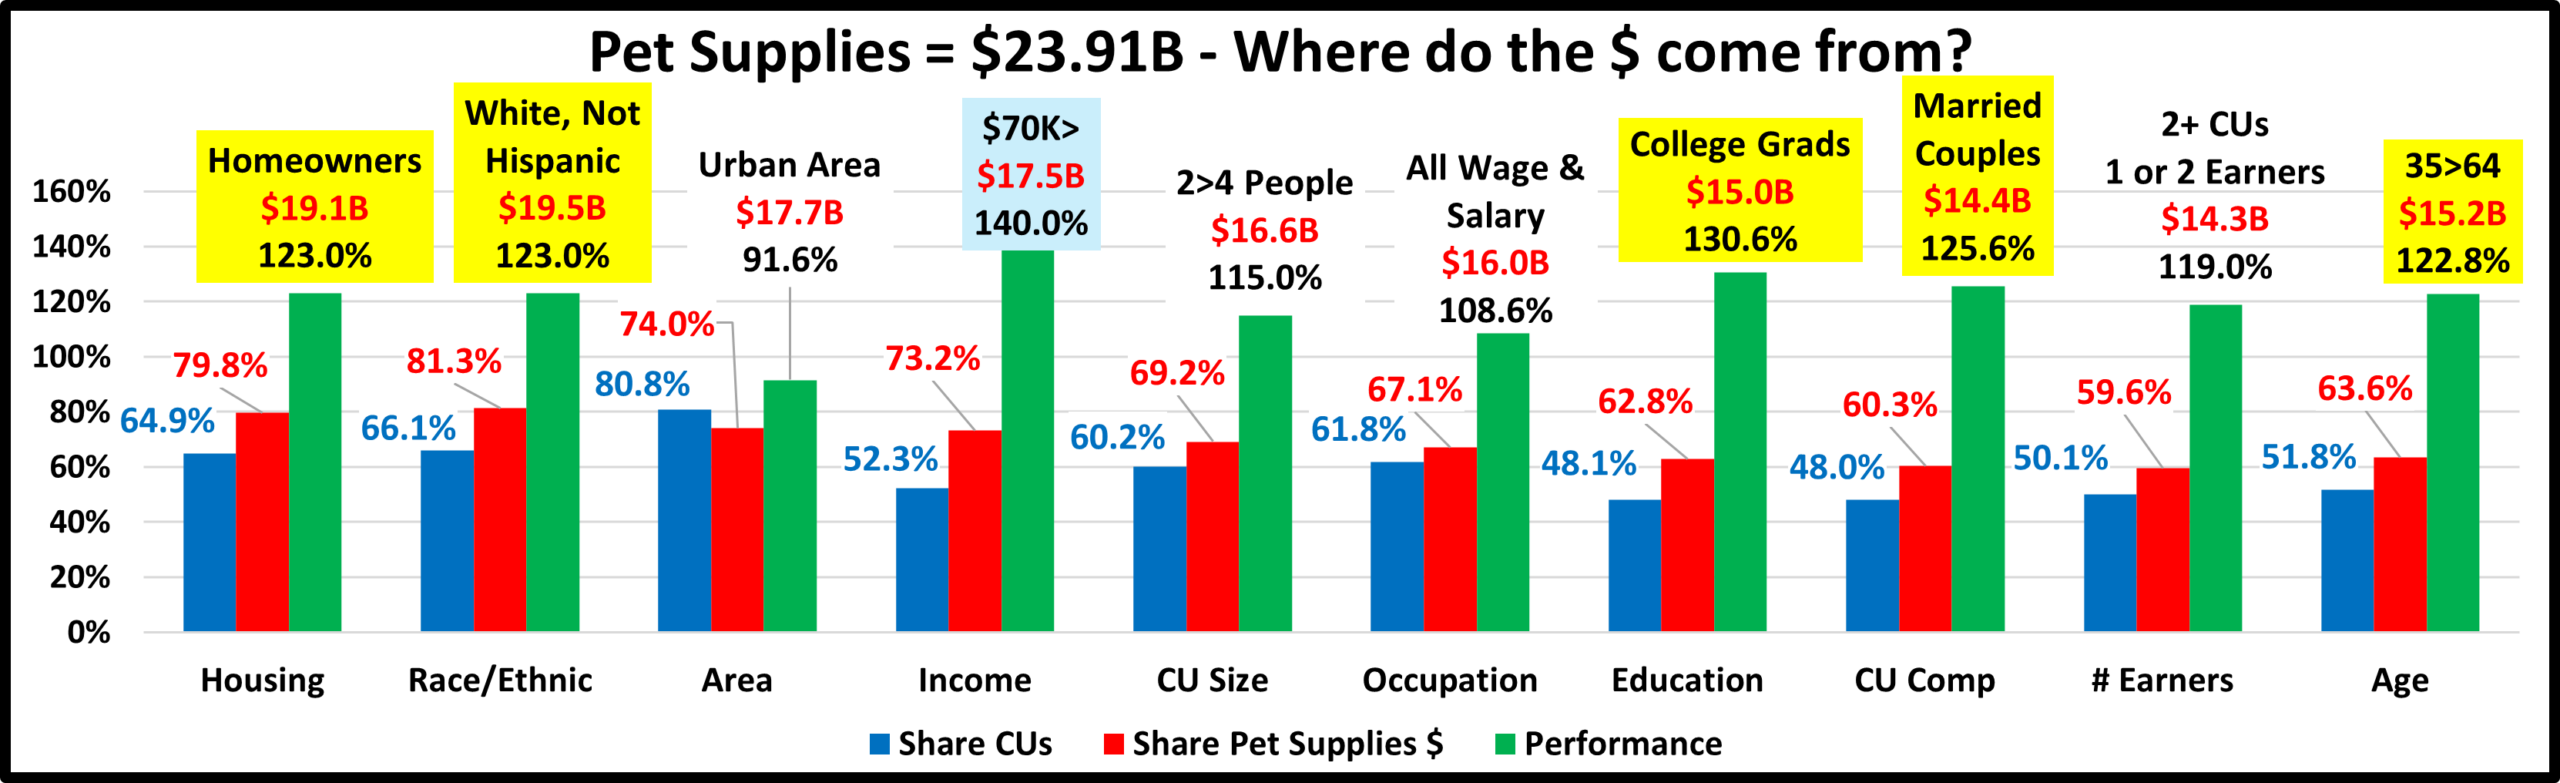
- Race/Ethnic – White, not Hispanic (81.3%) down from 83.6%. This large group accounts for the vast majority of spending in every segment. Their share decreased. Their performance fell from 125.9% to 123.0% and they dropped from #3 to a tie for #4 in importance in spending. Minority groups account for 33.9% of all CUs and their spending rose to 18.7% of Supplies $. All minorities spent more. Hispanics were the leader, +$48B, +22.3%.
- # in CU – 2>4 people (69.2%) up from 67.8% and their performance grew from 113.5% to 115.0%. 1, 3 & 5 People CUs spent less while 2 & 4 people CUs were +$1.15B. This caused the lifts in share & performance.
- Housing – Homeowners (79.8%) up from 78.4%. Homeownership is a big factor in pet ownership and spending in all segments. Their performance rose to 123.0%, from 120.4% and they moved up to a tie for #4 in importance. Led by w/o Mtge, Homeowners spent more while Renters were -3.0%. This caused the share/performance increases.
- Age – 35>64 (63.6%) up from 61.9%. Their performance level rose to 122.8% from 118.8%. They joined the 120+% club and moved up from #7 to #6 in importance. The <35 group spent less. <25 had the biggest drop, -$0.52B, -49.5%. The top spending 45>54 yr olds were also -$0.12B. All others spent more. The biggest $ lift was +$0.73B by 35>44. The biggest % increase was +44.0% by 75+ yr olds. Age became noticeably more important.
- Area – All Urban (74.0%) up from 70.3% and their performance grew to 91.6%, from 87.2%, but Area stayed last in importance. In this category, only the big Suburbs had an increase, +$1.48B, +14.9%. Rural had the biggest drop, -$0.54B. Center City also spent less, but it was only -$0.05B and they passed Rural in spending share. This is why the group changed. Center City has great potential, which will be realized as housing becomes more “pet friendly”.
- Income Over $70K (73.2%) up from 72.1%. A gain in share, but their Performance fell from 142.7% to 140.0%. Income remains the most important factor in increased Pet Supplies Spending. $70K> spent +$0.92B more, while <$70K was -$0.03B. Only <$50K (-$0.26B) and $150>199K (-$0.87B) spent less. All others spent more. The biggest increase was +$1.37B by the $200K> group. A key factor in the increase in share but drop in performance was that $70K> gained 3.1 million CUs. This gain in CU share lowered performance.
- # Earners – 2+ CUs, 1 or 2 Earners (59.6%) up from 56.8%. Their performance grew from 112.8% to 119.0%, but Earners fell from #4 to #7 in importance and and are out of the 120% club. The # Earners is less important. It is income that truly matters. 1 Earner CUs of any size spent less on Supplies. 3+ Earner CUs also spent less. The only increases came from No Earner & 2 Earner CUs. 2 Earners had the biggest lift, +$1.59B, +17.3%.
- Occupation – All Wage & Salary Earners (67.1%) down from 69.3%. Their performance was 108.6%, down from 113.8%. Only Tech/Sls/Cler (-$1.13), Service Workers & A/O Unemployed spent less. Most other groups had small lifts. The 2 biggest increases were Mgrs/Professionals, +$1.25B and Retired, +$0.94B.
- CU Composition – Married Couples (60.3%) down from 61.3%. Their performance also decreased from 127.2% to 125.6% and they fell from 2nd to 3rd in importance. Only Married, Couple Only, Married, + adults & Singles had decreases. The biggest lift was +$0.75B from Married, Child 18>. The Married group was +$0.33B, +2.3%, while Unmarried was +$0.57B, +6.4%. This caused the decreases in share and performance for all Married CUs.
- Education – College Grads (62.8%) up from 56.1%. This group was reduced because of spending changes. In 2024, they gained market share and their performance level increased from 117.4% to 130.6%. Higher Education rose from 6th to 2nd in importance. In the Education category, the only spending decreases were by <HS Grads, HS Grads w/some College & Associates’ Degrees. There were big lifts by Adv. Degrees, +$1.65B & HS Grads, +$0.71B. The summary is <College were -$1.19B, -11.8% & College Grads were +$2.09B, +16.2%. This caused the changes.
Pet Supplies spending still skews more towards younger and higher income CUs than Food. However, the biggest difference may be in the spending disparity in segments within the big groups. Supplies has 6 big groups with perfomance of at least 120%. Food is up to 5, but 4 are different from Supplies and Total Pet.
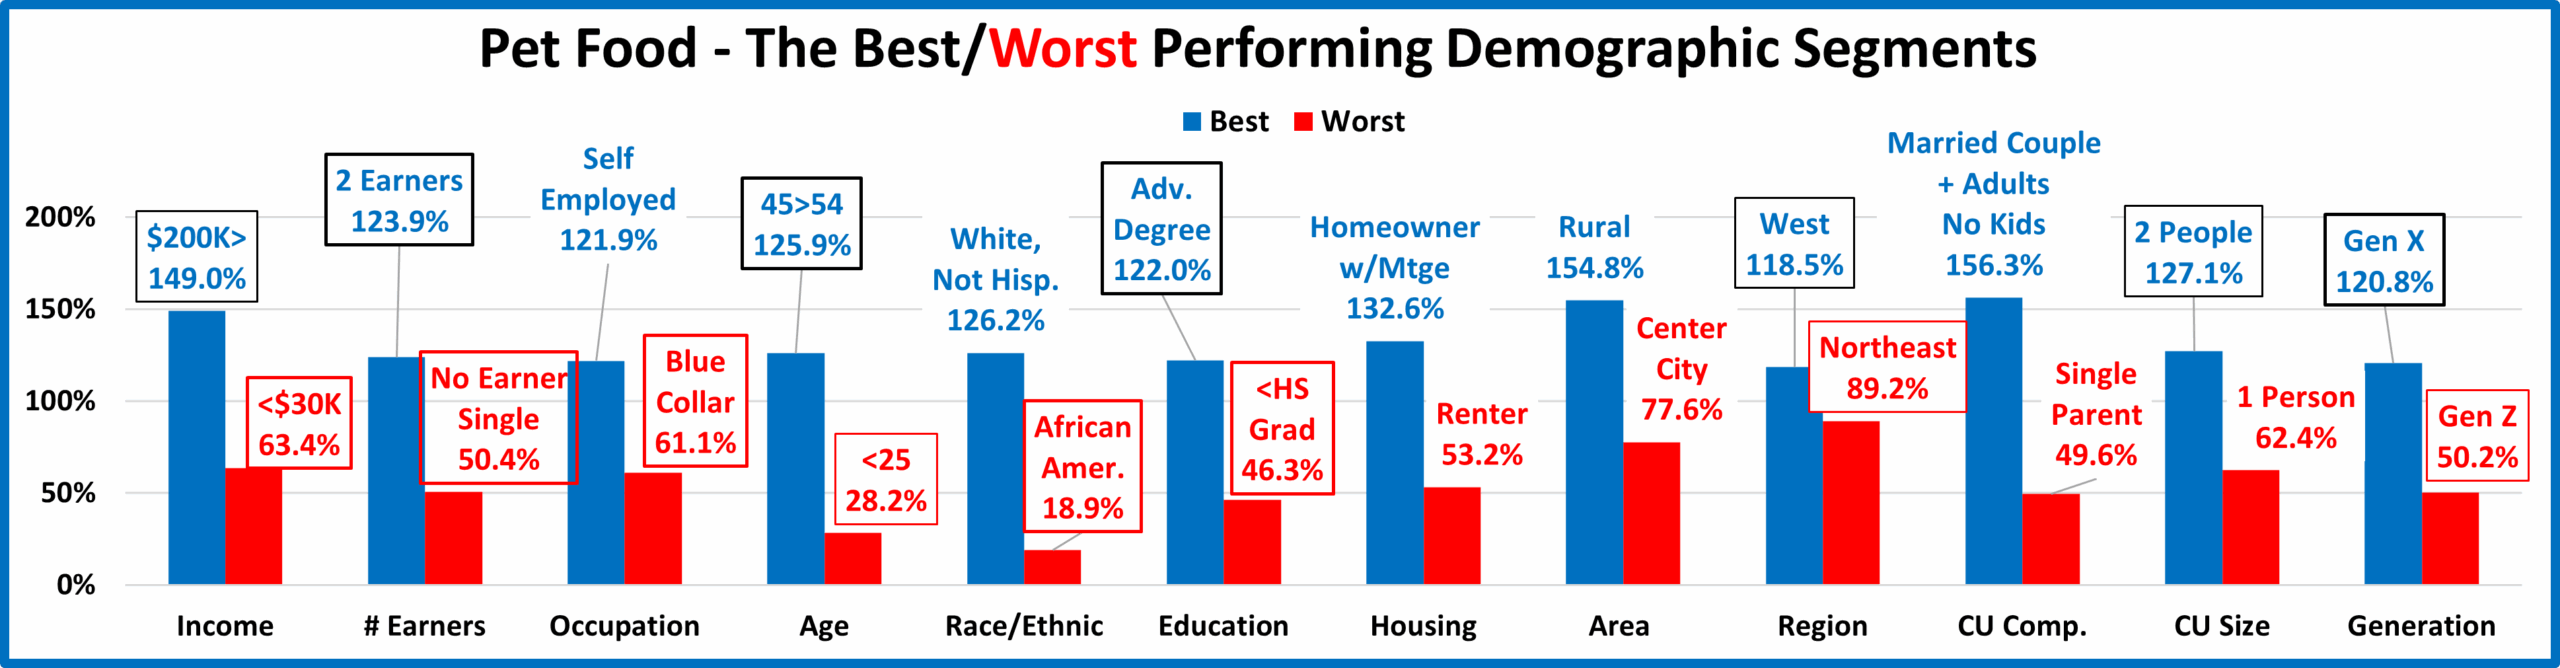
Now, we’ll look at 2024’s best and worst performing Pet Supplies spending segments in each category.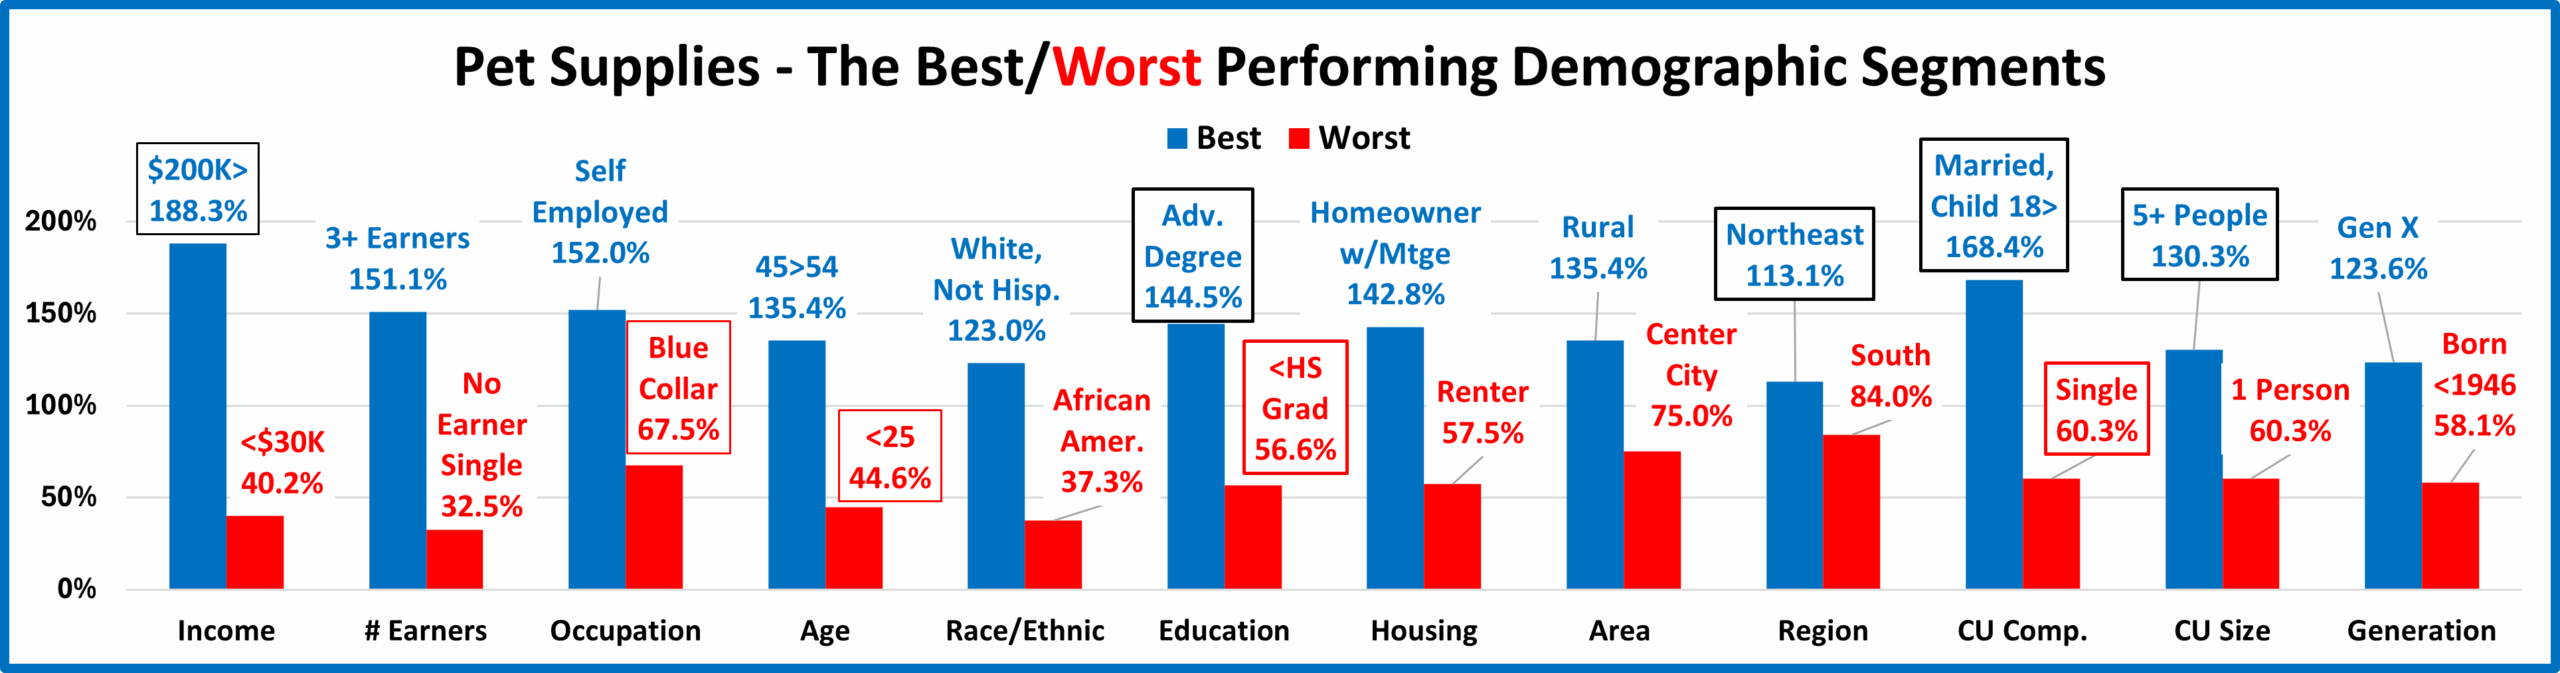
Almost all of the best and worst performers are those that we would expect. The only small surprise is 5+ CUs. In Pet Supplies spending, there are 9 that are different from 2023, up from 8 last year. That is 3 more than Veterinary & Total Pet, 6 more than Services, but 6 less than Food. They have 5 new winners. With 7, only Food has more. In terms of disparity, the difference between the avg winner & loser was 86.2%, down from 95.4% in 2023 and much less than 123.6% in 2021. A little more balanced at the segment level. Changes from 2023 are “boxed”. We should note:
- Income matters in Supplies spending – 188.3% performance and a disparity of 148.1%.
- Occupation – Blue Collar replaced Retired. Only White-Collar Workers – at any level, perform at 100+%.
- Age – The youngsters, <25 replaced the oldsters, 75+ on the bottom.
- Education – Adv College Degree & <HS Grads. Both are new, but they occupied these spots in 2022.
- Region – The Northeast replaced the Midwest at the top, but the South was in their usual spot at the bottom. The South is the only Region with under 100% performance, but the disparity narrowed to 29% from 60% in 2023.
- CU Composition – Married, Oldest Child 18> replaced Child 6>17 on top while Singles replaced Single Parents at the bottom. In 2024, all Married CUs, except those with an oldest child <6 or only extra adults, performed over 100%.
- CU Size – 5+ People returned to the top, replacing 3 People. 1 Person CUs are the only size performing <100%.
Performance Overview – The decrease in the avg disparity was <10%, 86.2% from 95.4%, it was also less widespread than the lift in 2023. In 2023, 10 were up in disparity. In 2024, 8 of 12 were down in disparity. Occupation, CU Comp, Housing and Education had a bigger disparity.
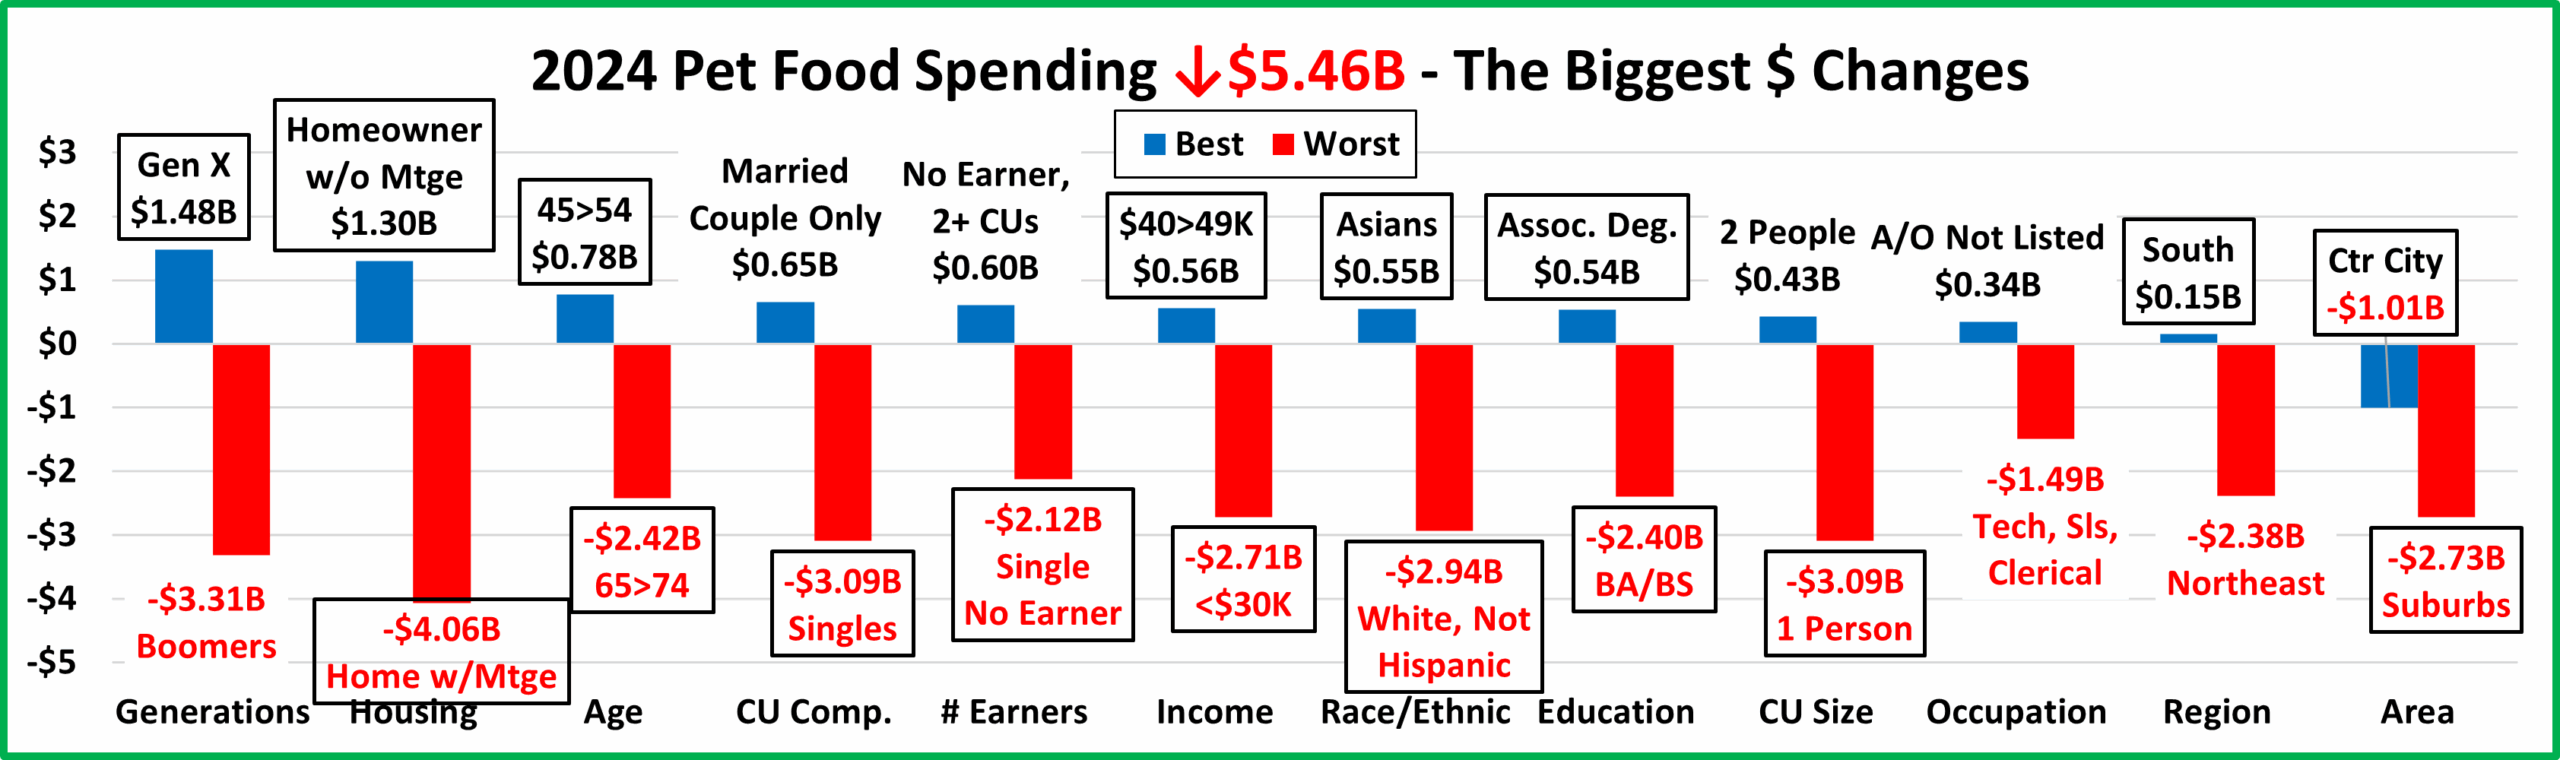
Now, it’s time to “Show you the money”. Here are segments with the biggest $ changes in Pet Supplies Spending.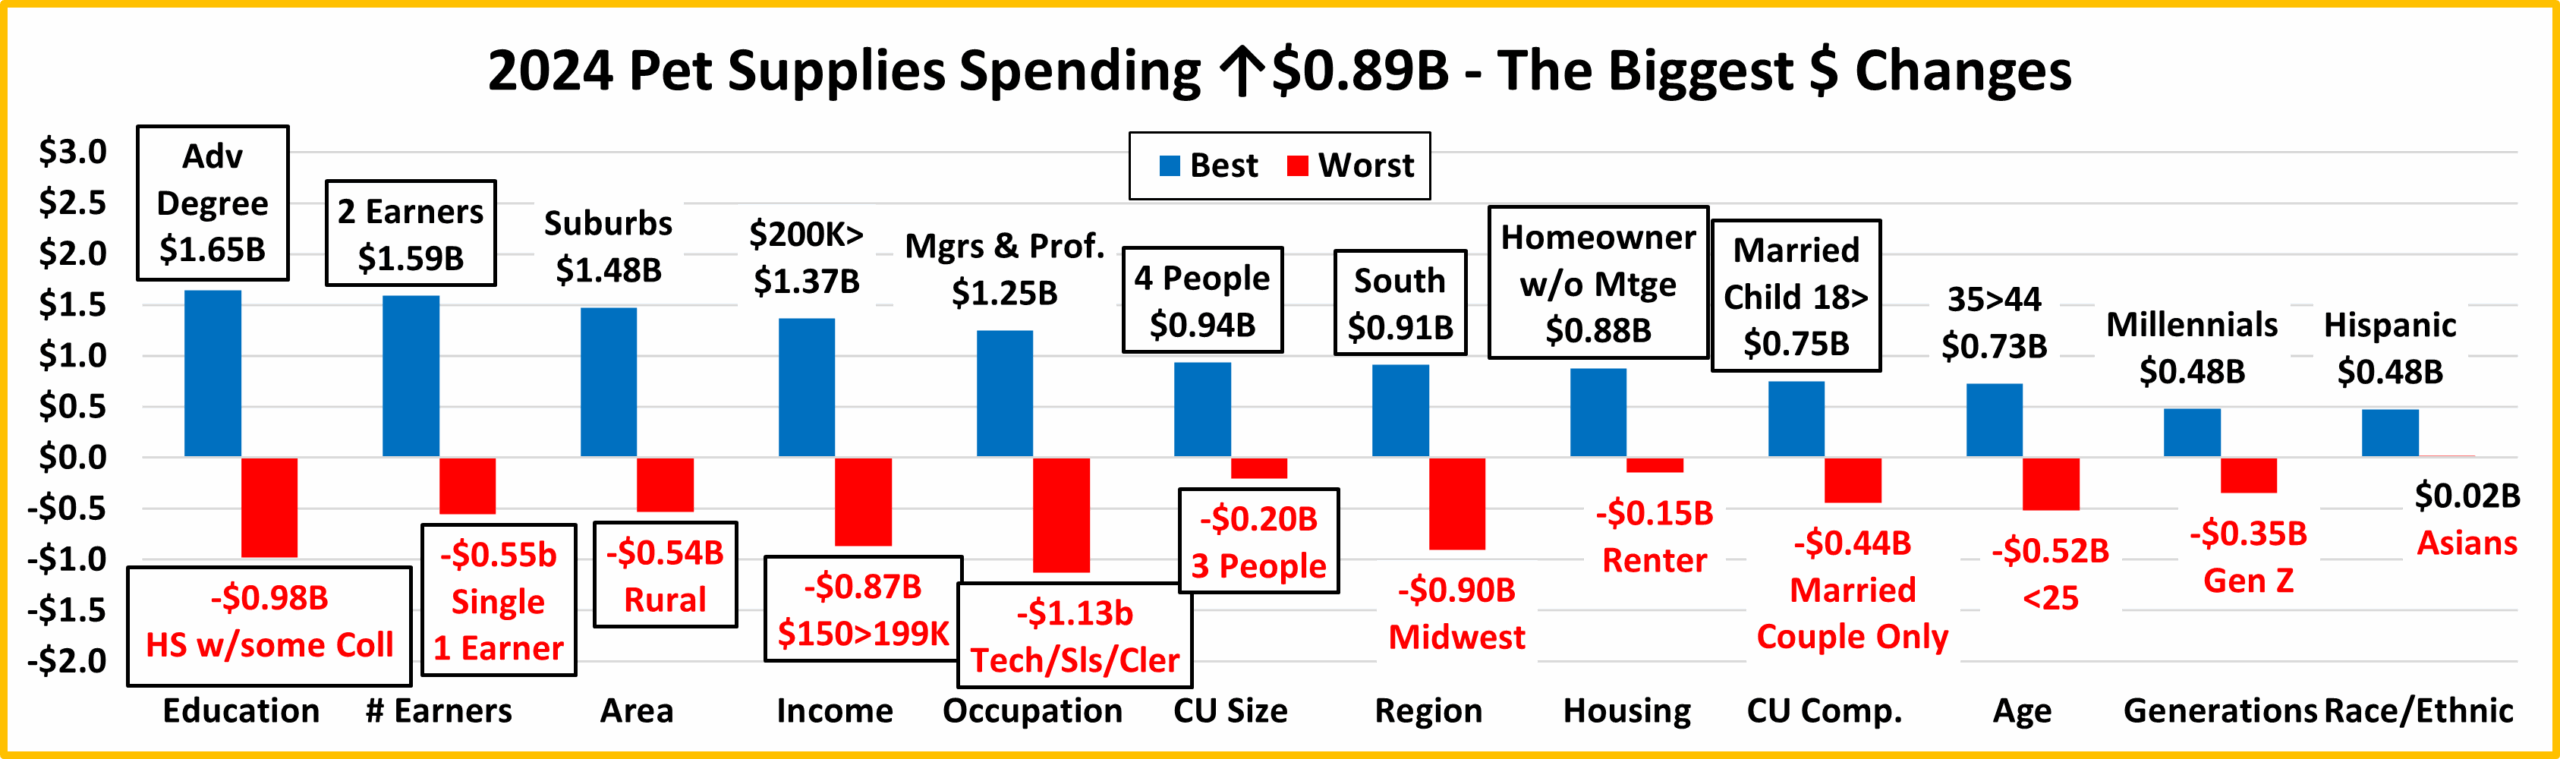
In 2019, Tarifflation caused a record $2.98B drop in Supplies spending. 2020 brought the pandemic and pet parents focused on “needs” so the more discretionary Supplies segment fell $1.65B. In 2021 Pet Parents caught up on the Supplies needs and spent a record $8.65B more. In 2022, the binge wasn’t repeated so the $ fell -$1.86B. In 2023 there was a $1.08B lift. In 2024, it was only $0.89B. In the chart, there are No repeats from 2023, and 12 segments flipped from last to 1st or vice versa – lots of turmoil. In 2023 there were 5 repeats and 9 flips. In 2024, 60.4% of segments spent more and Race/Ethnic was all positive. In 2023, 65.6% spent more and Housing was all positive. Here are the specifics:
- Education – Both winner & loser flipped.
- Winner – Adv. College Degree – Supplies: $7.24B; Up +$1.65B (+29.4%) 2023: HS Grad w/some College
- Loser – HS Grad w/some College – Supplies Spending: $3.07B; Down $0.98B (-24.1%) 2023: Adv College Degree
- Comment – HS Grads (+$0.71B) and BA/BS (+$0.44B) also spent more. All others spent less. College Grads were +$2.09B. All without a College degree were -$1.19B. Higher Education mattered.
- # Earners – Again, the winner & loser flipped, producing a more expected result.
- Winner – 2 Earners – Pet Supplies Spending: $10.81B; Up +$1.59B (+17.3%) 2023: 1 Earner, Single
- Loser – 1 Earner, Single – Pet Supplies Spending: $2.81B; Down -$0.55B (-16.5%) 2023: 2 Earners
- Comment – Income is the biggest factor, but the # of Earners is still important in Supplies Spending. The ups & downs were mixed with a complex pattern. 1 Earner CUs of any size and 3+ Earners spent less. All No Earner CUs of any size and 2 Earners spent more. Except for the winner & loser, the changes were small.
- Area Type– Rural flipped from 1st to last and Suburbs 2500> replaced them on top.
- Winner – Suburbs 2500> – Pet Supplies Spending: $11.40B; Up +$1.48B (+14.9%) 2023: Rural
- Loser – Rural – Pet Supplies Spending: $6.22B; Down -$0.54B (-7.9%) 2023: Center City
- Comment – Center City had a miniscule, -$0.05B (-0.7%) drop. This was a key factor in Urban replacing Suburban/Rural as the big group in the Area Type Category.
- Income – $150>199K flipped to the bottom and $200K> replaced them on top.
- Winner – $200K> – Pet Supplies Spending: $5.49B; Up +$1.37B (+33.2%) 2023: $150>199k
- Loser – $150>199K – Pet Supplies Spending: $3.38B; Down -$0.87B (-20.4%) 2023: $40>49K
- Comment – Only segments <$50K & $150>199K spent less. The big group, <$70K was also down -$0.03B. All other segments & big groups were up. Again, almost all changes were small.
- Occupation – Tech/Sls/Clerical flipped from 1st to last, and Mgrs/Professionals replaced them at the top.
- Winner – Mgrs/Prof. – Supplies Spending: $9.39B; Up +$1.25B (+15.4%) 2023: Tech/Sls/Cler.
- Loser – Tech/Sls/Cler. – Supplies Spending: $3.24B; Down -$1.13B (-25.8%) 2023: Blue Collar
- Comment – Service Workers & A/O, Unemployed also spent less. Everyone else spent more. Except for +$0.94B by Retirees, the changes were small.
- # in CU – The Winner & Loser flipped again.
- Winner – 4 People – Pet Supplies Spending: $3.80B; Up $0.94B (+32.7%) 2023: 3 People
- Loser – 3 People – Pet Supplies Spending: $4.29B; Down -$0.20B (-4.5%) 2023: 4 People
- Comment: In 2024, 2 & 4 People CUs spent more, while 1, 3 & 5+ CUs spent less. This is the exact opposite of the situation in 2023.
- Region – The South flipped again, this time from last to 1st. The Midwest replaced them on the bottom.
- Winner – South – Pet Supplies Spending: $7.91B; Up $0.91B (+13.0%) 2023: Northeast
- Loser – Midwest – Pet Supplies Spending: $5.49B; Down -$0.90B (-14.1%) 2023: South
- Comment – In 22 & 23, 2 spent more & 2 spent less. In 2024, 3 spent more, all but the Midwest. The Northeast had a smaller $ increase than the South, +$0.64B, but their % lift was bigger, +15.6%.
- Housing – Homeowners w/o Mtge flipped to the top, while Renters replaced them on the bottom.
- Winner – Homeowner w/o Mtge – Supplies: $6.48B; Up +$0.88B (+15.7%) 2023: Homeowner w/Mtge
- Loser – Renter – Supplies: $4.83B; Down -$0.15B (-3.0%) 2023: Homeowner w/o Mtge
- Comment – In 2023 all Housing segments spent more. In 2024, only Renters spent less. Except for Homeowners w/o Mtge, the changes were small, 3% or less.
- CU Composition – Married, Oldest Child 18> flipped from last to 1st. Married, Couple Only replaced them as last.
- Winner – Married, Oldest Child 18> – Supplies: $3.19B; Up $0.75B (+30.8%) 2023: Singles
- Loser – Married, Couple Only – Supplies: $5.50B; Down $0.44B (-7.4%) 2023: Married, Oldest Child 18>
- Comment – All CUs with children, including Single Parents spent more, +$1.16B. CUs with no children spent
- -$0.27B less. We should note that unmarried, 2+ all adult CUs did spend +$0.51B more.
- Age – Both the Winner and Loser are new.
- Winner – 35>44 yrs – Pet Supplies Spending: $5.20B; Up $0.73B (+16.3%) 2023: 45>54 yrs
- Loser – <25 yrs – Pet Supplies Spending: $0.53B; Down -$0.52B (-49.5%) 2023: 55>64 yrs
- Comment: 2023 Supplies spending was an age rollercoaster. 2024 had ups and downs but it was simpler. <35: -$0.84B; 35>44: +$0.73B; 45>54: -$0.12B; 55>: +$1.12B.
- Generation – Both are new. The Winner & Loser got younger.
- Winner – Millennials – Supplies: $7.14B; Up $0.48B (+7.2%) 2023: Gen X
- Loser – Gen Z – Supplies: $1.18B; Down -$0.35B (-22.7%) 2023: Boomers
- Comment – Only Gen Z spent less. The performance by the oldest generations, those born <1946, should be noted. They had the 2nd biggest $ lift, +$0.40B, but it was +64.1% – a huge, significant increase.
- Race/Ethnic – All segments are positive. Both the winner & loser are new and minorities.
- Winner – Hispanic – Supplies: $2.62B; Up +$0.48B (+22.3%) 2023: White, Not Hispanic
- Loser – Asian – Supplies: $0.69B; Up +$0.2B (+2.6%) 2023: African Americans
- Comment – Whites’ share of Pet Supplies $ fell to 81.3% from the 83.3% in 2023. However, they still drive this discretionary segment. They have the highest % of pet ownership and the second highest income. The interaction of these two factors is very apparent in this category. All groups spent more and the lift by minorities was +$0.68B, 76% of the 23>24 Supplies increase. Spending became a little more racially/ethnically balanced.
We’ve now seen the winners and losers in Pet Supplies Spending $ for 12 Demographic Categories. In 2022, despite the -$1.86B decrease, 52% of demographic segments spent more but there was no all-positive category. In 2023, there was a small lift, $1.08B, 65.6% of demographics spent more and Area Type was all positive. In 2024, there was much more turmoil than 2023, and the spending lift was even smaller, +$0.89B. 60.4% of demographics spent more, 9% less than 2023. However, again one demographic category was all positive – Race/Ethnic. In performance, there were no big surprises and the disparity between winner and loser decreased by 9%. The performance winners reflected the importance of income in Supplies spending. However, not every good performer can be “the” winner and some of these “hidden” segments should be recognized for their performance. They don’t win an award, but they deserve…
HONORABLE MENTION
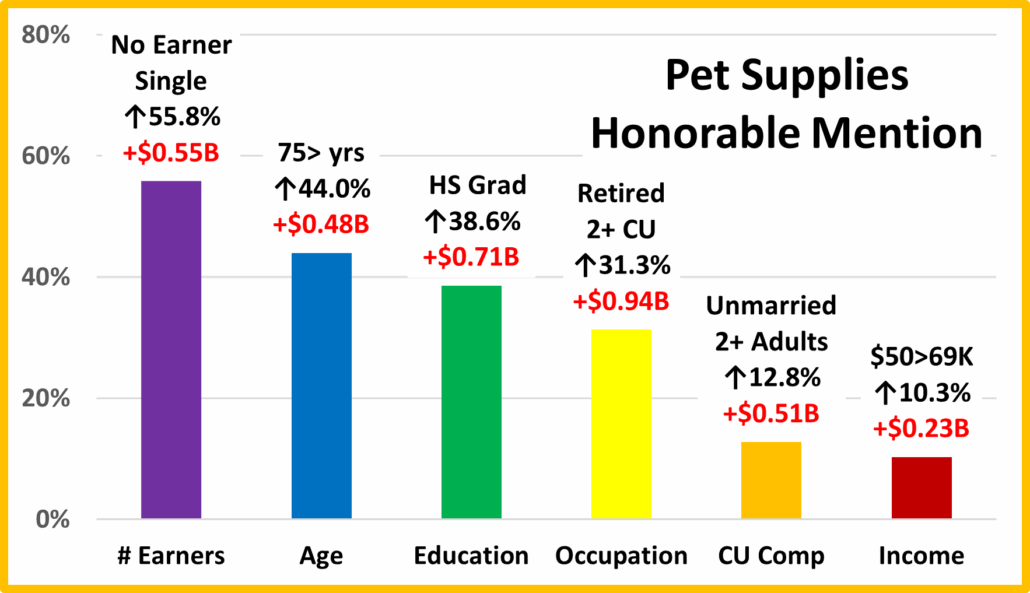
Supplies spending is driven by income, but Pet Parenting is widespread. This is very apparent in the strong performance of these segments. All have below average incomes, with many at or near the bottom in their category. No Earner, Singles earn <$30K but found the $ for a 55% lift in Supplies. Pet Parenting is a lifetime commitment. Retired & 75> yr olds clearly show this. HS Grads were the only segment without a college degree to spend more on Supplies. Education matters, with some exceptions. Marriage & children are also big factors in Supplies spending, but not a necessity. Pet Parenting is widespread and Supplies improve the experience. All Adult, 2+ CUs spent $0.51B more. The $50>69K group had a double-digit lift in Supplies $. This clearly demonstrates that while income may be the most important, it is not the only factor in Supplies spending. Although the lift was small, it was demographically relatively widespread.
Summary
While Pet Food spending has shown a definite pattern, Pet Supplies have been on a roller coaster ride since 2009. Many Supplies categories have become commoditized and react strongly to changes in the CPI. Prices go up and spending goes down…and vice versa. Supplies spending has also been reactive to big spending changes in Food. Consumers spend more to upgrade their Food, so they spend less on Supplies – trading dollars. We saw this in 2015. In 2016 the situation reversed. Consumers value shopped for Food and spent some of the “saved” money on Supplies.
That brought us to 2017. Both Supplies and Food prices deflated while the inflation rate in both of the Services segments dropped to lows not seen in recent years. Value was the “word” and it was available across the market. Perhaps the biggest impact was that the upgrade to super premium Food significantly penetrated the market. This could have negatively impacted Supplies Spending, but it didn’t. Supplies’ spending increased in 93% of all demographic segments.
2018 started out as expected with a $1B increase in Supplies and a small lift in Food. Then the government got involved. In July the FDA issued a warning on grain free dog food and spending dropped over $2B. New tariffs were implemented on Supplies and spending flattened out then turned down -$0.01B in the 2nd half. The full retail impact of Tariffs hit home in 2019 when Supplies spending fell -$2.98B, affecting 97% of all demographic segments.
In 2020 The pandemic caused consumers to focus on needs. That resulted in big spending lifts for Food and Veterinary and big drops in Supplies and Services. Some good news was that Supplies spending became more balanced. The performance gap between best and worst narrowed by 10.25%.
In 2021 the overall Retail Market had recovered but with no repeat of the buying binge, Pet Food $ dropped. In Supplies, the pent-up buying desires of Pet Parents were unleashed. They bought all the Supplies items that had been on “hold” for the last 2 years. The result was the biggest spending increase in history. In 2022, the Supplies binge was also not repeated, and inflation took off, so spending fell -$1.86B. However, 52% segments still spent more on Supplies.
In 2023, inflation slowed and Supplies had a small $1.08B, 4.9% lift. 65.6% of segments spent more and the Housing category was all positive. The disparity between best & worst performers grew to 95.4% from 87.5%. In 2024, the lift was smaller, +$0.89B, +3.9% and the number of demographics spending more decreased to 60.4%. However, 1 category was again all positive, Race/Ethnic and the performance disparity narrowed to 86.2% – a little more balance. The slow recovery from the big 2022 drop continues. In 2025, inflation was only 0.6%. We’ll see what happens.
Finally – The “Ultimate” Pet Supplies Spending CU consists of 5 people – a married couple, with 3 children, one 18>. They are 45>54 yr old Gen Xers. They are White, but not of Hispanic origin. They have their own business where they both work and at least one has an Advanced College Degree. Their child also works – part time and their household income is $200K>. They live in a rural area in the Northeast and are still paying off the mortgage on their home.