Retail Channel Monthly $ Update – February Final & March Advance

The current health crisis, with its stay at home restrictions, has resulted in many business closures and generally disrupted the U.S. Retail Marketplace. As consumer spending behavior evolves, we will regularly track the changes and migration between channels. We will do this with data provided by the U.S. Census Bureau.

The Census Bureau constantly gathers sales data from retailers across the U.S. and publishes the results every month. Two reports are released approximately mid-month. They are the Advance Retail Sales report and the Monthly Retail Sales report. The Retail Sales Report is more detailed and includes data from all respondents, but it is published about 6 weeks after month end. The Advance Report is released at the same time and gives a quick look at the most recent month. The sample size for the advance report is smaller so it doesn’t drill as deep into the channels, but the results have proven to be statistically accurate with the final monthly reports.

We will publish monthly updates covering both reports. They will include:

  • Total Retail, Restaurants, Auto, Gas Stations and Relevant Retail (removing Restaurants, Auto and Gas)
  • Individual Channel Data – This will be more detailed in the “Final” reports and we fill focus on Pet Relevant Channels

The information will be presented in detailed charts to facilitate visual comparison between groups/channels of:

  • Current Month change – % & $ vs previous month
  • Current Month change – % & $ vs same month in 2019
  • Current YTD change – % & $ vs 2019
  • Monthly and Year To Date $ will also be shown for each group/channel

Let’s get started with February. This data is from the Final Report and will show us the status of the retail market before the crisis. First, we will take a look at some major retail groups. (Note: All Data is Actual, Not Seasonally Adjusted)

February traditionally has the lowest retail spending of any month. We are just coming off of the holiday season, including Christmas closeout buying in January but it is still mid-winter, so the Spring spending lift has not begun.

As you can see, February spending went well with all of these groups having a strong performance vs 2019. The Year to Date numbers were also very positive. The relevant retail group (less Auto, Gas & Restaurants), which most impacts the Pet Industry, was up 5.7% YTD. This pace was significantly higher than 2019’s 3.7% annual increase.

Everything was looking good. Let’s see how some Key Pet Relevant channels were doing.

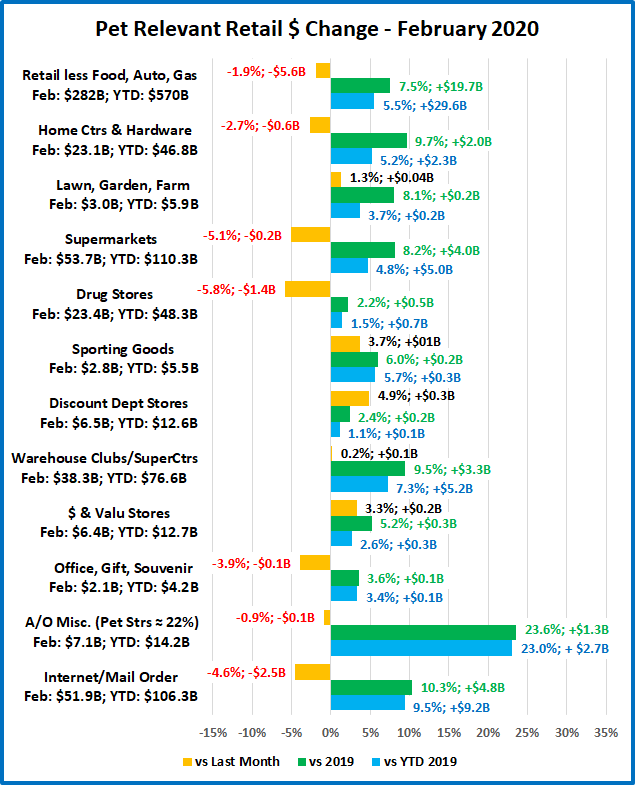
Observations – We’ll look at them in groups

  • Building Material Stores – This group typically has their biggest annual lift in Spring. It appears that they are getting an early start with a significant increase over last year. Farm Stores even had an increase over January. Although Sporting Goods stores are not included in this group, they have a similar Spring lift pattern. They are also off to a strong start after being down 1.6% in 2019.
  • Food & Drug – These stores tend to have more balanced monthly spending with less pronounced lifts. Supermarkets had a strong monthly lift vs 2019 which may reflect an early start on anticipated necessity buying.
  • General Merchandise Stores – From $ Stores to Warehouse Clubs. All had a similar pattern of increases. Once again, this undoubtedly reflects early stocking up on necessities in anticipation of possible future shortages.
  • Office, Gift and Souvenir Stores – They have the expected pattern. Sales fading after the holidays, with a more normal 3.6% increase for the month.
  • Internet/Mail Order – Their pattern is also “usual” as this segment continues strong growth.
  • A/O Miscellaneous – This is a group of small to midsized specialty retailers – chains and independents. It includes Florists, Art Stores and Pet Stores. Pet Stores generally account for 22 to 24% of this group’s total sales. A strong January was followed with an even stronger February, + 24%. This was a continuation of the 23% annual increase for this group in 2019. Pet Stores were surely a significant contributor to the big numbers.

February was certainly a strong month for retail spending. If we were not in the current health & business crisis, the numbers would bode well for a record spending year in 2020. However, we are definitely in an unprecedented situation. Let’s see the advance numbers for March.

First, the big spending groups.

This is certainly a big change from February.

Total Retail – Overall retail spending fell $36B, -7.0%. This is the largest one month year over year decrease since they began doing the survey in 1951. Sales were still up from February which gives us an indication of just how big the March lift is in a normal year.

It is readily apparent where the stay at home and business closing orders were having the maximum impact.

Restaurants – Spending for the month was down 25%, $16.4B from 2019. Remember this segment was up $10B, 8.8% YTD in February. One month turned it completely around. Obviously, delivery and pick up can’t make up the difference from the widespread ban on eating in restaurants.

Automobile & Gas Stations – Obviously, if you can’t go out, except for necessities, then your car becomes less of a focus in your life. Buying a car is less of a priority and it doesn’t matter much how cheap gas is if you’re not driving.

Relevant Retail – Less Auto, Gas and Restaurants – Although many non-essential businesses were forced to shutter their doors in March, overall, this segment showed strong growth in the month. There was a double digit increase in spending over February and sales vs March 2019 and YTD 2019 were also up sharply. Building upon the strong February lift, this group is up 5.3% for year to date spending over 2019. That is 43% greater than their 3.7% annual increase in 2019. Undoubtedly, much of the lift was due to binge spending on necessities, from hand sanitizer and cleaning products to toilet paper. However, the closure of restaurants, schools, and businesses, along with many people now working from home caused a lift in home cooking. This necessitated increased spending at Supermarkets, SuperCenters and Warehouse Clubs. This should continue but the binge shopping will fade as routines become more stabilized.

Now let’s look at what is happening in the individual retail channels across America. Spending is up in Relevant Retail. Let’s see which groups are winning and losing. These groups are less defined than in the Final Monthly reports and we will look all across the market, not just pet relevant outlets.

The positive or negative impact of the COVID-19 crisis is readily apparent.

Observations

Sales are either up or down, across the board – vs last month, last year or year to date, with 1 exception – Miscellaneous Stores. This group still has a YTD increase vs 2019 due to strong early year performance by the All/Other Misc. subgroup.

While the plus or minus rule is generally true, the reasons behind it are often somewhat cloudy. In most states businesses were deemed essential or non-essential, which dictated if and how that they can remain open. Food and drug stores are obviously essential everywhere, but many other groups fall into a grey area. Also, some general merchandise stores were allowed to stay open, but could only sell essential products. Let’s take a brief look at the results. When possible, will bundle them into larger groups.

General Merchandise Stores – Overall, their increase vs last year is slightly above normal at 5.7%, +$3.3B. SuperCenters, Clubs and $ stores all provide necessities and are showing a strong 12.7% increase. However, in many areas they are prevented from selling non-essential products. Department Stores are a mixed bag. The Discount Stores are open at least for necessities but the traditional Department Stores are closed, which drove a big decrease in spending.

Food and Beverage, plus Health & Personal Care Stores – Grocery stores are obviously essential and driven by the initial wave of binge, necessity spending. Their 27%, $15.5B increase over 2019 is the largest of any channel. Liquor stores are also essential, and they are showing plus numbers too. While Drug Stores are essential, many Personal Care stores are shuttered. The Health, Personal Care increase is higher than usual, but the lowest of any of any positive performing group.

Clothing and Accessories; Electronic & Appliances; Home Furnishings – Electronic stores are generally deemed essential but most of the other stores in these groups are not. Clothing stores took the biggest hit, down 52%, -$11.5B from 2019. We should note that even before the pandemic, consumers bought 30% of their clothing online.

Building Material, Farm & Garden & Hardware – This channel has its biggest spending lift in the Spring. With many consumers sheltering in place, their focus has turned to their needs at home. One of these is obviously house and yard repair and improvement. Their March sales are up 10.1%, +$3.5B over 2019.

Sporting Goods, Hobby and Book Stores – While many Book and Hobby stores have been classified as non-essential, most Sporting Goods stores are open. They also usually have a big spending lift in the Spring. However, with organized sports on hold, many parks closed, and non-essential travel discouraged, the need for products in the sporting goods arena is greatly diminished. Together, this group is down 24% versus March 2019.

All Miscellaneous Stores – This group is mostly small to medium specialty stores – both chains and independents. While Pet Stores are essential, most other stores in this group are not. The only reason that their YTD sales are up is because of a spectacular early year performance by the All Other Subgroup, which includes Pet Stores.

NonStore Retailers – 90% of the volume of this group comes from Internet/Mail Order/TV businesses. This channel is up 12.1%, +$7.3B in March. This puts them second only to Grocery in terms of the size of their March increase. This is no real surprise as spending has increasingly moved online in recent years. In fact, the 12.1% increase is actually smaller than their 12.9% annual increase in 2019. However, it is unusual, coming this early in the year, as much of the annual lift is usually driven by Christmas Holiday spending.

Note: Almost without exception, online sales by brick ‘n mortar retailers are recorded along with their store sales in their regular channel. Whether they are up or down, their online sales are included in the totals.

Recap – The COVID-19 pandemic has had a fundamental impact on the American way of life and consumer spending. When you look at the winners and losers you see a common theme. The winners are focused on home and necessities. The losers are truly placed in the discretionary category, at least for now.

Much of the initial lift was undoubtedly caused by panic buying, out of fear. As the situation continues, spending will no doubt move back to a more routine pattern. No one knows how long this will last and what long term impact it will have on U.S. consumers’ spending behavior. We will continue to monitor the data and provide you with regular updates as the situation evolves.

WANT A COPY?

If you would like a copy of any of the charts, just click on the individual chart. An image will appear. Right click on the image. You can then copy or save it.

If you would like a copy of the whole report, just click on the button below to download a PDF file.


U.S. Retail Trade – 2019 $ales Update by Channel – Internet/Mail Order Wins Gold!

The Total U.S. Retail Market in 2019 reached $6.2 Trillion dollars – up $214B (+3.6%). This is less than last year’s (+4.9%). For this report, we will focus on the “Relevant Retail” Total – removing Restaurants, Auto and Gas Stations from the data. This segment totals $3.7 Trillion. Driven by the Internet/Mail Order Segment, Non-Store Retailers moved to the top of the chart. 2019 will forever be seen as a major waypoint in the U.S. Retail Marketplace.

How are specific Retail Channels performing? We’ll start with a market overview and then work our way down.

(Base Data is from the U.S. Census Bureau Retail Trade Report)

Remember: This data is very relevant to the Pet Industry. According to the last Economic Census:

  1. Retailers other than Pet Stores generated 66.9% of all the Pet Products revenue in the U.S.
  2. Pet Products, on average, generated 1.94% of the total revenue of all non-pet stores that chose to stock them.

  • Restaurants (Food Service) – 12.4% of Total Retail – Up $33B, +4.5%, down significantly from last year’s (+6.4%).
  • Automobile Sales – 20.1% of the Total – Revenue grew $48B, +3.9%. A turnaround from recent slowing growth.
  • Gas Stations – 8.2% of the Total – Up $2B, +0.4% from 2018. In 2019 Gas prices stabilized and growth flattened out after 2 years of strong inflation had driven sales up.
  • Retail, Less Food, Auto and Gas – Up $132B, +3.7% to $3.7 Trillion, down from last year’s +4.3%, but this segment did outperform the total market for the first time since 2016. This segment is 59.3% of the Total U.S. Retail market.

To put this year into perspective, let’s look at the overall performance over the last 5 years.

The growth rate of the U.S. retail market increased each year until 2019. Each segment contributes but has a different pattern. Restaurants have the highest overall growth rate, but it has generally slowed since 2015, especially in 2019. The Automobile segment rate also peaked in 2015 and slowed every year until 2019, when they were the only segment to beat their 2018 rate. Gas Stations are the smallest segment but also the most volatile. Double digit deflation drove sales down in 2015-2016. Then double digit inflation drove sales up in 2017-2018. In 2019 prices stabilized and so did sales. Our “Relevant Retail” Segment has been the most consistent, at or near 4% growth each year. The growth rate fell in 2019 but it exceeded the growth rate of the total market for the first time since 2016. The 2019 Relevant Retail growth rate will serve as a benchmark as we review the performance of the individual channels. Above 3.7%, a channel is gaining market share. Below 3.7%, they are losing ground.

Now, we’ll slice up the U.S. “Relevant Retail” Channel “Pie”

These are large slices of the U.S. Relevant Retail pie. If you look closely you will see a troubling situation. 1 division maintained its share but 7 lost ground. Only 1 division, Non-Store retailers increased their share of the total retail market…a lot. They moved up from 3rd to 1st, edging out Food & Beverage by 0.001% ($28B) – a virtual tie for #1. Three divisions – General Merchandise Stores, Food and Beverage and Non-Store account for 61.3% of the total. This is up slightly from 60.2% in 2018. The increase is all due to Non-Store Retailers as the other two segments continue to lose market share. All three are very important to the Pet Industry. Based upon the last U.S. Economic Census, these three major divisions produced 59.7% of total Pet Products sales. Consumers spend a lot of money in Pet Specialty Stores – 33.1% of their Pet Products $. However, they spend over 80% more in these 3 major retail channels. Pet products are “on the list” wherever the consumer shops.

Because they are so huge, major Divisions of the market generally don’t show much movement in market share in just one year so the changes in Non-Store, General Merchandise, Furniture/Electronics, Clothing and Bldg Materials are very significant. Each of the major divisions includes a number of sub segments. For example, General Merchandise includes Traditional Department Stores, Discount Department Stores, Supercenters and Clubs as well as $ and Value Stores. These specific retail channels can have even greater movement in share because this is the level that the consumer “views” when making their initial shopping choice. Change at this level is where any ongoing consumer shopping migration first becomes apparent.

Here is the Market Share change “Rule” for 2019: To gain 0.1% in Market Share your $ increase must exceed the amount generated by a 3.7% sales increase PLUS an additional $3.7B. Example: If a channel did $100B in 2018, they need to do $100 +$3.7 + $3.7 = $107.4B to gain just 0.1% in 2019 share. You will see channels with revenue increases that still lose share because their increase was less than 3.7%. It shows that even small changes in share are significant.

With that overview, we’re ready to drill deeper into the data. Let’s look at the 2019 performance of some of the specifically “Pet Relevant” Channels to see which are doing the best…and worst in gaining consumer spending. Eleven of the twelve were chosen because they generated at least 1% of the Total Pet Products (food & supplies) spending in the last Economic Census – 2012. I have also included Traditional Department stores on the list. Even though they have never truly embraced Pet Products, they have long been a fixture in the U.S. Retail Marketplace. Their continued decline, as consumers migrate to outlets which better fit their needs, has profoundly affected U.S. retail shopping as generally they were the “anchor” stores for the Shopping Malls across America.

We will use 2 graphs to illustrate the situation in these Pet Relevant Channels. The first will show the % change in sales in 2019 vs 2018. The next will “show us the money” – $ gained or lost. Then we will have observations on each segment.

Remember, you must be up at least 3.7% or you’re losing market share!

8 of these pet relevant channels are showing increased sales. However, in market share, only 2 are gaining, while 10 are losing. It is no surprise that internet/mail order is the breakaway winner. However, in addition to moving online, the other trend that is apparent is that consumers are also shopping more frequently at retail specialty stores, like Pet. In the next chart, we’ll “show you the money!” Remember, the Total increase for the “Relevant Retail” Market was $132B and you must be up 3.7% PLUS $3.7B just to gain just 0.1% in Market Share.

The spectacular growth of the Internet is obvious and becoming more dominant as the $ increase in this segment was more than double the combined increase of Supermarkets, SuperCenters/Clubs and Home Centers. The increase by $ Stores slowed in 2019 but their continued growth is evidence that consumers want value plus the convenience offered by these smaller outlets. The A/O Miscellaneous segment continues to maintain and gain as consumers desire more personalized service in certain categories – like Pet Products. One bit of information is concerning. Farm stores declined in sales for the second consecutive year. They are a small retail channel, but a key outlet for Pet Products.

OBSERVATIONS BY CHANNEL (Note: % of Total Business from Pet Products for stores that stock Pet)

  • Internet/Mail Order – $688.9B, Up $85.2B (+14.1%) – 64.7% of the total increase for the $3.7T Relevant Retail Market came from Internet/Mail Order. In fact, they generated 39.8% of the increase in the Total U.S. Marketplace. The Consumer Migration to this channel continues and is even accelerating as they gained +1.7% in Market Share. In 2016 they passed SuperCtrs/Clubs in sales and this year they edged out Supermarkets for the top segment spot in the entire market. Note: Sales on TV are also included in this group. (1.2% Pet)
  • Super Markets – $667.4B, Up $21.0B (+3.3%) Despite increasing sales, this large sub-segment continues to lose ground. Sales are up $80B since 2015 but Market Share is down 0.41%. The Internet/Mail order channel has increased focus on grocery products and became the leading retail channel in 2019. (1.6% Pet)
  • Department Stores – $42.6B, Down $5.1B (-10.7%). Their decline continues. 50 years ago, they “ruled” the GM category. However, they failed to adapt to the changing wants and needs of the consumer. One small example of this is their failure to address America’s growing relationship with our companion animals. (N/A Pet)
  • Discount Department Stores – $92.5B, Down $2.7B (-2.8%). The rise of this segment started the downhill slide of Department Stores but their tenure at the top of GM was relatively brief as the SuperCtrs/Clubs offered true 1 stop shopping. Now, they have to battle the Internet. After a small lift in 2018, sales turned down again. (2.3% Pet)
  • SuperCenter/Club Stores – $491.9B, Up $13.6B, (+2.8%). These outlets, with their broad mixture of grocery and general merchandise…at great prices, quickly became a dominant force in the retail market – second only to Supermarkets in Market Share for many years. In 2016 they were passed by Internet/MO. Consumers still like them as their sales are still growing, but not enough. They continue to lose market share – Down 0.1%     (2.4% Pet)
  • $ & Value Stores – $85.2B, Up $2.5B, (+3.0%). – A Great Value and easy to shop – 2 of U.S. Consumers’ major “wants”. This segment has shown steady growth in recent years, but it slowed in 2019. (4.3% Pet)
  • Drug Stores – $292.1B, Up $7.1B, (+2.5%). There still is a lot of turmoil in this segment. Intense competition has led to a large number of mergers and acquisitions, which have slowed growth. (0.3% Pet)
  • Sporting Goods – $1.8B, Down -$0.7B, (-1.6%). A Minor player in Pet. The turmoil in the category caused by mergers, acquisitions and store closings has slowed but they continue to lose share. (N/A Pet)
  • Home Centers – $298.2B, Up $3.1B, (+1.0%). These large, “project driven” outlets have never done a significant Pet Business. The top 2 retailers, Home Depot & Lowes are the drivers, but overall, they lost -0.2% in share.     (0.6% Pet)
  • Hardware – $27.3B, Up $0.5B, (+1.9%). Extensive weather damage in 2017 & 2018 had a huge impact on this channel, turning sales sharply upward. 2019 was a little calmer and sales plateaued. (2.6% Pet)
  • Farm and Garden Stores – $42.0B, Down -$1.3B, (-2.9%). This segment has been growing in recent years in both overall sales and in Pet, but it was largely driven by Tractor Supply. However, like 2018, a strong increase by TSC in 2019 couldn’t overcome the decline in sales from other outlets. Market share is down 0.2% since 2017. (8.9% Pet)
  • A/O Miscellaneous Stores $87.0B, Up $5.1B, (+6.3%). Florists, Pet Stores, Art Dealers…are typical of the segments bundled into this group. Pet Stores account for over 20% of the $ in this segment. These stores, whether chain or independent, tend to be small to medium in size. Their increase again exceeded the market so these stores, which focus on another consumer trend – a more personalized shopping experience, are “holding their own” against the large format retailers and the internet. +0.1% in share since 2015. (Pet Stores $ are 91% Pet Products)

The chart below puts the Market Share of each of these segments for 2019, 2018 & 2017 in a visual format so that it is easier to appreciate the relative sizes. Growth in share since 2017 is indicated by a green box, a decline is boxed in red.

Now we’ll wrap it up with a brief summary and a detailed chart for future reference.

SUMMARY 

Pet Stores remain the #1 channel for Pet Products. However, in the Relevant Retail Market, there are 3 Olympic Medalists. SuperCenters & Clubs are firmly entrenched with the Bronze medal. Since 2016, the race for the Gold has been between SuperMarkets and the Internet/Mail Order Channel. In 2019, Internet/Mail Order gained 1.7% in share and took the Gold away from Supermarkets/Grocery for the first time… ever. Supermarkets and other channels are trying to fight back by creating and emphasizing online ordering programs. However, it appears to be too little, too late to stave off the internet juggernaut.

In 2019 the annual increase in the Relevant Retail market slowed to 3.7%, after 2 years of increasing rates. Although, like that last slow year, the increase in the “Relevant Retail” market was larger than the increase in the Total Retail Market. In 2019 Gasoline prices were again a major factor as they stabilized and flattened sales, which lowered the Total Retail increase. The Internet/Mail Order Channel provided the only excitement and 64.7% of the growth in Relevant Retail. SuperMarkets, SuperCenter/Clubs, Drug and Home Centers increased sales by $44.8B but all lost market share. Traditional & Discount Department stores continued their decline while sales growth in the easy to shop and save, $ Stores also slowed. Besides Internet/ Mail Order, only the small to medium A/O Miscellaneous Stores (Includes Pet) gained ground in the market by appealing to consumers desiring a more personalized shopping experience.

The U.S. Retail Market continues to grow and evolve as the consumer migrates to the channels which best fulfill their current wants and needs. This is not a new phenomenon. It has always been that way. In 2019, the “Channel of Choice” is Internet/Mail Order. Now, with the current health crisis and resulting retail shut down, the environment has radically changed. Internet/Mail Order will prosper but shopping in many Brick ‘n Mortar stores may be changed forever.

Finally, the Chart below contains Detailed 2017 > 2019 Sales Performance Data for over 30 U.S. Retail Channels.