GLOBAL PET EXPO 2022…Where Big Ideas Come to Life!

Global Pet Expo, the Pet Industry’s premiere event, is back, live and in person. The show switched to a virtual event last year due to COVID, breaking a string of 63 consecutive live shows (since 1958). The 2020 show was also affected by COVID, as last-minute travel restrictions forced many Chinese exhibitors to cancel.

How important is a live event? In the Pet Industry it is critical because of our attitude towards Pets and Pet Products. Pets became an integral part of our families in the 90’s as Pet Owners became Pet Parents. This relationship has grown even stronger in recent years as we now increasingly personify our pets. This is why a live show is important. Pet shows are primarily focused on Pet Products. Studies have shown that over 60% of consumers prefer to make initial buying decisions on Pet Products in person. This makes Pet Products second only to fresh groceries in this consumer behavior. This preference applies to all Pet Products buyers, not just consumers. The retailers and distributors attending GPE and SuperZoo want to see and touch a new product before they buy. Obviously, live shows are not just important, they are critical to the continued growth and strength of the Pet Industry.

There will be changes this year as the APPA and PIDA are doing everything possible to ensure the safety and comfort of all attendees. If you are not at serious risk, then it is an event not to be missed. Now, let’s take a brief look at what awaits attendees of GPE 2022.

The show is smaller this year, both in square footage (-20%) and number of exhibitors (-30%) but there is still a bounty available,  more than enough to satisfy the needs and wants of every buyer that attends. Here are some relevant facts.

  • 704+ Booths – as of 2/20 but more are being added daily
  • 270,000+ sq ft of exhibit booth space (Not counting the 45,000 sq ft new product area)
  • 20 x 10 is again the most popular size – 253 (35.9%), reflecting the need for more space.
  • Booths are larger – the “average” booth is over 379 sq ft, up 16% from 2020. (Almost equal to a 20’x20”)
  • Size matters – Booths 300 to 800 sq ft (31%) occupy 41% of the space. Those over 1000 sq ft (7%) cover 34%.

Will you see any new exhibitors or is it the usual group? There have been 4 live pet trade shows from 2019>21 – 2 GPEs and 2 SZs. Of the current exhibitors at GPE 2022:

  • 218 (31%) – Did all 4 other shows
  • 511 (73%) – Did at least 1 other GPE
  • 193 (27%) – Are new to GPE
  • 120 (17%) – No other shows; new to the industry

The percentage of exhibitors new to GPE this year is about the same as 2020’s 29%. There is plenty of “New” to see.

Specially Designated “Floor Sections” at GPE account for 41% of Booths, about the same as 2020 (40%). Due to the big drop in booth count, the best way to compare GPE 2022 to previous years in this and other areas is by share of booths.

  • Natural – 180 Booths. The number of booths in this section is actually up from 174 in 2020. The share has skyrocketed up to ¼ of all booths, reflecting the growing strength of the natural trend in our whole society.
  • Boutique – 21 Booths. After a brief resurgence in 2020, the booth share of this area fell sharply. Boutique is essentially the opposite of Natural and more discretionary in a country that is increasingly focused on “needs”.
  • Aquatic – 15 Booths. Popularity of this category continues to trend down.
  • 1st Time Exhibitors – 74 Booths. The share is up but most of the 193 1st Timers chose the regular floor or another special section. GPE is a “must do” for new companies and New – products and companies are a major focus of GPE.
  • International – No international pavilions this year, except a 2 booth Canadian. In 2020, before the last-minute travel restrictions, there were 268 exhibitors from 26 countries outside the U.S. COVID is still affecting travel.

There are large numbers of exhibitors in the “regular” floor space who would qualify for inclusion in these sections. You need to “work” the whole show to ensure that you get a full view of the product categories of interest to you. I will again be creating a GPE Exhibitor Visit Planner that allows attendees to plan their floor time by targeting the exhibitors with products of interest. The GPE 2022 SuperSearch will be made available by March 2nd and be regularly updated with last minute changes. Now, let’s take a look at the results from this year’s research on exhibitors’ product offerings.

First, we’ll Compare Exhibitor Types – By function: By Animal type (Numbers are based assigned booths as of 2/20/22)

Dogs & Cats had a slight flip in share, but the other 10 categories basically maintained existing gain/loss trends.

  • Dogs Still Rule – They are still in about 83% of all booths. 5 out of every 6 booths are selling dog products.
  • Cats are also maintaining their share. Cat Products are offered by 56% of exhibitors. Up from 40% in 2014.
  • Fish/Aquatic – This category had the biggest decrease of the animal types and is down 43% since 2017.
  • Other Animals – In a continuing trend, all gained share. Reptiles & Small Animals had the biggest increases.
  • Business Services – Besides wellness products, this is the other big trend in the Industry. The lift is driven by private label/OEM and reflects the changing needs in the industry. There were only 8 exhibitors in 2014.
  • Distributors – The count is the same as 2020 so the share increased. Only 8 exhibited in 2014.
  • Gift/Gen Mdse – This category has been consistently declining since peaking at 7.8% in 2016.

Dogs and Cats are the undisputed royalty of Pet. Because of their huge impact on the industry. I have divided the products designed for them into 33 subcategories. Let’s see how this year’s GPE Top Ten (by booth count) are doing.

The top 4 are the same as 2020 and the top 2 had the biggest gains in share. There was a shuffling in the rankings from 5>10 – 3 moved up in rank and 3 fell. Grooming Tools returned to the Top 10 as Crates/Carriers fell to #12.

  • Treats are still #1 and their share grew 10+%. 1 in 2 booths offers treats. (Many supplements are in treat form.)
  • OTC Meds/Supplements/Devices also continues to grow in importance. In 2014, their share was only 11%.
  • Food had the 3rd largest gain and reflects the ever-growing Pet Parent focus on nutrition, health and wellness.
  • Feeding Accessories gained share but were passed by Food. They are perennially ranked 5th or 6th.
  • Toys – Toys held onto #3 despite having the 2nd biggest loss in share. This relates to fewer Far East exhibitors.
  • Collars, Leads & Harnesses – They held the #4 spot and their share has been stable since 2019 after falling from 22.1% in 2018. In 2016, they also had a 22.1% share but that earned them the #2 ranking.
  • Beds/Mats – Their share decline began in 2019 and continues as they fell from a tie for 5th to 7th.
  • Apparel – They held the #7 spot from 2016>19 with a 12% share. They began to decline in 2020 and had the biggest drop in share in 2022. They have now fallen to 9th
  • Waste Pickup – They have been growing in popularity. They broke into the Top 10 in 2020 and now rank 8th.
  • Grooming Tools– After years at 9/10, they fell to #12 in 2020 but they returned to #10 with a 1.1% gain in share.

Pet Parents’ concern for the overall health and wellness of their “pet children” remains the biggest trend.

The last chart details the specifics for all 33 of the Dog/Cat product categories that I defined. Of note: All the data inputs for this report and the SuperSearch tool come from a review of the GPE online exhibitor product listings AND visits to over 700 websites. They’re not 100% accurate, but pretty close. Which categories are of interest to your business?

GPE 2022 is the place to literally see big Pet Industry ideas come to life! There are products, services and education to fulfill every need and want. There is also an abundance of “new” – both in products and the 120 exhibitors who are new to Pet Industry shows. However, to reap the benefits, you need a plan. Exhibitors must showcase the “right” items. Attendees need to strategically analyze their data, determine what they need to improve their business and develop a plan to find the products to fulfill their needs. Then…execute the plan. If they do nothing else at GPE, attendees will have 2 minutes and 3 seconds to spend at each booth. With bigger booths and mergers/consolidations, you definitely need a plan! The GPE 2022 SuperSearch will be available next week. It can help. Try it out. Stay Safe & Good luck in Orlando!

Retail Channel Monthly $ Update – December Final & January Advance

The Retail recovery has been generally successful, but a long and complex journey. Now, we are seeing a new and largely unexpected factor also attributed to COVID – extreme inflation. Since this can affect retail sales, we will continue to track the retail market with data from two reports provided by the Census Bureau and add in the CPI from US BLS.

The Census Bureau Reports are the Monthly and the Advance Retail Sales Reports. Both are derived from sales data gathered from retailers across the U.S. and are published monthly at the same time. The Advance Report has a smaller sample size so it can be published quickly – about 2 weeks after month end. The Monthly Final Report includes data from all respondents, so it takes longer to compile the data – about 6 weeks. Although the sample size for the Advance report is smaller, the results over the years have proven it to be statistically accurate with the final monthly reports. The biggest difference is that the full sample in the Final report allows us to “drill” a little deeper into the retail channels.

We begin with the Final Retail Report for December and then move to the Advance Report for January, giving us a final look at 2021 and a 1st look at 2022. In the December Final we will compare 2021 to both 2020 and 2019. In the January Advance we will compare 2022 to the 3 prior years and add in the Avg Annual Change. Note: January Monthly $ = YTD.

Both reports include the following:

  • Total Retail, Restaurants, Auto, Gas Stations and Relevant Retail (removing Restaurants, Auto and Gas)
  • Individual Channel Data – This will be more detailed in the “Final” reports, and we fill focus on Pet Relevant Channels

The information will be presented in detailed charts to facilitate visual comparison between groups/channels of:

  • Current Month change – % & $ vs previous month
  • Current Month change – % & $ vs same month in 2020 and 2019 (In the Advance, we compare 2022 to 21,20 & 19)
  • Current YTD change – % & $ vs 2020 and 2019 (In the Advance, YTD is unnecessary, so we add the Avg chge)
  • Monthly and Year To Date $ will also be shown for each group/channel

First, the December Final. Retail hit bottom in April 2020 but began recovery, hitting record $ in December. $ fell in Jan>Feb but set a new $ records in March & May. Sales slowed through September but turned up in October, setting new records in November & December. Here are the major retail groups. (All $ are Actual, Not Seasonally Adjusted)

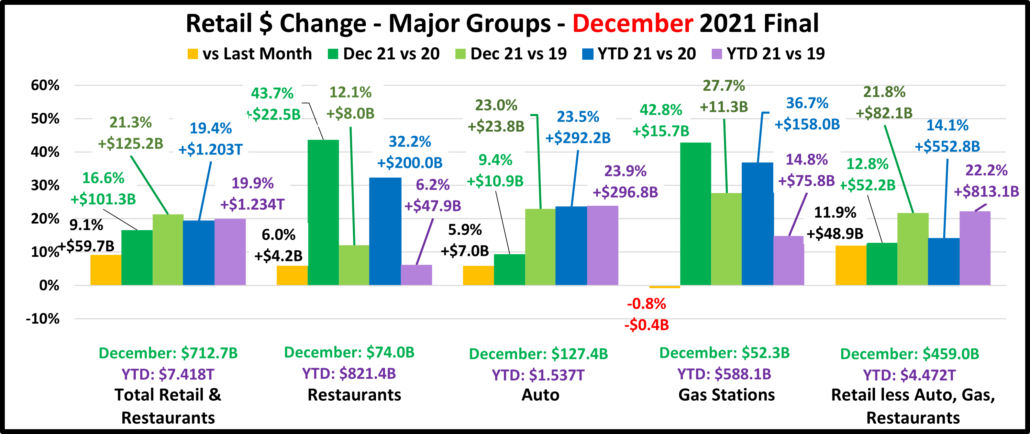
The final total is $2.3B less than the Advance report projected a month ago. 2 groups were up and 2 were down. The specifics were: Restaurants: +$0.7B; Gas Stations: +$0.5B; Auto: -$1.4B; Relevant Retail: -$2.0B. Sales vs November were up for all groups but Gas Stations. Total Retail $ales broke $600B for the 1st time in December 2020. December 2021 $ales broke the $700B barrier. Restaurants & Gas Stations had a truly strong December vs 2020 as their recovery strengthens. Auto had the strongest recovery with 23.5% growth in 2021 producing an annual YTD growth rate since 2019 of +11.3%. A slight $ dip in December is normal for Gas Stations but all groups contributed to setting a new $ record. Importantly, for the 7th consecutive month, all groups were positive in all measurements vs 2020 or 2019.

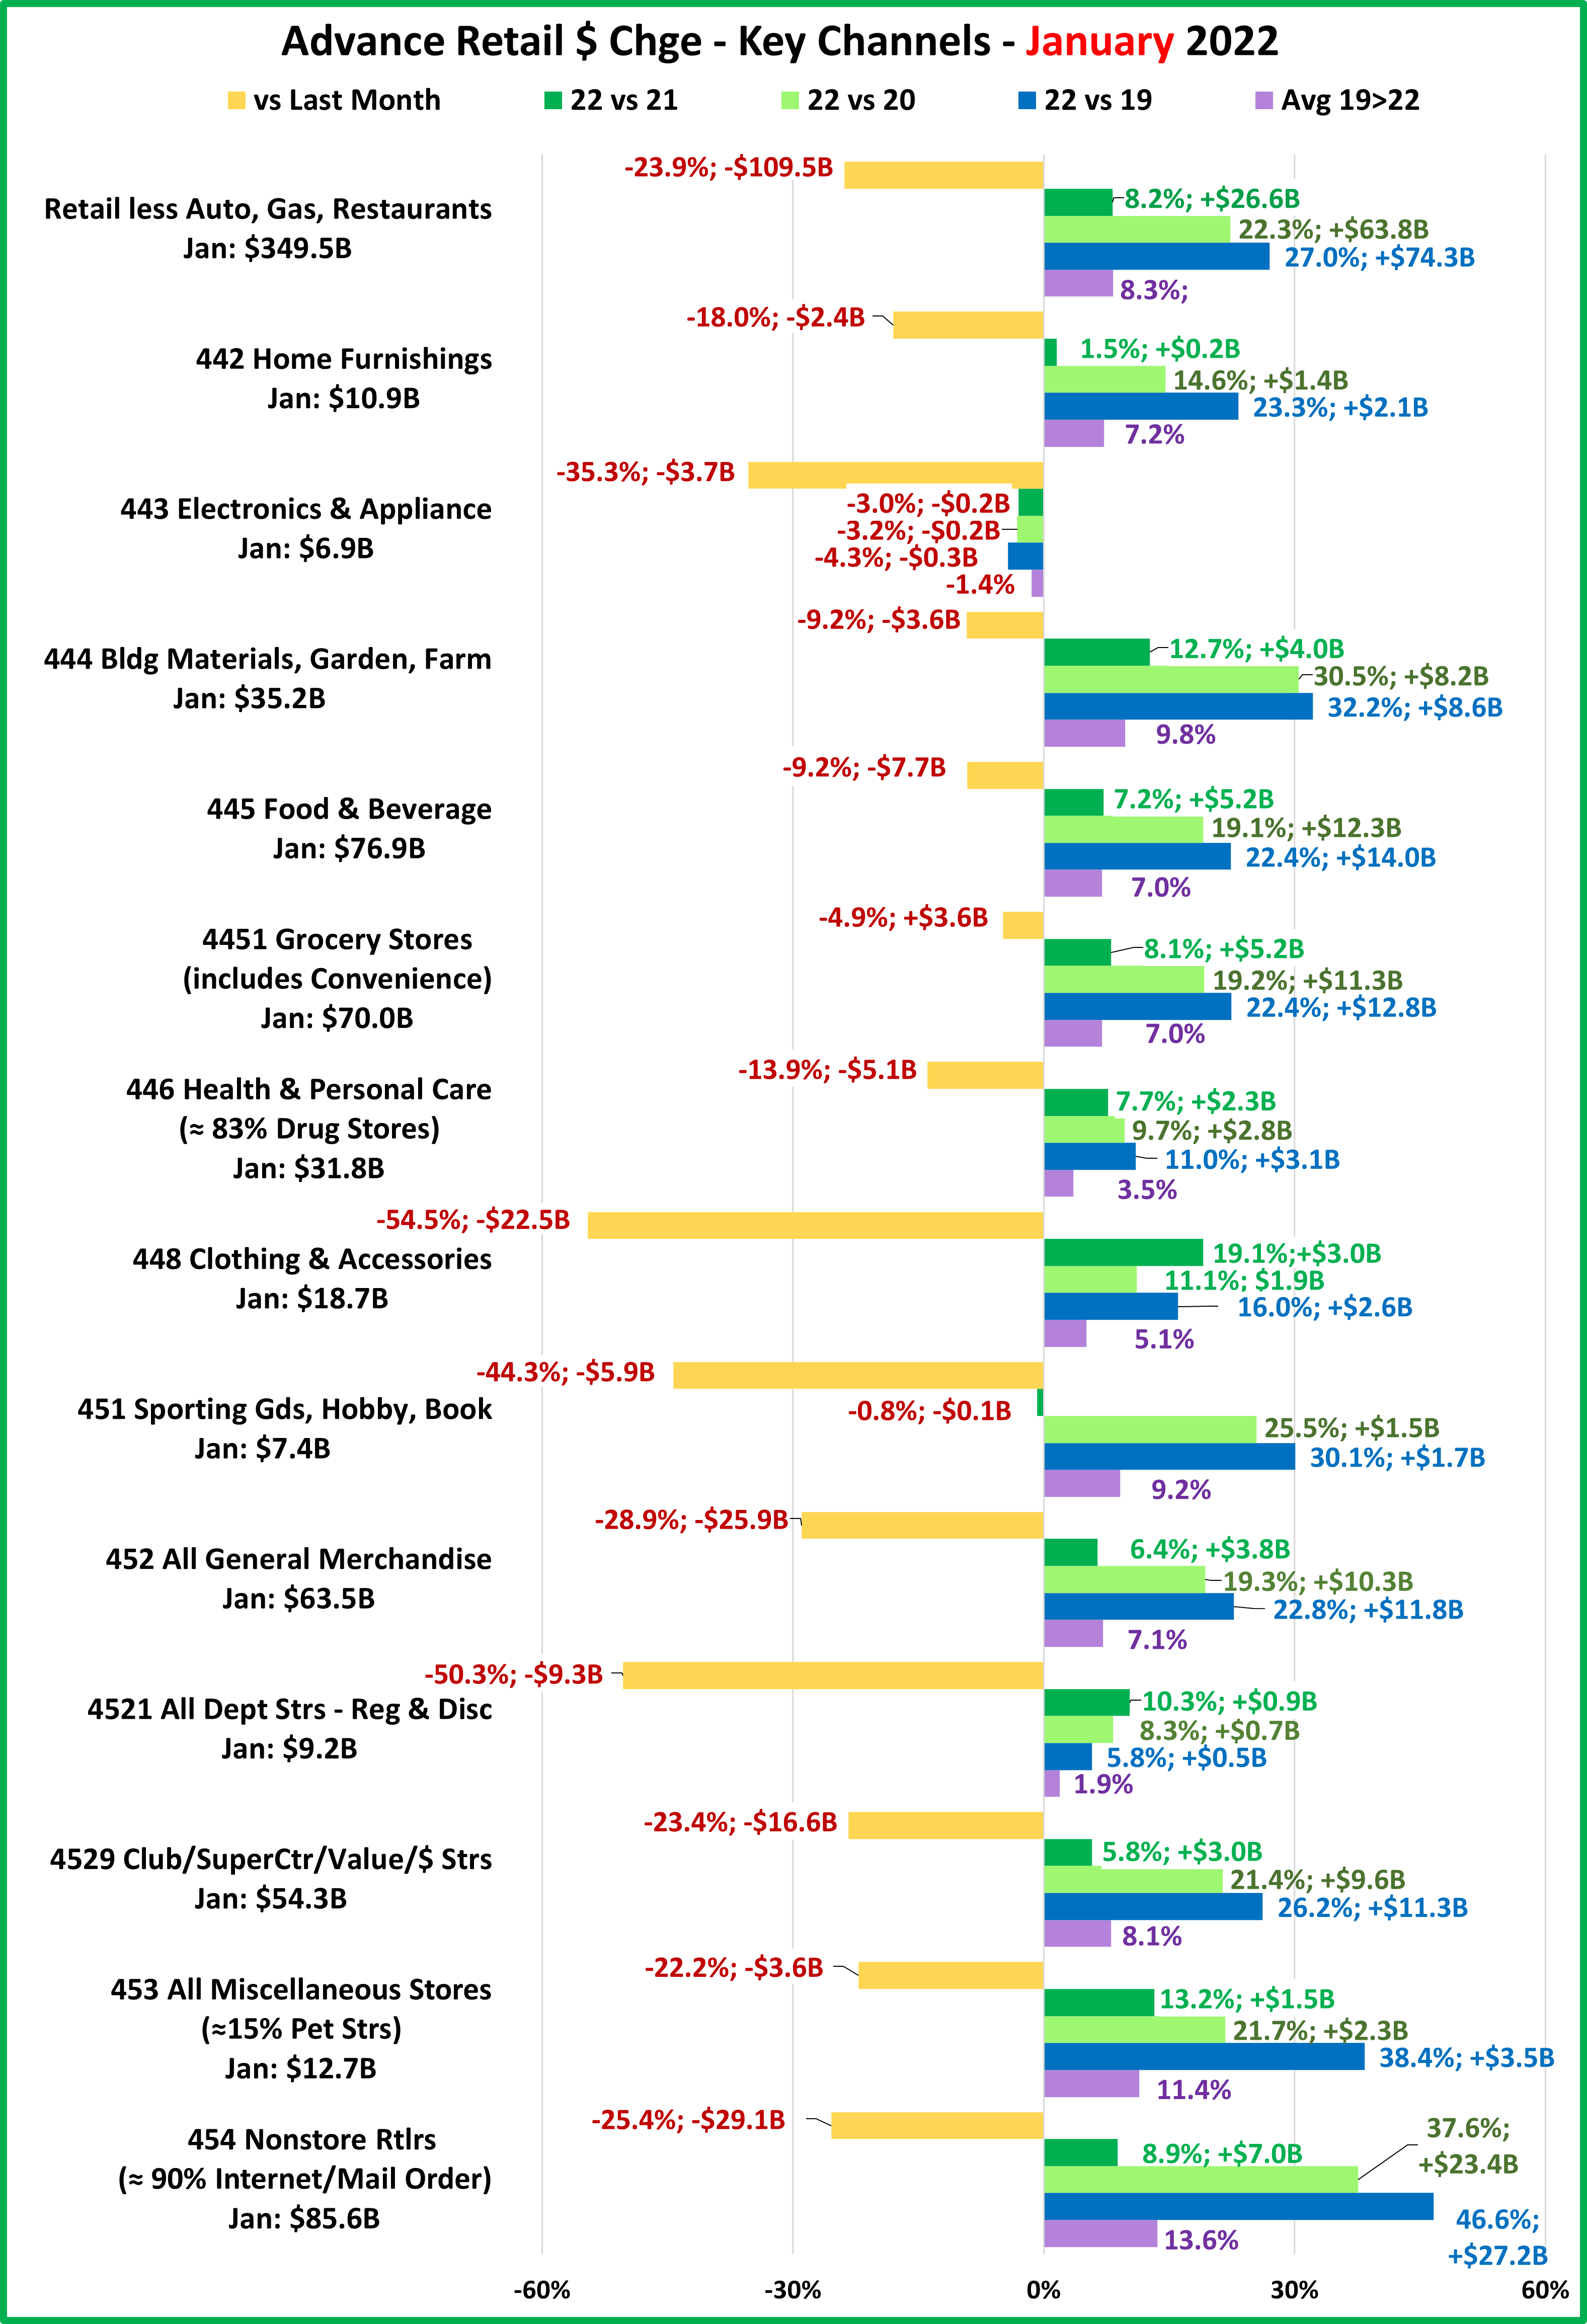
Now, let’s see how some Key Pet Relevant channels did in December.

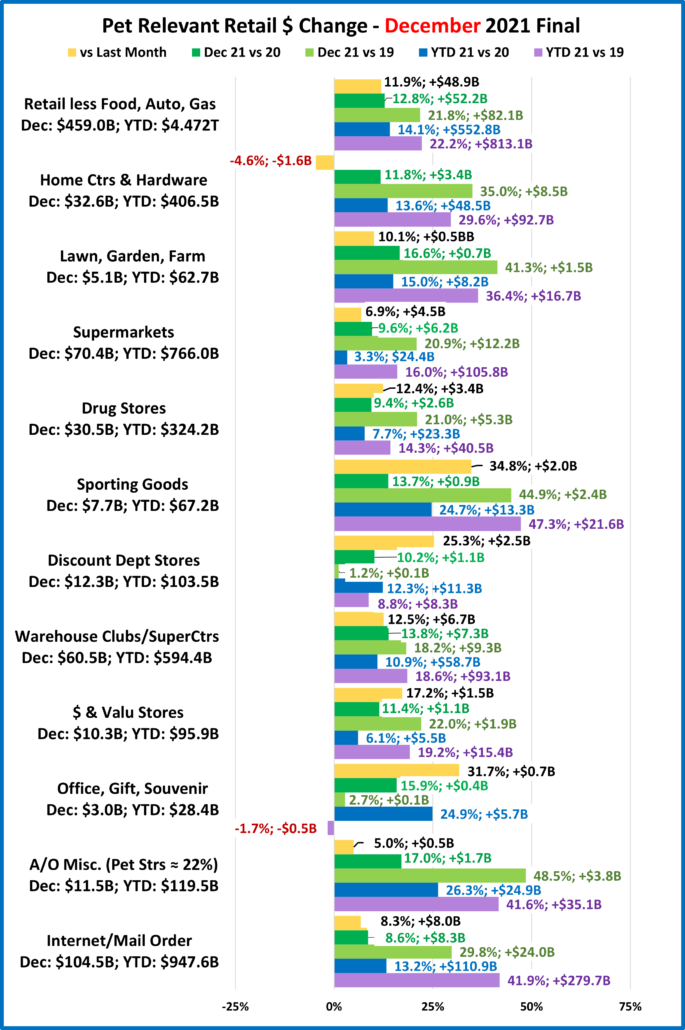
  • Overall – 1 was down vs last month. A December dip in Home Ctr/Hrdwre is not unusual. Office/Gift/Souvenir $ had a strong month but are still down at yr-end vs 2019. December set another new $ record for Relevant Retail.
  • Building Material Stores – Their amazing lift has slowed as we move into winter. The surge came from pandemic spending patterns developed in 2020. Consumers began focusing on their homes. Their Spring lift slowed in 2021 but Building and Farm stores are still going strong. Sporting Goods stores have a similar pattern. Sales took off in May 2020, set a record in December and continued strong in 2021. They slowed in the Spring/Summer but set a record in November, then exploded in December. Yr-end they are +47.3% vs 2019, a Growth Rate of 21.4%!
  • Food & Drug – Supermarkets were +$77.7B in 2020. $ are up vs November and +9.6% vs December 2020. 2021 $ were +3.3% vs the 2020 binge and +16.0% vs 2019. Drug Stores were +$17B (+5.7%) for 2020. They had a record March. Sales then stabilized until hitting a new record in December. They finished 2021 at +7.7%.
  • General Merchandise Stores – $ in all channels fell in Jan/Feb then spiked in March. Monthly sales by channel varied up/down until all stores turned up in October & set a new GM $ record in December. Clubs/SuprCtrs & $ Stores are leading the way with a combined annual growth rate of +8.9%. These channels promote value. Their success reinforces its consumer importance. Disc. Dept. Strs again show all positive numbers, growing at 4.3%.
  • Office, Gift & Souvenir Stores– $ were up +31.7% vs November and they finished the year up 24.9% vs 2020. However, they were still down -1.7% vs 2019. Things have improved but full recovery is pushed into 2022.
  • Internet/Mail Order – Their December sales broke the $100B for the first time and they finished the year +13.2% vs 2020. This comes on top of a 25.3% lift last year and generates an average growth rate of 19.1%
  • A/O Miscellaneous – This is a group of specialty retailers which includes Florists, Art Stores and Pet Stores (22>24% of total $). In May 2020 they began their recovery. December 2021 was their 8th consecutive month over $10B and set a new record, $11.5B. Yearend $ are +26.3% vs 2020 and +41.6% vs 2019. Avg Growth: 19.0% – 3rd

Relevant Retail began recovery in May 2020 and hit record $ in December. In 2021 $ fell in Jan/Feb, turned up again in March and began a monthly up/down rollercoaster. December $ brought records for both monthly and annual sales. Moreover, all but 1 channel were ahead of all 2020 & 2019 measurements. The big drivers continue to be the Internet, SuperCtrs/Clubs/$ Stores and Hdwe/Farm. Now, the Advance numbers for January.

We have now had 2 straight memorable years. 2020 saw the 2 biggest monthly drops in history but Total Retail finished by reaching $600B for the first time in December. In 2021, the recovery strengthened with all big groups positive in all measurements vs 2019 & 2020 for the final 7 months. Total Retail reached $713B in December and broke the $7T barrier for the year. Relevant Retail was also strong as annual sales reached $4T but in fact, all big groups set annual sales records in 2021. Some channels are still suffering but the Retail market made a widespread, strong recovery. That brings us to 2022. First, let me issue a warning. You will see universal drops in sales from December and some will be huge. This is to be expected and totally normal. Here is the average Dec>Jan $ drop for the 10 years prior to the pandemic:

Total Retail: -20.2%

Restaurants: -8.0%

Auto: -11.5%

Gas Stations: -4.1%

Relevant Retail: -26.5%

The other factor on everyone’s mind is inflation. We will address that issue, especially when we look at the change in sales vs January 2021. Now, let’s get started.

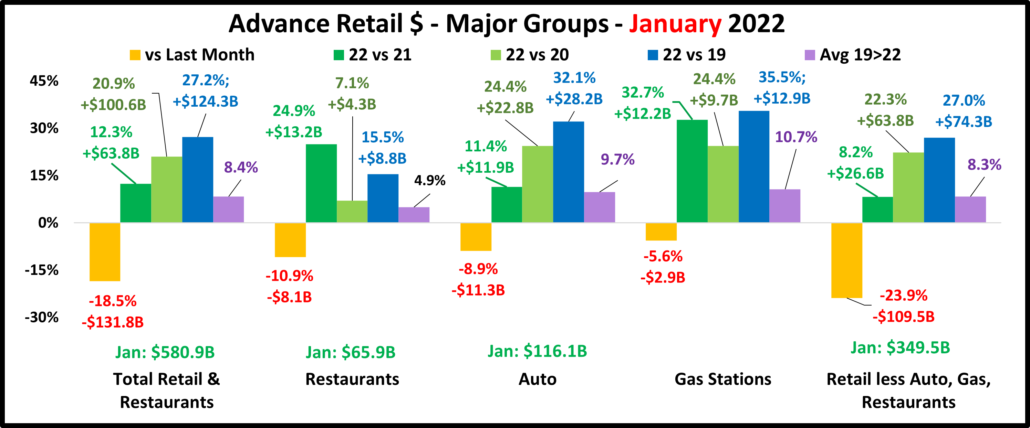
Overall – The only negative numbers are vs December. We should also note that the January sales patterns since 2019 look pretty normal for Total Retail, Relevant Retail and Auto with year over year increases. Remember, January 2020 was pre-pandemic and by January 2021, only Restaurants and Gas Stations had not begun a strong recovery.

Total Retail – Sales in 2021 were up $1.2T (+19.4%) vs 2020, with an annual growth rate of 9.4% since 2019, the best in history. It took 2 years to recover from the Great Recession in 2009. This time it appears that we effectively accomplished it in 1 year. Annual inflation for 2021 vs 2020 was +4.7% so 75.8% of the 19.4% increase was real – 14.7%. In January, sales fell -18.5% from December, which is slightly less than a “normal” -20.2%. This is impressive since December sales reached an all-time high. However, January sales also set a record for the month, beating the previous best in 2021 by 12.3%. Although 2022 is the best performer, January sales for Total Retail have increased regularly since 2019 with an average annual lift of 8.4%. Jan 22 vs Jan 21 – Inflation = +7.5%. “Real” $ increase = +4.8% (39% of 12.3%) Inflation could be starting to have an impact.

Restaurants – They were hit hard by the pandemic and didn’t truly start to recover until March 2021. However, sales in 7 of the last 8 months of 2021 exceeded $70B. December $ were a record for the month and 2021 was the biggest year in history, $821B. January sales fell 10.9% from December, a little higher than their usual 8.0%, but were up 24.9% from 2021. Their January sales pattern clearly reflects their late recovery as sales are only up an average of 4.9% since 2019. Jan 22 vs 21 – Inflation: Food away from home = +6.4%; “Real” $ increase = +18.5% (74.3%). Damn Good!

Auto (Motor Vehicle & Parts Dealers) – Staying at home causes your car to be less of a focus but this group actively worked to overcome this attitude with great deals and a lot of advertising. They finished 2020 up 1% vs 2019 and the last 10 months of 2021 were the biggest in history, generating a record $1.54T in 2021. Their growth rate from 2019>21 averaged +11.3%, the best of any big group. In January 2022, sales fell -11.3%, minimally better than their normal -11.5%. Sales increased 11.4% in January vs 2021. You an see that the biggest increases occurred in 2021 and 2022 but they also have a pretty normal January growth pattern, with an annual average increase of +9.7%. Jan 22 vs 21 – Inflation: Overall = +7.5%; New & Used Vehicles = +23.1%. This means that at best the Real $ increase was +3.9%. The worst and more likely case is that there was actually a decrease in the amount sold in the Auto group.

Gas Stations – Gas Stations were also hit hard. If you stay home, you drive less and obviously need less gas. This group truly started recovery in March 2021. They were positive vs 2019 & 2020 for the last 10 months of 2021 and reached a record $588B (+36.7%) for the year. January sales were down -5.6% from December, slightly more than their usual -4.1%. However, they were up 32.7% vs 2021. You can see that they have a January sales pattern that is similar to Restaurants but more extreme which is evident by their 10.7% 2019>22 growth rate, which is twice as high. Inflation comes to the forefront in this group because the spectacular rise in gasoline prices has generated a lot of headlines in the media. Jan 22 vs Jan 21 – Gasoline Inflation = +40.0%. “Real” $ change = -7.3%. Spend more but get less.

Relevant Retail – Less Auto, Gas and Restaurants – This is considered the “core” of U.S. retail and traditionally accounts for about 60+% of Total Retail Spending. The channels in this group took a variety of paths through the pandemic due to many factors, like closures, binge buying, online shopping and consumers’ focus on “home”. However, their only down month was April 2020. They finished 2020, up +7.1% and 2021 got even better. March>December were 10 of the 12 biggest months of all time and helped generate a record $4.47T, +14.1% in 2021. They have led the way in Total Retail’s recovery with an average annual growth rate from 2019 of +10.6%. The recovery was primarily driven by Nonstore, Grocery, SuperCtrs/Clubs/$ Stores and Hardware/Farm but it became widespread with help from channels like Sporting Goods and even Miscellaneous Stores (includes Pet). In January sales fell -23.9% from December but still set a record for the month. This looks like a big decrease but is actually less than the normal drop of -26.5%. It reinforces the importance of December holiday sales to this group. Sales in January were +8.2% vs 2021 and almost equal to their annual growth rate of +8.3% since 2019. Their January sales pattern shows regular growth since 2019 but the biggest lift occurred in 2021 as more channels became productive and they strongly kicked off what was to become a record year. Jan 22 vs Jan 21 – Inflation = +7.5%. “Real” $ increase = +0.7% (8.5% of 8.2%). This is concerning as inflation has stopped, at least temporarily, the real growth in this huge, segment that is critically important to the U.S. Retail Marketplace.

In the groups with the strongest recovery from COVID, Relative Retail and Auto, monthly increases are slowing so we are now starting to see the effect of strong inflation. Now, we’ll look at what is happening in the individual retail channels. Remember, the groups in the chart are less defined than in the Final Monthly reports and we will look across the whole market, not just pet relevant outlets. Also remember the 7.5% inflation rate to put the $ changes into better perspective.

Everyone was down vs December and the January Sales of Electronics & Appliance Stores have been slowly falling since 2019. Sporting Goods were down a little vs 2021 but all other channels showed increases vs every year.

After hitting bottom in April 2020, Relevant Retail has now beat the previous year’s $ for 21 consecutive months. They set an all-time record of $406.8B in December and finished 2020 +$260B vs 2019. 2021 was even stronger with record sales in every month and a new record of $461.0B in December & Yr-end, $4.47T. Essential channels were the drivers:

  • Nonstore Retailers
  • Food & Beverage – Grocery
  • Bldg Materials/Garden/Farm
  • SuperCtrs/Club/Value/$ Strs

That brings us to 2022. Relevant Retail was up 8.2% vs 2021 but inflation was 7.5%, so the real increase was about 0.7%. In fact, only 7 of 13 channels had a year over year sales increase over 7.5% and some were just barely over.

General Merchandise Stores – Sales fell sharply vs December, especially in Department Stores, -50.3%. In terms of increase vs 2021, they beat inflation with +10.3% but sales growth was strong because of 2 straight years of decline. Average growth is only 1.9%. Clubs/SuperCtrs/$ stores didn’t beat inflation, but their annual average growth rate is 8.1%. They are the key to the future of the GM channel. Here are the actual and “real” increases from 2021.

  • All GM: +6.4%, Real = -1.1%; Dept Stores: +10.3%, Real = +2.8%; Club/SuprCtr/$: +5.8%, Real = -1.7%

Food and Beverage, plus Health & Personal Care Stores – These stores are more essential and depend on frequent purchases so the drop from December was less severe. They had similar January lifts but the average increase for Grocery/Food & Beverage, +7.0% is twice that of Health/Drug stores, +3.5%. (BTW: Grocery Inflation was +7.4% vs 2021)

  • Food & Bev: +7.2%, Real = -0.2%; Grocery: +8.1%, Real = +0.7%; Health/Drug Stores: +7.7%, Real = +0.2%

Clothing and Accessories; Electronic & Appliances; Home Furnishings – A big drop from December, especially for Clothing but they have mostly recovered. The January order pattern and growth rate shows an earlier and stronger recovery for Furniture. Electronic/Appliance is just now back to 2019 $ and continued their pattern of January declines.

  • Clothing: +19.1%, Real = +11.6%; Electronic/Appliance: -3.0%, Real = -10.5%; Furniture: +1.5%, Real = -6.0%

Building Material, Farm & Garden & Hardware –Their Dec>Jan drop was small, as expected. They have benefited from consumers focusing on their home needs. They ended 2020 (+14.3%) and 2021 (+13.5%) and continued strong into January with a 12.7% increase over 2021 so they’re still beating inflation 2022 = +12.7%, Real = +5.2%

Sporting Goods, Hobby and Book Stores – Consumers turned their attention to personal recreation and sales in Sporting Goods outlets took off. The group ended 2020 +7.0% vs 2019 and 2021 was up an incredible +28.6%. January was down -44.3% from December and even down -0.8% from 2021, reducing its avg growth from 14.5% to 9.2%. Their incredible record setting run may have come to an end and stabilized at a new, higher level. 2022 = -0.8%%, Real = -8.3%.

All Miscellaneous Stores – Pet Stores have been a key part of the strong and still growing recovery of this group. They finished 2020 +0.9% but sales took off in March 2021, hitting a record $17.1B in December. Sales fell an average amount in January but were still 13.2% ahead of 2021 which was the 2nd best, behind Clothing Stores. This put their average January growth rate at +11.4%, second only to Nonstore Retailers. 2022 = +13.2%, Real = +5.7%

NonStore Retailers – 90% of the volume of this group comes from Internet/Mail Order/TV. The pandemic accelerated the movement to online retail. They ended 2020 +21.4%, +162.9B. This was 63% of the entire increase for Relevant Retail. Sales growth continued in 2021 and in December monthly sales exceeded $100B for the 1st time. For the year, they finished +13.6% and also broke the $1 Trillion barrier. January sales fell -25.4% from December but were +8.9% vs 2021 and they maintained the highest average rate of increase, +13.6%. 2021 = +8.9%, Real = +1.4%

Note: Almost without exception, online sales by brick ‘n mortar retailers are recorded with their regular store sales.

Recap – 2020 was quite a year, with the trauma of April & May followed by the triumph of breaking $600B for the first time in December. 2021 was even more memorable as it produced record sales for all major groups and Total Retail exceeded $7T for the 1st time. Relevant Retail was the major driver in this recovery. Since May of 2020 their sales have exceeded 2020 and 2019 in all measurements and reached $4.47T in 2021. The recovery was widespread as all but 2 groups on our Advance Chart set sales records in 2021. January began pretty normally for Relevant Retail with a -23.9% drop from December. This is slightly less than average and actually very good considering the record Holiday sales in 2021. With the strong retail recovery, another unexpected issue has come to the forefront, runaway inflation. The CPI is rising at year over year rates that haven’t been seen in decades. The retail recovery means a return to “normal” which includes smaller, more “normal” sales increases. Right now, sales continue to increase. Consumers often pay more but get less. As we’ve seen in the Pet Industry, strong inflation can severely reduce sales. We’ll keep tracking the retail market.

“Petflation” 2021 – A Closer Look at the CPIs for the Pet Industry

Inflation has made a lot of headlines recently. There have been year over year increases in the monthly Consumer Price Index (CPI) larger than we have seen in decades. In December 2021, overall prices were up 7.0% over December of 2020. Food for home consumption was up 6.5% and Gasoline prices went through the roof at +49.6%. That raises the obvious question, “What is happening in the Pet Industry?”

In this report we will attempt to answer that question? The simple answer is that prices for Total Pet Products & Services were 4.1% higher in December 2021 than in December 2020. That’s high, but still considerably better than the overall CPI increase. However, as usual, the answer is considerably more complex. We will look at the numbers in greater detail, including:

  • Tracking the monthly changes in prices from December 2019 to December 2021
  • Comparing the annual inflation rate for 2019 through 2021
  • Comparing the December 2021 numbers to both 2020 and 2019

We will do this for Total Pet and all industry segments. We can now do this for all segments because on 2/11 the US BLS started reporting the CPI for Pet Services again. They had discontinued it at the start of 2021 because of problems caused by COVID. Upon learning of the discontinuation, we made the case for reversing this policy. We used their consumer spending data to craft a rationale to demonstrate the importance of the Pet Industry to U.S. Retail and the strong growth of the Services segment in recent years. We also pointed out the importance of Pets to U.S. families – 2/3 of U.S. H/Hs have a pet, twice as many as have a child under 18. They agreed with us and not only began publishing again but filled in all the missing monthly data for 2021. With that being said, let’s get started.

In our first graph we will track the monthly change in prices from December 2019 to December 2021. This is not designed to impart specific data, but rather to give you a visual image of the flow of pricing from the beginning of the pandemic through the retail recovery that the market experienced in 2021. You can see the similarities and differences in patterns between segments and compare them to the overall U.S. CPI. The end numbers, compared to December 2019 and some other key waypoints, like December 2021 are included.

You immediately see a distinct difference in patterns between the 2 Services segments and the 2 Products segments. While there were some dips and differences, Veterinary and Services prices generally inflated during the whole 2-year period with an accelerated rate in 2021, a pattern similar to the overall CPI. Food and Supplies were generally deflated below December 2019 prices until mid-year 2021 when they turned slowly up. Here are some things to note:

  • U.S. CPI – The inflation rate was low through 2020. It turned up in January and continued to grow steadily in 2021. 80+% of the overall 8.5% 2 year increase occurred in 2021.
  • Pet Food – In April 2020 prices fell below December 2019. They stayed deflated until September 2021 when they turned up, with a sharp increase in December.
  • Pet Supplies – First remember that Supplies prices were high in December 2019 due to the added tariffs implemented in late 2018. They had a “deflated” roller coaster ride until mid-2021 when they returned to December 2019 prices and essentially stayed there.
  • Pet Services – A normal inflation rate is about 2+%. Despite or maybe because of closures, price increased at a lower rate in 2020. In 2021 consumer demand increased but there were probably fewer options. Prices increased strongly in 2021 with the biggest lift coming in the Spring.
  • Veterinary – Inflation has always been something that you can count on in Veterinary Services. Prices started moving up at the start of the pandemic and grew consistently through the 2021 recovery. A price spike in December allowed them to edge out the overall CPI and win the top spot in inflation at +8.6%.
  • Total Pet – You can see that the blending of the segment patterns make the Pet Industry look very price calm compared to the overall market. Inflation was basically nonexistent in 2020 but grew slowly and steadily in 2021.

We’ve seen the overall CPI patterns by month over 2 years. Now, let’s turn our attention to the annual CPI. We will use pre-COVID 2019 as our primary base year and we’ll add in Human Food for comparison. We will show these CPI changes:

  • 2018>19
  • 2019>20
  • 2020>21
  • 2019>21
  • Avg Chge 19>21

The 2 Pet Services segments are driving recent inflation in the Pet Industry. This is usually the norm. Prior to the pandemic Pet Food & Supplies were going through an unusual period of inflation. In Pet Food the FDA, warning was a factor and Supplies were suffering from Tariffs. The Services Segment is the closest match to the overall CPI pattern.

  • U.S. CPI – Inflation slowed to 1.2% in 2020 due to the pandemic, then the rate nearly quadrupled to 4.7% in 2021. The average rate from 2019>2021 was 3.0%, about 50+% higher than a normal year.
  • Pet Food – In 2020, prices basically stayed at the elevated 2019 level. They turned up in 2021 but inflation stayed below 1%, which generally would have little to no impact on spending.
  • Human Food at Home – You see the pandemic impact here. The 2020 inflation rate of 3.5% was 4 times that of pre-COVID levels, probably due to shortages. The rate stayed the same in 2021, showing that problems weren’t fixed.
  • Pet Supplies – As we said, prices were at an abnormally high level prior to the pandemic. This discretionary, largely commoditized segment is impacted by pricing. Despite the 2020 drop, sales fell as consumers focused on Pet needs. Inflation returned in 2021 and prices were near 2019. We’ll see if the wants/needs of Pet Parents will overcome this.
  • Pet Services– 2020 inflation was near normal, but the segment was most affected by closures. By 2021, outlets were open but fewer options drove prices up at twice the normal rate. The $ will likely grow because there is still a need.
  • Veterinary – This pet segment traditionally has the highest inflation rate. In recent years, it has caused Pet Parents to reduce the frequency of visits. Much of the growth has come from price increases. The pandemic had little impact on inflation. Inflation slowed in 2020 but then a grew slightly in 2021. The rate stayed about 4.0%. The segment did benefit from the pandemic. Pet Parents focused on needs. They spent more at the Vet and visited 1.8% more often.
  • Total Pet – The deflation that happened in the Product segments offset the inflation in the Services segments, keeping inflation below pre-pandemic 2018>19 levels and in virtually all measurements vs the overall CPI.

Next, we’ll turn our attention to the headlines, which largely focus on the inflation rate from December 2020 to December 2021. We’re going to look a little deeper to see how the recent numbers compare to the past, including:

  • 2018>2019
  • 2019>2020
  • 2020>2021
  • 2019>2021

One thing is certain. The inflation rate from December 2020 was huge for every group in the chart, providing most, and in some cases, all of the price lift since pre-pandemic 2019.

  • U.S. CPI– The price surge was huge – more than 3 times the lift from 2018>19 and 5 times the lift from 2019 to 2020.
  • Pet Food – Although the 20>21 lift was less than pre-pandemic 2018>19, it was a complete reversal from the drop that occurred in 2020.
  • Food at Home – Decembers in 2020 and 2021 have been bad news for grocery prices. The rate from 2019>2020 was spectacularly high at 3.9% but 2021 saw this grow to 6.5%, a 67% increase. In 2 years, prices are up 10.7%.
  • Pet Supplies – Talk about a flip flop. The increase in 2021 essentially wiped out the drop in 2020 – Net: no gain/loss.
  • Pet Services – Services prices increased from 2019>2020 but at a slower than normal rate. From 2020>2021 the inflation rate was 5 times higher than the previous year and fueled more than ¾ of the 8.1% increase since 2019.
  • Veterinary – Once again the increase rate slowed a little in 2020, then returned to normal in 2021.
  • Total Pet – The 2021 increase in all segments pushed Total Pet inflation above the 2018>19 rate and was responsible for 91% of the 4.5% lift from 2019.

That wraps it up for this Petflation Update. Price matters to everyone. Combined with quality, it defines Value, which is the top driver in consumer spending behavior. Inflation/deflation can discourage/encourage spending, especially in the more discretionary categories, like Pet Supplies. Overall, pricing in the Total Pet Industry appears to be faring reasonably well. 20/21 data for Total Pet is lower than the data for the total U.S. CPI in virtually all inflation measurements. However, as I have always said, look beneath the surface to see what is truly happening. When we do that, we see pricing trends that basically divide the segments into 2 groups – Services and Products. Prices in the Services group, Non-Vet and Veterinary have strongly inflated, especially in 2021. In the Products group – Food and Supplies, prices were high before the pandemic. The result was that prices stayed near or below the 2019 level until mid-year 2021. Then they turned up but not as much as in the Services Group. The Product group accounts for over 60% of Industry $ so their trend was very influential in keeping Total Pet inflation at a more reasonable level. The media was right about 1 thing. December was a terrible month for inflation. Prices in every Pet segment turned sharply up.

Of note, inflation continued in all segments in January 2022 with Supplies prices passing their previous record high set in September 2009. We’ll see what the rest of 2022 brings.

2020 U.S. Pet Spending by Generation – Boomers’ Spending Surges

In 2020 Americans spent $83.74B on our companion animals, 1.04% of $8.05 Trillion in total expenditures. Pet Spending was up $5.31B (+6.8%), a big change from the spending dip in 2019. There was 1 overriding factor affecting all spending, including pet in 2020 – the pandemic. Consumers focused on the necessary segments – Food and Veterinary, while the discretionary segments – Supplies and Services, suffered. Out of fear of shortages, Pet Parents binge bought Food early in the pandemic. On the negative side, closures caused Services to have a radical reduction in frequency.

In this report we will look at how the pandemic affected the Pet Spending for today’s most “in demand” demographic measurement – by Generation. In 2020, although Gen Z $ are often bundled with Millennials for comparison, we can now compare their annual spending vs the previous year. Using data from the US BLS Consumer Expenditure Survey we’ll look for answers.

We’ll start by defining the generations and looking at their share of U.S. Consumer Units (CUs are basically Households)

GENERATIONS DEFINED

Gen Z: Born after 1996

In 2020, Age under 24

Millennials: Born 1981 to 1996

In 2020, Age 24 to 39

Gen X: Born 1965 to 1980

In 2020, Age 40 to 55

Baby Boomers: Born 1946 to 1964

In 2020 Age 56 to 74

Silent/Greatest: Born before 1946

In 2020, Age 75+

  • Baby Boomers still have the largest number of CU’s at 43.3M and 33.0% of the total. They had a slight increase in 2020 but generally they have been losing ground. In fact, they have 1.8M fewer CU’s than in 2016.
  • The Oldest Generations will continue to lose CUs primarily due to death or movement to permanent care facilities.
  • Gen X has the second most CUs and gained ground in 2020.
  • Millennials have the largest number of individuals, but they rank only third in the number of CU’s.
  • Gen Z lost CUs as did Millennials. The pandemic caused many younger folks to move back home or group together.

Now let’s look at some key CU Characteristics

One significant change was the increase in homeownership. This was primarily driven by the Gen Xers and Millennials. Gen Xers still have the biggest CUs but now Millennials have the most children <18 per CU.

  • CU Size – CUs with 2+ people account for 70.2% of all U.S. CUs (up from 69.8% in 2019) and 80.3% of pet $ (up from 78.2% primarily due to a huge spending lift by 4+ person CUs). Millennials are actively building their H/Hs. However, CU size, with all the related responsibilities, still peaks with the Gen Xers and then starts dropping. The Boomers are the last group with 2+ CUs but that will end soon. Gen Z joined the 2+ group for the 1st time in 2020.
  • # Children < 18 – 27.7% of U.S. CU’s have children and they generate 38.4% of Pet Spending. CUs with children were the driving force in the increase in Pet spending. Married Couples with children spent $8.77B more and even single parents increased pet spending by $0.77B. All other groups spent less. The biggest decrease came from Married Couples with no children – down -$2.22B. “Unmarried Adults only” CUs, of 2 or more people were next to last with a decrease of -$1.43B. Singles had the biggest increase in 2019. In 2020, they spent -$0.55B less on their pets. Overall, there was no change in the # of children per CU in 2019 but there were changes within groups. Millennials took over the top spot while the number of children per CU for both Gen X and Boomers decreased. We should note that CU’s with the oldest child over 18 had the biggest Pet $ increase, +$8.77B. This group is often Baby Boomers.
  • # Earners – Pet spending is usually tied to the number of earners in a CU. In 2020, 2 person, 2+ earner CUs still spent the most on their pets and had the biggest increase, +$5B (+11.8%). Generally, these are the younger generations, but the 55 to 64 year old Baby Boomers are also an important part of this group.
  • Homeownership – Owning and controlling your own space has always been a major factor in increased Pet Ownership and spending. Driven by the younger groups, homeownership increased to 65.81% from 63.74%. However, the pet spending pattern was even more defined. Homeowners with no Mtges spent +$8.0B more on their pets. Homeowners with mortgages spent -$2.1B less on their pets while the Pet $ for Renters fell -$0.6B. We should note that the number of Baby Boomer Homeowners w/no Mtge grew from 38% to 41%. The homeowners share of Total Pet Spending grew from 81.4% to 83.3% due to those without a mortgage and was likely driven by Boomers.
    • As expected, Gen Z are the most common renters in society. Homeownership by Millennials has moved up to 47% but it is still only 71% of the national average.
    • Gen Xers have been above the national avg since 2018 and Homeownership continues to increase with age.

Next, we’ll compare the Generations to the National Avg.:

In Income, Total CU Spending, Total Pet Spending and the Pet Share of Total CU Spending

CU National Avg: Income – $84,352; Total CU Spending – $61,282; Total Pet Spending – $637.78; Pet Share – 1.04%

  • Income – The Gen Xers are still at the top and their lead grew. The Boomers income plunged from 112% to 93% and they fell to 3rd place. Millennials’ income moved up to beat the national average and they are now #2. Income drops radically in the oldest group as they retire, and Gen Z is just getting started.
  • Total Spending – The Gen Xers make the most and spend the most but it’s not out of line with their income. Millennials increased their spending so that it now equal to the national average. Like their income, Boomers’ spending fell below the national average. Thanks to a big lift in income in relation to spending, the oldest group and Gen Z are no longer deficit spending in relation to their after tax income. With strong increases in both Income and spending, the retail importance of Millennials is growing.
  • Pet Spending – Again only 2 groups exceed the national average, but Boomers replaced Gen X in the top spot. Millennials are still 3rd but are 15% below Gen X and 30% below Boomers. The oldest and youngest groups trail.
  • Pet Spending Share of Total Spending – The national number grew from 0.94% to 1.04%. The growth was driven by a 0.09% increase from Millennials and a huge 0.31% lift from Boomers. All other groups fell and Boomers are still the only group to spend more than 1% of their total expenditures on their pets. In 2018 every group spent at least 0.92% of their total CU spending on their pets. In 2019 this fell to 0.82% and in 2020 it was down to 0.70%.

Now, let’s look at Total Pet Spending by Generation in terms of market share as well as the actual annual $ spent for 2015 through 2020. The 2020 numbers are boxed in red (decrease) or green (increase) to note the change from 2019.

  • Boomers are still the biggest force in Pet Spending and their share is again over 40% after falling to 36.6% in 2019.
  • There are definite age-related long term patterns which are readily apparent in the bar graph. Spending in the oldest group is low and slowly falling. In contrast, the youngest group (combined Millennials & Gen Z) is the only one showing consistent year after year growth. Gen X had also been growing every year… until 2020. The Boomers have the biggest share but are on a rollercoaster ride because they are the most likely group to have a strong reaction to trends, especially in this era of super premium foods. With their tremendous buying power, this can cause major spending swings impacting the whole industry. In 2020 this was very apparent as they were the primary group that panic bought Pet Food out of fear of possible shortages due to the pandemic.
  • In 2020, every other generation was up or down. Silent/Greatest: -$1.12B. Boomers: +$6.88B. Gen X: -$1.79B. Millennials: +$2.24B. Gen Z: -$0.14B.
  • Boomers – Ave CU spent $800.78 (+$131.53); 2020 Total Pet spending = $34.85B, Up $6.11B (+21.3%)
    • 2015>2020: Up $2.70B; They got back on the roller coaster as spending turned up and is now +8.4% from 2015.
  • Gen X – Ave CU spent $665.22 (-$61.83); 2020 Total Pet Spending = $23.96B, Down $1.79B (-7.0%)
    • 2015>2020: Up $5.70B; Their annual Pet spending growth since 2015 had been strong and consistent until 2020. They fell to #2 in Ave CU Pet spending and their $ increase since 2015 fell from $7.49B in 2019 to $5.70 in 2020.
  • Millennials + Gen Z – Ave CU spent $533.80 (+$62.38); 2020 Total Pet Spending = $19.60B, Up $2.10B (+12.0%)
    • 2015>2020: Up $9.87B; As the income and overall spending of Millennials grows, their pet spending has also grown every year since 2015. The “youngsters” have the biggest increase in $ of any group, $9.87B, +101%.
    • Millennials Only – Ave CU spent $565.07 (+$71.46); 2020 Total Pet Spending= $18.67B, Up $2.24B (+13.7%)
    • Gen Z Only – Ave CU spent $254.68 (-$25.41); 2020 Total Pet Spending= $0.93B, Down $0.14 (-13.4%)
  • Silent + Greatest – Ave CU spent $354.20 (-$34.65); 2020 Total Pet Spending = $5.34B, Down $1.12B (-17.3%)
    • 2015>2020: Down $2.27B; They still spend a relatively high amount on their pets, but age is becoming a factor.

Boomers returned to the top spot in Ave CU Total Pet Spending. Driven by Millennials, the youngest pet parents are still consistently increasing their annual spending which bodes well for the future.

Let’s look at the individual segments. First, Pet Food…

  • The trendy nature of Pet Food is more pronounced for the Boomers. In the older generations, pet ownership is fading. The younger groups have generally had more consistent growth but Gen X spending fell sharply in 2020.
  • Since 2014, Millennials’ have led the way in food trends, and they are the only group with an annual increase every year since 2015. The panic food buying in 2020 was more of an emotional reaction than a trend.
  • Boomers – Ave CU spent $442.06 (+$147.55); 2020 Pet Food spending = $19.31, Up $6.75B (+53.7%)
    • 2015>2020: Up $3.74BBig reactions to every trend, from super premium to FDA warnings to fear of shortages.
  • Gen X –Ave CU spent$230.36 (-$53.82); 2020 Pet Food spending =$8.29B,Down $1.73B (-17.3%)
    • 2015>2020: Up $1.03B They reacted to the FDA warning by further upgrading their food. No pandemic panic buying for them. They value shopped.
  • Millennials + Gen Z – Ave CU spent $191.02 (+$29.17); 2020 Pet Food Spending = $7.07B, Up $0.94B (+15.4%)
    • 2015>2020: Up $3.43B They are the only group with increased spending every year since 2015. Their income is growing as is a commitment to their pets. They pioneer food upgrades and they too bought more just to be safe.
    • Millennials Only – Ave CU spent $206.94 (+$35.39); 2020 Pet Food spending = $6.86B, Up $1.07B (+18.6%)
    • Gen Z Only – Ave CU spent $52.97 (-$29.04); 2019 Pet Food spending = $0.20B, Down $0.13B (-39.7%)
  • Silent/Greatest – Ave CU spent $147.57 (-$5.12); 2020 Pet Food spending = $2.17B, Down $0.31B (-12.5%)
    • 2015>2020: Down $0.98B; They are committed to their pets, but COVID hit them hard and their CU #s are fading.

Pet Food Spending is driven by trends – new Super Premium Foods, FDA warnings and even fear of shortages due to COVID. Millennials lead the way in thoughtful changes, but Boomers lead in emotion. Now, on to Supplies Spending.

  • Gen X took over the top spot in both CU spending and share as Boomer spending plummeted again. The younger groups dominate this segment as Gen Xers and Millennials/Gen Z together account for 66% of Supplies spending.
  • Gen X – Ave CU spent $152.47 (-$1.70); 2020 Pet Supplies spending = $5.49B, Up $0.02B (+0.4%)
    • 2015>2020: Up $0.92B; Gen Xers are again the leader in CU spending. They were affected by the new tariffs in 2019 but essentially held their ground in 2020 so that they now have the biggest share of Supplies $.
  • Baby Boomers – Ave CU spent $101.85 (-$34.96); 2020 Pet Supplies spending = $4.41B, Down $1.49B (-25.3%)
    • 2015>2020: Down $1.53B; Their 2019 spending was hit hard by tariffs. In 2020 they spent their Pet $ on Food!
  • Millennials + Gen Z – Ave CU spent $123.76 (+$5.59); 2020 Pet Supplies spending = $4.52B, Up $0.18B (+4.2%)
    • 2015>2020: Up $1.29B; Supplies are still Millennials’ best performing segment. They were the least impacted by the tariffs in 2019 and were the only group with any real growth in 2020.
    • Millennials Only – Ave CU spent $125.05 (+$6.41); 2020 Pet Supplies spending = $4.12B, Up $0.20B (+5.2%)
    • Gen Z Only – Ave CU spent $111.92 (-$2.09); 2020 Pet Supplies spending = $0.40B, Down $0.02B (-4.8%)
  • Silent + Greatest – Ave CU spent $47.75 (-$17.38); 2020 Pet Supplies spending = $0.73B, Down $0.37B (-33.3%)
    • 2015>2020: Down $0.59B; This $ conscious group was hit hard first by tariffs then by the pandemic.

In 2016 most Consumers value shopped for super premium food and spent some of their savings on Supplies. Supply prices dropped in 2017 and everyone under 72 spent more! Late 2018 saw added tariffs but only Boomers dialed back their purchases. In 2019 the sharply rising prices drove spending down in all groups. In 2020 Millennials and Gen X spent a little more while the older groups spent a lot less.

Next, we’ll turn our attention to the Service Segments. First, Non-Veterinary Pet Services

  • Only Gen Z spent more. Gen X is still #1 in both CU spending and share. Gen X/Millennial/Gen Z share = 62.1%
  • Gen X – Ave CU spent $69.98 (-$15.62); 2020 Pet Services spending = $2.52B, Down $0.52B (-17.0%)
    • 2015>2020: Up $0.40B; As the #1 group, they were strongly impacted by the COVID related drop in frequency.
  • Baby Boomers – Ave CU spent $50.60 (-$13.90); 2020 Pet Services spending = $2.19B, Down $0.59B (-21.3%)
    • 2015>2020: Down $0.28B; Boomers had the biggest drop in $ as they focused on the needed segments.
  • Millennials + Gen Z – Ave CU spent $48.09 (-$2.34); 2020 Pet Services spending = $1.76B, Down $0.09B (-5.1%)
    • 2015>2020: Up $0.74B; They had the smallest decrease of any group and the biggest $ increase since 2015. In 2020 Gen Z actually got into the Services game for the first time.
    • Millennials Only – Ave CU spent $49.52 (-$4.82); 2020 Pet Services spending = $1.63B, Down $0.16 (-9.1%)
    • Gen Z – Ave CU spent $34.92 (+$19.45); 2020 Pet Services spending = $0.13B, Up $0.07B (+118.8%)
  • Silent + Greatest – Ave CU spent $27.58 (-$28.80); 2020 Pet Services spending = $0.42B, Down $0.53B (-55.5%)
    • 2015>2020: Down $0.22B; They definitely have the need but were the group most impacted by the pandemic.

This segment had slow annual growth until 2017 which saw a small drop in spending due to an extremely competitive environment. Consumers increased frequency but paid less. In 2018, the increased number of outlets really hit home, especially for the younger groups and spending exploded. 2019 brought another small decrease as Gen Xers and Millennials looked for and found a better deal. 2020 brought pandemic restrictions and closures. Frequency and $ fell.

Now, Veterinary Services

  • Boomers are still the biggest spenders in this segment, but again they only lead Gen Xers in $ because of more CUs.
  • The younger groups have a consistently growing commitment to this Pet Parenting responsibility. The combined Veterinary spending of Millennials/Gen Z and Gen Xers has increased $7.74B (+126%) since 2015.
  • Boomers – Ave CU spent $206.27 (+$32.84); 2020 Veterinary spending= $8.93B, Up $1.45B (+19.4%)
    • 2015>2020: Up $0.76B; In 2020, Boomers focused on needed segments – Food & Veterinary. They had the biggest increase in CU spending and in Veterinary $, +$1.45B
  • Gen X – Ave CU spent $212.41 (+$9.31); 2020 Veterinary spending= $7.65B, Up $0.44B (+6.1%)
    • 2015>2020: Up $3.34B; In 2016 their Veterinary spending exceeded the national CU Average. In 2018, they took over the top spot in CU spending. They are still #1 per CU and #2 in share as the Boomers had a bigger lift.
  • Millennials + Gen Z– Ave CU spent $170.94 (+$29.96); 2020 Veterinary Spending $6.25B, Up $1.07B (+20.7%)
    • 2015>2020: Up $4.40B; Their CU spending is up 165% since 2015. Veterinary has become a much bigger priority.
    • Millennials Only – Ave CU spent $183.56 (+$34.48); 2020 Veterinary spending = $6.05B, Up $1.13B (+22.9%)
    • Gen Z Only – Ave CU spent $54.87 (-$13.73); 2020 Veterinary spending = $0.20B, Down $0.06B (-22.5%)
  • Silent + Greatest – Ave CU spent $131.30 (+$16.65); 2020 Veterinary spending $2.02B, Up $0.08B (+4.2%)
    • 2015>2020: Down $0.76B; Their pets’ health is still a priority. Their CU increase only trails Millennials & Boomers.

Gen Xers and Millennials have consistently increased their commitment to Veterinary Services. In 2015, their share of Veterinary Spending was 36%. It is now 56% – a 56% increase. This is a big, fundamental change in spending behavior.

One last chart to compare the share of spending to the share of total CU’s to see who is “earning their share”

  • Baby Boomers Performance – Total: 126.1%; Food: 158.8%; Supplies: 88.2 %; Services: 96.3%; Veterinary: 108.9%
    • Boomers led the way in building the industry and are still the “top dogs” in $. They earn their share and are still the spending leader in Total Pet and the “needed” segments – Food & Veterinary. They are also the most emotional Pet Parents, so their spending is subject to radical swings like 2020’s panic, binge buying of Pet Food. They should hold the lead in Pet $ for several more years and be a major force for many more, but the Gen Xers and then Millennials are preparing to take their turn at the top.
  • Gen X Performance – Total: 104.2%; Food: 82.0%; Supplies: 132.0%; Services: 133.2%; Veterinary: 112.2%
    • After 2 years at the top Gen Xers fell to 2nd in performance. They earned their share in Total Pet and all industry segments but Food. Until 2020 they had increased their Total Pet Spending every year since 2015. Except for this year’s big dip in Food, their spending has become more balanced and their performance has improved. Gen Xers range in age from 40 to 55 so they are just entering the peak earning years. Expect their commitment and pet spending to continue to grow.
  • Millennials Performance – Total: 88.8%; Food: 74.2%; Supplies: 108.2%; Services: 94.3%; Veterinary: 96.9%
    • Millennials are now the only group to have increased their pet spending every year since 2015. Their spending is more evenly balanced, and performance has improved but their future as the Pet Parenting spending leaders is still a long way off. Their income, home ownership and pet spending are all increasing. They are educated and well connected. Indications are that they may lead the way in adopting new trends, especially in food. Their progress is good news, but in reality, their leadership is still more than a decade away.
  • Silent/Greatest Performance – Total: 54.6%; Food: 50.4%; Supplies: 41.3%; Services: 52.5%; Veterinary: 69.3%
    • Pet Parenting is more challenging in old age, but they remain committed. 0.86% of their total spending is on pets.
  • Gen Z Performance – Total: 40.5%; Food: 20.1%; Supplies: 96.9%; Services: 66.5%; Veterinary: 29.0%
    • They are just beginning so the numbers are low and progress is slow. However, they have “figured out” Supplies.

Baby Boomers are still the Pet $ leaders, but Gen Xers, followed by Millennials are ultimately the future of the industry. Both groups seem ready, willing and able to take their turn at the top. As these groups have risen, Pet Spending has become more balanced across the generations. This bodes well for the continued strong growth of the industry.