2020 U.S. VETERINARY SERVICES SPENDING $24.85B…UP ↑$3.05B

Veterinary Services is the 2nd largest segment in the Pet Industry. High inflation, 3.5+%, caused a reduction in Veterinary visits from 2014>2016. In 2017 inflation slowed (+2.2%) and consumers responded. In 2018 prices turned up (+2.6%) and spending plateaued. In 2019 inflation was +4.1% and Veterinary Spending grew +2.7% so “real” spending was actually down -1.4%. In 2020, COVID drove spending up significantly in “needed” categories, like Veterinary. Spending reached  $24.85B, up $3.05B (+14.0%). Inflation was 3.7% so 74% of the growth was real. In this report, we’ll take a closer look at the demographics behind the 2020 numbers. (Note: All 2020 numbers in this report come from or are calculated by using data from the US BLS Consumer Expenditure Interview Survey, rather than their Diary report. The low frequency of Veterinary Visits is still generating an exceptionally high variation on the data collected by the Diary method. Interview seems to be a more logical and accurate way to track Veterinary Service Expenditures.)

Let’s get started. Veterinary Spending per CU in 2020 was $189.35, up 14.8% from $164.88 in 2019. (Note: A 2020 Pet CU (67%) Spent $282.61) More specifically, the increase in Veterinary spending came as a result of:

  • 0.8% less CU’s
  • Spending 12.8% more $
  • …1.8% more often

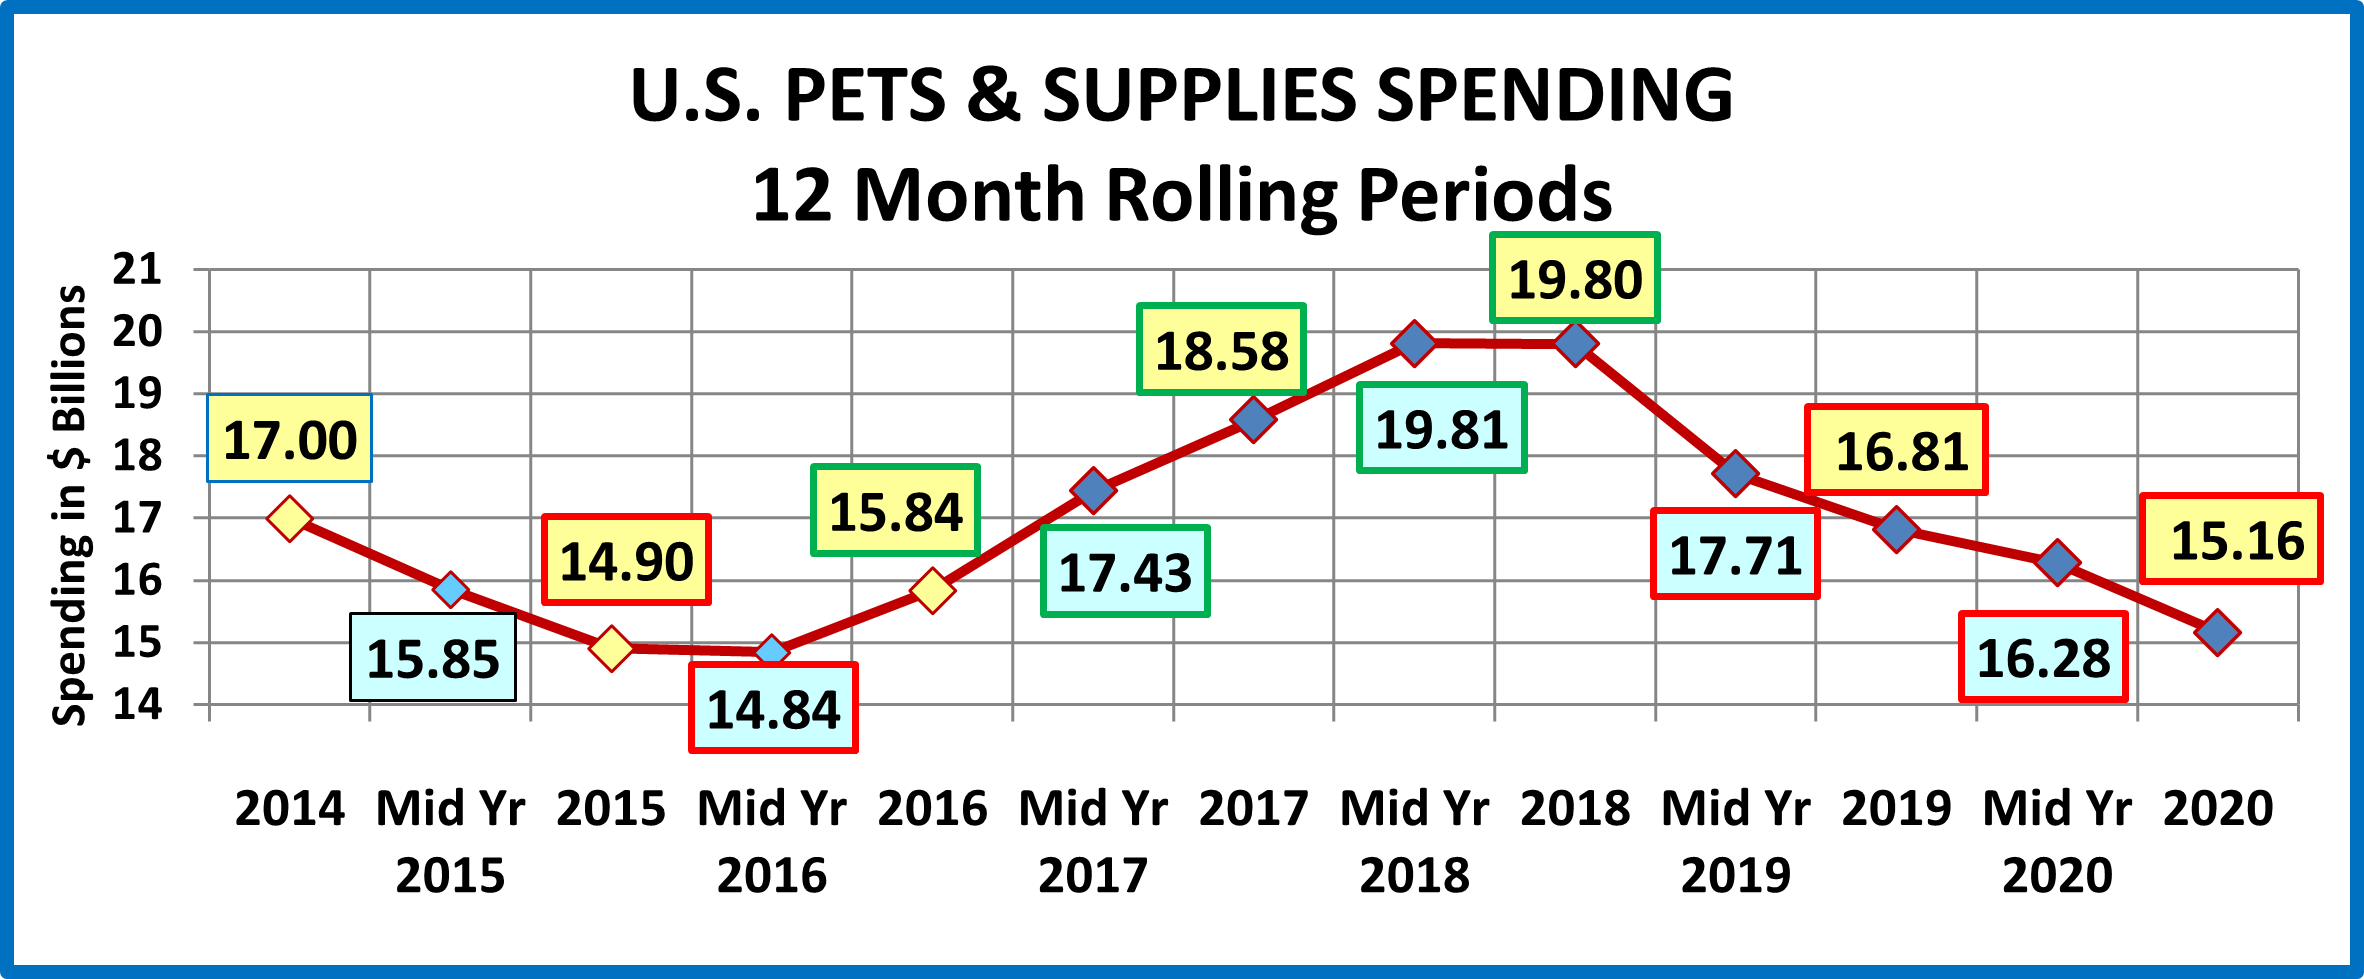
We’ll take a closer look. But first, the chart below gives an overview of recent Veterinary Spending.

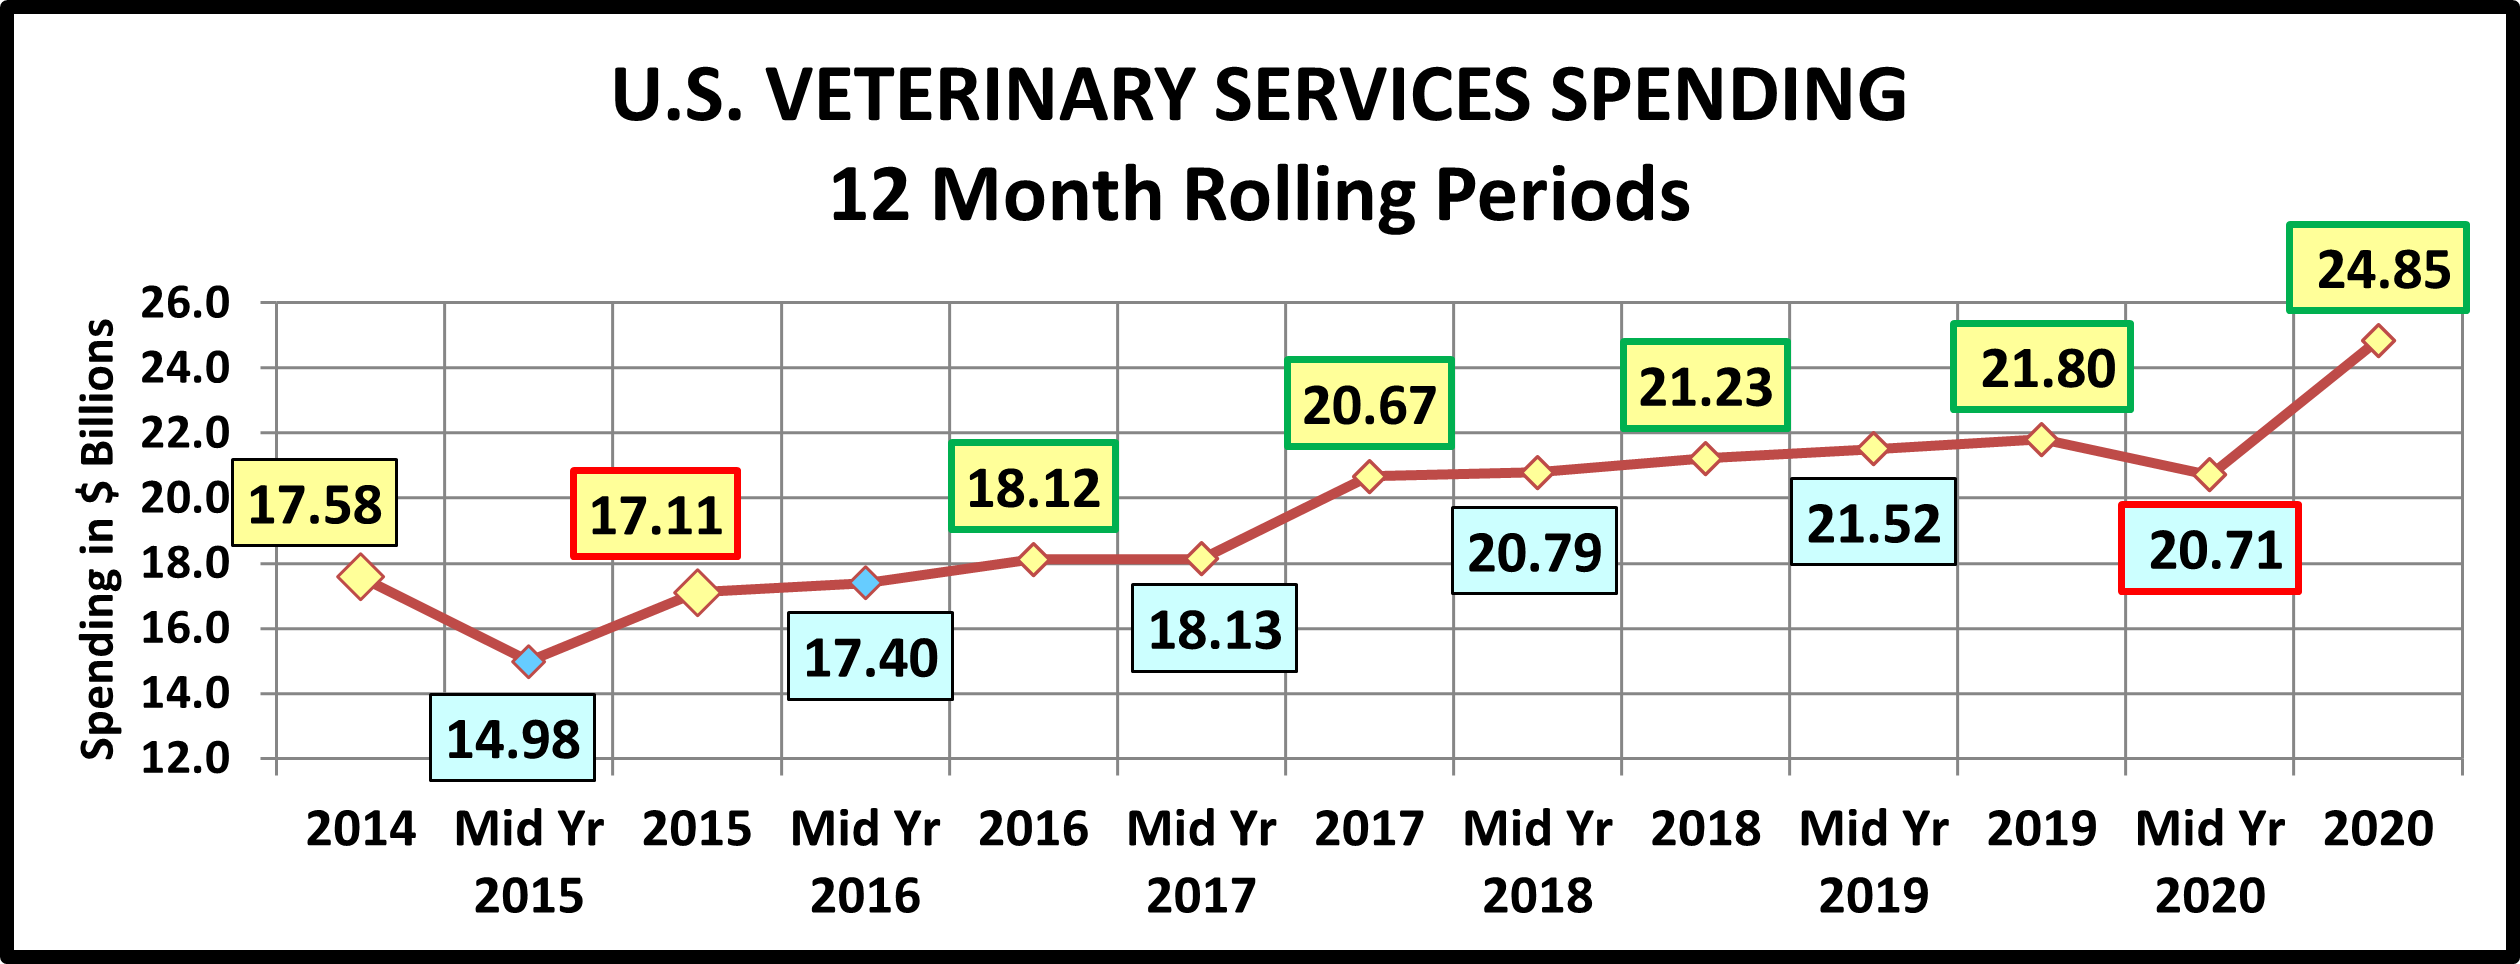
The big spending drop in the first half of 2015 coincided with the upgrade to Super Premium Foods – Trading $. Then consumers began value shopping for Premium Foods and the savings freed up $ for Veterinary Services. Spending began to climb until it flattened out at the beginning of 2017. In 2017, Veterinary inflation slowed markedly in the second half and spending took off. In 2018 prices turned up again and consumers essentially held their ground through 2019. The initial reaction to COVID in 2020 was a drop in spending but the “need focused” consumers then drove a huge increase.

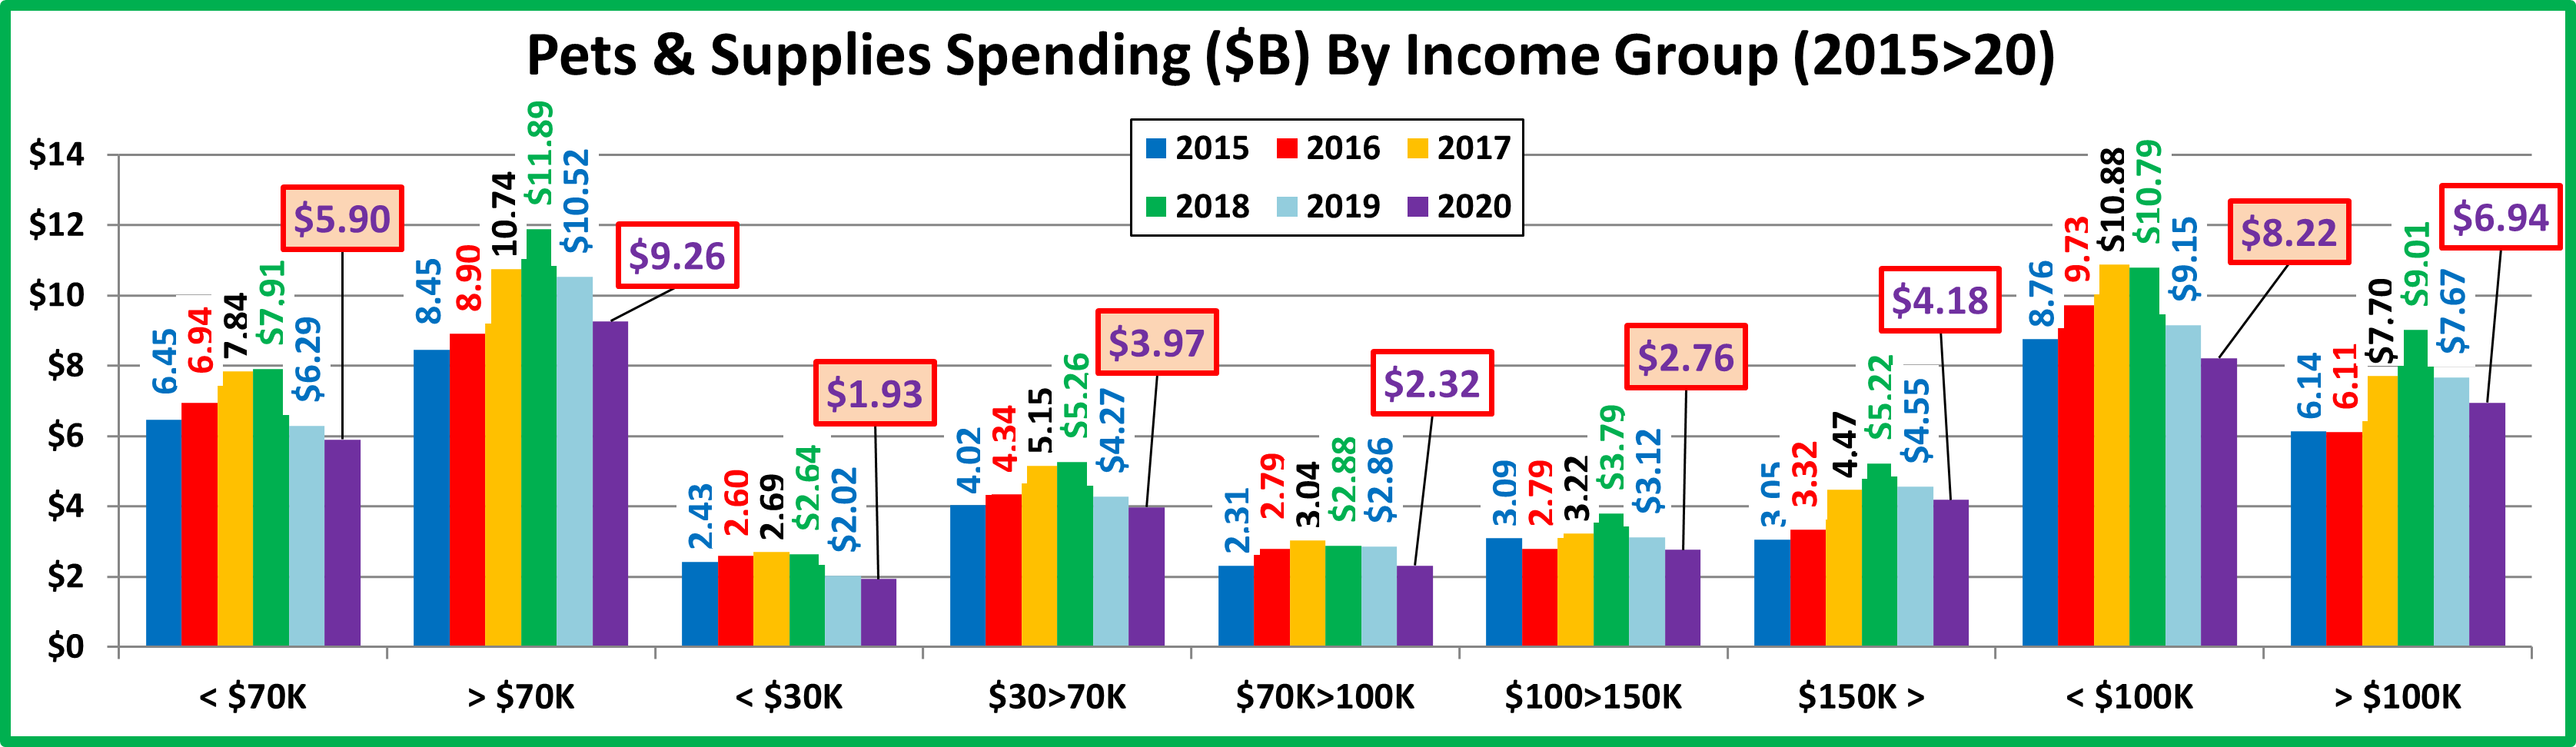
Now, let’s look at Veterinary spending by some specific demographics. First, here is a chart by Income Group

Although not as much as Services and now Food, Veterinary Spending is driven by income. The only group to spend less than 2015 was <$30K. 2020 spending was mixed. The only drop came from the $70>100K income group and the increase was almost equally divided between <$70K & $100K>. The 50/50 break point in $ was $96K, down from $97K in 2019.

National: $189.35 per CU (+14.8%) – $24.85B – Up $3.05B (+14.0%)

  • Over $150K (14.1% of CUs) – $375.65/CU (+2.9%) $6.96B, Up $0.56B (+8.7%) This highest income group is the biggest Veterinary Spender as 14.1% of CUs generated 28% of 2020 $. Their $ grew but slower than the overall rate.
  • $100>150K (14.4% of CUs) – $267.61/CU (+24.8%) $5.04B, Up $1.14B (+29.1%) Spending by this middle/upper income group slowed in 2019 as prices turned up, but it took off in 2020 as they reacted strongly to their pet needs.
  • $70K>100K (15.0% of CUs) – $190.23/CU (-12.4%) $3.74B, Down $0.41B (-9.8%) Their spending has steadily grown since 2016. That changed in 2020 as monetary pressures from the pandemic caused them to spend less.
  • $30K>70K (31.1% of CUs) – $149.72/CU (+25.4%) $6.11B, Up $1.14B (+22.9%) This is the 2nd largest group in Veterinary $ and their spending pattern is remarkably similar to the big spending $150K+ group. Vet $ were flat in 2019 but grew strongly in 2020 as they found the money to fulfill their Veterinary needs.
  • Under $30K (25.4% of CUs) $89.67/CU (+35.0%) $2.99B, Up $0.62B (+26.2%) This group is very price sensitive. After an increase in all segments in 2017, they dialed back their pet spending on Food and Veterinary Services in 2018. They began to recover in 2019 and spending growth continued in 2020. They are now just 6% below their 2015 $.

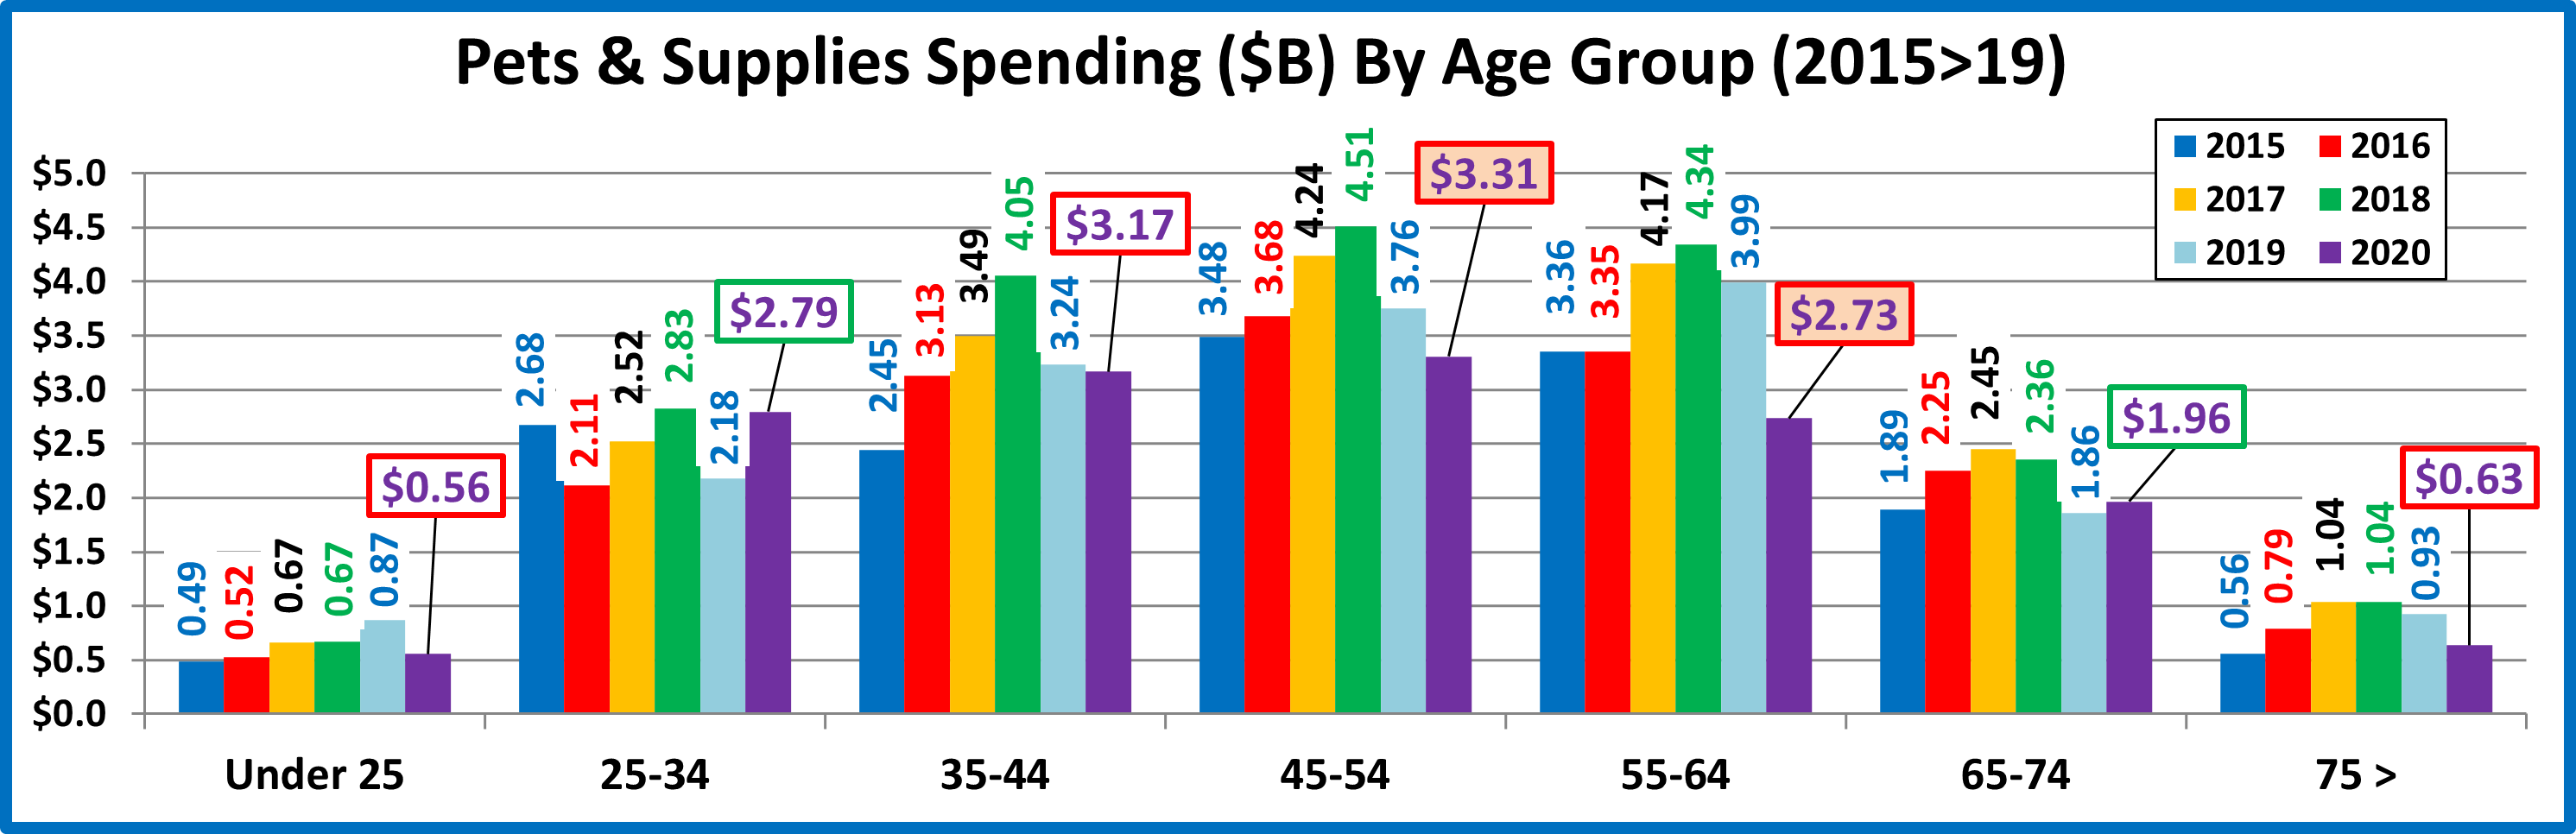
Now, here is Veterinary Spending by Age Group

Every group but 35>44 and <25 spent more. The lift came more from increased $ spent rather than visit frequency.

National: $189.35 per CU (+14.8%) – $24.85B – Up $3.05B (+14.0%)

  • <25 (3.8% of CUs) – $65.35/CU (-29.7%) $0.33B – Down $0.35B (-51.7%) The biggest factor in the big spending drop by this youngest group was a 2.2M, -31.2% decrease in CUs. 31.2% fewer CUs spent 32.0% less $ …3.3% more often.
  • 25>34 (16.0% of CUs) – $178.05/CU (+43.9%) – $3.74B – Up $1.11B (+42.2%) The commitment of these Millennials to their pets is growing. Their Veterinary $ ticked up in 2019 after being stable for 2 years. In 2020 the $ took off with a 43.9% increase in CU spending. 1.2% fewer CUs spent 37.5% more $ …4.6% more often.
  • 35>44 (17.0% of CUs) – $200.58/CU (-11.5%) – $4.47B – Down $0.59B (-11.6%) In 2019, these mostly Gen Xers radically increased their Veterinary spending and they moved to the top in Veterinary $. In 2020 they increased visit frequency but cut back -20% on $. They fell to 3rd 0.1% less CUs spent 20.5% less $ …11.4% more often
  • 45>54 (17.2% of CUs) – $221.60/CU (+18.7%) – $5.01B – Up $0.85B (+20.4%) This group has the highest income, but value is important. In 2017, the slowed inflation caused them to spend significantly more money and more often. In 2018, prices turned up and continued to inflate in 2019. Spending dropped precipitously. They fell from the top spot in Veterinary $ and even below their 2015 numbers. 2020 brought a strong recovery with a 20% increase in $. They spent more $ more often and moved up the ladder to #2. 1.5% more CUs spent 11.7% more $…6.2% more often
  • 55>64 (19.1% of CUs) – $217.17/CU (+17.2%) – $5.45B – Up $0.90B (+19.8%) This group is all Baby Boomers and was the leader in Veterinary Spending prior to 2015. In 2015 they upgraded to Super Premium Food and Vet Spending fell. In 2016 they began to spend more again on Veterinary Services. In 2017, as inflation significantly slowed, they regained the top spot. In 2018 Veterinary prices began to strongly inflate again. Their spending fell and continued down into 2019. In 2020 their frequency fell but they spent a lot more. They’re back on top in Veterinary Spending because 2.2% more CUs spent 25.2% more $ …6.4% less often
  • 65>74 (15.6% of CUs) – $200.22/CU (+22.6%) – $4.09B – Up $0.87B (+27.1%) This group is growing in numbers and very price sensitive. They are Boomers so they are committed to their pets. In 2020 their visit frequency was down due to the pandemic, but they spent 37% more $. 3.7% more CUs spent 37.0% more $ …10.5% less often
  • 75> (11.2% of CUs) – $118.92/CU (+17.0%) – $1.75B – Up $0.25B (+16.7%) This group of oldest Pet Parents has a strong commitment to their pets – in 2015 a $1B increase in Veterinary Spending. In 2016, they upgraded their food. In 2017 they increased spending in Food, Supplies and Services. In 2018, they turned their attention back to Veterinary and in 2019 they had increases in all but Supplies. The pandemic hit them hard, but they still took care of their pets with increased Veterinary spending. 0.2% less CUs spent 14.9% more $…1.8% more often

Now, let’s take a look at some other key demographic “movers” behind the 2020 Veterinary Spending numbers.

Veterinary spending increased by $3.05B (+14.0%) in 2020. Even with a high 3.7% inflation rate, 74% of the growth was real. 2020 had widespread positivity. 82 of 96 demographic segments (85.4%) spent more on Veterinary Services while only 14 segments spent less. In 4 categories all segments spent more. However, there was some turmoil as 8 flipped from first to last or vice versa while 4 segments maintained their position from 2019.

Half of the segments were the “usual” winners and losers. On the winning side were:

  • Mgrs/Professionals
  • Homeowners w/Mtge
  • White, Not Hispanic
  • 2 People
  • Married Couple Only
  • Adv College Degrees.

The “usual” losers were equal in number and included:

  • Singles
  • African Americans
  • Renters
  • No earner Singles
  • <HS Grads
  • Gen Z

That means that there were relatively few surprises:

  • Winners: Center City, 25>34 yrs old
  • Losers: Suburbs, 35>44 yrs old

In our earlier analysis we saw that the increase was widespread across Income and Age groups. Only 1 income group, $70>99K and 2 age groups, <25 and 35>44 spent less. There were 4 categories in which all segments spent more. The nature of these categories illustrates how truly widespread the lift in Veterinary $ was.

  • Race/Ethnic
  • Housing
  • CU sizes
  • Area Type

There had been a strong youth movement in Veterinary Spending from the <45 crowd. That changed in 2020 as the 45> groups were up $2.87B which accounted for 94% of the segment’s increase. We should also note that the 65> group is now the only group with  a spending increase for 3 consecutive years.

Generations still seems to be the most popular demographic measurement and it was almost all good news as Gen Z was the only generation with a decline in Veterinary Spending in 2020. Baby Boomers bounced back to the top spot in Veterinary $ after 2 years of big decreases. Boomers fueled the growth of the Pet Industry and remain the overall biggest pet spenders. In Veterinary $, their spending in 2017 was greater than all of the younger generations combined. In 2020, the younger groups spent 50% more than the Boomers. Because of their sheer numbers, Boomers will remain a force in the industry for years to come. but the “torch” is slowly but surely being passed.

Retail Channel Monthly $ Update – September Final & October Advance

In May 2020, the Retail market began its recovery after hitting bottom in April. The road back has been long and complex and Consumer spending behavior continues to evolve. We have not beaten the virus yet so we will continue to track the ongoing recovery of the retail marketplace with data from two reports provided by the U.S. Census Bureau.

The Reports are the Monthly Retail Sales Report and the Advance Retail Sales Report. Both are derived from sales data gathered from retailers across the U.S. and are published monthly at the same time. The Advance Report has a smaller sample size so it can be published quickly – about 2 weeks after month end. The Monthly Final Report includes data from all respondents, so it takes longer to compile the data – about 6 weeks. Although the sample size for the Advance report is smaller, the results over the years have proven it to be statistically accurate with the final monthly reports. The biggest difference is that the full sample in the Final report allows us to “drill” a little deeper into the retail channels.

We will begin with the Final Retail Report for September and then move to the Advance Report for October. Remember, the retail impact of the pandemic began in March 2020, peaked in April, then recovery started in May. We will compare 2021 to both 2020 and 2019 to document the progress that the retail market has made towards a full recovery.

Both reports include the following:

  • Total Retail, Restaurants, Auto, Gas Stations and Relevant Retail (removing Restaurants, Auto and Gas)
  • Individual Channel Data – This will be more detailed in the “Final” reports and we fill focus on Pet Relevant Channels

The information will be presented in detailed charts to facilitate visual comparison between groups/channels of:

  • Current Month change – % & $ vs previous month
  • Current Month change – % & $ vs same month in 2020 and 2019
  • Current YTD change – % & $ vs 2020 and 2019
  • Monthly and Year To Date $ will also be shown for each group/channel

First, the September Final. Retail hit bottom in April 2020 but began recovery, hitting record $ in December. $ fell in January & February but set a new $ record in March. In April $ fell but rebounded in May to another record high. Sales have slowly declined through September. Here are the major retail groups. (All $ are Actual, Not Seasonally Adjusted)

The final total is $1.7B more than the Advance report projected a month ago. All groups but Relevant Retail were up slightly. The specifics were: Relevant Retail: -$0.3B; Gas Stations: +$1.0B; Auto: +$0.8B: Restaurants: +$0.3B. Sales vs August were down in all groups. As you recall, Total Retail $ales broke $600B for the 1st time in December. Although September $ were slightly below December, they were still the 8th highest of all time. Auto continues to have the strongest recovery with an annual YTD growth rate since 2019 of +11.8%. A spending dip in September is the “norm” in U.S. Retail. It is more important that for the 4th consecutive month, all groups were positive in all other measurements.

Now, let’s see how some Key Pet Relevant channels were doing in September.

  • Overall – 10 of 11 channels were down vs August but all were up vs September 2020 and September 2019. In YTD $, all were up vs 2020 and 10 vs 2019. September was the 9th biggest month in history for Relevant Retail.
  • Building Material Stores – Their amazing lift may finally be slowing. The surge came as a result of pandemic spending patterns developed in 2020. Consumers began focusing on their homes. Their Spring lift has slowed in 2021 but Building and Farm stores are still going strong. Sporting Goods stores have a similar spending pattern. Sales took off in May 2020, hit a record peak in December and continued strong into 2021, peaking in March. $ have slowed with a big drop in September, but YTD they are +47.7% vs 2019, an Annual Growth Rate of 21.5%!
  • Food & Drug – Supermarkets were +$77.7B in 2020. $ are down vs Aug. but YTD are on par with the 2020 binge. They are up 19.5% vs Sept. 2019 and 14.9% vs YTD 2019. Drug Stores were +$17B (+5.7%) for 2020. They had a record March. Sales have been stable since then, but all other measurements are positive and YTD $ are +7.6%.
  • General Merchandise Stores – $ in all channels fell in Jan & Feb then spiked in March. Monthly sales by channel have been slightly up or down since then but GM has been strong, +15% YTD. $ Stores & Clubs/SuperCtrs are leading the way with a combined annual growth rate of +8.8%. These channels promote value. Their success reinforces its importance to consumers. Disc. Dept. Strs $ fell 11.5%, but that’s much better than -19% in 2019.
  • Office, Gift & Souvenir Stores– $ fell from August but were +22.3% vs September 2020. The pandemic hit them hard. They are still down YTD vs 2019. Recovery is still a long way off, but their situation is improving.
  • Internet/Mail Order – Even their $ were down vs August but the pandemic continues to foster this channel’s growth. In September of 2019, their YTD growth was +14.1%. Now, their avg growth rate is +19.6% – up 39.0%
  • A/O Miscellaneous – This is a group of small to midsized specialty retailers – chains and independents. It includes Florists, Art Stores and Pet Stores (22>24% of total $). Pet Stores were usually essential, but most stores were not. In May 2020 they began their recovery. Their 2020 total sales were up +11.6%. September was their 3rd biggest month, and they had the only increase from August. YTD $ are +27.4% vs 2020 and +40.5% vs 2019.

Relevant Retail began recovery in May and set a $ record in December. $ fell in Jan & Feb, turned up again in March and began a monthly up/down rollercoaster. September $ are down but all but 1 channel are ahead of all 2020 & 2019 $. The key drivers are the Internet, SuperCtrs/Clubs/$ Stores and Hdwe/Farm. Now, the Advance numbers for October.

2020 was a memorable year for both its traumas and triumphs. In April & May we experienced the 2 biggest retail spending drops in history, but the problems actually began in March. Retail sales began to recover in June and in October, YTD Total Retail turned positive for the 1st time since February. In December, Total Retail broke the $600B barrier – a historic first. Sales fell from their December peak in both January and February but still set monthly sales records. Then they took off again in March, setting a new monthly sales record of $633B. April sales were down slightly but they took off again in May to set yet another spending record, $643.1B. June>Sept $ fell but then came back in October with the 3rd biggest $ month in history. All major groups were up from September and were positive in all other measurements for the 5th straight month. Some other areas of the economy are still suffering, some spending behavior has changed, and inflation has become a bigger factor in increases. However, consumers continue to spend “big bucks”, especially in Relevant Retail, and the overall Retail marketplace continues its strong recovery.

Total Retail – In March, Total Retail was $633.1B, a new record. In April, $ales dipped to $625.5B but were still $218.3B more than April 2020 – a record increase, more than double the size of last year’s record drop. In May, sales set another new record, $643.1B. June>Sept sales dipped slightly but stayed above $600B. October brought a resurgence with monthly sales of $634.6B, the 3rd biggest month in history. Moreover, the current YTD average annual sales growth rate since 2019 is 9.3%, the highest ever in records going back to 1992. INFLATION NOTE: Retail $ were +14.7% vs October 2020. Inflation was +6.2% so up to 42% of the lift came just from higher prices. The “Real” increase was +8.5%. In October 2019 (pre-pandemic) Retail $ were +3.7% over 2018. Inflation was 1.8%, 48% of the lift. This produced a “Real” increase of +1.9%. Long term, strong inflation can slow spending but right now, Retail is outperforming pre-COVID 2019.

Restaurants – This group has no negative measurements vs 2020 or 2019 for 5 straight months. February 2020 YTD sales were up 8.1% vs 2019. The Pandemic changed that. Restaurants started to close or cease in person dining in March and sales fell -$33.3B (-52.5%) compared to March 2019. Sales bottomed out in April at $30.1B, the lowest April sales since 2003. Sales started to slowly increase in May but never reached a level higher than 88% compared to the previous year. 2021 started off slowly. Through February, YTD sales were down -16.7% from pre-pandemic 2020 and -10.0% from 2019. In March sales took off and grew steadily from April through July. Sales dipped slightly in August/September but came back strong in October. YTD their $ are +30.4% vs 2020 and +5.0% vs 2019. Their recovery is getting stronger.

Auto (Motor Vehicle & Parts Dealers) – Staying home causes your car to be less of a focus in your life. Sales began to fall in March and hit bottom in April. Auto Dealers began combating this “stay at home” attitude with fantastic deals and a lot of advertising. It worked. They finished 2020 up 1% vs 2019 and have returned to a strong positive pattern in 2021. The “attitude” grew amazingly positive in March and has slowed only slightly from April>October as sales exceeded $123B in all 8 months – the 8 biggest months in history. To show the effectiveness of their campaign, just look at the data. This group has exceeded $110B in monthly sales only 17 times in history. 14 of those occurred after the onset of the pandemic.  YTD Avg Annual Growth Since 2019 = +11.6% – the best performance of any big group.

Gas Stations – Gas Station $ales have been a mixed bag. If you drive less, you visit the gas station less often. Sales turned down in March 2020 and reached their low point in April. They moved up but generally stayed about 15% below 2019 levels for the rest of 2020. In February they were still behind 2020 in monthly and YTD $ but ahead of 2019 in both measurements. In March, sales skyrocketed and continued to grow to to a record $53.5B in July. They fell in Aug/Sept but turned up in October. They have been positive in all measurements vs 2019 & 2020 since March. Their comeback continues but inflation comes to the forefront in this channel. Gas prices can be pretty volatile. They dipped in the first 2 months of the pandemic but then returned to more normal levels for the balance of 2020. They began strongly inflating in 2021. In fact, October 2021 prices were 49.6% above 2020. That means that the 45.3% year over year $ lift in October was actually a decrease in the amount of gas sold. YTD Annual Growth Rate Since 2019 = +6.0%

Relevant Retail – Less Auto, Gas and Restaurants – This is what we consider the “core” of U.S. retail and has traditionally accounted for about 60% of Total Retail Spending. In looking at the individual channels in this group, we have seen a variety of results due to many factors, like non-essential closures, binge buying, online shopping and a consumer focus on “home”. However, overall, April 2020 was the only month in which spending in this group was down vs 2019. Monthly $ales exceeded $400B for the first time ever in December. They finished 2020 up $260B, +7.1%. Their performance was the only reason that Total Retail was able to finish 2020 with positive numbers, +0.5%. Sales fell in January and February 2021 but set monthly records. In March they turned sharply up and then began an up/down $ roller coaster ride. In October they reached the 2nd highest amount on record. We should also note that while December 2020 is still #1, March>October are 8 of the 10 highest $ months of all time. Relevant Retail has exceeded $361B in monthly sales 10 times in history. 9 of those have occurred since the onset of the pandemic. It is also very important that the Relevant Retail group has posted positive numbers versus last year and YTD for every month since April 2020 and their average YTD growth rate since 2019 is +10.4%. The recovery has become widespread as all channels have been positive in all measurements vs both 2020 and 2019 for 3 consecutive months. However, the primary drivers throughout the pandemic were and continue to be Nonstore, Grocery, SuperCenters/Clubs/$ Stores plus an exceptionally long 2020 “spring lift” from Hardware/Farm and Sporting Goods.

Now let’s look at what is happening in the individual retail channels to see where the $ are coming from. October $ were up 5.0% from September and an increase occurred in all but one channel. Remember, the groups in the chart are less defined than in the Final Monthly reports and we will look across the whole market, not just pet relevant outlets.

Sales in 12 of 13 channels were up vs September but all were up vs October 2020, vs October 2019 and YTD vs 2020 and 2019. (Relevant Retail YTD Avg Annual Growth Rate since 2019 = +10.4%)

After hitting bottom in April 2020, Relevant Retail has now beaten the previous year’s $ for 18 consecutive months. The group set an all-time record of $407B in December and finished 2020 +$260B vs 2019. 2021 started strong, with record sales in every month. March > Oct. were 8 of the 10 biggest of all time. Essential channels are still the primary drivers:

  • Nonstore Retailers – The biggest driver. Online shopping continues to grow in # of households and in $.
  • Food & Beverage – Grocery– Restaurant $ are improving but consumers continue to eat & drink more at home.
  • Bldg Materials/Garden/Farm– Their “Spring” lift may be ending but consumers are still focused on their homes.
  • SuperCtrs/Club/Value/$ Strs – They kept the GM channel strongly positive. Value is still a big consumer priority.

Regarding the Individual Large Channels (Includes YTD Avg Annual Growth Rate since 2019)

General Merchandise Stores – Sales increased for all channels in October and all other numbers were also positive. Even Department Stores $ are growing increasingly positive. After dipping to +7.5% in February, the growth rate by Club/SuperCtr/$ stores held at about 8.8% and then moved up in October. These stores are still the key to this channel.

  • YTD Avg Annual Growth: All GM = +7.9%; Dept Stores = +1.9%; Club/SuprCtr/$ = +9.1%

Food and Beverage, plus Health & Personal Care Stores – Sales in Grocery were down in March>May from 2020 – No surprise, as these were 2020 binge months. In June>Oct they beat 2020 $. The Health, Personal Care group finished 2020 at +1.8% but 2021 has been better. October was up 1.6% from September but YTD they are +10% vs both 2020 & 2019.

  • YTD Avg Annual Growth: Grocery = +7.3%; Health/Drug Stores = +5.2%

Clothing and Accessories; Electronic & Appliances; Home Furnishings – March > Oct have been spectacular for all these channels. The increase in Clothing vs October 2020 was less than usual but was still +22.7%. Only Furniture was down vs September, but all groups remained positive in all measurements vs 2020 or 2019 for the 8th consecutive month.

  • YTD Avg Annual Growth: Clothing = +5.4%; Electronic/Appliance = +3.7%; Furniture = +10.0%

Building Material, Farm & Garden & Hardware – Their “Spring” lift which began in 2020 has slowed but they have greatly benefited from consumers focusing on their home needs. They finished 2020 +53B (+13.8%). Sales took off in March, set a record in April, but has since slowed and stabilized. They are still +13.6% YTD. Avg Annual Growth = +13.5%

Sporting Goods, Hobby and Book Stores – Book & Hobby stores are open but Sporting Goods stores have driven the lift in this group. Consumers turned their attention to personal recreation and sales in Sporting Goods outlets took off. The group ended 2020 +5.5% vs 2019. The growth accelerated in 2021. Sales grew 1% vs September, but it was still good enough for the 10th consecutive monthly record. October YTD they are +31.0% vs 2020. Avg Annual Growth = +17.1%

All Miscellaneous Stores – Pet Stores were deemed essential but most other stores were not, so closures hit this group particularly hard. Sales hit bottom at -$3.8B in April then began to rebound. They finished with a strong December and ended 2020 -$1.0B, -0.7%. In March 2021 sales took off and reached the $14+B level in May and they have stayed there. Sales grew 8.0% to $15.7B in October, which set a new all time $ record and broke the $15B barrier. YTD sales are now +28.1% vs 2020 +27.1% vs 2019. Their recovery has become very real. YTD Avg Annual Growth = +12.7% (4th Best)

NonStore Retailers – 90% of the volume of this group comes from Internet/Mail Order/TV. The pandemic accelerated the movement to online retail. In February 2020 NonStore $ were +8.6% YTD. In December monthly sales exceeded $100B for the 1st time. They ended 2020 at +21.4%, +$162.9B. This was 63% of the total $ increase for Relevant Retail Channels. Their 2020 performance far exceeded their 12.9% increase in 2019 and every month in 2021 has produced record $. October was +6.1% vs September and +7.4% vs 2020. YTD $ are +14.2%. YTD Avg Annual Growth = +17.6%

Note: Almost without exception, online sales by brick ‘n mortar retailers are recorded with their regular store sales.

Recap – 2020 was quite a year. April & May had the 2 biggest year over year sales decreases in history while December sales broke $600B for the first time. 2021 may become even more memorable. March>October are 8 of the 9 biggest $ales months in history with the 8 largest year over year monthly sales increases ever. The total increase was +$945B, which is over 5 times the -$174B decrease from March>May 2020 which caused so much concern. At yearend 2020, Restaurants and Gas Stations were still struggling but Auto had largely recovered. Relevant retail had segments that also struggled but they still led the way for Total Spending to finish the year +0.5% vs 2019. 2021 has been even better. In June > October all major groups are positive vs both 2020 and 2019. The recovery has also become real for virtually all channels and monthly sales continue to set records. In fact, the current annual growth rates of +9.3% for Total retail and +10.4% for Relevant Retail are the best in history. Retail has recovered and continues to grow but we’ll keep checking.

2020 U.S. PET SERVICES SPENDING $6.89B…Down ↓$1.73B

Except for a small decline in 2017, Non-Vet Pet Services has shown consistent growth in recent years. In 2018, that changed as spending grew a spectacular $1.95B to $8.72B. The number of outlets offering Pet Services has grown rapidly and consumers have opted for the convenience. However, prices were also strongly increasing. In the 2nd half of 2019 spending turned down and then plummeted in 2020 due to COVID. The final $ were $6.89B, down $1.73B (-20.1%). In this report we will drill down into the data to see what groups were most impacted. (Note: All numbers in this report come from or are calculated by using data from the US BLS Consumer Expenditure Surveys)

Services’ Spending per CU in 2020 was $52.53, down from $65.22 in 2019. (Note: A 2020 Pet CU (67%) Spent $97.34)

More specifically, the 20.1% decrease in Total Pet Services spending came as a result of:

  • 0.8% less households
  • Spending 3.40% less $
  • 16.62% less often

The chart below gives a visual overview of recent spending on Pet Services

You can see that after the big lift in 2018, spending essentially flattened out in 2019, similar to the pattern in 2016-17. Increased availability and convenience of Services has radically driven up the spending on Services. This happened despite a return to a more normal inflation rate, +2.4%. However, inflation grew even stronger, +2.5%. By the 2nd half of 2019, it made an impact as spending declined for the 1st time in 18 months. The 2020 pandemic brought restrictions and closures which drove spending radically down. Now, let’s look at some specific demographics of 2020 Services spending.

First, by Income Group.

In 2018, all groups spent more. In 2019, only the middle income group, $70>150K, spent more. In 2020 they had the biggest decrease, and their spending is now below the level in 2015. The only increase came from the $30>70K group, which is the only group earning under $150K which spent more than they did in 2015. The 50/50 dividing line in $ for Services was $123K. That is down from $125K in 2019 but still by far the highest of any segment.

  • <30K (25.4% of CU’s) – $19.66 per CU (-0.1%) – $0.66B, Down $0.05B (-6.7%)This segment is getting smaller and money is tight, so Services spending is less of an option. Their Services $ fell even farther below 2015.
  • $30>70K (31.1% of CU’s) – $35.95 per CU (+3.0%) – $1.47B, Up $0.01B (+0.9%) – In 2019 they had the biggest decrease. In 2020, they had the only increase and finished second in $ to the $150K> group.
  • $70>100K (15.0% of CU’s) – $41.87 per CU (-35.6%) – $0.82B, Down $0.42B (-33.7%) The spending of this middle income group had slowly but consistently grown since 2016. Then came the pandemic and the $ plummeted in 2020, falling even below the previous low point in 2016.
  • $100>150K (14.4% of CU’s) – $62.88per CU (-42.0%) – $1.19B, Down $0.79B (-40.0%)They had shown the strongest, most consistent growth since 2016. Then came 2020, when they had the biggest decrease, down 40.%.
  • $150K> (14.1% of CU’s) – $149.07 per CU (-19.6%) – $2.76B, Down $0.49B (-15.0%)They have moved steadily down since peaking in 2018. The pandemic drop in 2020 was -$0.49B, but they are still slightly above 2015 $.

Now, let’s look at spending by Age Group.

All age groups spent more on Services in 2018. In 2019, the groups under 45 spent less on Services while those 45 or older spent more. In the 2020 pandemic, everyone spent less but all stayed above 2015 $. Here are the specifics:

  • 75> (11.2% of CU’s) – $23.09 per CU (-55.0%) – $0.34B – Down $0.42B (-55.1%) This group has the greatest need for pet services, but money is always an issue. In 2019 they had the biggest increase. In 2020 they basically gave it all back, with the biggest drops in spending and frequency. 0.2% fewer CU’s spent 28.5% less $, 37.1% less often.
  • 65>74 (15.6% of CU’s) – $47.60 per CU (-25.0%) – $0.97B – Down $0.28B (-22.2%). This group is also very value conscious and growing in numbers. From 2016 to 2019 their spending was very stable. In 2020 it plunged by over 20% primarily due to a big decrease in frequency. 3.7% more CU’s spent 5.7% less $, 18.9% less often.
  • 55>64 (19.1% of CU’s) $53.15 per CU (-23.4%) – $1.33B – Down $0.37B (-21.7%) After a big drop in 2017, they began to slowly increase Services spending. In 2019, they moved up to the #2 spot in Services spending. A big drop in frequency drove spending down in 2020 but they are still #2. 2.2% more CU’s spent 1.9% less $, 21.9% less often.
  • 45>54 (17.2% of CU’s)- $75.38 per CU (-16.5%) – $1.70B – Down $0.31B (-15.2%) This highest income group was the leader in Services $ until 2016. They regained the top spot in 2019 and held on in 2020 despite a 20% drop in frequency which drove spending down -$0.31B. 1.5% more CU’s spent 5.2% more $, 20.6% less often.
  • 35>44 (17.0% of CU’s) – $56.91 per CU (-18.8%) – $1.27B – Down $0.30B (-18.9%) Spending exploded in 2018 with a $1B increase pushing them to #1. In 2019 they spent $1.6B more on Veterinary and Food and cut back on Services and Supplies. In 2020 both their spending and frequency fell. 0.1% fewer CU’s spent 8.9% less $, 10.9% less often.
  • 25>34 (16.0% of CU’s) – $52.85 per CU (-1.9%) – $1.11B – Down $0.03B (-3.0%) This group of Millennials “found” the Services segment in 2018 with a 36% increase in $. Their spending has slowly fallen since then. In 2020, their 3% decrease was primarily driven by a -9.7% drop in frequency. 1.2% less CU’s spent 8.6% more $, 9.7% less often.
  • <25 (3.8% of CU’s) – $32.44 per CU (+24.6%) – $0.16B – Down $0.03B (-14.3%) After 2018 this group returned to being a very minor player. 31% fewer CUs is significant. 31.2% fewer CU’s spent 19.7% less $, 55.1% more often.

In 2019, when overall Services spending fell $0.1B, the over 45 age group spent $0.51B more. The situation was reversed in 2020 as they spent -$1.38B less, 79.8% of the total $1.73B drop in Services spending.

Finally, here are some key demographic “movers” that drove the big drop in Pet Services Spending in 2020. The segments that are outlined in black “flipped” from 1st to last or vice versa from 2018. The red outline stayed the same.

In 2018 the Services spending increase was very widespread with (88%) of all segments spending more. 6 of 12 demographic categories had no segments that spent less on Services in 2018. 2019 was very different and reflected the slight decrease in spending for the segment. All categories had segments that spent less on Services and 49 total segments (51%) had decreased Services $ from 2018. In 2020, the situation got markedly worse as 76 segments (79%) spent less and in 3 categories, no segments spent more.

You see from the graph that the biggest negatives were all substantially larger than the small increases. This speaks to the severity and widespread nature of the loss in $ in the segment. There was also considerable turmoil in Services spending. 3 groups maintained their position but 7 flipped from 1st to last or vice versa.

There was only 1 “usual” winner – Self-Employed, which have the highest income in their category. There were some winners that were definitely a surprise – Renters, Rural, $50>69K Income, Gen Z, High School Grads, Hispanic and Under 25 years old. That means that more than half of the winners were not expected.

In terms of “usual” losers, there really were none in 2020. The losing segments are where we find these usual winners:

  • 2 People
  • Married Couple Only
  • Homeowner w/Mtge
  • Managers & Professionals
  • Suburban
  • $100>149K
  • College Degree
  • 2 Earners
  • White, Not Hispanic

This actually makes some sense. The drop in spending was largely due to restrictions and closures caused by the COVID Pandemic. This would most impact the groups that usually spent the most and would produce the biggest decreases.

In our earlier analysis, we didn’t see any truly distinct spending patterns. The only lift in any age or income group, and it was miniscule, was from the $30>69K income group. However, it is significant that they are the only income group under $150K that didn’t spent less in 2020 than they did in 2015. The 50/50 spending point moved down slightly from $125 to $123 but that is somewhat deceptive. The highest income group, $150K> actually gained ground. This group has 14.1% of CUs but did 40.1% of the Services spending in 2020. That’s up from 37.7% in 2019.

After the huge lift in spending in 2018, Services spending plateaued in 2019. There were a lot of ups and downs, but overall the segment remained essentially stable at its new elevated level of spending. That changed with the pandemic in 2020. Like many retail services segments, Pet Services outlets were deemed nonessential and subject to restrictions This resulted in a radically reduced frequency of visits and was the biggest reason behind the 20% drop in spending.

There is no doubt that the Covid pandemic with widespread closures and “staying at home” had a big impact on this most discretionary Pet Industry segment. However, in recent years, with the increasing humanization of our pets, Pet Services have become more important to Pet Parents and the Pet Industry. For Pet retail outlets, offering Services provides a key point of differentiation and a reason to shop in their store. You can’t get your dog groomed on the internet or even in a Mass Market retailer. We expect this segment to come back strong in 2022.


2020 U.S. PET SUPPLIES SPENDING $15.16B…DOWN ↓$1.65B

Total Pet spending grew to $83.74B in 2020, up $5.31B (+6.8%) from 2019, a big turnaround. Unfortunately, the Supplies segment was on the other side as spending dropped to $15.16B, down $1.65B (-9.8%). (Note: All numbers in this report come from or are calculated by using data from the US BLS Consumer Expenditure Surveys)

After flattening in the 2nd half of 2018, spending turned sharply down in the 1st half of 2019 and continued to decline through 2020 as the pandemic also contributed to the drop. 2019 & 2020 wiped out 93% of a 24 month $5B gain. We’ll “drill down” into the data to try to determine what and who are “behind” the 2020 drop in Supplies Spending.

In 2020, the average household spent $115.52 on Supplies, down 9.1% from $127.15 in 2019. (Note: A 2020 Pet CU (67%) Spent $172.42) This doesn’t exactly match the -9.8% total $ decrease. Here are the specific details:

  • 0.8% less CU’s
  • Spent 3.6% less $
  • 5.8% less often

Let’s start with a visual overview. The chart below shows recent Supplies spending history.

Since the great recession, spending trends in the Supplies segment have been all about price – the CPI. Although many supplies are needed by Pet Parents, when they are bought and how much you spend is often discretionary. Additionally, many of the product categories in this segment are now considered commodities, so price is the main driver behind consumer purchasing behavior. When prices fall, consumers are more likely to buy more. When they go up, consumers spend less and/or buy less frequently.

2014 was the third consecutive year of deflation in Supplies as prices reached a level not seen since 2007. Consumers responded with a spending increase of over $2B. Prices stabilized and then moved up in 2015.

In 2015 we saw how the discretionary aspect of the Supplies segment can impact spending in another way. Consumers spent $5.4B for a food upgrade and cut back on Supplies – swapping $. This, in conjunction with inflation, caused supplies to suffer as consumers spent 4.1% less, but they bought 10% less often. That drop in purchase frequency drove $1.6B (78%) of the $2.1B decrease in Supplies spending.

In 2016, supplies’ prices flattened out and consumers value shopped for their upgraded food. Supplies spending stabilized and began to increase in the second half. In 2017 supplies prices deflated, reaching a new post-recession low. The consumers responded with a huge $2.74B increase in Supplies spending that was widespread across demographic segments. An important factor in the lift was an increase in purchase frequency which was within 5% of the 2014 rate.

In 2018 prices started to move up in April and rapidly increased later in the year due to the impact of new tariffs. By December, Supplies prices were 3.3% higher than a year ago. This explains the initial growth and pull back in spending.

In 2019 we saw the full impact of the tariffs. Prices continued to increase. By yearend they were up 5.7% from the Spring of 2018 and spending plummeted -$2.98B. The major factor in the drop was a 13.1% decrease in purchasing frequency.

2020 brought the pandemic, with retail restrictions and the consumers focus on needed items. Both the amount spent and frequency of purchase of Supplies fell slightly. This could be the result of a strong consumer move to the internet.

That gives us an overview of the years leading up to 2020. Now let’s look at some specifics regarding the “who” behind the 2020 numbers. First, we’ll look at spending by income level, the most influential demographic in Pet Spending.

National: $115.52 per CU (-9.1%) – $15.16B – Down $1.65B (-9.8%).

All big income groups spent less but the 50/50 $ divide remained the same as 2019, $92K, the lowest of all segments.

  • <$30K (25.4% of CU’s)- $57.73 per CU (+2.1%) $1.93B– Down $0.09B (-4.6%). This group is very price sensitive, but they actually spent more per CU. 6.5% fewer CUs caused the decrease and put them even further below 2015 $.
  • $30K>70K (31.1% of CU’s)- $97.38 per CU (-5.1%) $3.97B Down $0.30 (-7.0%). This big, lower income group closely matches both the national pattern and that of the $150K+ group. The tariff prices had a big impact and COVID a lesser one. Amazingly enough, until 2019 they were the leader in Total Supplies Spending $.
  • $70>$100K (15.0% of CU’s) – $117.65 per CU (-21.3%) – $2.32B Down $0.54B (-19.0%). This middle-income group had been consistent in Supplies spending. 2020 hit them hard in all segments, including a 19% drop in Supplies $.
  • $100K>$150K (14.4% of CU’s) – $146.42 per CU (-14.4%) – $2.76B Down $0.36B (-11.4%). This higher income group is also sensitive due to family needs. They had the 2nd biggest % drop and traded Supplies $ for Food & Veterinary.
  • $150K> (14.1% of CU’s) – $225.91 per CU (-13.0%) $4.18B Down $0.36B (-8.0%). The $150>199K was up $0.01B but the $200K+ group spent $0.38B less. Money matters in Supplies, but the pandemic impact was widespread.

Every group spent less but the biggest negative impact occurred in the middle range – $70K >$150K. This group has the biggest family and career pressures, so it is not surprising that their discretionary spending on Supplies was less.

Now, we’ll look at spending by Age Group.

National: $115.52 per CU (-9.1%) – $15.16B – Down $1.65B (-9.8%).

It’s split, but simple. Young Millennials and old Boomers spent more. Everyone else spent less. Here are the details.

  • 55>64 (19.1% of CU’s) $108.93 /CU (-33.0%) – $2.73B – Down $1.26B (-31.5%). Low Supplies prices in 2017 got them on the Supplies Band Wagon. When prices turned sharply up in the 2nd half of 2018 and 2019, spending stalled then dropped. Spending fell again in 2020 as 2.2% more CU’s spent 26.2% less on Supplies, 9.2% less often. Part of the cut back on Supplies was to help pay for a huge spending increase in Food as they traded $.
  • 45>54 (17.2% of CU’s) $146.36 per CU (-13.2%) – $3.31BDown $0.45B (-11.9%). Until 2019, this highest income age group had been the leader in Supplies spending since 2007. More CU’s (+1.5%) spent 6.8% less on supplies, 6.9% less often. They had a 12% drop but returned to the top $ spot, now battling the 35>44 group.
  • 35>44 (17.0% of CU’s) $141.94 per CU (-2.1%) – $3.17B; Down $0.07B (-2.2%). This group is second in income and overall expenditures but also has the biggest families. After 3 strong years, the strong inflation drove the $ down in 2019. However, the Pandemic had little impact. 0.1% less CUs spent 5.5% more $, 7.2% less often.
  • 25<34 (16.0% of CU’s) $133.17 per CU (+29.8%) – $2.80B; Up $0.62B (+28.3%). After trading Supplies $ for upgraded Food and Vet Care in 2016, these Millennials turned their attention back to Supplies. The rising prices hit them hard in 2019 but they reversed this in 2020 as 1.2% fewer CUs spent 30.4% more $, 0.5% less often.
  • 65>74 (15.6% of CU’s) $96.07 per CU (+2.1%) – $1.96B – Up $0.11B (+5.8%). This older group is very price sensitive. When prices turned up in 2018, they immediately cut back on spending which continued into 2019. They came back in 2020 but not as strong as the 25>34 group. 3.7% more CUs spent 4.9% more, 2.7% less often
  • 75> (11.2% of CU’s) $43.04 per CU (-31.4%) – $0.63B, Down $0.29B (-31.5%). This lowest income group is truly price sensitive. They began to cut back on spending in the 2nd half of 2018 and this behavior continued in 2019. Their spending was severely impacted by the Pandemic as 0.2% less CU’s spent 19.4% less, 14.9% less often.
  • <25 (3.8% of CUs) $110.71/CU (-6.4%) $0.56B – Down $0.31B (-35.6%). 31.2% fewer CUs spent 8.8% less $, 2.6% more often. This group was fundamentally impacted by COVID as they lost 2.2M CUs, down 31.2%.

The impact of COVID was widespread but mixed. Only 2 disparate groups – 25>34 and 65>74 spent more.

Next, let’s take a look at some other key demographic “movers” in 2020 Pet Supplies Spending. The segments that are outlined in black “flipped” from 1st to last or vice versa from 2019. The red outline stayed the same.

In 2019, in 9 of the 12 demographic categories all segments spent less on Supplies. In 2020 it was only 1. Also in 2019, 97% of 96 demographic segments spent less. In 2020 it was 81%. 2020 was bad but still an improvement over 2019.

Only 2 segments flipped from last to 1st as Managers/Professionals and Homeowners w/Mtge returned to their usual position at or near the top. 5 Segments held their position – 1 on top, 4 on the bottom. All of these are surprises as they are often in the opposite spot.

On the “winning” side there are a couple “usual suspects” – Mgrs/Prof & Adv. College Degree. The others are all somewhat surprising although Supplies has trended younger in recent years which would include Millennials & 25>34 yr olds. On the losing side, we already mentioned 4 surprises but there are a couple more – Suburban & 2 Earners.

Supplies is a discretionary segment, so it is more susceptible to market factors than the more needed segments. In fact, Supplies spending has decreased in 16 years since 1984. Since 2010, it has become very commoditized and price sensitive. 2 years of deflation drove spending up $5B. Then inflation hit and things turned around, -$2.98B. The 2020 Pandemic caused Pet Parents to focus on Pet Needs. This means that the more discretionary categories, Supplies & Services, lost ground. The overall decrease in Supplies was relatively small, under 10%, compared to the changes in other segments but it still shows the vulnerability of this more discretionary segment.