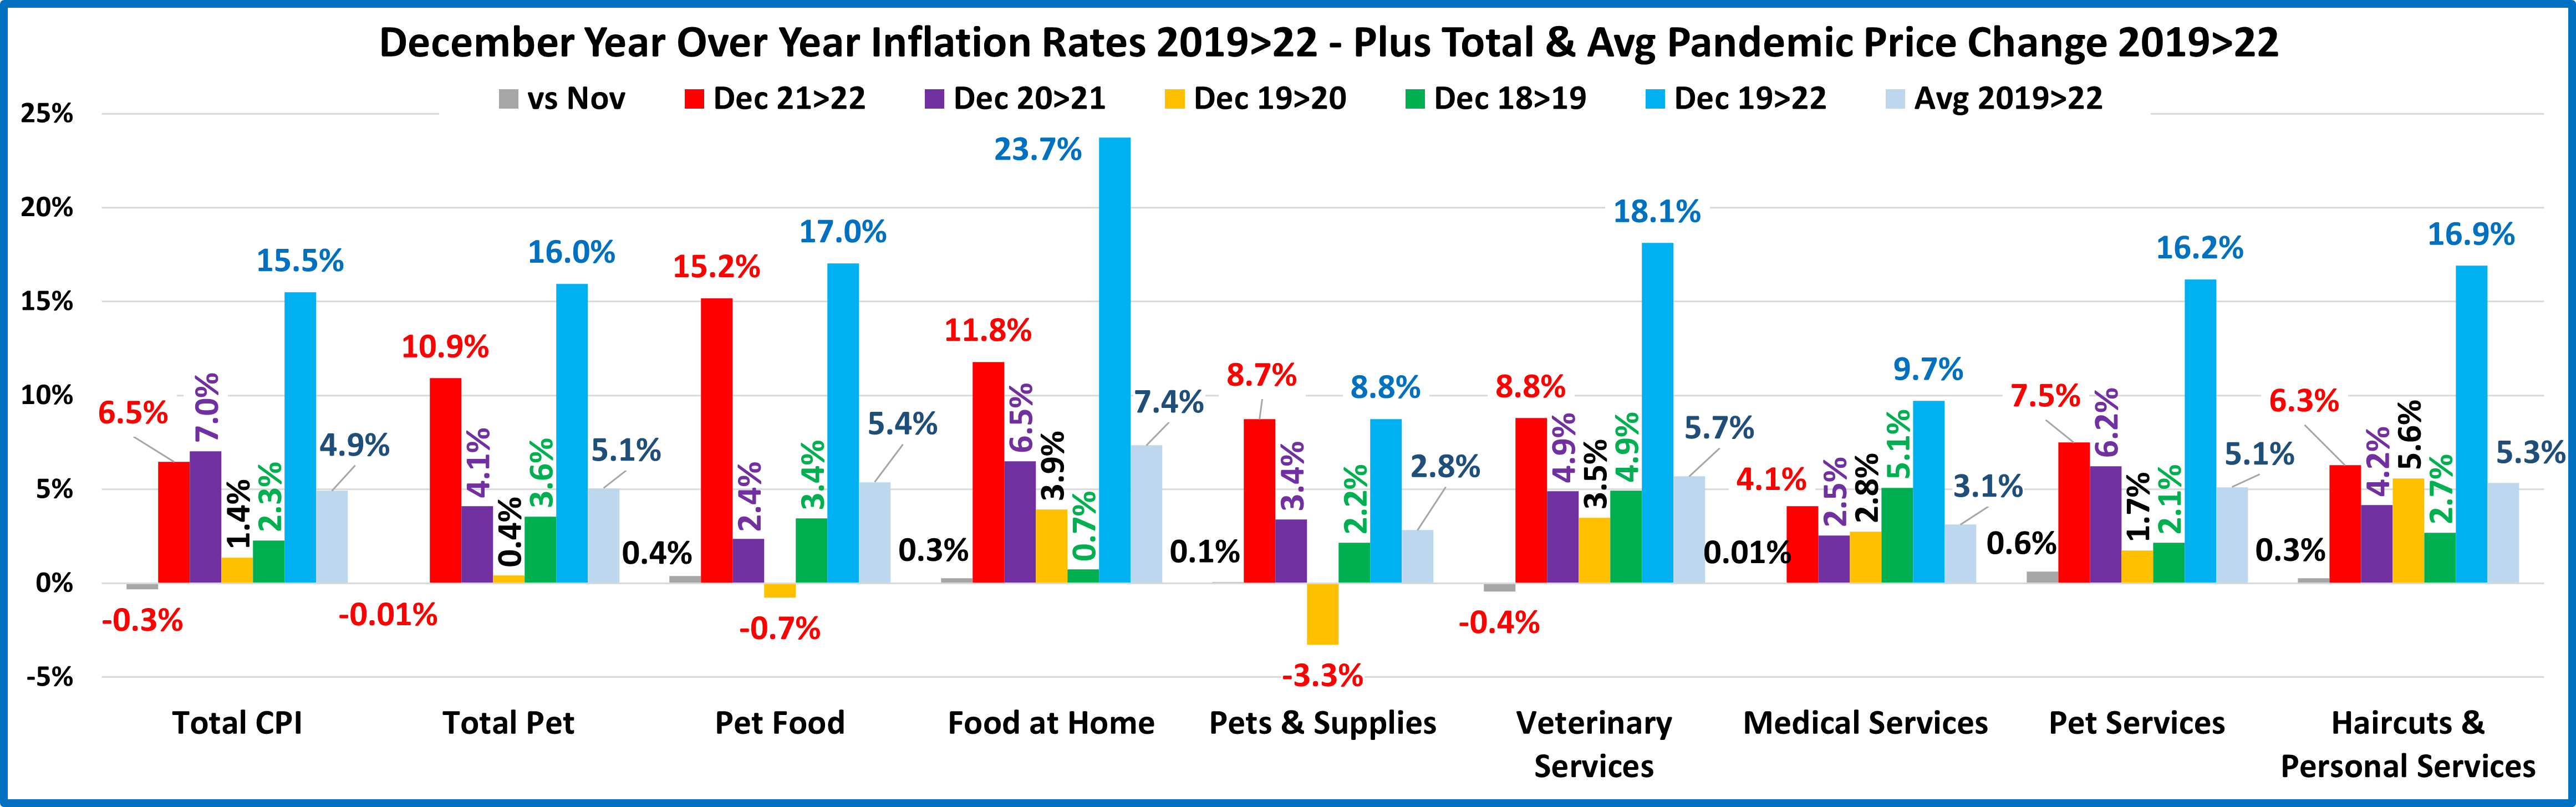
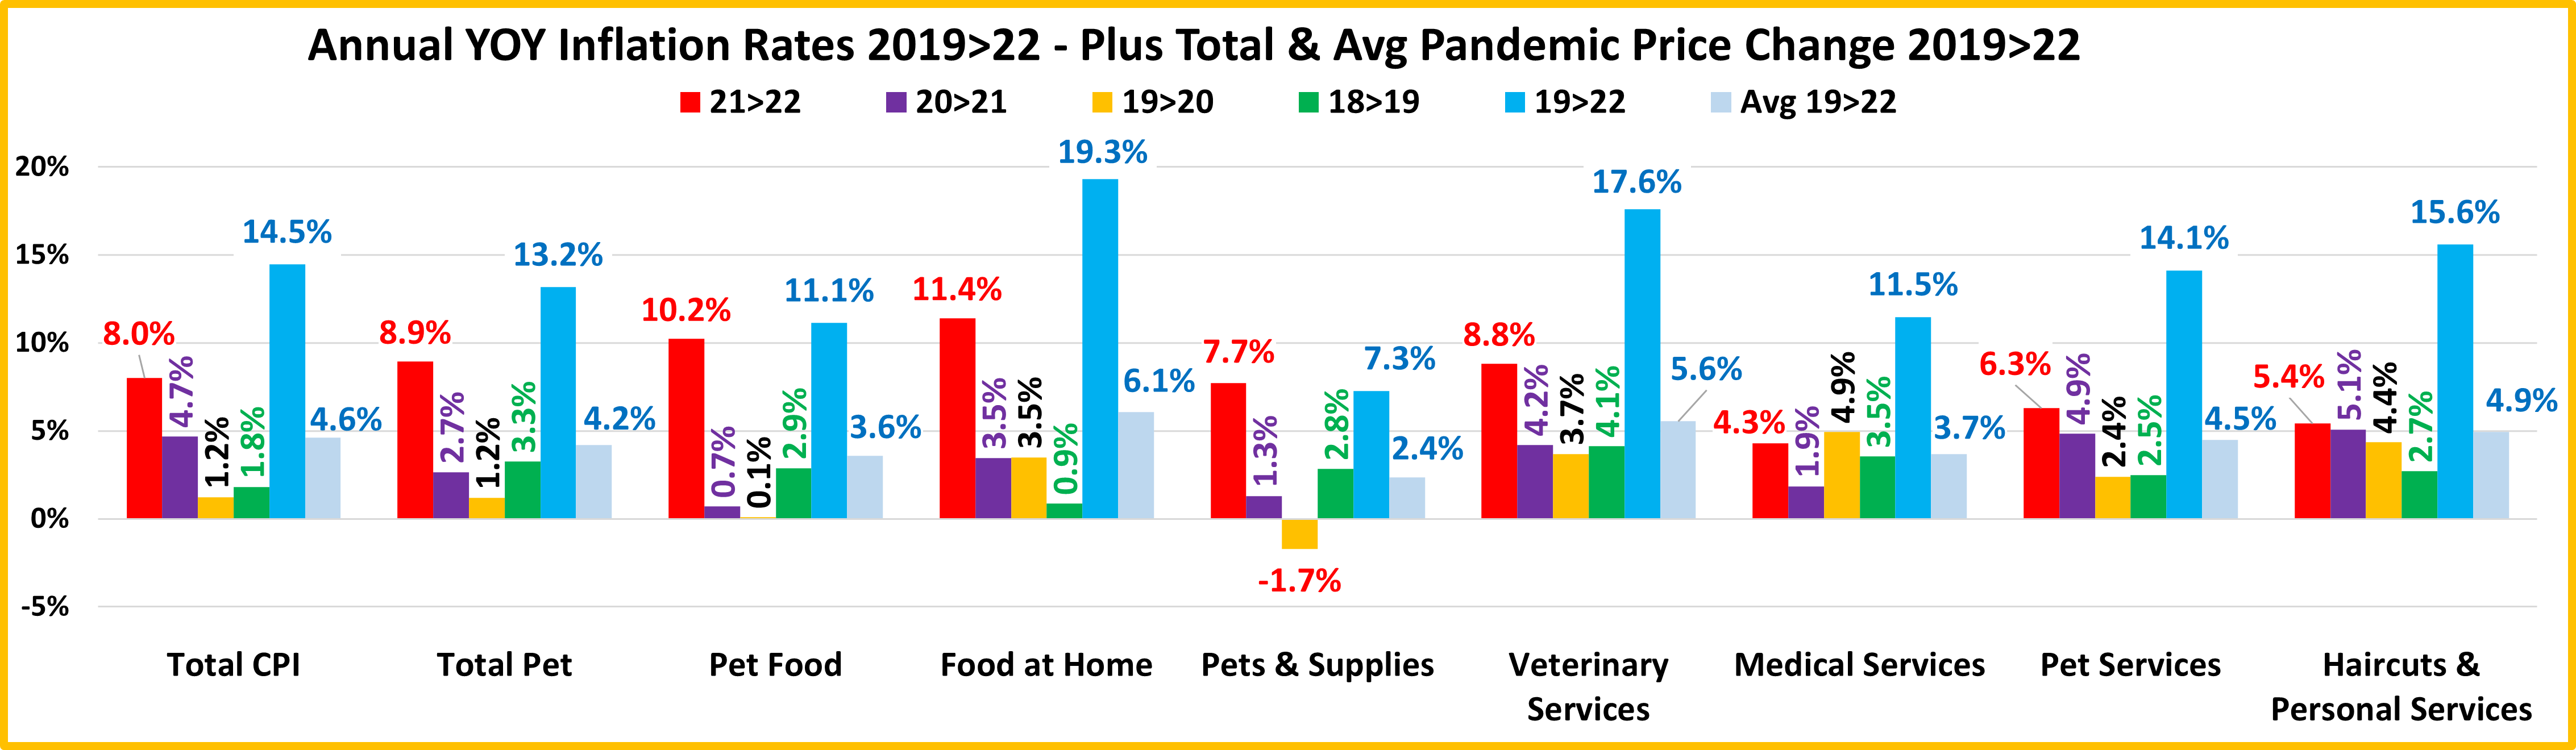
2021 Pet Supplies Spending was $23.81B – Where did it come from…?

Next, we’ll turn our attention to Pets and Supplies. We’ll see definite differences from Pet Food as the spending in the Supplies segment is more discretionary. There are other factors too. Spending can be affected by the spending behavior in other segments as consumers often trade $ between segments. However, the biggest factor is price. Many categories have become commoditized so pricing changes can strongly impact Consumers’ buying behavior. In the 2nd half of 2016, deflation began, and Supplies started a 24 month spending lift, totaling $5B. Prices turned up in mid-2018 due to new tariffs and Supplies $ fell a record -$3B in 2019. In the 2020 pandemic, Supplies weren’t a necessity, so sales continued to drop, -$1.7B. In 2021, Pet Parents caught up with their children’s needs and Supplies spending exploded, +$8.65B.

Let’s see which groups were most responsible for the bulk of Pet Supplies spending in 2021 and the $8.65B increase. The first chart details the biggest pet supplies spenders for each of 10 demographic categories. It shows their share of CU’s, share of Supplies spending and their spending performance (Share of spending/share of CU’s). All groups are the same as Total Pet so its skewed younger than Food. The categories are presented in the order that reflects their share of Total Pet Spending. This highlights the differences in importance. All 10 of the groups have over a 60% market share. The big difference is in performance. There are 6 groups with performance over 120%. That’s one more than Total Pet and Pet Food. However, 9 of 10 groups have performance of 117.8% or higher. That’s the most of any segment and indicates that Supplies spending became less balanced in 2021.

  1. Race/Ethnic – White, not Hispanic (83.2%) down from 83.3%. This large group accounts for the vast majority of spending in every segment. Their share remained essentially stable and their performance grew from 121.8% to 123.9% but they fell from #4 t0 #6 in importance in Supplies Spending. Minority groups account for 32.8% of all CUs but spend only 16.8% of Supplies $. This is actually their biggest share of any segment. All groups spent more. Most of the increase came from Whites but Asians and Hispanics had the biggest % increases.
  2. # in CU – 2+ people (83.3%) up from 79.5%. Their performance increased to 119.8%, from 113.3%. All CU sizes, including singles had double digit percentage increases. 2 Person CU’s had the biggest $ increase, +$2.91B but 5+ and 4 person CUs had the highest percentage increase and led in performance.
  3. Housing – Homeowners (76.9%) down from 77.7%. Homeownership is a big factor in pet ownership and spending in all segments. Their share of Supplies $ fell but their performance grew slightly to 118.9%, from 118.0% due to a 1% drop in homeowner’s share of CUs. They also fell from 6th to 8th place in terms of importance for increased Supplies spending. Homeowners with and without a mortgage and renters all spent at least 46% more on Supplies in 2021.
  4. Area – Suburban & Rural (76.0%) up from 67.1%. This was a spectacular gain in share and their performance grew to 117.8%, from 106.4% in 2020. The big Suburbs, over 2500 population led the way with a $5.99B, +90.8% increase but all areas, including Center City had double digit percentage increases.
  5. Income Over $70K (68.4%) up from (61.1%) Another big gain in share and their Performance also grew from 140.5%, to 152.7%. Income remains the most important factor in increased Pet Supplies Spending and got even stronger in 2021. After a 24% increase in 2020, the $40>49K group was the only Income segment to spend less on Supplies in 2021. The highest income group, $200K> led the way with a $4B, +165.9% increase. However, all segments but $40>49K spent at least 32% more on Supplies in 2021. Of Note: All incomes over $100K perform above 100%.
  6. # Earners – “Everyone Works” (73.4%) up from 72.8%. Their performance grew from 127.0% to 129.5% but they fell from #2 to #4 in importance. In this group, all adults in the CU are employed. The # Earners is more important than in Food but it is income that truly matters. All earner/no earner CUs spent more but 2 Earners led the way, +$5.2B. Only CUs with 2 or more earners perform above 100%.
  7. Education – College Grads (68.3%) up from 56.7%. Higher Education lost market share in 2020 but they got it back in 2021. Their performance level also radically increased from 121.4% to 144.3% and they took over the #2 spot in importance. The only decrease came from those without a High School Diploma. However, College Grads led the way with a $7.7B lift, 89% of the increase for the entire segment. A College Degree generally leads to a higher income and as we have seen, higher income matters a lot in Supplies spending.
  8. Occupation – All Wage & Salary Earners (60.9%) down from 68.0%. The performance of this group was 102.6%, down from 110.7%. All occupations and Retirees spent more. The big drop in share and performance happened because 50% of the total $ increase came from CUs without a regular wage/salaried worker.
  9. CU Composition – Married Couples (62.0%) up from 60.0%. Their performance also increased from 123.7% to 130.8% and they stayed 3rd in importance. All types of CU Composition spent more on Supplies. Married Couples with the oldest child 6>17 led the way with a $3.53B increase but the $8.65 spending lift was pretty equally divided between CUs with children, +$4.4B and those with no children, +$4.25B.
  10. Age – 35>64 (66.3%) up from 60.7%. A big lift from the 55>64 yr-olds caused spending to skew slightly older in 2021 so 35>64 replaced 25>54. The new group’s performance level increased to 126.6% from 113.9% but the age category dropped from #4 to #5 in importance. The <25 Gen Zers spent -$0.03B less but all other age groups had at least a 25% increase. The 35>44 group led the way with a $4B lift that more than doubled their Supplies spending,

Pet Supplies spending skews younger than Food. Spending decreased in the pandemic as consumers focused on needs rather than the more discretionary Supplies. That ended in 2021 as Pet Parents caught up with the many Pet Supplies purchases that had been “put off” for a year or more. However, the increase from 5 to 6 groups with 120+% performance, with 9 over 117.8% indicates increased spending disparity between segments.

Now, we’ll look at 2021’s best and worst performing Pet Supplies spending segments in each category.

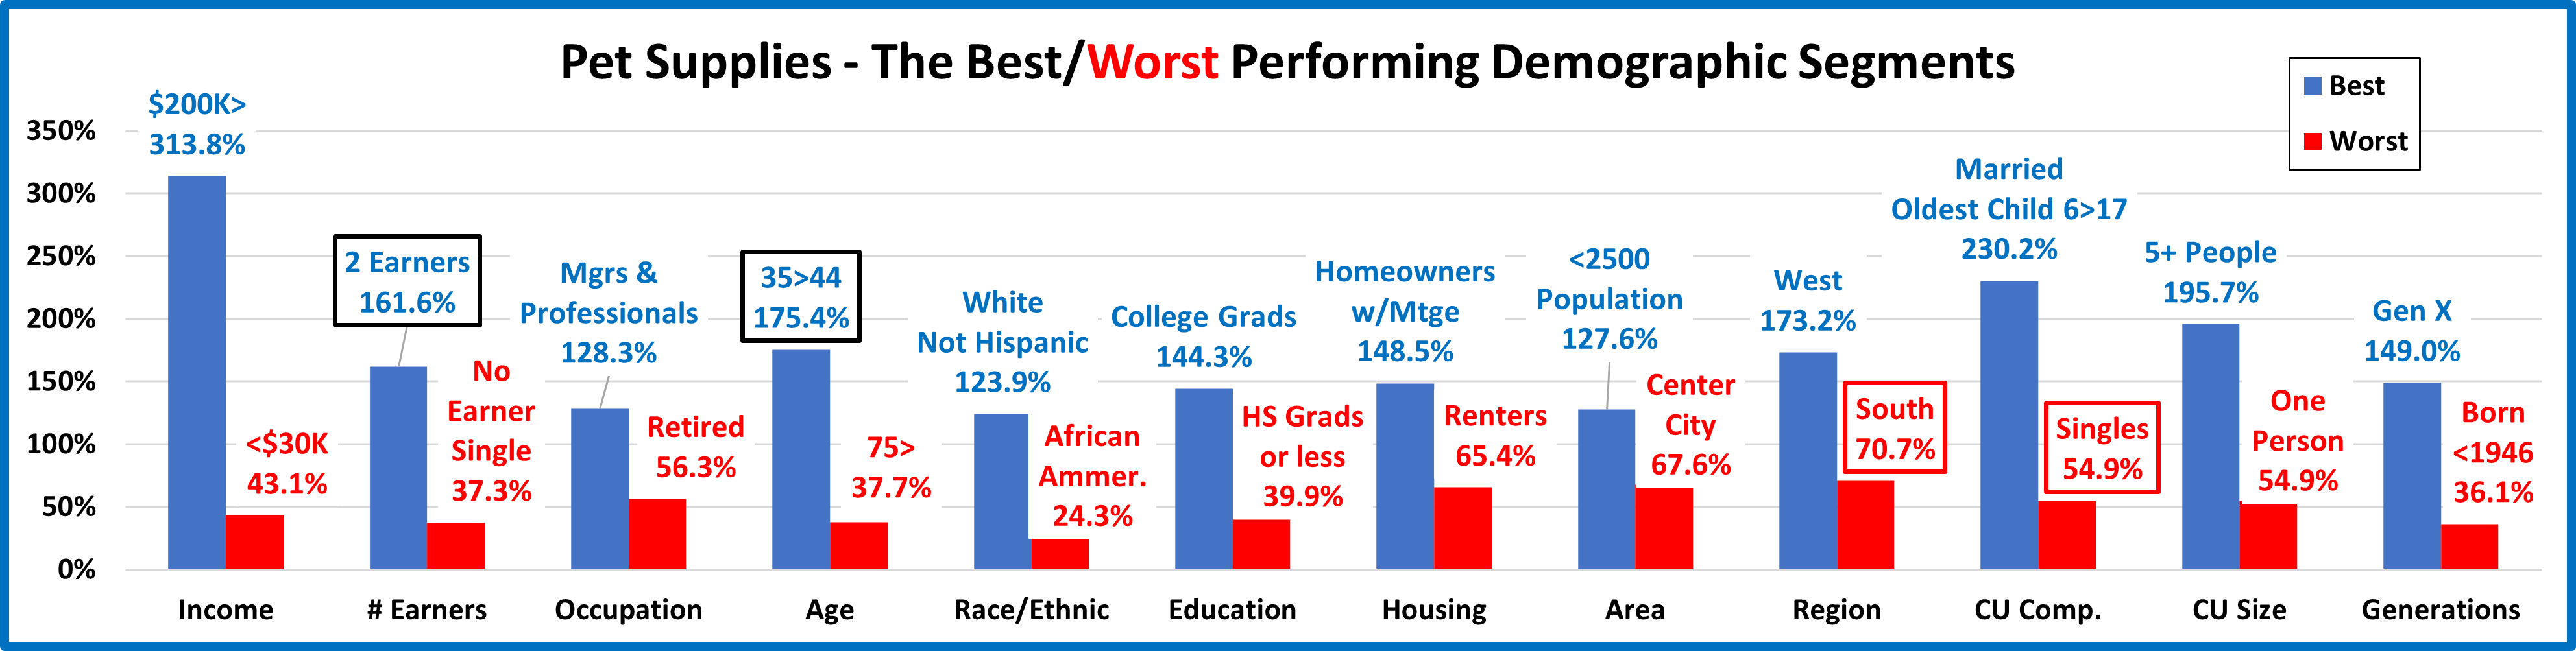
Almost all of the best and worst performers are those that we would expect. In Pet Supplies spending, there are only 4 that are different from 2020. That is 1 less than Veterinary, 6 less than Total Pet & Services and 11 less than Pet Food. Supplies has the lowest number of total changes and by far the fewest new winners. As we move deeper into the data, we will see even more differences between the Industry Segments. Changes from 2020 are “boxed”. We should note:

  • Income matters in Supplies spending.
    • The $200K> was group the top performer in all industry segments but Food, where $150>199K won. However, in Supplies their performance was double that of 2nd place ($150>199K), the biggest gap for any segment.
  • # Earners – 2 Earners replaced 3 Earners at the top but again, only these 2 groups performed above 100%.
  • Age – Last year 45>54 edged out 35>54 for the win. This year they traded places but the 35>44 yr-olds won by over 70%. Both are mostly Gen Xers which is further proof that Gen Xers “rule” in Supplies spending.
  • Region – The West won again but 2 regions performed over 100%. The South returned to its usual spot at the bottom. However, the performance disparity from 1st to last grew from under 20% in 2020 to over 100% in 2021.
  • CU Composition – Singles replaced Single Parents at the Bottom. The 2020 winner held their spot. However, in 2021 they were the only Married w/children segment to perform over 100%. Last year they all did.

It’s time to “Show you the money”. Here are segments with the biggest $ changes in Pet Supplies Spending.

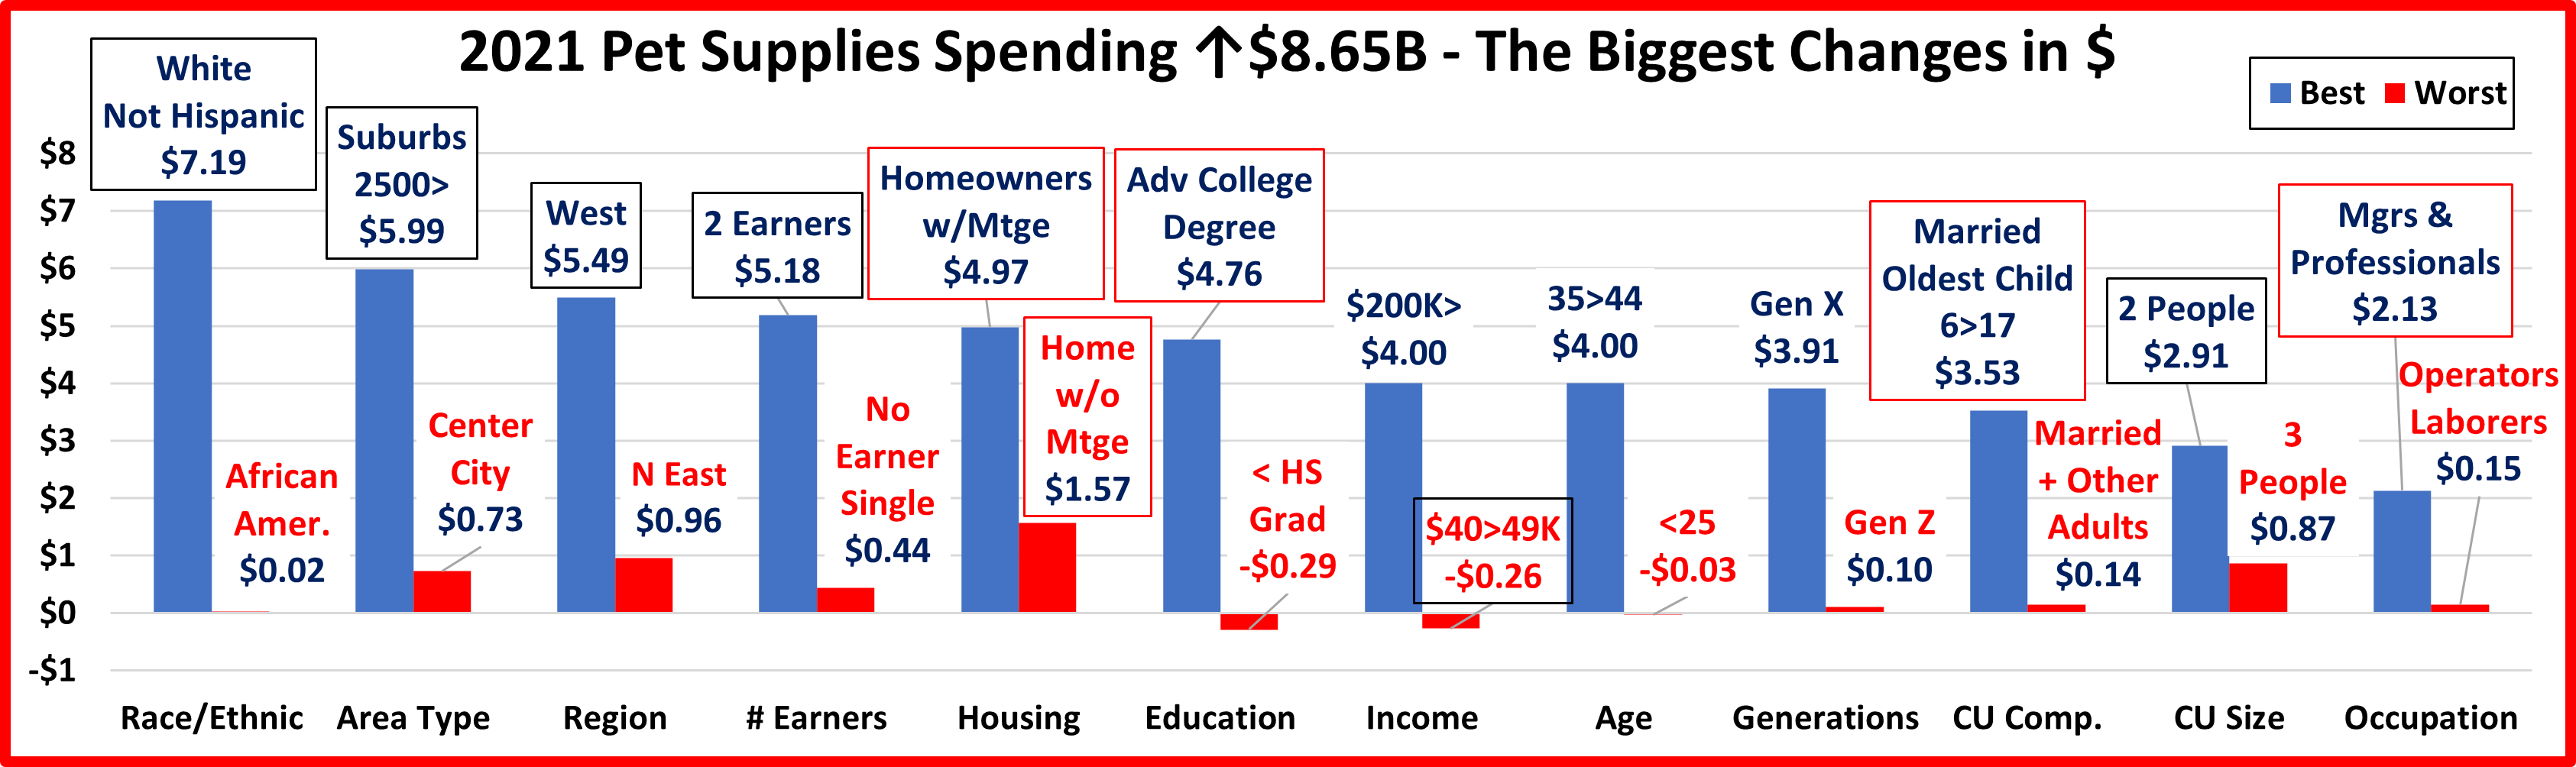
In 2019, Tarifflation caused a record $2.98B drop in Supplies spending. 2020 brought the pandemic and pet parents focused on “needs” so the more discretionary Supplies segment fell another $1.65B. In 2021 Pet Parents turned their attention to the multitude of Supplies needed by their “children” and spent a record $8.65B more. In the chart, there are 5 repeats from 2020 – 4 winners and 1 loser. Also, 5 segments switched from last to first and 1 flipped from 1st to last. This is more turmoil than in 2020 when there were 7 repeats but only 2 “flips”. However, the 2021 turmoil was very positive. In 2020 all segments in the Region category spent less. In 2021, all segments in 9 of 12 categories spent more. The record lift in 2021 more than made up for 2 straight years of decreases. Here are the specifics:

  • Race/Ethnic – White, Not Hispanic flipped from last to 1st but all racial/ethnic groups spent more.
    • Winner – White, Not Hispanic – Supplies: $19.81B; Up +$7.19B (+56.9%)                             2020: Asian Americans
    • Loser – African Americans – Supplies: $0.75B; Up $0.02B (+3.4%)                                          2020: White, Not Hispanic
    • Comment – Although their share of Pet Supplies $ has fallen from 86.3% in 2018 to 83.2% in 2021, White, Not Hispanics still drive this discretionary segment. They have the highest % of pet ownership and the second highest income. The interaction of these two factors is very clear in the Racial/Ethnic category. Whites had the most to lose and they did in 2020. They also had the most to gain in 2021 and they did that too, +$7.2B.
  • Area Type– After 2 years at the bottom, the Big Suburbs flipped from last to 1st, but all areas spent more.
    • Winner – Suburbs 2500> – Pet Supplies Spending: $12.58B; Up +$5.99B (+90.8%)                2020: Areas <2500
    • Loser – Center City – Pet Supplies Spending: $5.72B; Up $0.73B (+14.6%)                                2020: Suburbs 2500>
    • Comment– In Supplies spending, more space meant more $ as areas under 2500 pop finished 2nd, +$1.9B (+54%).
  • Region – The West flipped from last to first.
    • Winner – West – Pet Supplies Spending: $9.38B; Up $5.49B (+140.8%)                                     2020: Midwest
    • Loser – Northeast – Pet Supplies Spending: $3.60B; Up $0.96B (+36.2%)                                 2020: West
    • Comment – In 2018, all regions spent more on Supplies. In 2019 and again in 2020 all Regions spent less. Supplies was the only industry segment that was all negative in both years. 2021 brought a big turnaround, as like 2018, all Regions spent more. The West led the way but with “rounding”, the other regions all had $1+B increases.
  • # Earners – 2 Earners won with another last to 1st flip, but all segments spent more.
    • Winner – 2 Earners – Pet Supplies Spending: $11.77B; Up +$5.18B (+78.7%)                          2020: 1 Earner, Single
    • Loser – No Earner, Single – Pet Supplies Spending: $1.17B; Up $0.44B (+60.1%)                    2020: 2 Earners
    • Comment – Income is a big factor and the # of Earners is important in Supplies Spending. 2 Earner CUs had by far the biggest increase and Everyone Works CUs generated 75% of the spending lift. However, the increase was widespread as CUs with No Earners increased their Supplies spending by 68.3%.
  • Housing – The winner and loser held their position from 2020 as all segments spent more in 2021.
    • Winner – Homeowner w/Mtge – Supplies: $13.32B; Up +$4.97B (+59.6%)                             2020: Homeowner w/Mtge
    • Loser – Homeowner w/o Mtge – Supplies: $4.99B; Up $1.57B (+45.7%)                                 2020: Homeowner w/o Mtge
    • Comment – You’re in a good position when the “loser” had an increase of 45.7%. Homeowners w/Mtge supplied most of the $ but Renters actually had the biggest percentage increase, +62.2%.
  • Education – Advanced College Degrees held their expected spot at the top.
    • Winner – Advanced College Degree – Supp. Spending: $8.84B; Up +$4.76B (+116.7%)          2020: Adv College Degree
    • Loser – <HS Grad – Supplies Spending: $0.46B; Down $0.29B (-38.3%)                                       2020: BA/BS Degree
    • Comment – The spending flowed just as expected with those without a High School Diploma having the only decrease and those with a College Degree providing $7.7B (88.7%) of the total increase.
  • Income – The low income $40>49K flipped from 1st to last
    • Winner – $200K> – Pet Supplies Spending: $6.41B; Up +$4.00B (+165.9%)                              2020: $40>49K
    • Loser – $40>49K – Pet Supplies Spending: $1.01B; Down -$0.26B (-20.6%)                             2020: $70>99K
    • Comment – Last year’s winner, $40>49K had the only decrease in spending and the $200K> group moved to the top where they belong. Income does matter a lot in Supplies Spending. The $200K group led with a $4B increase. However, CUs $100K> (30%) provided 71% of the lift and were the only segments that performed at 100+%.
  • Age – The winner and loser were both new.
    • Winner – 35>44 yrs – Pet Supplies Spending: $7.17B; Up $4.00B (+126.3%)                            2020: 25>34 yrs
    • Loser – <25 yrs – Pet Supplies Spending: $0.53B; Down -$0.03B (-5.1%)                                  2020: 55>64 yrs
    • Comment: Only <25 spent less. The 55>64 yr-olds finished a surprising 2nd with a $1.7B, +63% increase.
  • Generation – No flips/repeats. After 3 consecutive years of winning, Millennials were replaced at the top by Gen X.
    • Winner – Gen X – Supplies: $9.40B; Up +$3.91B (+71.2%)                                                          2020: Millennials
    • Loser – Gen Z – Supplies: $0.50B; Up $0.10B (+25.4%)                                                                2020: Baby Boomers
    • Comment – All generations spent more. Baby Boomers, +$2.31B and Millennials, +$2.30B essentially finished in a tie for 2nd The Silent Generation (Born <1946) then came in a distant 4th, +$0.13B.
  • CU Composition – Married, Oldest Child 6>17 held on to the top spot.
    • Winner – Married, Oldest Child 6>17 – Supplies: $5.89B; Up $3.53B (+149.4%)                       2020: Married, Oldest Child 6>17
    • Loser – Married, + Other Adults – Supplies: $0.93B; Up $0.14B (+17.7%)                                   2020: Married, Couple Only
    • Comment – All CU types – with or without children spent more. CUs with children (27.1%) accounted for $4.4B, 50.9% of the increase while CUs without children (62.9%) accounted for $4.2B, 49.1%.
  • # in CU – 2 People flipped from last to 1st but all sizes spent more than in 2020.
    • Winner – 2 People – Pet Supplies Spending: $8.34B; Up $2.91B (+53.6%)                                  2020: 5+ People
    • Loser – 3 People – Pet Supplies Spending: $3.27B; Up $0.87B (+36.3%)                                      2020: 2 People
    • Comment: 5+ CUs finished 2nd +$2.37B, +117%. They more than doubled Supplies spending and are the only segment with increases in 2020 & 2021. 3 People finished last in $ but Singles had the lowest % increase, +28%.
  • Occupation – Managers & Professionals held their spot at the top.
    • Winner – Managers & Professionals – Supplies Spending: $7.79B; Up +$2.13B (+37.7%)           2020: Mgrs/Profess.
    • Loser – Operators & Laborers – Supplies Spending: $0.64B; Up $0.15B (+30.7%)                         2020: Retired
    • Comment – Only Managers & Professionals and Self-Employed spent more in both 2020 & 2021. In 2021 all Occupations, including Retirees, spent more on Supplies.

We’ve now seen the winners and losers in Pet Supplies Spending $ for 12 Demographic Categories. In 2020, only 18 of 96 segments spent more and 1 category had no segments with an increase. In 2021, 93 segments spent more, and 9 categories had no segments that spent less. In performance, there were no surprise winners and 10 of 12 were the same as 2020. All of the winners were either 1st or 2nd in CU income for segments in their category, which reflects the importance of income in Supplies spending. However, not every good performer can be “the” winner and some of these “hidden” segments should be recognized for their performance. They don’t win an award, but they deserve…

Honorable Mention

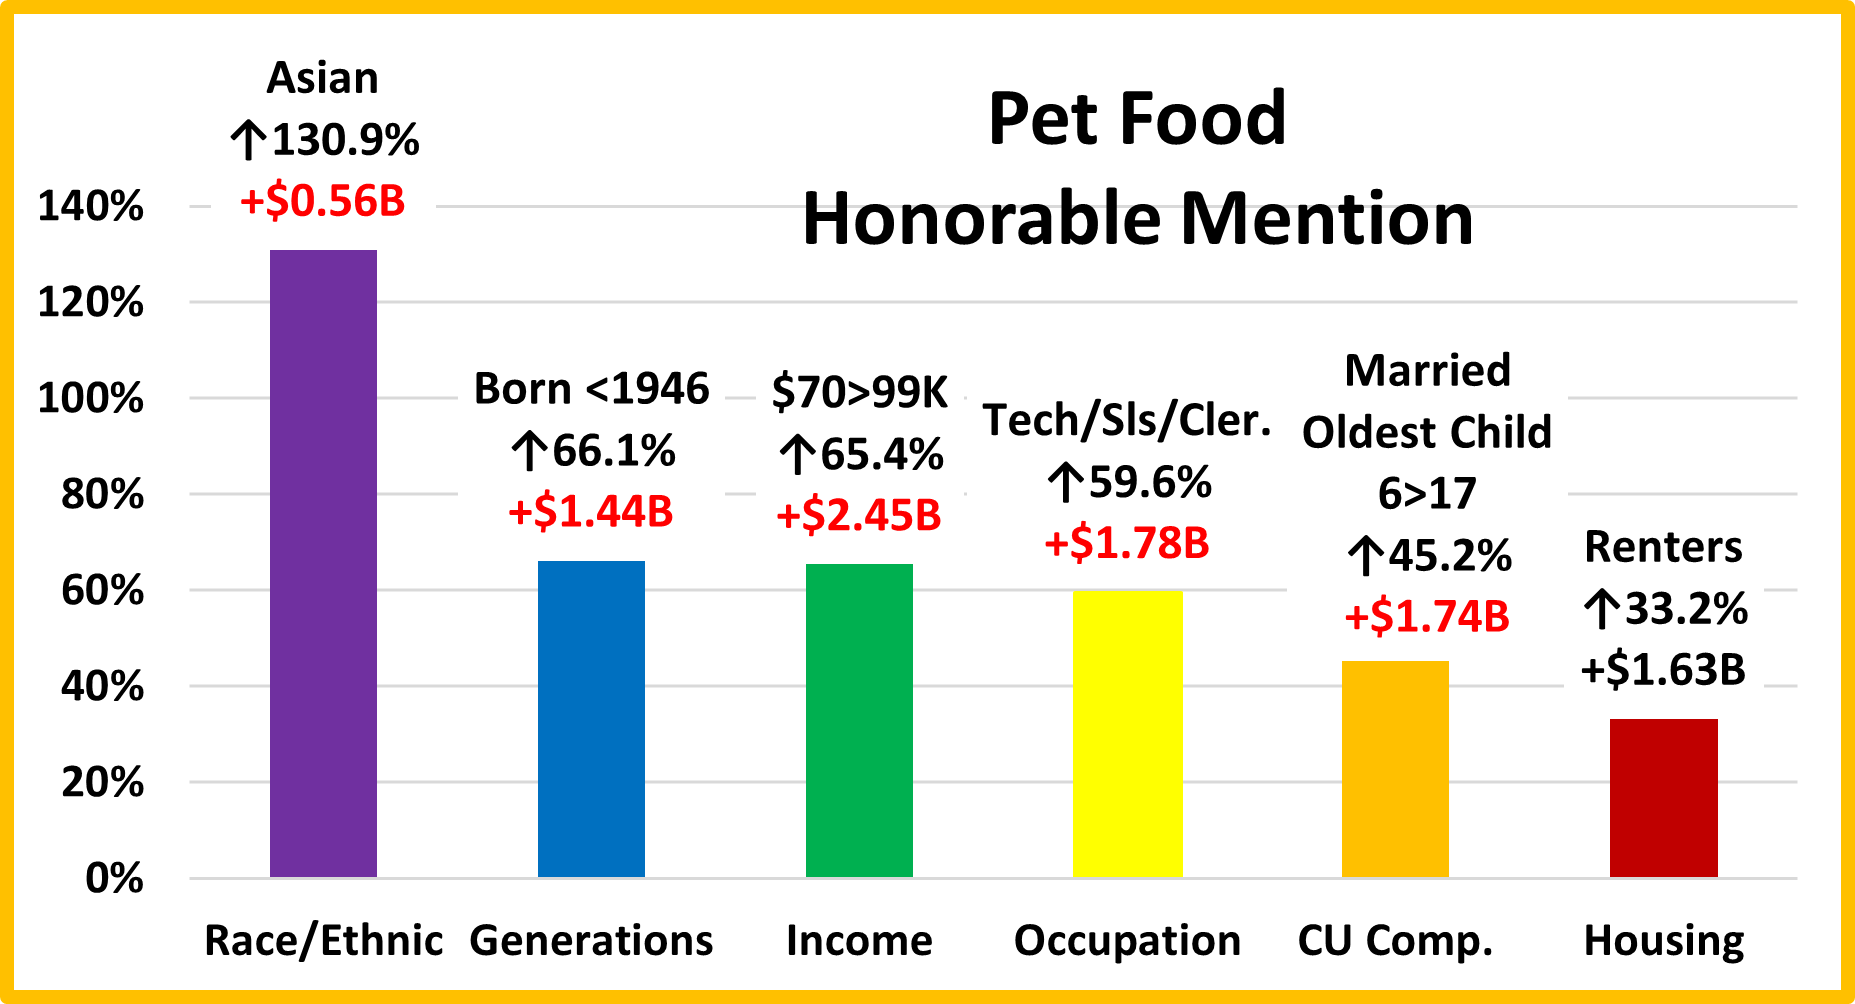
In 2019, all numbers from these segments were negative. In 2020, 5 were positive. Now, in the spectacular 2021, the worst performer was up over 53%. Some are unexpected and again it is an eclectic mix. Asian Americans have a high income but a low percentage of households with pets. They doubled the $ spent on Supplies. Supplies $ are usually tied to Marriage & Kids but Unmarried Adult 2+ CUs spent $1.6B more. Supplies spending has increasingly skewed younger but 2021 was a strong year for 55>64, mostly young Boomers. Homeowners “rule” Supplies spending but Renters spent over $2B more in 2021. 2020 was the year of “bosses”, but 2021 brought a widespread lift. This included a $1.3B lift from lower-level White Collar workers, Tech/Sls/Clerical. Gen X was the leader in 2021 Pet Spending, but Millennials are still a major player, especially in Supplies where they had a $2.2B, 53% increase. 2021 was arguably the best year in history for the Supplies Segment. We have selected these 6 segments for Honorable Mention but 93 of 96 demographic segments spent more on Supplies in 2021. This group probably should have a lot more members.

Summary

While Pet Food spending has shown a definite pattern, Pet Supplies have been on a roller coaster ride since 2009. Many Supplies categories have become commoditized and react strongly to changes in the CPI. Prices go up and spending goes down…and vice versa. Supplies spending has also been reactive to big spending changes in Food. Consumers spend more to upgrade their Food, so they spend less on Supplies – trading dollars. We saw this in 2015. In 2016 the situation reversed. Consumers value shopped for Food and spent some of the “saved” money on Supplies.

That brought us to 2017. Both Supplies and Food prices deflated while the inflation rate in both of the Services segments dropped to lows not seen in recent years. Value was the “word” and it was available across the market. Perhaps the biggest impact was that the upgrade to super premium Food significantly penetrated the market. This could have negatively impacted Supplies Spending, but it didn’t. Supplies’ spending increased in 93% of all demographic segments.

2018 started out as expected with a $1B increase in Supplies and a small lift in Food. Then the government got involved. In July the FDA issued a warning on grain free dog food and spending dropped over $2B. New tariffs were implemented on Supplies and spending flattened out then turned down $0.01B in the 2nd half. The full retail impact of Tariffs hit home in 2019 when spending fell -$2.98B, affecting 97% of all demographic segments.

In 2020 The pandemic caused consumers to focus on needs. That resulted in big spending lifts for Food and Veterinary and big drops in Supplies and Services. Pet Parents traded $. Some good news was that Supplies spending became more balanced. The performance gap between best and worst narrowed by 10.25%.

That brought us to 2021. The overall Retail Market strongly recovered but with no replication of the 2020 buying binge Pet Food $ dropped. In the Supplies segment, the pent-up buying desires of Pet Parents were unleashed. They bought all the Supplies items that had been on purchase “hold” for the last 2 years. The result was the biggest spending increase in history, over twice the size of the previous best. In fact, the $8.65B lift was larger than the annual Supplies spending for all years prior to 2003. While the bulk of the $ increase came from higher income groups the lift was truly widespread as 97% of all demographic segments spent more on Supplies. Prices are still important in Supplies Spending. They remained low throughout 2021 then skyrocketed to record highs in 2022. We’ll see how or if this impacted spending.

Finally – The “Ultimate” Pet Supplies Spending CU consists of 5 people – a married couple, with an oldest child 6>17. They are 35>44 yrs old. They are White, but not of Hispanic origin. They both work and at least one has an Advanced College Degree and is a Manager or Professional. They’re doing well with an income over $200K. They live in a small suburb in the Western U.S. and are still paying off the mortgage on their home.

Retail Channel Monthly $ Update – November Final & December Advance

By 2021, the market had generally recovered from the impact of the pandemic. In 2022, we are being hit by extreme inflation, with rates higher than we have seen in 40 years. Obviously, this can affect retail sales, so we’ll continue to track the retail market with data from two reports provided by the Census Bureau and factor in the CPI from US BLS.

The Census Bureau Reports are the Monthly and the Advance Retail Sales Reports. Both are derived from sales data gathered from retailers across the U.S. and are published monthly at the same time. The Advance Report has a smaller sample size so it can be published quickly – about 2 weeks after month end. The Monthly Final Report includes data from all respondents, so it takes longer to compile the data – about 6 weeks. Although the sample size for the Advance report is smaller, the results over the years have proven it to be statistically accurate with the final monthly reports. The biggest difference is that the full sample in the Final report allows us to “drill” a little deeper into the retail channels.

We begin with the Final Report for November and then go to the Advance Report for December. Our focus is comparing 2022 to 2021 but also YTD 2019. We’ll show both actual and the “real” change in $ as we factor inflation into the data.

Both reports include the following:

  • Total Retail, Restaurants, Auto, Gas Stations and Relevant Retail (removing Restaurants, Auto and Gas)
  • Individual Channel Data – This will be more detailed in the “Final” reports, and we fill focus on Pet Relevant Channels

The information will be presented in detailed charts to facilitate visual comparison between groups/channels of:

  • Current Month change – % & $ vs previous month
  • Current Month change – % & $ vs same month in 2021
    • Current Month Real change – % vs same month in 2021 factoring in inflation
  • Current YTD change – % & $ vs 2021
    • Current YTD Real change – % vs 2021 factoring in inflation
  • Current YTD change vs 2019 – % & $
    • Current Real change YTD vs 2019 – % factoring in inflation
  • Monthly & YTD $ & CPIs which are targeted by channel will also be shown. (CPI details are at the end of the report)

First, the November Final. Only Relevant Retail and Total were up from last month but all were up for November & YTD vs 2021. However, considering inflation, only Restaurants and Gas Stations were up for the month and YTD, only Restaurants were up. Here is the November data for the major retail groups. (All $ are Actual, Not Seasonally Adjusted)

The November Final is $1.8B less than the Advance. Relevant Retail had the only positive: +$0.3B; Restaurants: -0.8B; Auto: No Change; Gas Stations: -$1.3B. Sales are up from last month and consumers continue to spend more vs 2021. However, the “real” numbers vs 2021 tell a slightly different story. Only Restaurants and Gas Stations are really up for the month but again only Restaurants are really up in YTD $. Auto & Gas Stations also remain really down YTD vs 2019. The inflation impact on Relevant Retail is significant and concerning. Their Real YTD $ales vs 2021 have been negative for 8 straight months. They do have the best performance since 2019 as 60.9% of their 32.2% growth is “Real”.

Now, let’s see how some Key Pet Relevant channels did in November

Overall – 6 of 11 were up from October. Vs Nov 2021, 9 reported more $ but only 3 were really up. In YTD vs 2021, 10 reported increases but only 4 were real. Vs 2019, Discount Dept Stores are the only “real” negative. In Sep & Oct all were up.

  • Building Material Stores – Sales are down vs Oct for Home Ctr/Hdwe, but up 7.2% YTD vs 21. Farm stores are -8.5% vs Oct but +11.7% vs Nov 2021. YTD sales are +6.0%. The Bldg/Matl group has a YTD inflation rate of 10.9% which has produced negative real numbers. The pandemic caused consumers to focus on their homes which has produced sales growth of 36.6% since 2019. Importantly, 55% of this lift was real, primarily because the bulk of the lift came from 20>21, prior to the inflation wave. Avg Growth Rate: HomeCtr/Hdwe: 10.8%, Real: 6.2%; Farm: 12.2, Real: 7.7%
  • Food & Drug – Both channels are truly essential. Except for the pandemic food binge buying, they tend to have smaller fluctuations in $. However, they are radically different in inflation. The YTD rate for Grocery products is 4 times higher than for Drugs/Med products. Drug Store $ are down from October but positive in all other measurements and 88% of their growth since 2019 is real. The Real Sales for Supermarkets are down for the month & YTD. Also, only 14% of their growth since 2019 is real. Avg Growth Rate: Supermarkets: +6.8%, Real: +1.0%; Drug Stores: +4.9%, Real: +4.3%.
  • Sporting Goods Stores – They also benefited from the pandemic in that consumers turned to self-entertainment, especially sports & outdoor activities. Sales are up 6.2% from October but down vs 2021. YTD sales are still 1.5% above 2021. Their current inflation rate is 2.7% which is down from 7.5% in April but YTD it is still 5.4%. It was even higher in 20>21, +6.5%. However, 72% of their 48% lift since 2019 is real. Their Avg Growth Rate was: +14.0%; Real: +10.4%.
  • Gen Mdse Stores – All channels were up from October and only Discount Dept Stores were down for the month and YTD vs 2021. All real numbers for all channels monthly and YTD vs 2021 are negative. Disc. Dept Stores were hurting before COVID and their YTD sales are again “really” down vs 2019. The other channels have 37% real growth. Avg Growth Rate: SupCtr/Club: 5.9%, Real: 2.1%; $/Value Strs: +7.8%, Real: +4.2%; Disc. Dept.: +2.6%, Real: -0.1%
  • Office, Gift & Souvenir Stores – Their recovery didn’t start until the spring of 2021. Sales are down 30% from October and Real Sales are down vs November 2021 but their 2022 sales growth has been strong enough to make them positive in all other measurements vs 2021 & 2019. They have made remarkable progress. Avg Growth Rate: +3.3%, Real: +0.6%
  • Internet/Mail Order – Sales are up 18% from October and set a new monthly record. They are positive for all other measurements, but their YTD growth rate is only half of their average since 2019. However, 89% of their 78.9% growth since 2019 is real. Avg Growth Rates: +21.4%, Real: +19.4%. As expected, they are by far the growth leaders since 2019.
  • A/O Miscellaneous – This is a group of specialty retailers. Pet Stores are 22>24% of total $. In May 2020 they began their recovery which reached a record level by December 2021 as annual sales reached $100B for the first time. Their sales dipped in January, July, Sept>Nov but all measurements have been positive for every other month. In 2022, they are by far the Sales increase leaders over 2021. Plus, 85% of their 56.4% growth since 2019 is real. Average Growth Rate is: +16.7%, Real: +14.6%. They are 2nd in growth since 2019 to the internet. I’m sure Pet Stores are helping.

There is no doubt that high inflation is an important factor in Retail. In actual $, 9 channels reported increases in monthly $ and 10 in YTD $ over 2021. When you factor in inflation, the number with any “real” growth falls to 3 for monthly & 4 for YTD. This is a clear indication of the ongoing strong impact of inflation at the retail channel level. Recent data indicates that Inflation again slowed a little. Let’s look at the impact on the Advance Retail $ales for December.

We have had memorable times since 2019. Some big negatives, including the 2 biggest monthly drops in history but a lot of positives in the Pandemic recovery. Total Retail reached $600B in a month for the first time and broke the $7 Trillion barrier in 2021.  Relevant Retail was also strong as annual sales reached $4T and all big groups set annual $ales records in 2021. In 2022 radical inflation is a big factor with the largest increase in 40 years. At first this reduces the amount of product sold but not $ spent. Only Gas Stations were down from Nov, but all groups were up vs December & YTD 2021. However, in the amount of product sold: Monthly: Only Relevant Retail was down. YTD: All were down but Restaurants.

Overall – Inflation Reality December inflation vs 2021 fell below the $ increase rate. Gas Stations were down vs Nov, but all are up for the month and YTD vs 2021. When you factor inflation into the data, all but Relevant Retail are really up for the month vs 2021. However, the real YTD sales vs 2021 are down for all but Restaurants for the 9th straight month.

Total Retail – Every month in 2022 has set a monthly sales record. December $ are $749.4B, a new all-time record. 2022 has become somewhat normal as sales dipped in September then grew in Oct>Dec. December $ are +7.8% vs November, +5.3% vs December 2021 and +9.2% vs YTD 2021. However, when you factor in inflation, monthly sales are up +0.5% but YTD sales are down for the 10th consecutive month. Plus, only 39% of the 31.5% growth since 2019 is real. Avg Growth Rate: +9.6%, Real: +3.9%. Even as inflation slows, it continues to have an impact.

Restaurants – They were hit hard by the pandemic and didn’t truly start to recover until March 2021. Sales in the last 9 months of 2021 exceeded $70B and 2021 was the biggest year in history, $876B. January sales fell from December but then turned up, setting new all-time monthly records in March>May. $ fell in June, set a new record in July and then fell again in Aug>Sep. October sales hit $90B for the 1st time, fell in November, then rose in December. They are the only big group that is positive in all measurements vs 2021 & 2019. Inflation slowed to 8.2% for December from 8.4% last month. However, it remains 7.5% YTD. 55.2% of their 32.4% growth since 2019 is real. Avg Growth Rate: +9.8%, Real: +5.6%. They only account for 12.7% of Total Retail $ales, but their performance helps to improve the overall retail numbers.

Auto (Motor Vehicle & Parts Dealers) – This group actively worked to overcome the stay-at-home attitude with great deals and a lot of advertising. They finished 2020 up 1% vs 2019 and hit a record $1.48T in 2021. In 2022 sales got on a rollercoaster – Jan down, Feb/Mar up, Apr>May down, then flipping monthly with December being up. They have 4 down months in actual sales which are the only reported sales negatives by any big group vs 2021. This is bad but their real YTD sales numbers are much worse. Extremely high inflation has pushed their real YTD sales down -8.1% vs 2021, the worst of any group. Plus, their 23.8% growth since 2019 is really down -7.7%. Avg Growth: +7.3%, Real: -2.6%. Inflation slowed for 6 months then prices deflated in December. The 4 drops in $ales were tied to high inflation.

Gas Stations – Gas Stations were also hit hard. If you stay home, you drive less and obviously need less gas. This group started recovery in March 2021 and reached a record $584B for the year. Sales fell Jan>Feb, turned up Mar>Jun, fell in Jul>Sep, up in Oct then down in Nov>Dec. They have the biggest increases vs 2021 and 2019 but it is not reality. Gasoline inflation slowed then deflated -0.9% in December. However, it is 32.1% YTD. Monthly real sales are again positive, but YTD sales are still really down -2.2% vs 2021 and -2.5% vs 2019. Avg Growth Rate: +13.9%, Real: -0.9%. The YTD numbers show a big impact of inflation. Consumers spend more but buy less, even less than they bought 3 years ago.

Relevant Retail – Less Auto, Gas and Restaurants – This the “core” of U.S. retail and accounts for 60+% of Total Retail $. This group has a variety of channels, so they took many different paths through the pandemic. However, their only down month was April 2020. They finished 2020, up +7.1% and 2021 got even better as they reached a record $4.50T. They have led the way in Total Retail’s recovery which became widespread across the channels. Sales fell in Jan>Feb, went on an up/down roller coaster from Mar>Oct, then grew in Nov & Dec. All months in 2022 set new records with a new all-time high in December, $482B, and an annual record of $4.81T. However, their YTD increase is 28% below their 9.6% avg growth since 2019. Now, we’ll look at the impact of inflation. 59.7% of their 31.8% growth since 2019 is real. However, real sales vs 2021 are down -2.3% for the month and -1.2% YTD. This shows that inflation is only a 2022 problem. Their Avg Growth Rate: +9.6%, Real: +6.0%. The performance of this huge group is critically important. This is where America shops. Real annual sales are down 1+% so consumers bought less than in 2021. They just paid more. That’s not good.

Inflation is slowing slightly but the impact is still there. All groups but Restaurants have no YTD (annual) real growth vs 2021 and Auto & Gas Stations are still “really down” vs YTD 2019. We’ve now had 10 straight months of real YTD drops for Total Retail and 9 straight for Relevant Retail. We are still in Inflation Phase II. Consumer spending grows but the amount bought declines. Inflation slowed markedly for Auto & Gas Stations and prices even deflated in December, so they have avoided Phase III, when consumer spending drops. We hope that this pattern is repeated in Relevant Retail.

Here’s a more detailed look at December by Key Channels

  • Relevant Retail: Avg Growth Rate: +9.6%, Real: +6.0%. 9 of 11 channels were up from November and 8 were up vs December 2021, but 10 were up YTD vs 2021. The negative impact of inflation is less but still there in the “real” data.
  • All Dept Stores – This group was struggling before the pandemic hit them hard. They began recovery in March 2020. They are up 33% from November but down vs December 2021. Their YTD actual $ are down vs 2019. They were positive Apr>Nov. They are still “really” down in all measurements vs both 2019 & 2021. Avg Growth: -0.1%, Real: -3.1%.
  • Club/SuprCtr/$ – They fueled a big part of the overall recovery because they focus on value which has broad consumer appeal. Inflation is a big factor in their current numbers. Sales are up from November and vs 2021. Their real numbers are all down vs 2021 and only 36.2% of their 19.6% lift from 2019 is real. Avg Growth: +6.2%, Real: +2.3%.
  • Grocery- These stores depend on frequent purchases, so except for the binge buying in 2020, their changes are usually less radical. Inflation has hit them hard. $ are up from November. The increases vs 2021 are strong but inflation is stronger. Real sales are down and only 13.1% of the growth since 2019 is real. Avg Growth: +6.9%, Real: +1.0%.
  • Health/Drug Stores – Many stores in this group are essential, but consumers visit far less frequently than Grocery stores. Sales are up from November but are really down vs Dec 2021. All other measurements vs 2019 & 2021 are positive. Their inflation rate is low so 89% of their 16.4% growth from 2019 is real. Avg Growth: +5.2%, Real: +4.6%.
  • Clothing and Accessories – They were nonessential, and clothes mattered less when you stayed home. That changed in March 2021 with strong growth through May 2022. December sales are +41% from November and +3.5% from 21. For the 1st time in 2022, all measurements are positive. 84% of their 2019>22 growth is real. Avg Growth: +5.0%, Real:+4.3%
  • Home Furnishings – Sales dipped Mar>May in 2020. Then as consumers’ focus turned to their homes, furniture became a priority. Inflation has been high. Monthly Sales are -0.7% vs 2021 and only up 1.0% YTD. All of their real numbers vs 2021 are very negative. Only 11.1% of their growth since 2019 is real. Avg Growth: +5.9%, Real: +0.7%.
  • Electronic & Appliances – This channel has many problems. Sales fell in Apr>May of 2020 and didn’t reach 2019 levels until March 2021. Sales are up +14.6% from November but down vs 2021. Deflation pushed their real December sales up +1.8%. Their sales are even down vs 2019 – both actual and real. Avg Growth: -1.0%, Real: -0.15%.
  • Building Material, Farm & Garden & Hardware –They truly benefited from the consumers’ focus on home. This year’s spring lift ended in May. Sales fell in Nov>Dec after a slight lift in October. Monthly & YTD sales are up vs 2021, but when you factor in double-digit inflation, the real amount sold is down for both measurements. However, 54.0% of their strong 36.5% sales growth since 2019 is real. Their Avg Growth is: +10.9%, Real: +6.2%.
  • Sporting Goods, Hobby and Book Stores – Consumers turned their attention to recreation and Sporting Goods stores sales took off. Book & Hobby Stores recovered more slowly. December $ jumped +30.4% from November and are ahead of 2021, monthly & YTD. However, real YTD $ are still down vs 2021. Inflation in this group is lower than most groups and most comes from Sporting Goods. 78.7% of their 39.0% growth since 2019 is real. Avg Growth: +11.6%, Real: +9.3%.
  • All Miscellaneous Stores – Pet Stores have been a key part of the strong and growing recovery of this group. They finished 2020 +0.9% but sales took off in March 21 and have continued to grow. December sales are +5.2% from November and up vs 2021. Since April they have held the top spot in YTD increase vs 2021. Their YTD growth since 2019 is 2nd only to NonStore and 80% of the 42.2% growth since 2019 is real. Their Avg Growth is: +16.1%, Real: +13.9%.
  • NonStore Retailers – 90% of their volume comes from Internet/Mail Order/TV. The pandemic accelerated online spending. They ended 2020 +21.4%. The growth continued in 2021. In December monthly sales exceeded $100B for the 1st time and they broke the $1 Trillion barrier for the year. Their YTD Growth has slowed significantly in 2022 but all measurements are positive. 87.2% of their 71.1% increase since 2019 is real. Their Avg Growth is: +19.6%, Real: +17.5%.

Note: Almost without exception, online sales by brick ‘n mortar retailers are recorded with their regular store sales.

Recap – The Retail recovery from the pandemic was largely driven by Relevant Retail and by the end of 2021 it had become very widespread. In 2022, a new challenge came to the forefront – extreme inflation, the worst in 40 years. Overall, and in most product categories it has slowed in Jul>Dec. On the surface, the Retail impact is almost invisible. Sales in the total market and in the Relevant Retail group continue to grow but the growth rate has markedly slowed compared to last year. Overall, the retail market is generally in phase II of strong inflation – spending grows but the amount purchased falls. December is the traditional peak of the Holiday Shopping season and monthly sales. “How did it go?” The channels most impacted are – Clothing, General Merchandise, Electronics, Nonstore, Sporting Gds and Miscellaneous. These channels produced 63% of Relevant Retail December $ but 82% of the increase from November & the lift from 2021. They were up 6.6% from 2021 and real sales were +2.3%, much better than -2.3% for Relevant Retail. The December lift was smaller than we hoped for, but it still happened. BTW – 59% of the increase came from Nonstore.

Finally, here are the details and updated inflation rates for the CPIs used to calculate the impact of inflation on retail groups and channels. This includes special aggregate CPIs created with the instruction and guidance of personnel from the US BLS. I also researched data from the last Economic Census to review the share of sales by product category for the various channels to help in selecting what expenditures to include in specific aggregates. Of course, none of these specially created aggregates are 100% accurate but they are much closer than the overall CPI or available aggregates.

Monthly CPI changes of 0.2% or more are highlighted. (Green = lower; Pink = higher)

I’m sure that this list raises some questions. Here are some answers to some of the more obvious ones.

  1. Why is the group for Non-store different from the Internet?
    1. Non-store is not all internet. It also includes Fuel Oil Dealers, the non-motor fuel Energy Commodity.
  2. Why is there no Food at home included in Non-store or Internet?
    1. Online Grocery purchasing is becoming popular but almost all is from companies whose major business is brick ‘n mortar. These online sales are recorded under their primary channel.
  3. 6 Channels have the same CPI aggregate but represent a variety of business types.
    1. They also have a wide range of product types. Rather than try to build aggregates of a multitude of small expenditure categories, it seemed better to eliminate the biggest, influential groups that they don’t sell. This method is not perfect, but it is certainly closer than any existing aggregate.
  4. Why are Grocery and Supermarkets only tied to the Grocery CPI?
    1. According to the Economic Census, 76% of their sales comes from Grocery products. Grocery Products are the driver. The balance of their sales comes from a collection of a multitude of categories.
  5. What about Drug/Health Stores only being tied to Medical Commodities.
    1. An answer similar to the one for Grocery/Supermarkets. However, in this case Medical Commodities account for over 80% of these stores’ total sales.
  6. Why do SuperCtrs/Clubs and $ Stores have the same CPI?
    1. While the Big Stores sell much more fresh groceries, Groceries account for ¼ of $ Store sales. Both Channels generally offer most of the same product categories, but the actual product mix is different.

Petflation 2022 – December Update: Price increase slows to +10.9% vs 2021

Inflation continues to make headlines. The YOY increases in the monthly Consumer Price Index (CPI) are larger than we have seen in decades but are slowing a little. December prices fell -0.3% from November. The CPI was still up +6.5% vs 2021, but down from +7.0% last month. The grocery price surge also slowed but they’re still up 11.8% over 2021. That’s 10 straight months of double-digit YOY monthly percentage increases. These are the first 10+% increases since 1981. As we have seen in recent years, even minor price changes can affect consumer pet spending, especially in the discretionary pet segments, so we will continue to publish monthly reports to track petflation as it evolves in the market.

Total Pet prices were 4.1% higher in December 2021 than in December 2020, while the overall CPI was up 7.0%. The gap narrowed as Petflation accelerated and reached 96.7% of the national rate in June. National inflation has slowed since July, but Petflation increased until slowing in December. It passed the National CPI in July and is +10.9% in December, 69.1% higher than the national rate of 6.5%. We will look deeper into the numbers. This and future reports will include:

  • A rolling 24 month tracking of the CPI for all pet segments and the national CPI. The base number will be pre-pandemic December 2019 in this and future reports, which will facilitate comparisons.
  • Monthly comparisons of 22 vs 21 which will include Pet Segments and relevant Human spending categories. Plus
    1. CPI change from the previous month
    2. Inflation changes for recent years (20>21, 19>20, 18>19)
    3. Total Inflation for the current month in 2022 vs 2019
    4. Average annual Year Over Year inflation rate from 2019 to 2022
  • YTD comparisons this month are now annual comparisons since the data is through December
    1. Annual numbers for the monthly comparisons #2>4 above

In our first graph we will track the monthly change in prices for the 24 months from December 2020 to December 2022. We will use December 2019 as a base number so we can track the progress from pre-pandemic times through an eventual recovery. Inflation is a complex issue. This chart is designed to give you a visual image of the flow of pricing. You can see the similarities and differences in patterns between segments and compare them to the overall U.S. CPI. The current numbers plus those from 12 and 24 months earlier are included. I have also added and highlighted in pink the month in which the cumulative inflation since 2019 peaked. This will give you some key waypoints for comparisons.

The pandemic hit home in 2020. In December, the national CPI was only +1.4% and Pet prices were +0.4%. Veterinary and Services prices generally inflated after mid-2020, similar to the overall CPI while Food and Supplies prices generally deflated until late 2021. After that time, Petflation took off. Pet Food prices consistently increased but the other segments had mixed patterns until July 2022, when all increased. In August>October Petflation accelerated, except for a small October dip in Veterinary. In Nov>Dec, Services & Food prices continued to grow while Veterinary & Supplies prices stabilized. However, Total Petflation since December 2019 has been above the National CPI since November.

  • U.S. CPI – The inflation rate was below 2% through 2020. It turned up in January 2021 and continued to grow until flattening out in Jul/Aug 2022. 43% of the overall 15.5% increase since 2019 happened from Jan>June 2022.
  • Pet Food – Prices stayed generally below December 2019 levels from April 2020 to September 2021, when they turned up. There was a sharp increase in December but 91% of the 17.0% increase occurred in 2022.
  • Pet Supplies – Supplies prices were high in December 2019 due to the added tariffs. They then had a “deflated” roller coaster ride until mid-2021 when they returned to December 2019 prices and essentially stayed there until 2022. They turned up in January and hit an all-time high, beating the 2009 record. They plateaued from Feb> May, turned up in June, flattened in July, turned up in Aug>Oct to a new record high, then plateaued in Nov>Dec.
  • Pet Services – Normally inflation is 2+%. Perhaps due to closures, prices increased at a lower rate in 2020. In 2021 consumer demand increased but there were fewer outlets. Inflation grew in 2021 with the biggest lift in Jan>Apr. Inflation was stronger in 2022 but it got on a rollercoaster in Mar>June. It has turned up again July>Dec.
  • Veterinary – Inflation has been pretty consistent in Veterinary. Prices turned up in March 2020 and grew through 2021. A pricing surge began in December which put them above the overall CPI. In May prices fell and stabilized in June. Prices turned up again and despite Oct & Dec dips they have stayed above the National CPI since July.
  • Total Pet – The blending of patterns made Total Pet appear calm. In Dec 2021 prices surged. The segments had ups & downs Mar>Jun but Petflation grew Jul>Nov. It slowed in Dec. but has been ahead of the US CPI since Nov.

Next, we’ll turn our attention to the Year over Year inflation rate change for December and compare it to last month, last year and to previous years. We’ve included some human categories to put the pet numbers into perspective.

Overall, Prices were -0.3% vs November but were up 6.5% vs December 2021. The Grocery increase is down to 11.8% which is still a big negative but there is some positive news. 6 of 9 categories had increases from November but only 1 was over 0.5%. Unfortunately, it was Pet Services. The U.S. CPI rate is slowing and now Petflation is following that lead.

  • U.S. CPI– Prices are -0.3% from November. The YOY increase is +6.5%. It peaked at +9.1% in June. The targeted inflation rate is <2% so we are still over 3 times higher than the target. However, a 6th slight decline is good news.
  • Pet Food– Prices are +0.4% vs November and 15.2% vs Dec 21. They are also 29% higher than the Food at Home inflation rate – not good news! The YOY increase is being measured against a time when prices were only 1.8% above the 2019 level, but that increase is still 4.5 times the pre-pandemic 3.4% increase from 2018 to 2019.
  • Food at Home – Prices are up 0.3% from November. The increase from 2021 is 11.8%, down slightly from 12.0% last month. Inflation for this category since 2019 is the highest on the chart and is 53% more than the national CPI.
  • Pets & Supplies – Prices are up only +0.1% from November, but that is a big turnaround from -0.4% last month. They still have the lowest increase since 2019 but have the 3rd highest monthly increase vs 2021 for Pet Segments.
  • Veterinary Services – December prices fell -0.4% from November. They are +8.8% from 2021 and trail only Food in the Pet Industry. They also remain 2nd in the increase since 2019 with 18.1% compared to Food at home at 23.7%.
  • Medical Services – Prices turned sharply up at the start of the pandemic but then inflation slowed and fell to a low rate in 20>21. In December prices were stable but +4.1% vs 2021. However, this is still 20% below the 2018>19 rate.
  • Pet Services – Inflation slowed in 2020 but began to grow in 2021/22. December prices were up +0.6% from November, the biggest increase on the chart, and +7.5% vs 2021, reaching yet another new record high.
  • Haircuts & Other Personal Services – Prices are +0.3% from Nov. and +6.3% from 2021. They are +16.9% since 2019.
  • Total Pet– Petflation is strong, 2.7 times the rate of last year and is 69.1% ahead of the National CPI. A drop by Veterinary flattened prices in December. Inflation is becoming more balanced, but Food is still the runaway leader. Inflation can cause reduced purchase frequency in Supplies, Services and Veterinary. Super Premium Food has been generally immune as consumers are used to paying a lot and it is needed every day. We’ll see if consumers are willing to pay the new high prices for food and buy the more discretionary products/services at the same frequency.

Since it is December, YTD Inflation = Annual Inflation. How does 2022 compare to previous years?

The increase from 2021 to 2022 is the biggest for 8 of 9 categories. The average annual increase since 2019 is 3.6% or more for all but Pet Supplies. This is largely due to high prices in 2019 and deflation in 2020 and the 1st half of 2021.

  • U.S. CPI – This year’s increase is 74% above the average increase from 2019>2022, but over 3 times the average annual increase from 2018>2021. Inflation is a big problem that started near the end of 2021 and worsened in 2022.
  • Pet Food– 10.2% Inflation in 2022 was 2nd only to 11.1% in 2008. It was magnified by deflation in the 1st half of 2021.
  • Food at Home – The 2022 inflation beat the U.S. CPI by 43%. You can see the impact of supply chain issues.
  • Pets & Pet Supplies – +7.7% set a new annual inflation record in 2022. Although the 2021>22 increase is being measured against a relatively “flat” 2021, it is very significant and just behind Food & Veterinary in the Pet Industry.
  • Veterinary Services – +8.8% was also a new annual record. Veterinary trails only Food at Home in inflation since 2019 and is the only segment on the chart with a 3+% inflation rate each year through the pandemic and recovery.
  • Medical Services – Prices went up significantly at the beginning of the pandemic, but inflation slowed in 2021. In 2022 prices surged but have now slowed. However, the inflation rate is still 23% higher than pre-pandemic 2018>19.
  • Pet Services – May set a record for the biggest YOY monthly increase in history. Prices fell in June but began to grow again in July, reaching record highs in Sep>Dec. In fact, December broke the May increase record. The 2022 annual increase of 6.3% is the largest in history. Growing demand with decreased availability is a formula for inflation.
  • Haircuts & Personal Services – The services segments, essential & non-essential were hit hardest by the pandemic. After a small decrease in March, prices turned up again. The 21>22 increase beat 2020>21 and is double the 2018>19 increase. Consumers are paying over 15% more than in 2019. This usually reduces the purchase frequency.
  • Total Pet – We have seen basically two different inflation patterns. After 2019, Prices in the Services segments continued to increase, and the rate accelerated as we moved into 2021. The product segments – Food and Supplies, were on a different path. They generally deflated in 2020 and didn’t return to 2019 levels until mid-year 2021. Food prices began a slow increase, but Supplies remained stable until near yearend. In 2022, Food and Supplies prices turned sharply up. Food prices have continued to climb. Supplies prices stabilized Apr>May, grew Jun>Oct, then flattened in Nov>Dec. The Services segments have had ups & downs but are generally inflating. The net is a 2022 Petflation increase vs 2021 of 8.9%, the biggest in history and even ahead of the high 8.0% National rate.

Petflation slowed in December but is still high. Will it impact spending? Let’s put it into perspective. The 8.9% 2022 increase in Total Pet beat the 7.9% record set in 2009 and is about 6 times more than the 1.5% avg since then. Pet spending continues to move to higher income groups, but the impact of inflation varies by segment. Supplies is the most affected as many categories are price sensitive. Super Premium Food has become widespread because the perceived value has grown. Higher prices generally just push people to value shop. Veterinary prices have strongly inflated for years, resulting in a reduction in visit frequency. Spending in the Services segment is driven by higher incomes, so inflation is less impactful. We’ll just have to wait and see the impact on Pet Spending of continued strong Peflation.

2021 Pet Food Spending was $34.41B – Where did it come from…?

As we continue to drill ever deeper into the demographic Pet spending data from the US BLS, we have now reached the level of individual Industry segments. We will start with Pet Food, the largest and arguably most influential of all. We have previously noted the trendy nature of Pet Food Spending. In 2018 we broke a pattern which began in 1997 – 2 years up then spending goes flat or turns downward for a year. We expected a small increase in 2018 but what we got was a $2.27B decrease (-7.3%). This was due to the reaction to the unexpected FDA warning on grain free dog food. A pattern of 20+ years was broken by 1 statement. The grain free warning lost credibility and spending rebounded in 2019, +$2.35B (+7.1%). In 2020 the market was hit by an even bigger outside influence – the pandemic. The impact varied by segment. In Pet Food, it created a wave of panic buying out of fear of shortages, resulting in a $5.65B (18.1%) lift. The panic buying wasn’t repeated in 2021 resulting in a $2.44B (-6.6%) drop in spending.

First, we’ll see which groups were most responsible for the bulk of Pet Food spending and the $2.44B decrease. The first chart details the biggest pet food spenders for each of 10 demographic categories. It shows their share of CU’s, share of pet Food spending and their spending performance (Share of spending/share of CU’s). 1 group is different from Total Pet – 45>74, as food spending skews slightly older. The categories are presented in the order that reflects their share of Total Pet Spending. There are other differences from Total Pet. First, being Married is more important in Food spending than in Total Pet. Income is the most important factor in both, but the # of earners in a CU matters very little in Pet Food spending. Food spending is also a little more balanced than Total Pet Spending. This is evident in the fact that the Performance of all groups but Homeowners, Married Couples and White, Not Hispanic is significantly lower for Food. Also, Age & # Earners do not reach the 60% targeted market share for Food. In 2020, Pet Food accounted for 70.8% of Pet Products $ and 44.0% of Total Pet. In 2021 the Food share fell to 59.1% in Products and 34.4% of Total Pet. After the Food binge in 2020, Pet Parents caught up on their children’s needs in other industry segments.

  1. Race/Ethnic – White, not Hispanic (84.2%) down from 88.8%. This large group accounts for the vast majority of spending in every segment. They lost share and their performance decreased to 125.4% from 129.9%, but this category moved up from #6 to #4 in terms of importance in Pet Food Spending demographic characteristics. While Hispanics, African Americans and Asian Americans account for 32.8% of U.S. CU’s, they spend only 15.8% of Pet Food $. However, this is up from 11.2% in 2020. African Americans were the only minority to spend less on Pet Food in 2021. Hispanics and Asians spent $1.9B more.
  2. # in CU – 2+ people (79.1%) – down from 82.5%. The share of market for 2+ CU’s is no longer over 80% for Pet Food but is at that high level for Supplies, Services and Total Pet. Their performance fell from 117.5% to 113.8% but their rank increased from 9th to 6th. In a reversal from 2020, 4 & 5+ CUs drove the decrease (-$8B). However, both still performed above 100%. 2 person CUs had a $3.8B lift and 3 Person CUs spent $1B more. Singles also had a $0.8B (+11.7%) increase which was a big factor in the drop in share and performance by 2+ CUs.
  3. Housing – Homeowners (81.0%) – down from 86.7%. Homeownership is a huge factor in pet ownership and pet spending. In 2021, homeowners lost the share gained in 2020 and their performance fell from 131.7% to 125.1%. However, homeownership stayed in 5th place in terms of importance for pet Food spending. Those w/mtge spent $4B more but it was not enough to overcome the $8B drop from those w/o mtge. Renters also had a $1.6B increase.
  4. Area – Suburban + Rural (69.4%) down from 77.8%. Their performance fell from 123.4% to 107.6%. (8th) While the big (2500>) suburbs and center city spent $3.9B more, areas <2500 spent $6.3 less – another big reversal.
  5. Income – Over $70K (63.1%) – down from 65.3%. Their performance rating also fell from 150.2% to 140.9% but they moved from 2nd to 1st in importance. High income is very important in Pet Food Spending but the bar was lowered slightly in 2021. The biggest factor was the $8.9B spending drop by the $100>149K group. They led the way in 2020 binge buying. The $150K> group spent $4.1B more and the $70>99K group had a good year, +$2.5B. In fact, the only other income group besides $100>149K to spend less on Pet Food was $30>49K, -$1B. Pet ownership is common across all income levels but in 2021 higher income is still critically important in Pet Food Spending.
  6. # Earners – “Everyone Works” (57.6%) – down from 70.7%. This was a huge decrease from last year and their performance also fell sharply from 123.3% to 101.7%. They are no longer in the 120+% club and now rank last. No Earner CUs of all sizes spent $3.3B more while 2+ Earner CUs spent $6.5B less. It was a strong year for Retirees.
  7. Education – College Grads (62.4%) – up from 42.1%. Higher Education skyrocketed in importance in Pet Food Spending as college grads had a 50% increase in share and their performance grew from 90.1% to 131.7%. Higher education, specifically a college degree, jumped from last to 3rd in importance in increased Pet Food Spending.
  8. Occupation – All Wage & Salaried Workers (60.5%) – up from 48.1% – Spending by all white collar workers took off while it dropped sharply for self-employed. Their performance grew from 78.2% to 102.0% and they replaced the “Bosses” in the list of big groups. However, the new group caused occupation to fall from #1 to #9 in importance.
  9. CU Composition – Married Couples (64.8%) – down from 71.1%. They lost share and their performance fell from 146.6% to 136.8%, but they moved up from 3rd to 2nd. In Married segments, only Couples Only and those with an oldest child 6>17 years old spent more. Singles and all adult, unmarried CUs also increased spending by $1.6B.
  10. Age – 45>74 (56.5%) – down from 68.6%. This older group replaced 35>64 yr-olds in 2020. Their performance fell from 132.2% to 110.3% and they fell from 4 to 7 in importance. 45>64 is in both groups. The change stayed in place because the 65>74 share is 17.8% while 35>44 is 16.3%. 55>64 was the big driver in the 2020 lift and the 2021 fall.

Only 1 of the big spenders for Pet Food is different from Total Pet. Last year there were 3 special groups. 2021 brought a return to a more normal spending pattern and spending became slightly more balanced. This is best illustrated by the fact that in 2021 the performance for only 5 groups exceeds 120%. Last year there were 8 groups at $120+%, 5 of which had a performance level above 130+%.

Now, we’ll look at 2021’s best and worst performing Pet Food spending segments in each category.

Most of the best and worst performers are the ones that we would expect but 2021 produced one surprise winner – No Earner 2+ CUs, and 1 surprise loser – Suburbs with a population over 2500. There are 10 different winners from 2020 and 5 different losers. This is even more than the total of 10 last year and the 9 new winners this year in Total Pet. This reflects the return to normal after the binge buying in 2020. Changes from 2020 are “boxed”. We should note:

  • Income The Food winner makes slightly less than the winner in other segments and Total Pet but is still over $150K.
  • # Earners – The No Earner, 2+ CUs win reflects a strong year by Retirees, especially the 65>74 yr-old Boomers.
  • Occupation – Mgrs/Professionals & Blue Collar returned to their normal spots, again reflecting income’s importance.
  • Age, Generation- The high income, 45>54 Gen Xers moved to the top. Gen X was the big winner in 2021.
  • Race – The usual winner, but African Americans replaced the traditionally low pet owning Asian CUs at the bottom.
  • Education – Once again having a College Degree and the resulting higher income mattered in Pet Food Spending.
  • Housing – Owning a home is always important. Those with a mortgage returned to their usual place at the top.
  • CU Composition, CU Size – Married, Couples Only and 2 people CUs returned to their “normal” top spots.
  • Region – The West returned to the top and was the only region with 100+% performance.
  • Area – The big suburbs were a surprise loser. Usually, that spot belongs to Center City.

It’s time to “Show you the money”. Here are segments with the biggest $ changes in Pet Food Spending.

There are no repeats from 2020 so all are new. All 12 losers won last year which shows the impact of the 2020 binge. 5 of the winners were 2020 losers. That means that 71% flipped from 1st to last or vice versa. Half of the winners are expected while most losers are not. The Surprise winners are Retirees, No Earner, 2+CUs, Center City, 75+ and Hispanics. The losers that came as no surprise were HS Grads or less, Homeowners w/o Mtge and the Midwest. The biggest surprise was that spending fell -$2.44B while 65% of all demographic segments spent more. Here are the specifics:

  • Housing – The 2020 winner and loser both flipped
    • Winner – Homeowners w/Mtge – Food: $18.77B; Up $4.02B (+27.3%)                                     2020: Homeowners w/o Mtge
    • Loser – Homeowners w/o Mtge – Food: $9.10B; Down $8.09B (-47.1%)                                   2020: Homeowners w/Mtge
    • Comment – Renters also spent more so the Food decrease came solely from Homeowners without a mortgage.
  • Region – Another dual flip.
    • Winner – South – Pet Food Spending: $13.07B; Up $3.88B (+42.2%)                                         2020: Midwest
    • Loser – Midwest – Pet Food Spending: $6.58B; Down $9.14B (-58.1%)                                      2020: South
    • Comment – Last year only the West and Midwest spent more. This year only the Midwest spent less.
  • # in CU – The 3rd dual flip as 2 person CUs return to the top for the 1st time since 2017.
    • Winner – 2 People – Pet Food Spending: $14.57B; Up $3.80B (+35.2%)                               2020: 4 People
    • Loser – 4 People – Pet Food Spending: $4.35B; Down $7.21B (-62.4%)                                 2020: 2 People
    • Comment: Although Singles again had an increase, there was a turnaround from 2020. This year 2 & 3 person CUs spent more while all CUs over 4 spent less – the exact opposite of 2020.
  • Education – Higher education returned to the forefront in importance in Pet Food spending.
    • Winner – BA/BS Degree – Food Spending: $11.07B; Up $3.32B (+42.8%)                                 2020: < HS Grads
    • Loser – HS Grads or less – Food Spending: $4.74B; Down $10.02B (-67.9%)                           2020: HS Grad w/some College
    • Comment – The biggest lift came from those with a BA/BS degree but all segments with any college experience spent more on Pet Food in 2021. Those without a HS diploma binge bought Food in 2020. In 2021 the situation flipped, but in fact all groups with a HS diploma or less spent a lot less on Pet Food, -$10B.
  • Occupation – After 3 years at the top, Self-Employed flipped to the bottom.
    • Winner – Retired – Pet Food Spending: $8.44B; Up $3.16B (+59.8%)                                         2020: Self-Employed
    • Loser – Self-Employed – Pet Food Spending: $2.09B; Down $9.19B (-81.5%)                           2020: Tech, Sales, Clerical
    • Comment – Retirees led the way. However, in wage & salary earners, only Construction Workers/Mechanics spent less. Tech/Sls/Clerical was +$1.8B and Service Workers were +$1.1B.
  • CU Composition – CU’s with children became markedly less important.
    • Winner – Married, Couple Only – Food: $11.60B; Up $2.95B (+34.0%)                                 2020: Married, Oldest Child 18>
    • Loser– Married, Oldest Child 18> – Food: $2.58B; Down $9.16B (-78.0%)                            2020: 2+ Adults, No Kids
    • Comment – Married, oldest child 18> flipped from 1st to last. CUs with an oldest child 6>17 spent more. All other CUs with children, including Single Parents spent less. Adults only was a different story. All adult CUs – Singles & 2+ CUs, married or unmarried – just no kids, spent more on Pet Food.
  • # Earners – The winner and loser flipped leaving a truly surprising segment at the top, No Earner, 2+ People CUs.
    • Winner –– No Earner, 2+ CU – Pet Food Spending: $5.36B; Up $2.88B (+116.1%)                 2020: 2 Earners
    • Loser – 2 Earners – Pet Food Spending: $12.09B; Down $6.19B (-33.8%)                                 2020: No Earner, 2+ CU
    • Comment – All No Earner and 1 Earner CUs of any size spent more on Pet Food in 2021, but all CUs with 2+ earners spent less. Income is important but the number of people earning the money didn’t matter as much.
  • Generation – Boomers and Gen X flipped positions.
    • Winner – Gen X – Pet Food Spending: $11.12B; Up $2.82B (+34.0%)                                           2020: Baby Boomers
    • Loser – Baby Boomers – Pet Food Spending: $11.82B; Down $7.49B (-38.8%)                         2020: Gen X
    • Comment – Much of the 2020 Pet Food spending lift was the Boomers’ emotional reaction to the pandemic. In 2021 we returned to reality with Gen X leading the way. Actually, all generations but Boomers spent more with the Silent Generation (born <1946) having the 2nd biggest increase, +$1.4B.
  • Income – Last year’s binge leader, $100>149K flipped to the bottom while the $150>199K group took the top spot.
    • Winner – $150 to $199K – Pet Food Spending: $4.81B; Up $2.73B (+130.7%)                          2020: $100 to $149K
    • Loser – $100 to $149K – Pet Food Spending: $5.46B; Down $8.92B (-62.1%)                            2020: $70 to $99K
    • Comment – The $30>49K group was the only other segment to spend less. Spending increases were widespread but $150K> was up $4.1B. <$30K: +$0.1B; $50>69K: +$0.9B; $70>99K: +$2.5K; $200K>: +$1.4B.
  • Area Type – Areas <2500 population flipped from 1st to last, with another surprise winner, Center City.
    • Winner – Center City – Pet Food Spending: $10.54B; Up $2.36B (+28.8%)                              2020: Areas <2500
    • Loser – All Areas <2500 – Pet Food Spending: $11.19B; Down $6.35B (-36.2%)                     2020: Suburbs 2500>
    • Comment – The Big Suburbs (2500>) also spent more, and the Center City lift was widespread across America. In fact, only Cities with a population above 5 million spent a little less, -$0.1B.
  • Age – The 55>64 year olds flipped from 1st to last and we had a truly surprising winner, 75+ years old.
    • Winner – 75+ yrs – Pet Food Spending: $3.76B; Up $1.76B (+88.3%)                                         2020: 55>64 yrs
    • Loser – 55>64 yrs – Pet Food Spending: $6.75B; Down $7.89B (-53.9%)                                    2020: 45>54 yrs
    • Comment: In 2020 the 55>64 yr olds drove almost all of the increase. In 2021 they were responsible for all of the decrease as every other age group spent more. The 75+ group won but 35>44 was +$1.2B and 45>54 was +$1.1B.
  • Race/Ethnic – White, Not Hispanics flipped to the bottom and Hispanics had a huge, +62% lift to take the top spot.
    • Winner – Hispanic – Pet Food Spending: $3.43B; Up $1.31B (+62.0%)                                      2020: White, Not Hispanic
    • Loser – White, Not Hispanic – Pet Food Spending: $28.98B; Down $3.74B (-11.4%)            2020: Asians
    • Comment – The U.S. is becoming more racially/ethnically diverse but White, Not Hispanic is still by far the biggest spender in every Pet Industry Segment. In 2021 Pet Food spending became a little more balanced. African Americans spent less on Pet Food but Asians spent a truly amazing 131% more, +$0.6B.

We’ve now seen the “winners” and “losers” in terms of increase/decrease in Pet Food Spending $ for 12 Demographic Categories. In 2020, the big spending lift due to the pandemic occurred in very specific segments. In 2021 those same segments generally had the biggest drops in $. This created an unusual situation. Pet Food spending decreased by -$2.44B while 65% of all demographic segments actually spent more. Most of America remains firmly committed to high quality Pet Food. However, super premium Food comes with high prices, so income is very important in Pet Food spending. The pandemic has accelerated value shopping, especially on the internet. We have identified the winning segments in performance and $ increase but they were not alone. Not every good performer can be a winner. Some “hidden” segments should also be recognized for performance. They don’t win an award, but they get…

Honorable Mention

Asians have a low % of pet ownership, but it is undoubtedly growing as their Pet Food $ more than doubled in 2021. The oldest Americans are generally short on $ but they are committed to their Pets. In 2021, many of them likely committed to Super Premium Pet Foods as their spending increased by 66%. The highest income groups had the biggest increase in spending, but “middle America” also opted in. This is evident by the big lifts from $70>99K and lower-level White Collar workers. Gen Xers had a great year and they are the most likely group to have an oldest child between 6 and 17 years old. Homeownership has always been a key factor in Pet Parenting and Pet Spending, but it is not a necessity. This is made very clear by the 33% increase in Pet Food Spending from Renters.

Summary

Pet Food has been ruled by trends over the years. The drop in 2018 due to the FDA grain free warning broke a pattern of 2 years up followed by 1 year of flat or declining sales which had been going on since 1997. This trendy nature increased with the first significant move to premium foods in 2004. The Melamine crisis in 2007 intensified the pattern and resulted in a series of “waves” which became a tsunami with the introduction of Super Premium Foods.

The 25 to 34 yr old Millennials were the first to “get on board” with Super Premium in the 2nd  half of 2014. In 2015 a substantial portion of consumers began to upgrade. The result was a $5.4B spending increase. These consumers were generally more educated and had higher incomes. One negative was that they often paid for the upgrade by spending less in other segments. In 2016 the anticipated drop in spending happened. The upgraded group value shopped for their new food and found great deals, especially online. They spent some of the $3B “saved” Food $ in other segments but not enough to make up for the drop in Food. Total Pet Spending was down $0.46B. In 2017 we were ready for a new “wave”. Thanks to a very price competitive market, what we got was a deeper penetration of Super Premium foods. This group of upgraders was mostly middle-income, not college educated and often Blue-collars workers. Most also were in the 55>64 yr-old age group. The result was a $4.6B increase but this time there was no trading $ with other segments.

In 2018 we were “due” a small annual increase in Pet Food. Spending in the 1st half was +$0.25B but then the bottom dropped out as spending fell $2.51B in the 2nd  half in reaction to the FDA warning on grain free dog food. The big decrease in spending came directly from the groups who had fueled the 2017 increase. In fact, 71% of the demographic groups with the biggest change in Pet Food $ switched from first to last or vice versa from their position in 2017.

That brought us to 2019. The impact of the FDA warning faded as there was little evidence to back it up. Pet Parents returned to Super Premium or chose even higher priced options. Supplement $ also grew as the health and wellbeing of their Pet Children remained the #1 priority. Pet Food $ grew $2.35B with 75% of demographic segments spending more. Income and related categories mattered more and Pet Food Spending became a less demographically balanced. In 2020 the Pandemic accelerated this trend. Fear of shortages led to binge buying and a $5.65B increase. This behavior was driven by very specific groups. This spending disparity was manifested in the fact that the performance of 8 of 10 big spending groups exceeded 120% while 49% of all segments spent less.

In 2021, the retail market strongly recovered but the turmoil in Pet Food continued. The 2020 binge buying was unnecessary and didn’t increase usage, so Pet Food spending fell by $2.44B. The 2021 Turmoil exceeded that of 2018 as every segment with the biggest increase in 2020 had the biggest decrease in 2021. The resulting drop in $ hid the fact that 65% of all demographic segments spent more on Pet Food. 2021 was actually a pretty good year for Pet Food.

Finally – 2021’s “Ultimate” Pet Food Spending CU is 2 people – a married couple. They are 45>54 years old and White, but not of Hispanic origin. They both work and at least one has an Advanced College Degree and is a Manager or Professional. They earn $150>$199K but are still paying the mortgage on their house in a small suburb in the West.

2021 Total Pet Spending was $99.98B – Where did it come from…?

Total Pet Spending in the U.S. was $99.98B in 2021, a $16.23B (19.4%) increase from 2020. These figures and others in this report are calculated from data in the annual Consumer Expenditure Survey conducted by the US BLS. 2020 was a year of pandemic turmoil for the industry. Consumers focused on “needs” which caused a spending lift in Veterinary and binge buying of Food. However, the discretionary segments – Supplies and Services, had big decreases in $. The net was a 6.8% in Pet Spending. 2021 was also tumultuous but it was almost all positive. The Food binge couldn’t be repeated so Food $ fell slightly but all other segments had record increases which produced the biggest Pet spending lift in history. 2021 Pet Spending certainly deserves a closer look.

The first question is, “Who is spending most of the $100 billion dollars?” There are of course multiple answers. We will look at Total Pet Spending in terms of 10 demographic categories. In each category we will identify the group that is responsible for most of the overall spending. Our goal was to find demographic segments in each category that account for 60% or more of the total. To get the finalists, we started with the biggest spending segment then bundled related groups until we reached at or near 60%.

Knowing the specific group within each demographic category that was responsible for generating the bulk of Total Pet $ is the first step in our analysis. Next, we will drill even deeper to show the best and worst performing demographic segments/groups and finally, the segments that generated the biggest dollar gains or losses in 2021.

In the chart that follows, the demographic categories are ranked by Total Pet market share from highest to lowest. We also included their share of total CU’s (Financially Independent Consumer Units) and their performance rating. Performance is their share of market vs their share of CU’s. This is an important number, not just for measuring the impact of a particular demographic group, but also in measuring the importance of the whole demographic category in Spending. All are large groups with a high market share. A performance score of 120+% means that this demographic is extremely important in generating increased Pet Spending. I have highlighted the 5 groups with 120+% performance.

The only group change from 2020 is that College Grads gained 12% in share, reached the 60% threshold and replaced Associates Degree>. There were changes in the numbers and rankings and again only 5 made the 120%+ club. Higher Education (College Grads) moved in while Everyone Works dropped out. All Wage Earners gained 4 points in share and 10 points in performance. While it matters less how many people work, higher income remains the single biggest factor and continues to grow in importance in Total Pet Spending.

  1. Race/Ethnic – White, not Hispanic (84.2%) down from 87.3%. This is the 2nd largest group and has the largest share of Pet Spending. Their performance was down from 127.6% to 125.3% and they fell from #3 to #4 in terms of importance as spending became a little more balanced. Although this demographic, along with age, are 2 areas in which the consumers have no control, spending disparities within the group are enhanced by differences in other areas like Income, CU Composition and homeownership. There are also apparently cultural differences which impact Pet Spending. Asian Americans are first in income, education and CU spending. They spent 75% more on pets in 2021 but they’re next to last in Pet Spending as a percentage of total spending – 0.51% vs a national average of 1.12%.
  2. # in CU – 2+ people (80.6%) up from 80.3%. Singles remain the only group with under 100% performance. In 2021, 2 person CUs had the biggest increase and only 4 person CUs spent less. However, this big decrease reduced the share gain and slowed the performance increase of 2+ CUs from 114.4% to 115.9%.
  3. Housing – Homeowners (80.0%) down from 83.3%. Controlling your “own space” is a key to larger pet families and more pet spending. 2021 was a bad year for Homeowners w/o Mtges (-$3.7B) as they did not replicate the binge buying of Food. Overall, Homeowners spent $10.2B more but the group’s performance fell from 126.6% to 123.6% because of a spectacular year by Renters, +43.2%. They stayed in 5th place in importance. The homeownership rate fell from 66% to 65% due to a drop from the older groups. It’s still growing in the younger CUs.
  4. Area – Suburban & Rural (71.8%) up from 71.6% Homeownership is high and they have the “space” for pets. The larger suburbs had a great year but the $ for areas <2500 fell by $1B. This pushed their performance down from 113.6% to 111.4%. Center City had an increase of $4.4B but their performance is the worst at 79.3%
  5. Income – Over $70K (68.2%) up from 64.3%. They gained significant share and their performance grew to 152.3% from 147.9%. CU income is still by far the most important factor in increased Pet Spending. Spending was again on a roller coaster: <$30K: +$1.1B; $30>50K: -$1.9B; $50>100K: +$7.8B; $100>150K: -$4.9B; $150K>: +$14.1B. Higher income is growing more important. The $150K> group has 15.8% of CUs but accounts for 34.0% of Total Pet $.
  6. # Earners – “Everyone Works” (66.4%) down from 70.7%. These are CUs of any size where all adults are employed. They lost share and their performance fell from 123.0% to 117.0%. They dropped out of the 120+% club and are now the 6th most important category. Income is growing in importance but 2021 was also a great year for No Earner CUs. Total Pet spending by Retirees was up 51%.
  7. Education – College Grads (65.6%) up from 52.6%. Higher Education level is usually tied to higher income and Pet spending. It can also be a key factor in recognizing the value in product improvements. 2020 largely threw this history out the window as those with less than a college degree led the way in spending in the necessary segments – Food and Veterinary. 2021 saw a total reversal as higher education again became critical in Pet Spending. In fact, the share for College Grads reached 60% and their performance grew from 112.6% to 138.6%, putting them in the 120%+ club as the 2nd most important factor in Total Pet Spending.
  8. Occupation – All Wage & Salary Earners (63.2%) up from 59.2%. Their performance also grew from 96.3% to 106.5% so they are again “earning their share”. All but Construction Workers spent more on their pets in 2021. Managers and Professionals had the biggest $ increase, +$6B but Service workers led the way in percentage, +88%. Their gains were slowed a bit by the $6B spending increase by Retirees but were helped by an -$8B drop in spending by the Self-Employed.
  9. CU Composition – Married Couples (62.7%) down from 64.7%. With or without children, 2 people, committed to each other, is an ideal situation for Pet Parenting. In 2021, they lost share and their performance fell from 133.4% to 132.4%, dropping them from 2nd to 3rd place in importance. This was entirely due to an -$8B spending drop from Married Couples with a child over 18. This was not unexpected as they binge bought Pet Food in 2020.
  10. Age – 35>64 (60.9%) down from 63.2%. They lost share and their performance fell from 118.4% to 116.2%. This was entirely due to a -$3.2B decrease from 55>64 yr-olds, who also binge bought Food in 2020. All other age groups spent at least 19.6% more so Pet Spending is slightly more balanced and age is 7th in importance.

Total Pet Spending is a sum of the spending in all four industry segments. The “big demographic spenders” listed above are determined by the total pet numbers. The share of spending and performance of these groups varies between segments and in a few cases falls below 60%. We also altered the groups in some segments to better reflect where most of the business is coming from. The pandemic and this year’s recovery caused some turmoil in Pet Spending,

The group performance is a very important measurement. Any group that exceeds 120% indicates an increased concentration of the business which makes it easier for marketing to target the big spenders. Income over $70K is again the clear winner, but there are other strong performers. High performance also indicates the presence of segments within these categories that are seriously underperforming. These can be identified and targeted for improvement. However, 2021 is a little more complicated. Many of the big drops in spending came from segments that binge bought Pet Food in 2020. These big emotional moves, up or down can affect the total group performance. Normal may return in 2022.

Now, let’s drill deeper and look at 2021’s best and worst performing segments in each demographic category

Most of the best and worst performers are just who we would expect but there are 9 winners that are different from 2020. This also indicates a move back towards “normalcy”. Changes from 2020 are “boxed”. We should note:

  • Income is important in Pet Spending, which is shown by the 239.6% performance by the $200K> group and a win by 3 Earners. However, $70>99K also had a strong year. In 2021, all groups over $70K performed at 100+%.
  • Occupation – Mgrs/Professionals & Self-Employed are the only occupations with 100+% performance.
  • Age/Generation – After the 2020 Boomer Food Binge, spending moved towards Gen X with the 35>44/Gen X wins.
  • Region – After 2 years at #2 but still with 100+% performance, the West returned to its normal place at the top.
  • CU Size/Composition – The importance of children was maintained with a win by 5+ People and another win by a group with an Oldest Child over 6. The “magic” CU number moved up again to 5 from 2020: 4, 2019: 3; 2018: 2.
  • Homeowners w/Mtges moved back to their expected spot at the top. In 2020 those w/o mtge beat them by 0.8%.

The “new” and old winners reflect both the move back towards more normal spending patterns and slightly younger CUs. In the next section we’ll look at the segments who literally made the biggest difference in spending in 2021.

We’ll “Show you the money”! This chart details the biggest $ changes in spending from 2020.

An unbelievable amount of turmoil. There are 24 Winners and Losers. Only 1 segment held its spot from 2020 while 17 switched from winner to loser or vice versa. In 7 categories both flipped. Overall, 96% were different from 2020.

  • Housing – The winner and loser flipped positions.
    • Winner – Homeowner w/Mtge – Pet Spending: $54.84B; Up $13.87B (+33.9%)                         2020: Homeowner w/o Mtge
    • Loser – Homeowner w/o Mtge – Pet Spending: $25.15B; Down -$3.66B (-12.7%)                      2020: Homeowner w/Mtge
    • Comment – Homeowners w/Mtge had the biggest gain, but Renters also spent $6B more. The “losing” Homeowners w/o Mtge binge bought Food in 2020.
  • Area Type – Another dual flip.
    • Winner – Suburbs 2500> – Pet Spending: $45.47B; Up $12.86B (+39.4%)                                   2020: Areas <2500
    • Loser – Areas <2500 – Pet Spending: $26.36B; Down -$1.02B (-3.7%)                                          2020: Suburbs 2500>
    • Comment – The Big Suburbs returned to their usual spot at the top. Center City also had a big increase in spending, +$4.4B. The Spending in the Areas with a population under 2500 fell by -$1B. Groups in this area also binge bought Pet Food in 2020. However, the behavior was less widespread in this segment.
  • # in CU – Our 3rd dual flip.
    • Winner – 2 People – Pet Spending: $39.83B; Up $11.40B (+40.1%)                                                 2020: 4 People
    • Loser – 4 People – Pet Spending: $14.72B; Down -$3.16B (-17.7%)                                                  2020: 2 People
    • Comment: 2 people CUs spend the most, 39.8% of all Pet $, and their increase was 4 times larger than any other segment. However, 5+ CUs also had a big, 33% increase. In fact, only 4 People CUs spent less.
  • Race/Ethnic – Our only bit of stability as White, Not Hispanics (84.2% of all Pet $) won again.
    • Winner – White, Not Hispanic – Pet Spending: $84.15B; Up $11.06B (+15.1%)                         2020: White, Not Hispanic
    • Loser – African American – Pet Spending: $3.05B; Down -$0.28B (-8.3%)                                 2020: Asian American
    • Comment – A usual winner, but Hispanics and Asians spent 74+% more. Only African Americans spent less.
  • Education – Another flip – This one definitely produced the expected results. <HS was the only group with a $ drop.
    • Winner – Adv. College Degree – Pet Spending: $32.43B; Up $10.93B (+50.9%)                        2020: < HS Grads
    • Loser – Less than HS Grads – Pet Spending: $1.70B; Down -$9.46B (-84.8%)                           2020: BA/BS Degree
    • Comment – Education’s importance came back to the forefront in 2021. BA/BS finished a close 2nd, +$10.6B.
  • Region – After strong Food binge buying in 2020, the Midwest flipped to last.
    • Winner – West – Pet Spending: $30.32B; Up $10.33B (+51.7%)                                                     2020: Midwest
    • Loser – Midwest – Pet Spending: $18.97B; Down -$6.30B (-24.9%)                                              2020: Northeast
    • Comment – In 2020 the Midwest and West had the only increases in Total Pet $. In 2021 the Midwest had the only decrease. Both the South and Northeast increased Pet Spending by over $6B.
  • Generation – Gen X & Boomers flipped. The Boomers landed at the bottom because of 2020 Food binge buying.
    • Winner Gen X – Pet Spending: $33.62B; Up $9.67B (+40.3%)                                                    2020: Baby Boomers
    • Loser – Baby Boomers – Pet Spending: $32.94B; Down -$1.90B (-5.5%)                                   2020: Gen X
    • Comment – Only Boomers spent less $ as all other groups spent 25% to 77% more on Pets.
  • Income – No surprises here. The $100>149K group was a leader in Food binge buying in 2020.
    • Winner – $200K> – Pet Spending: $20.56B; Up $9.00B (+77.9%)                                                2020: $100 to $149K
    • Loser – $100 to $149K – Pet Spending: $18.50B; Down -$4.87B (-20.8%)                                 2020: $70 to $99K
    • Comment – $150K> provided the biggest lift, +$14.1B, but the low to middle income $50>99K also spent $7.8B more. The only other decrease came from $30>49K, -$1.9B.
  • Age – The 6th Winner and Loser flip. Once again the loser was largely due to 2020 Food spending.
    • Winner – 35>44 yrs – Pet Spending: $21.39B; Up $8.10B (+60.9%)                                            2020: 55>64 yrs
    • Loser – 55>64 yrs – Pet Spending: $20.95B; Down $3.20B (-13.3%)                                           2020: 35>44 yrs
    • Comment: Only 55>64 yr-olds spent less. The increase by the 35>44 yr-olds was more than double the 2nd best but the spending increase was strong and widespread. 25>34, 45>54, 65>74 & 75+ all had increases over $2.5B.
  • CU Composition – Married, Couple Only flipped to the top and yet another 2020 Food Binger flipped to the bottom.
    • Winner – Married, Couple Only – Pet Spending: $28.828; Up $7.62B (+36.0%)                  2020: Married, Oldest Child 18>
    • Loser – Married, Oldest Child 18> – Pet Spending: $8.80B; Down -$8.06B (-47.8%)          2020: Married, Couple Only
    • Comment – The loser was the only type to spend less. Couples Only edged out those with Children 6>17, +$6.9B.
  • Occupation – Self-Employed, one of the top 2020 Food Bingers flipped from 1st to last.
    • Winner –– Retired – Pet Spending: $18.29B; Up $6.18B (+51.1%)                                              2020: Self-Employed
    • Loser – Self-Employed – Pet Spending: $7.78B; Down -$8.08B (-50.9%)                                  2020: Tech, Sales, Clerical
    • Comment– Construction workers also spent less. Retirees narrowly beat Mgrs/Professionals, +$6.02B for the win.
  • # Earners – No flips but a surprise winner, which reflects a strong year by Retirees.
    • Winner – No Earner, 2+CU – Pet Spending: $10.21B; Up $4.56B (+80.9%)                            2020: 2 Earners
    • Loser – 1 Earner, Single – Pet Spending: $12.85B; Up $1.14B (+9.8%)                                    2020: No Earner, Single
    • Comment – 2 Earner CUs finished a strong 2nd, +$3.6B, but all working & nonworking groups spent more in 2021.

We’ve seen the best overall performers and the “winners” and “losers” in terms of increase/decrease in Total Pet Spending $ for 12 Demographic Categories. Now, here are some segments that didn’t win an award, but they deserve….

HONORABLE MENTION

Let’s start with Hispanics. They have 14.7% of CUs but generated 26.5% of the increase. That is significant. Most of the attention also went to higher incomes. Pet Spending appears to be moving that way. The $70>99K income group is absolutely middle income. They had a great year with a 48% (+$5.1B) increase. They are also now performing above 100%, 106.2%. The Northeast had a extra strong recovery, +$6.04B (+47.9%) after a -16% drop in 2020. Renters are often at the bottom of any chart as they have a lower % of Pet ownership. They stepped up in 2021 with a $6.03B (+43.2%) increase. Pet spending is usually about Marriage and Family but it is popular with all groups. You see this from the big lift, +$4.51B (+42.0%) from 2+ adult, unmarried, no kid CUs. Our last group normally gets a lot of publicity, Millennials. However, 2021 generally belonged to their older brethren, Gen X. Millennials also stood strong last year. They have 25.1% of CUs but generated 39.7% of the $ increase.

Summary

To properly review 2021, we must put it into context with recent history. Total Pet Spending reached $78.60B in 2018, a $14.28B, 22.2% increase from 2014. However, it was not a steady rise, Total spending actually fell in 2016 and each segment had at least one down year. There were a number of factors driving both the growth and tumult within the industry. Two big positives were the movement to super premium pet foods and the rapid expansion of the number of outlets offering pet services. On the downside were value shopping, trading $ between segments and outside influences like the FDA dog food warning and tariffs. Pricing, inflation/deflation was also a negative/positive factor in some cases.

In 2019, the industry had another small decrease, -$0.16B (-0.2%) which was largely driven by a huge drop in spending in Supplies caused by Tarifflation. This affected virtually every demographic segment and caused Supplies $ to fall below 2014. Services spending also fell slightly as consumers value shopped. The good news was Pet Food bounced back from the impact of the 2018 FDA warning to reach a new record high. Veterinary $ also increased 2.7%. Unfortunately, this was entirely due to a 4.1% increase in prices. The amount of Vet Services sold actually decreased.

That brings us to 2020 and the Pandemic turmoil. The effect was positive for Food and Veterinary, especially Food. Out of fear of shortages, many Pet Parents binge bought Pet Food. Spending also increased in Veterinary, as consumers focused on their Pets’ needs. The discretionary segments suffered. Supplies prices stayed high so spending continued to decline. Services saw the biggest negative pandemic impact as many outlets were subject to closures and restrictions.

2021 was a new year and brought a change in attitude as the marketplace returned to “normal”. The Food binge buying wasn’t repeated but Pet Parents caught up with all their “children’s” wants and needs. This produced a record increase in Total Pet and all segments but Food. In the best/worst performing segments, Gen X took back the top spot and  spending skewed younger and back to more traditional winners, like Homeowners w/Mtges and Incomes over $200K.

The biggest $ changes saw even more turmoil than in 2020. Only 1 segment held its position, compared to 6 in 2020, while 17 switched from 1st to last or vice versa. 7 winners flipped from last to first, but most were the “usual suspects”. There were only 2 surprise winners – No Earner, 2+CUs & Retirees, which showed that the lift wasn’t just coming from the young. On the “losing” side, 10 segments flipped from 1st to last. This was largely due to the binge buying of Food in 2020, which couldn’t be repeated in 2021. This resulted in only 3 “usual” losers – <HS Grads, African Americans and 1 Earner, Singles. At least the winning side returned to more normal behavior, but we mustn’t forget that the spending surge was widespread. 83% of all 96 demographic segments increased Pet Spending. In 2020 it was only 48%. 1 change is likely to last. The Gen Xers replaced the Boomers at the top. Millennials are in hot pursuit but that change won’t come for a number of years. We will continue our analysis of 2021 Pet $ by drilling deeper down into the individual segments.

But before we go…The Ultimate Total Pet Spending CU in 2021 has 5 people, a married couple with an oldest child 6>17. They are 35>44 yrs-old. They are White, but not Hispanic. They both work. At least one has an advanced college degree and is a Mgr/Professional. They earn $200K+. They still have a mortgage on a house located in the semi-rural West.