Retail Channel Monthly $ Update – December Final & January Advance

Time for our monthly update on U.S. retail sales by channel. The current COVID-19 crisis has caused turmoil in the Retail Marketplace. Consumer spending behavior has changed and continues to evolve. In this report we will track the changes and migration between channels. We will do that with data from two reports provided by the U.S. Census Bureau.

The Reports are the Monthly Retail Sales Report and the Advance Retail Sales Report. Both are derived from sales data gathered from retailers across the U.S. and are published monthly at the same time. The Advance Report has a smaller sample size so it can be published quickly – approximately 2 weeks after month end. The Monthly Final Report includes data from all respondents, so it takes longer to compile the data – about 6 weeks. Although the sample size for the Advance report is smaller, the results over the years have proven it to be statistically accurate with the final monthly reports. The biggest difference is that the full sample in the Final report allows us to “drill” a little deeper into the retail channels.

We will look at the latest release of both reports. We will begin with the Final Retail Report from December and then move to the Advance Retail Report for January. This will allow us to look at both the final numbers for 2020 and do an initial comparison of January 2021 vs 2020.

Both reports include the following:

  • Total Retail, Restaurants, Auto, Gas Stations and Relevant Retail (removing Restaurants, Auto and Gas)
  • Individual Channel Data – This will be more detailed in the “Final” reports and we fill focus on Pet Relevant Channels

The information will be presented in detailed charts to facilitate visual comparison between groups/channels of:

  • Current Month change – % & $ vs previous month
  • Current Month change – % & $ vs same month one year ago.
  • Current YTD change – % & $ vs 2019 (Note: In the January Advance we will compare January 2020 to 2019)
  • Monthly and Year To Date $ will also be shown for each group/channel

First, the December Final. U.S. Retail hit bottom in April then began to recover. December $ were up from November, and still growing vs 2019. Here are the major retail groups. (The Data in all graphs is Actual, Not Seasonally Adjusted)

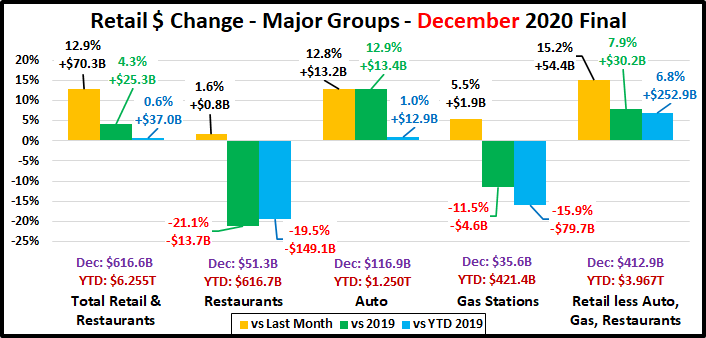
The final total is $3.4B less than the Advance report projected a month ago. All but Gas Stations were down but most of the reduction came from Relevant Retail: -$2.5B; Restaurants: -$0.1B; Auto: -$0.6B; Gas Stations: N/C. All groups were up vs November and set a new record Total Retail $ peak. YTD Total $ales finished more positive vs 2019 thanks to another strong month from Relevant Retail and Auto. The Auto segment finally beat 2019 $, but Restaurants and Gas Stations are down -$229B. Relevant Retail was the driving force in turning Total YTD sales positive vs 2019.

Now, let’s see how some Key Pet Relevant channels were doing in December.

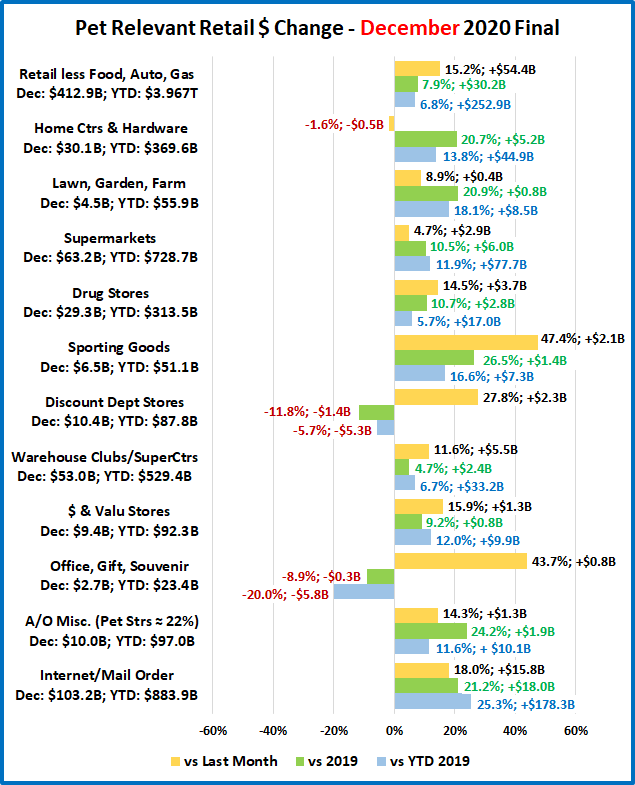
  • Overall– $ in 10 of 11 groups were up vs November and 9 were up vs December 2019 and YTD. That’s very good.
  • Building Material Stores – Their “Spring” lift continued through Summer, Fall and now Winter. While sales peaked in June, they’re still showing double digit % increases vs 2019. Sporting Goods stores are not included in this group, but they have a similar Spring lift pattern. Their sales took off in May, and ultimately hit a record peak in December. In June, their YTD $ vs 2019 turned positive and by yearend they were up 16.6%.
  • Food & Drug – Supermarket $ slowed in Aug, Sep & Nov but turned up in October & December. They finished 2020 up +$77.7B. Drug Stores $ dipped in Aug & Nov but increased in Sep, Oct & Dec. They ended up +$17B.
  • General Merchandise Stores – $ in Clubs/SuperCtrs slowed in September then grew in Oct>Dec. They finished at +$33.2B vs 2019. $ Stores sales slowed from June>Sept but grew in Oct>Dec and ended 2020 +12.0% vs 2019. Discount Dept. store sales were slowing before the pandemic. This trend continues despite their Nov>Dec lift.
  • Office, Gift & Souvenir Stores– A 44% lift after a 28% November drop . A holiday lift but recovery is long way off.
  • Internet/Mail Order – The pandemic has accelerated this channel’s growth vs 2019. $ hit another record peak in December. Many consumers have discovered online shopping and the behavior is likely to become habitual.
  • A/O Miscellaneous – This is a group of small to midsized specialty retailers – chains and independents. It includes Florists, Art Stores and Pet Stores (22 to 24% of total $). Pet Stores were usually essential, but most stores were not. The others began reopening in May. That number grew in June and YTD $ surpassed 2019. Sales have been stable and strong vs 2019 since then and peaked in December. Their 2020 total sales were up +11.6%.

The recovery began in May and accelerated in June>July as even more businesses began to re-open. The Relevant Retail Segment was positive in all measurements in May>July. In Aug>Sept $ slowed but were still strong vs 2019. In Oct>Dec $ turned up and reached a record peak. The key drivers in the positive numbers vs 2019 were the Internet, Supermarkets, SuperCtrs/Clubs/$ Stores and Hdwe/Farm.  Now, how is 2021 starting off? Here are the Advance numbers for January.

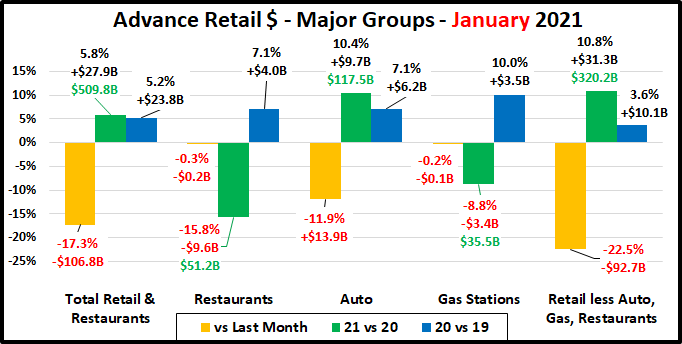
April & May 2020 were the 2 biggest spending drops in history. Then sales began to recover and in October YTD Total Retail turned positive for the 1st time since February. Sales dipped in November but not vs 2019 . In December, Total Retail set a sales record. In January, as expected, $ fell but still set a new record high. All but Gas Stations and Restaurants are up from 2020.

Total Retail – Total Retail spending hit a record $616.6B in December and 2020 finished +$37B vs 2019. As usual, $ plummeted in January but still hit a record $509B, $27.9B ahead of 2020 and $51.7B ahead of 2019. (add the $ changes in the 2 columns to get status vs 2019). Remember, the impact of the pandemic didn’t begin until March 2020.

Restaurants – Spending was basically unchanged vs December but down $9.6B versus 2020, which shows the continuing impact of the pandemic on this group. Last January, $ fell 7% from December but were up 7.1% from 2019. Normally, January and February are the 2 slowest months, but they finished on top last year. Their 2020 totals were down $149B,  -19.5%. Recovery is still a long way off. If 2019 $ are the target for a return to normal, then they are only down $5.6B.

Automobile & Gas Stations – When you are staying home your car becomes less of a focus in your life. Auto Dealers began combating this attitude with fantastic deals and a lot of advertising. Monthly $ turned positive versus 2019 in June and stayed that way, finishing 2020 at +1.0% vs 2019. 2021 started even stronger, +10.4%. Gas Station $ales hit bottom in April and have been up and down ever since. However, sales have remained consistently about 16% below 2019. They finished 2020 -$79.6B (-15.9%). January began down $3.4B but we should note that $ were up $0.1B vs 2019.

Relevant Retail – Less Auto, Gas and Restaurants – Many non-essential businesses shuttered their doors in March but there was a rash of binge/panic buying for “necessities”, especially groceries, which drove spending up $19B. April brought a full month of closures and an end in binge buying, spending dropped $34B from March. In May, the overall market began to reopen so spending began to move in the right direction and growth continued through July. $ales fell in Aug/Sept but turned up again in Oct>Dec, reaching a record $412.9B in December. For 2020, they were up $252.9B, +6.8%. That brought us to January. Sales fell 22.5% (-$92.7B) from December. However, that was less than the 24.5%     (-$93.7B) drop in 2020. So $ are up 10.8%, triple the 3.6% from a year ago and the Relevant Retail group now has posted positive numbers versus last year and YTD for 9 consecutive months. The primary drivers continue to be Nonstore, Grocery, SuperCenters/Clubs/$ Stores plus a radically extended “spring lift” from Hardware/Farm and Sporting Goods.

Now let’s look at what is happening in the individual retail channels. After a record December, relevant retail $ took an expected plunge in January but was still +$31.3B vs 2020. Let’s see where the $ came from. These groups are less defined than in the Final Monthly reports and we will look across the whole market, not just pet relevant outlets.

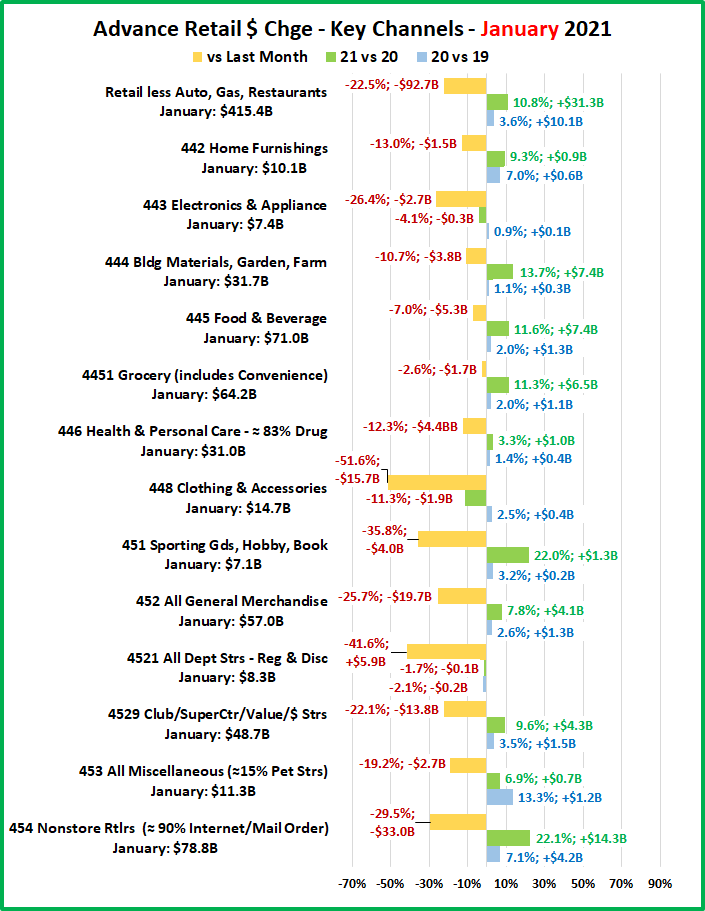
In December, all 13 channels beat last month’s $. In January they were all down. 10 channels beat January 2020 $. Last year 12 beat 2019 $. However, the 2021 increases were generally significantly higher than 2020. Clothing stores had the biggest decrease vs 2020 but Department stores are the only channel with decreases in both years.

After April’s widespread closures there was a retail surge in May, but things truly opened up in June/July. In Aug/Sept, sales slowed but growth began again in October and peaked with a record December. Relevant Retail finished up $252.9B vs 2019 and started 2021 strong, +10.8%. Essential channels are responsible for the continued lift, primarily:

  • Nonstore Retailers – Even more consumers are online shopping.
  • Food & Beverage, especially Grocery– Restaurant $ are still down so consumers continue to eat & drink at home.
  • Bldg Materials/Garden/Farm– Their “Spring” lift continues unabated as consumers focus on their home.
  • SuperCtrs/Club/Value/$ Strs – Sales slowed in April but came back in May and continue to grow vs the previous year. They turned the whole Gen Mdse channel positive. It clearly shows that value is still a consumer priority.

Regarding the Individual Large Channels

General Merchandise Stores – As expected Sales dropped in January after the holiday lift with the biggest % decrease coming from Department Stores. Their problems were amplified by the pandemic but existed before as they are the only channel down in January vs a year ago for 2 consecutive years. Club/SuperCtr/$ stores are still the big positive force. They finished 2020 up $33B, +7.4% and started off 2021 at +9.6%, considerably better than the +3.5% in January 2020.

Food and Beverage, plus Health & Personal Care Stores – The Grocery segment is still strong and growing, +11.3% in January, due to the continuing big drop in restaurant sales. Sales in the Health, Personal Care group turned positive vs 2019 in September and finished +1.7%. They started 2021 even better, +3.3%. Drug Store $ growth has been the driver.

Clothing and Accessories; Electronic & Appliances; Home Furnishings – Except for September, monthly sales have grown every month since May. All 3 channels finished the year down significant percentages in sales vs 2019. Clothing Stores have been the worst performers and that continued in January. Home Furnishing stores may be breaking the pattern in 2021. In January, their sales were up 9.3% vs 2020. Perhaps their recovery has truly begun.

Building Material, Farm & Garden & Hardware – Sales peaked in late spring, as usual. However, this channel continues to benefit from consumers turning their focus to their home needs, including house and yard repair and improvements. Their Spring lift extended into winter and they finished +$53B (+13.8%). No change for 2021 – January $ +13.7% vs 2020.

Sporting Goods, Hobby and Book Stores – Book and Hobby stores are open and sales in Sporting Goods stores have taken off as Consumers are seeking more recreation. They were down -$3.4B in April. This deficit was wiped out in September and driven by Sporting Goods stores, sales exploded in December. They ended 2020 up $4.4B, +5.5%. January 2021 sales fell 35.8% from December but they are still up an amazing 22.0% vs January 2020.

All Miscellaneous Stores – This group is mostly small to medium specialty stores – both chains and independents. Pet Stores are essential but most other stores are not, so closures hit this group particularly hard. Sales hit bottom at -$3.8B in April then began to rebound in May and grew through July when they finally beat the monthly sales for 2019. Sales seesawed up and down but finished with a strong December. They ended 2020 down $1.0B, -0.7%. They started out 2021 +6.9% but this is only about half of the +13.3% start in 2020. We’ll see how their recovery progresses in 2021.

NonStore Retailers – 90% of the volume of this group comes from Internet/Mail Order/TV businesses. The COVID-19 crisis has only accelerated the ongoing movement to online retail. In February NonStore was up 8.6% YTD. In December monthly sales exceeded $100B for the 1st time. They ended 2020 at +21.9%, +$173.9B YTD. Their increase is 69% of the total $ increase for Relevant Retail Channels. Their 2020 performance far exceeds their 12.9% annual increase in 2019 and they started off 2021 even better, +22.1%. Last January, in pre-pandemic times, they were only up 7.1%.

Note: Almost without exception, online sales by brick ‘n mortar retailers are recorded along with their store sales in their regular channel. Whether they are up or down, their online sales are included in the totals.

Recap – April and May saw the 2 biggest year over year monthly sales declines in history. Restaurants, Auto and Gas Stations increased sales from May through July, but results were mixed until yearend. The Auto segment did beat 2019 YTD $ in December, but Restaurants and Gas Stations finished down -$229B. The Relevant Retail segment was the only true positive. Sales began to recover in May and hit a record high in December. They finished 2020 up $253B but for some segments in this group there is still a long way to go. Total Retail Sales passed 2019 in October, set a new monthly $ record in December and ended the year +$37B (+0.6%) vs 2019. In 2021 Relevant Retail and Auto both began the year at +10% vs 2020, much better than last year. For Restaurants and Gas Stations the problems continue as both started off 2021 down significantly vs 2020. Thanks to Auto and Relevant Retail, Total Retail is +5.8% vs 2020. (last year they were +5.2%) However, this is an ongoing battle. We will continue to monitor the data and provide you with regular updates.


2019 Pet Services Spending was $8.62B – Where did it come from…?

Next, we will look at Pet Services. They are by far the smallest Segment at $8.62B. Spending turned down $0.10B in 2019 after a $1.95B (+28.9%) lift in 2018, which was by far the biggest increase in history. The number of outlets offering Services has been strongly increasing in recent years as brick ‘n mortar retailers look for a way to combat the growing influence of online outlets. After all, you can certainly buy products, but you can’t get your dog groomed on the Internet. This created a highly price competitive market for Pet Services. In 2017 there was a slight increase in visit frequency, but Pet Parents just paid less. This resulted in a 1.0% decrease in Services spending. In 2018 consumer behavior changed as a significant number decided to take advantage of the increased availability and convenience of Pet Services and spending literally took off. In 2019, Services $ essentially held their ground at this new higher level. However, there was some turmoil as the demographic segments spending more or less were almost equally divided. We saw evidence of some value shopping as the younger groups spent less. However, the older age groups stepped up to take advantage of this new more convenient and affordable marketplace.

Pet Services maintained their stronger “presence” at the Pet Industry “table” and spending in this highly discretionary segment became a little more balanced. Let’s look a little deeper into the demographics.

Let’s start by identifying the groups most responsible for the bulk of Services spending in 2019 and the $0.10B decrease. The first chart details the biggest Pet Services spenders for each of 10 demographic categories. It shows their share of CU’s, share of Services spending and their spending performance (Share of spending/share of CU’s). The differences from the products segments are immediately apparent. In order to better target the bulk of the spending we had to alter the groups in two categories – education and area. The performance level should also be noted as 5 of 10 groups have a performance level above 120%. This is the same as Food but less than the 6 for Total Pet & Veterinary, and 7 for Supplies. Last year they had 7 over 120% which indicates that there is a little less disparity between the best and worst performing segments in 2019. Income is absolutely the biggest factor in Services Spending. The categories are presented in the order that reflects their share of Total Pet Spending which highlights the differences of the 8 matching groups.

  1. Race/Ethnic – White, not Hispanic (87.3%) up from 85.5%.This big group accounts for the vast majority of spending in every segment. Services Spending became slightly less diverse in terms of race and ethnicity in 2019 as their performance grew from 123.8% to 127.4% and they moved up from 5th to 4th in terms of importance.
  2. Housing – Homeowners (84.5%) up from 80.8%. Homeownership is a big factor in pet ownership and spending in all industry segments. The Homeowners’ share of Services rebounded sharply in 2019 as did their performance, which grew from 127.3% to 132.6%. Homeownership moved up to 3rd from 5th in terms of importance for increased Services $. Homeowners w/o mtge spent 25% more, but those w/mtge spent 4% less and … Renters $ were down 20%.
  3. # in CU – 2+ people (75.9%) down from 77.3% The share of market for 2+ CU’s is over 75% for all segments. It is lowest in Veterinary (75.0%) and Services (75.9%). Their performance of 108.7% is down from 109.6% and is also next to last. The explanation is that Singles (30.2% of CUs) spent 5% more while 2+ CUs spent -3% less.
  4. Education – College Grads (72.2%) up from 68.9% Income generally increases with education. Services spending moves up with each increasing level of education. This is why we again shifted the group up to College Grads. Performance of 162.6% was up from 157.9% and a college education is still the 2nd most important factor.
  5. # Earners – “Everyone Works” (67.6%) down from (71.5%) All adults in the CU are employed. Income is important so a high market share is expected. However, their performance fell to 115.6% from 123.8% and they are no longer in the 120% club. This was due to a 56% increase by No Earner, Singles and a 6% increase by 1 Earner, 2+ CUs.
  6. Occupation– All Wage & Salaried (69.8%) down from 71.4% – Blue Collar workers spent more but couldn’t overcome the decrease by White Collar workers, Managers and Professionals. Retirees also spent 18.5% more on Services. All of this contributed to All Wage & Salaried workers’ performance rating decreasing from 116.9% to 114.5%. Services spending became a little more balanced in terms of Occupation.
  7. Income – Over $70K (75.0%) up from 72.3% This group’s performance rating is 180.7%, up from 179.4% which shows that CU income is still the single most important factor in increased Pet Services Spending. <$70K was down -$0.26B. $70K> was up $0.16B but Services $ were on an income rollercoaster. <$30K was -$0.07B; $30>39K was +$0.19; $40>69K was -$0.38B; $70>149K was +$0.25B; $150K> was -$0.09B.
  8. Age – 35>64 (61.2%) down from 63.7%. Their performance fell from 120.4% to 117.0% and they dropped out of the 120% club. There was a clear age dividing line. <45 spent less. 45> spent more. In 2018 the 35>44 yr olds had the biggest increase. In 2019, they had the biggest decrease, -$0.43B. Spending by the 75+ group was up +$0.34B.
  9. Area – City/Suburbs >2500 (87.1%) up from 85.3% in share, while performance increased from 104.7% to 106.9%. Services is an Urban Segment. After a strong 2018, Central City $ fell -13% in 2019. The large Suburbs were the only segment to spend more, +$0.55B (+14.8%). All areas <2500 spent -$0.17B (-13.4%) less.
  10. CU Composition – Married Couples (61.4%) down from 62.8%. Married couples are a big share of $ and have 120+% performance in all segments but Veterinary. Their performance dropped to 125.7% from 126.6% and they fell to 5th place in terms of importance to Services spending. Married Couples with children spent -$0.28 less on Services while all CUs without children spent +$0.23B more.

We changed 2 of the groups for Services – Education and Area, to better target the biggest spenders. We should also note that Income is more important to spending in Services than in any other segment but the performance in categories related to income – # Earners, Occupation and Education was mixed. # Earners and Occupation became less important while higher Education grew in importance. In some categories, spending was slightly more balanced in 2019.

Now, we’ll look at 2019’s best and worst performing Pet Services spending segments in each category.

Most of the best and worst performers are not a surprise. There are 7 that are different from 2018 – 3 of the best and 4 of the worst, down from 8 last year. The 3 new winners are high income and big pet spenders. You can see the move away from youth after the big lift in 2018, but not completely as Gen Xers, including the 45>54 yr olds are still on top. Changes from 2018 are “boxed”. We should note:

  • Income is even more important to Pet Services. While the 342.3% Performance by the $200K> group is less than last year’s 364.0%, it is 45% higher than Supplies and 78% higher than the best performing income segment in Food.
  • Generation – Gen X retained Top Spot and Millennials/Gen Z returned to the bottom. 2019 reversed some of the gains made by the younger generations in 2018.
  • Age – The 45>54 group reflects the move to more expected winners. They spend the most $ and are by far the best performers. All groups from 35>64 perform at 100+%. The low income <25 group returned to the bottom.
  • Area –Suburbs 2500> kept the lead in $ and regained the lead in performance from Center City. As we have said Services is an Urban segment. Areas 2500> perform at 106.9%. Areas <2500 perform at 69.6%.
  • CU Composition Married Couples Only returned to the top by eking out a small, 2.2% increase. Married couples with children spent less on Services in 2019 but Marriage and children are important factors in Services spending. Married Couples only and those with children of any age all perform over 100%. They all earn their share.

In Pet Services spending performance, income is still the major factor. After the youth movement in 2018, spending skewed towards older groups in 2019.

It’s time to “Show you the money”. Here are segments with the biggest $ changes in Pet Services Spending.

Pet Services Spending was down $0.10B, essentially flat. In this chart you immediately see a difference from last year. In 2018, six categories had no segments that spent less on Services. In 2019, there were none. You also see that in most cases the changes for the winner and loser tend to cancel each other out. Although the total $ change was small, the spending was more tumultuous than in 2018. There were only 2 repeats, compared to 7 last year. Also, 9 of 24 segments switched their position from first to last or vice versa. There were only 5 in 2018. Here are the specifics:

  • Area Type – Center City flipped from 1st to last. They have flipped every year since 2016.
    • Winner – Suburbs 2500> – Pet Services Spending: $4.28B; Up $0.55B (+14.8%)           2018: Center City
    • Loser – Center City – Pet Services Spending: $3.23B; Down $0.48B (-12.9%)                   2018: Suburbs <2500
    • Comment – The large Suburbs won and were also the only area to spend more on Services in 2019.
  • Housing – Homeowners w/o Mtge flipped from last to first.
    • Winner – Homeowner w/o Mtge – Services: $2.33B; Up $0.46B (+24.9%)           2018: Homeowner w/Mtge
    • Loser – Renter – Services: $1.34B; Down $0.33B (-20.0%)                                          2018: Homeowner w/o Mtge
    • Comment – Renters and Homeowners w/mtge spent less. The lift by Homeowners w/o mtge is tied to Retirees.
  • Age – The 35>44 yr olds flipped from 1st to last…
    • Winner – 75+ yrs – Pet Services Spending: $0.76B; Up $0.34B (+80.5%)                                 2018: 35>44 yrs
    • Loser – 35>44 yrs – Pet Services Spending: $1.57B; Down $0.43B (-21.7%)                               2018: 65>74 yrs
    • Comment: In 2018, all age groups spent more on Services. The 35>44 yr olds led the way, followed by 45>54. In 2019 all groups under 45 yrs old spent less, -$0.60B, while all groups over 45 spent more, +$0.50B. The 75+ year olds led the way and like 2018, the 45>54 yr olds came in second.
  • # Earners– No repeats or flips. No Earner, Singles and 1 Earner, 2+ CUs had the only increases.
    • Winner – No Earner, Single – Pet Services Spending: $0.86B; Up $0.31B (+56.0%)     2018: 2 Earners
    • Loser – 1 Earner, Single – Pet Services Spending: $1.22B; Down $0.20B (-14.4%)         2018: No Earner, 2+ CU
    • Comment – The # of Earners became slightly less important as “Everyone Works” CUs spent -$0.40B less.
  • Generation – Gen X flipped from 1st to last.
    • Winner – Born <1946 – Services: $0.95B; Up $0.24B (+33.0%)                                             2018: Gen X
    • Loser – Gen X – Services: $3.04B; Down $0.31B (-9.1%)                                                           2018: Baby Boomers
    • Comment – Despite their drop in $, Gen X maintained their position as the biggest Services Spenders. 2019 saw a clear Generational divide in Pet Services spending. Gen X & Millennials spent less while Boomers and those born before 1946 spent more,
  • Occupation – Both the winner and loser flipped.
    • Winner–– Retired – Pet Services Spending: $1.46B; Up $0.23B (+18.5%)                   2018: Mgrs & Professionals
    • Loser – Mgrs & Professionals – Pet Services Spending: $3.55B; Down $0.34B (-8.6%)                    2018: Retired
    • Comment – Retirees & Blue Collar workers spent more while White Collar workers & Self-Employed spent less.
  • Education – Advanced College Degree held their spot on top.
    • Winner – Adv. College Degree – Pet Services Spending: $3.30B; Up $0.20B (+6.6%)             2018: Adv. College Degree
    • Loser – HS Grad w/some College – Pet Services Spending: $0.93B; Down $0.24B (-20.3%)        2018: HS Grad
    • Comment – Again we have a clear dividing line on Services Spending. All those with a formal college degree, from Associates on up, spent more. All other education levels spent less.
  • Income – The winner flipped from last to first.
    • Winner – $30 to $39K – Pet Services Spending: $0.46B; Up $0.19B (+69.9%)                           2018: $200K+
    • Loser – $50 to $69K – Pet Services Spending: $0.63B; Down $0.21B (-24.8%)                            2018: $30 to $39K
    • Comment – The win by the $30>39K is not surprising. This income range corresponds to the average income of Retirees, so they undoubtedly were the primary driver. However, as we stated earlier, we had a rollercoaster in Pet Services spending in 2019. <$30K was down -$0.07B: $30>39K was up $0.46B; $40>69K was down -$0.38B; $70>149K was up $0.25K; $150K> was down -$0.09B.
  • Region – The Midwest won while flipping for the second consecutive year.
    • Winner – Midwest – Pet Services Spending: $1.82B; Up $0.18B (+11.3%)                                 2018: South
    • Loser – Northeast – Pet Services Spending: $1.45B; Down $0.23B (-13.8%)                             2018: Midwest
    • Comment – Last year all regions spent more. This year it was only the Midwest and West.
  • # in CU – 5+ Person CUs flipped from last to first.
    • Winner – 5+ People – Pet Services Spending: $0.63B; Up $0.11B (+21.5%)                        2018: 2 People
    • Loser – 3 People – Pet Services Spending: $1.29B; Down $0.17B (-11.6%)                           2018: 5+ People
    • Comment: The winner was a bit of a surprise and narrowly edged out Singles to come out on top.
  • CU Composition – The winner and loser are both new.
    • Winner – Married, Oldest Child 6>17 – Services: $1.16B; Up $0.11B (+10.3%)                  2018: Singles
    • Loser – Married, Oldest Child <6 – Services: $0.41B; Down $0.20B (-32.8%)                    2018: Single Parents
    • Comment – Although Gen X had the biggest decrease, they are still strong. The winner in this group was likely produced by the 45>54 yr old group. The loser was more likely to be younger.
  • Race/Ethnic – White, Not Hispanics held their position at the top.
    • Winner – White, Not Hispanic – Services: $7.53B; Up $0.08B (+1.0%)                     2018: White, Not Hispanic
    • Loser – Hispanic – Services: $0.53B; Down $0.11B (-17.6%)                                           2018: African American
    • Comment – Higher incomes – Whites & Asians spent more. Lower incomes – Hispanics & Blacks spent less.

We’ve now seen the winners and losers in terms of increase and decrease in Services Spending $ for 12 Demographic Categories. After a fabulous 2018, Services $ essentially flattened out in 2019. 49% of segments spent more compared to 88% in 2018. The winning increase in each category averaged +$0.25B, down from +$1.04B in 2018, while the biggest decreases averaged -$0.27B, up from -$0.02B. The spending also flipped from younger to older groups. Income is still of primary importance, but we saw a mixed bag of results for different levels. Urban areas are still the primary spenders but in 2019 more $ moved to the big Suburbs. The -$0.10B decrease was minor and we have detailed the best segments in performance and $. However, there were others who performed well but didn’t finish on top. They deserve….

HONORABLE MENTION

Higher income is important, but the results were mixed in 2019. The $30>39K group won but there were also positive performances by the high income Asians, the middle income $70>99K group and Blue Collar Workers. Also, unless your oldest child was between 6>17, CUs with kids spent less on Services. CUs with no children spent more. 1 Earner, 2+ CUs was 1 of only 2 segments in the Earners category to spend more and are the only segment to increase Services spending for 4 consecutive years. The largest, 5+ Person CUs narrowly edged out the smallest, 1 Person CUs for the win.  Spending increases, 49% and decreases, 51% were evenly split.

Summary

The Services segment has usually been “above” changes in other segments. Since 2010 prices have steadily increased but so did Spending …until 2017. An increase in outlets offering Services created a much more competitive environment. While prices didn’t deflate, inflation slowed significantly, and “deals” abounded as Retailers began a pitched battle for Consumers’ Services $. The net result was turmoil and a 1% decrease in spending. In 2018, the abundance of outlets and competitive prices finally had their intended impact. Many more consumers took advantage of the convenience of Pet Services and spending literally took off. In 2019 Consumers held their ground at the new higher level but we saw turmoil similar to 2017. Value shopping likely contributed to the small decrease.

Pet Services are definitely needed by some groups. However, for most demographics, Services are a convenience and spending is very discretionary in nature. The result of this is that usually CU income is of real importance to increased Services spending. While we saw mixed results according to income level in 2019, higher incomes still won out. 41.5% of CUs make over $70K and account for 75.0% of Services spending. This is a performance rating of 180.7% – the highest rating earned in any industry segment.

Performance is an important measurement. There were 5 categories with high performing big groups, down from 7 in 2018. This is equal to Food but less than Supplies (7) & Veterinary (6). This indicates less disparity in Services Spending.

  • Income    · Higher Education     · Homeownership    · CU Composition     · Race/Ethnicity

The two categories that dropped out were Age and # of Earners. They surpassed the 120% marker in 2018 because there was a strong youth movement. In 2019 the increases came from groups over 45 so the Age category became more balanced. Younger CUs also have more earners, so this category became less important as spending skewed a little older. However, we should note that while Gen X had the biggest decrease, they are still #1 in Services Spending.

2018 saw the biggest lift in history and it was widespread as 88% of all demographic segments spent more on Services. In 2019 Services essentially held their ground, only falling -$0.10B (-1.1%). The small decrease is reflected  in the mixed demographic spending pattern. 51% of the segments spent less while 49% spent more.

The Services segment has seen a radical increase in the number of outlets. Services is the most discretionary industry segment and much of the spending is driven by the consumers’ need for convenience. The increase in outlets certainly made things more convenient, but it also created a more competitive market. This produced “deals”, the biggest driver for all Americans. This made Services an option for more Americans and drove the huge 2018 lift. “Value shopping” was probably a factor in the small decrease in 2019. The 2020 pandemic probably hit this segment rather hard. We’ll see.

At Last – The “Ultimate” Pet Services Spending Consumer Unit consists of 2 people – a married couple, only. They are White, but not of Hispanic origin. At least one of them has an advanced College Degree. They are 45 to 54 years old and both of them work, in managerial positions. They’re doing well with an income over $200K. They live in a large suburb of a metropolitan area of over 2.5 million in the Western U.S. and are still paying off their mortgage.

2019 Pet Supplies Spending was $16.81B – Where did it come from…?

Next, we’ll turn our attention to Pets and Supplies. We’ll see some differences from Pet Food as the spending in the Supplies segment is more discretionary in nature. There are other factors too. Spending can be affected by the spending behavior in other segments, especially Food. Consumers often trade $ between segments. However, the biggest factor is price. Many supplies categories have become commoditized so pricing changes (CPI) can strongly impact Consumers’ buying behavior in this segment. In the 2nd half of 2016, deflation began, and Supplies started a 24 month spending lift, totaling $4.97B. Then prices turned up in mid-2018 due to impending new tariffs. Spending fell -$0.01B in the 2nd half but the tariffs really hit home in 2019. 93 of 96 demographic segments spent less and Supplies $ fell a record -$2.98B.

Let’s see which groups were most responsible for the bulk of Pet Supplies spending in 2019 and the $2.98B drop. The first chart details the biggest pet supplies spenders for each of 10 demographic categories. It shows their share of CU’s, share of Supplies spending and their spending performance (Share of spending/share of CU’s). Although their share of the Pet Supplies $ may be different, all of the big spending groups are the same as Total Pet and Food. The categories are presented in the order that reflects their share of Total Pet Spending. This highlights the differences in importance. All 10 of the groups have over a 60% market share. The big difference is we have 7 groups with performance over 120%. Pet Food had only 5. Education and # Earners were added. Both of these categories correlate with higher income which is more important in Supplies spending. 2 more 120+% performers also indicates that Supplies spending is less balanced.

  1. Race/Ethnic – White, not Hispanic (84.6%) down from (86.3%) This large group accounts for the vast majority of spending in every segment. Their share fell and their performance rating was down from 125.0% to 123.4% but they remain #4, in terms of importance in Supplies Spending. Minority groups account for 31.4% of all CUs but spend only 15.4% of Supplies $. This is actually up from 13.7%. Minorities also spent less but their drop was less severe because lower income Hispanics and African Americans are more focused on essential supplies, not more discretionary items.
  2. Housing – Homeowners (76.6%) down from (79.9%) Homeownership is a major factor in pet ownership and spending in all industry segments. Their performance dropped to 120.1%, from 125.9%, and they fell from 3rd to 6th place in terms of importance for increased Pet Supplies spending. Both Homeowners and Renters spent less. However, the bulk of the spending drop – $2.50B (84%) came from Homeowners with a mortgage.
  3. # in CU – 2+ people (79.8%) down from (82.7%) Their Supplies performance was 114.3%, down from 117.3%. All CU sizes spent less but 1 person CU’s had the smallest decrease, -0.8%. Also, in 2018 all 2+ CUs performed above 100%. In 2019, it was only 2 & 3 person CUs. In fact, 5+ Person CUs replaced singles at the bottom. Basically, 2+ CUs lost share and performance because 1 Person CUs had a less bad year.
  4. Education – Associates Degree or Higher (67.6%) down from (68.2%) Higher Education lost market share and their performance level dropped from 125.0 to 121.6%. They also fell from 4th to 5th in importance for generating greater Supplies spending. All groups spent less, but 71% of the decrease came from the Associates> Group. They have higher income and purchase more truly discretionary supplies. This was the spending most impacted by prices.
  5. # Earners – “Everyone Works” (70.0%) up from (65.4%) Their performance grew from 113.2% to 119.6% and they entered the 120+% club at #7. In this group, all adults in the CU are employed. Income and now # Earners is very important in Supplies $. They gained in share and performance because of $1.78 drop by 2+ CUs with 1 or no earner.
  6. Occupation – All Wage & Salary Earners (65.6%) up from (65.2%) – The performance of this group was 107.5%, up from 106.8%. All wage/salary groups spent less on Supplies. They gained in share and performance because the Self-Employed and Retirees had even bigger decreases in Supplies $, -20%.
  7. Income Over $70K (62.6%) up from (60.1%) With a performance rating of 150.8%, up from 148.9%, CU income is the single most important factor in increased Pet Supplies Spending. The $30>39K group actually spent more but the $70K> made gains again because they had a smaller decrease than <$70K. The increased discretionary nature of much of Supplies purchases pushes the performance above Food, but it is significantly below the Services segments.
  8. Age – 35>64 (65.3%) up from (65.2%) Traditionally, Supplies Spending skews more towards the younger groups. The 35>64 group maintained their dominance and their performance level increased to 124.9% from 123.2% moving them up to 2nd in importance. Supplies Spending was down in all segments but <25. However, they have a very small share. The 35>64 performance grew because the big spending 55>64 yr olds had only a small decrease.
  9. Area – Suburban (61.6%) down from (63.3%) Suburban CUs are the biggest spenders in every segment. They lost a little ground in Supplies and their performance fell to 110.6%, from 114.4% in 2018. All areas spent less but the Suburbs fell in share and performance because Central City spending was only down -3.9%.
  10. CU Composition – Married Couples (60.9%) down from (64.8%) Their performance also dropped from 130.5% to 124.6% and they fell from 2nd to 3rd in importance. Married Couple w/other adults, but no kids actually spent more on Supplies. However, Married Couples $ were down -20%. They loss ground because Singles only spent -0.8% less.

The biggest spending groups for Pet Supplies are the same as Total Pet and Food. However, the discretionary nature of Supplies causes spending to be more impacted by income than Food. Groups associated with higher income, like Education and # Earners, perform better than in Food. Homeowners, Married and Whites, the biggest spenders, had the biggest drops in Supplies $. Also, 7 groups with 120+% performance indicates greater disparity between segments.

Now, we’ll look at 2019’s best and worst performing Pet Supplies spending segments in each category.

Almost all of the best and worst performers are those that we would expect. In Pet Supplies spending, there are 5 that are different from 2018. That is the same as Total Pet but 2 fewer than Pet Food. It is actually the lowest number for any Industry segment. As we move deeper into the data, we will start to see even more differences between the Industry Segments. Changes from 2018 are “boxed”. We should note:

  • Income matters in Supplies spending.
    • The 236.7% Performance by the $200K> group is 22.5% better than the best income segment in Food.
    • All of the 12 winners for best performance were either 1st or 2nd in income of any segment in the category.
  • Education – Although the winner and loser were different from 2018, the performance dividing line in Supplies Spending remains the same. Only those with a formal degree, Associates>, earn their share with 100+%.
  • CU Composition – Single Parents Supplies spending fell -44.3%, the biggest drop of any segment in any category.
  • Area – The second biggest Supplies Spending percentage decrease was Rural, -35.2%.
  • # in CU –In 2019 the performance of 2 to 4 people CUs was again very close. 3 edged out 2 for the win. However, even 5+ earned their share at 103.0%. That truly leaves Singles “standing alone”. In Supplies $, it still just takes 2.

It’s time to “Show you the money”. Here are segments with the biggest $ changes in Pet Supplies Spending.

In 2019 Supplies Spending was down $2.98B. The decline began in the second half of 2018 as spending turned down slightly. Then the full impact of the tariffs hit home and the $ plummeted. In the chart, there are 2 repeats from 2018 – 1 winner and 1 loser. 9 segments switched from last to first or vice versa. This is much greater turmoil than in the Food Segment. Almost all winners were a surprise. However, the biggest surprise or change from recent history was that in 2019, every segment in 9 of 12 Demographic Categories decreased spending on Supplies. In 2018, in 3 categories every segment increased spending and in 2017 this was true for 10 categories. This provides perhaps the biggest indication of the massive impact of tarifflation on the Supplies Segment. Here are the specifics:

  • Age – Only the <25 group spent more.
    • Winner – <25 yrs – Pet Supplies Spending: $0.87B; Up $0.20B (+29.5%)                                2018: 35>44 yrs
    • Loser – 35>44 yrs – Pet Supplies Spending: $3.24B; Down -$0.82B (-20.1%)                          2018: 65>74 yrs
    • Comment: The 35>44 yr olds flipped from first to last. 74% of the $2.98B drop came from 25>54 yr olds.
  • CU Composition – Married Couples Only flipped from 1st to last.
    • Winner – Married, + Adults, No Kids – Supplies: $0.79B; Up $0.10B (+14.4%)   2018: Married, Couple Only
    • Loser – Married, Couple Only – Supplies: $4.50B; Down -$1.55B (-25.6%)            2018: Single Parents
    • Comment – Only Married Couples with additional adults but no kids spent more. Unmarried CUs of all sizes with no children had the smallest decrease, -$0.11B (-1.8%).
  • Income – Both winner and loser are new.
    • Winner – $30>39K – Pet Supplies Spending: $1.32B; Up +$0.09B (+7.1%)                              2018: $200K >
    • Loser – $50 > 69K – Pet Supplies Spending: $1.93B; Down -$0.68B (-26.2%)                           2018: $70>99K
    • Comment – The $30>39K is the third and last segment in any category to spend more. There was no clear spending trend dividing line. The $70>99K had the second best performance, down only -$0.02B, while the $100>149K group was almost the big loser at -$0.67B.
  • Race/Ethnic – White, Not Hispanic flipped from first to last but the winner was new.
    • Winner – African Americans – Supplies: $0.79B; Down -$0.005B (-0.6%)               2018: White, Not Hispanic
    • Loser – White, Not Hispanic – Supplies: $14.23B; Down $2.86B (-16.7%)                  2018: Asian Americans
    • Comment – White, Not Hispanics drive this discretionary segment. They have the highest % of pet ownership and the second highest income. The interaction of these two factors is very clear in the Racial/Ethnic category. Asians have the highest income but lowest Pet ownership – $ down -11.0%. Hispanics are 3rd in income but second in pet ownership – $ down -5.0%. African Americans have low pet ownership and lowest income – $ down -0.6%.
  • # Earners – All segments spent less but 1 Earner, 2+ CUs stayed on the bottom.
    • Winner – 1 Earner, Single – Pet Supplies Spending: $2.11B; Down -$0.013B (-1.1%)          2018: 2 Earners
    • Loser – 1 Earner, 2+ CU – Pet Supplies Spending: $2.77B; Down -$1.36B (-32.9%)             2018: 1 Earner, 2+ CU
    • Comment – Income is a big factor and the # of Earners is becoming more important, at least for the 69.8% of CUs with 2+ people. Singles only spent $0.01B less, regardless if they worked or not. However, in 2+ people CUs, those with 1 or No Earner spent -32.0% less. Those with 2 or more Earners spent -10.9% less.
  • Education – Winner and loser flipped but all segments spent less.
    • Winner – < High School Grads – Pet Supplies Spending: $1.80B; Down -$0.02B (-3.5%)    2018: BA/BS Degree
    • Loser – BA/BS Degree – Pet Supplies Spending: $5.34B; Down $0.93B (-14.9%)                     2018: < HS Grads
    • Comment – Once again, those that spent the least in 2018 won because they had the smallest decrease.
  • # in CU – Just like in CU Composition, 1 person CUs had the smallest decrease.
    • Winner – 1 Person – Pet Supplies Spending: $3.39B; Down -$0.03B (-0.8%)                       2018: 4 People
    • Loser – 2 People – Pet Supplies Spending: $6.40B; Down -$1.53B (-19.3%)                           2018: 5+ People
    • Comment: The 2 person CUs were particularly hard hit as their spending decrease was bigger than the combined drop of all 3 or more person CUs.
  • Housing – Another flip by the 2018 winner and loser.
    • Winner – Renter – Supplies: $3.94B; Down -$0.04B (-1.0%)                                         2018: Homeowner w/Mtge
    • Loser – Homeowner w/Mtge – Supplies: $8.30B; Down -$2.50B (-23.2%)               2018: Renter
    • Comment – Renters have a significantly lower level of pet ownership, so they “won” because they had less to lose. We should also note that the spending for Homeowner w/o a mortgage only fell -8.8%.
  • Region – The Northeast flipped from last to first.
    • Winner – Northeast – Pet Supplies Spending: $3.31B; Down -$0.04B (-1.2%)                 2018: Midwest
    • Loser – South – Pet Supplies Spending: $5.68B; Down -$1.52B (-21.1%)                            2018: Northeast
    • Comment – Last year the South finished a close second to the Midwest for the biggest increase. In 2019 they were the clear “loser” in $ but they were down -21.1% while the Midwest fell -25.8%.
  • Occupation – Both winner and loser are new.
    • Winner – Blue Collar – Pet Supplies Spending: $3.15B; Down -$0.09B (-2.8%)              2018: Tech/Sls/Clerical
    • Loser – Managers & Professionals – Pet Supplies Spending: $5.14B; Down -$1.27B (-19.8%)        2018: Retired
    • Comment – All Occupation groups spent less on Supplies in 2019. In 2018 all but Retirees spent more so they are the only segment with 2 consecutive decreases in Supplies spending. Blue Collar workers are the only group with a single digit % decrease. The 2 biggest spenders, Managers & Self-Employed, cut back spending by 20%.
  • Area Type – The big Suburbs flipped from 1st to last.
    • Winner – Center City – Pet Supplies Spending: $5.39B; Down -$0.22B (-3.9%)                2018: Suburbs 2500>
    • Loser – Suburbs 2500> – Pet Supplies Spending: $7.44B; Down -$1.45B (-16.3%)           2018: Suburbs <2500
    • Comment – Central Cities, the area with the lowest pet ownership, had the smallest decrease.
  • Generation – Those born in 1981 or after, Millennials/Gen Z, held their spot at the top
    • Winner – Born 1980> – Supplies: $4.34B; Down -$0.23B (-5.0%)                       2018: Millennials
    • Loser – Gen X – Supplies: $5.47B; Down $1.35B (-19.8%)                                          2018: Baby Boomers
    • Comment – This win by Millennial/Gen Z was driven by the <25 group, which had the only spending increase in the age category. Gen X, which had the highest CU Supplies spending in 2018, cut back the most in 2019.

We’ve now seen the winners and losers in terms of increase/decrease in Pet Supplies Spending $ for 12 Demographic Categories. In 2019, spending fell a record -$2.98B due to tarifflation. Only 3 of 96 segments had increases and 9 of 12 categories had no segments that spent more on Supplies. In performance, we saw many expected winners, but it was a different story in $ change. Most of the 2019 winners were those that had the least to lose from 2018. However, like previous years, not every good performer can be “the” winner and some of these “hidden” segments should be recognized for their performance, which was “bad”, but better than most. They don’t win an award, but they deserve…

HONORABLE MENTION

The numbers from these segments are not good but merit some recognition in such a devastatingly bad year. Like many of the winners, most are unusual and a very eclectic mix. The $70>99K middle income group was only down 0.8% so their decrease was truly minimal. No Earner, Singles was literally only $1M away from winning the # of Earners category. The best performances generally came from “no kids” CUs like those consisting of 2+ Unmarried Adults. The lower income Hispanics finished 2nd with only a 5% decrease because their focus was primarily on more essential supplies. The 55>64 yr old Baby Boomers have the largest share of Supplies $ of any age group and their % decrease was about half of the national number. HS Grads with some College were the only other group besides those with no HS Diploma to have a % decrease less than double digits. 2018 was not a great year but it was still pretty good as 72 of 92 Demographic Segments spent more. In a marked contrast, 2019 was nearly universally bad as 93 of 96 demographic segments spent less on Supplies.

Summary

While Pet Food spending has shown a definite pattern, Pet Supplies have been on a roller coaster ride since 2009. Many Supplies categories have become commoditized and react strongly to changes in the CPI. Prices go up and spending goes down…and vice versa. Supplies spending has also been reactive to big spending changes in Food. Consumers spend more to upgrade their Food, so they spend less on Supplies – trading dollars. We saw this in 2015. In 2016 the situation reversed. Consumers value shopped for Food and spent some of the “saved” money on Supplies.

That brought us to 2017. Both Supplies and Food prices deflated while the inflation rate in both of the Services segments dropped to lows not seen in recent years. Value was the “word” and it was available across the market. Perhaps the biggest impact was that the upgrade to super premium Food significantly penetrated the market. This could have negatively impacted Supplies Spending, but it didn’t. Supplies’ spending increased in 93% of all demographic segments.

2018 started out as expected with a $1B increase in Supplies and a small lift in Food. Then the government got involved. In July the FDA issued a warning on grain free dog food and spending dropped over $2B. New tariffs were implemented on Supplies and spending flattened out then turned down $0.01B in the 2nd half. Because of shipping timing, the full retail impact of Tariffs was delayed until 2019 when spending fell -$2.98B, affecting 97% of all demographic segments.

Among the demographic categories in which a consumer has some control, Higher Income, Marriage, Homeownership and Higher Education are still the biggest factors in Supplies spending. In 2019 Income stayed on top and two categories directly associated with income – Occupation and # of Earners increased in importance.

Increased Tariffs increased prices which obviously severely impacted Supplies Spending. Those that spent the most in 2018 were often the most negatively affected in 2019. A prime example of this is that 6 of the 12 segments with the biggest increase in 2018 flipped to having the biggest decrease in 2019. In terms of performance, 10 of the 12 best performing segments repeated in 2019. There has always been a big gap in performance between the best and worst performers in Supplies. It’s still there as It narrowed only 0.6% from 2018 to 2019.

It appears the 2019 decrease most affected the groups that spent the most money on the more discretionary supplies categories. It will be interesting to see the impact of the COVID-19 pandemic on Supplies $pending Demographics.

Finally – The “Ultimate” Pet Supplies Spending CU consists of 3 people – a married couple, with 1 child, over 18. They are 45>54 yrs old. They are White, but not of Hispanic origin. At least one has a BA/BS Degree. Both of them work, running their own business and their child just started a part time, after school job. They’re doing well with an income over $200K. They live in a small suburb, adjacent to a big city in the Western U.S. and are still paying off the mortgage.


2019 Pet Food Spending was $31.19B – Where did it come from…?

As we continue to drill ever deeper into the demographic Pet spending data from the US BLS, we have now reached the level of individual Industry segments. We will start with Pet Food, the largest and arguably most influential of all. We have previously noted the trendy nature of Pet Food Spending. In 2018 we broke  a pattern which began in 1997 – 2 years up then spending goes flat or turns downward for a year. We expected a small increase in 2018 but what we got was a $2.27B decrease (-7.3%). This was due to the reaction to the unexpected FDA warning on grain free dog food. A pattern of over 20 years was broken by 1 statement. The grain free warning lost some credibility and spending rebounded in 2019, +$2.35B (+7.1%). Let’s take a closer look.

First, we’ll see which groups were most responsible for the bulk of Pet Food spending and the $2.35B lift. The first chart details the biggest pet food spenders for each of 10 demographic categories. It shows their share of CU’s, share of pet Food spending and their spending performance (Share of spending/share of CU’s). All groups are the same as Total Pet and Pet Products. The categories are presented in the order that reflects their share of Total Pet Spending. This highlights the differences in importance. In Pet Food spending, Education was less important while Marriage matters more. Also, while Income is still the highest performing demographic characteristic, it carries a little less weight in Food spending. Another big difference is that Total Pet had 6 groups performing at or above 120%. Pet Food had only 5. This indicates that Pet Food spending and Pet ownership is spread more evenly across demographic segments. Pet Products also had only 5 groups over 120% which shows the influence of the Pet Food Segment which in 2019 accounted for 65% of Pet Products $ and 40% of Total Pet Spending.

  1. Race/Ethnic – White, not Hispanic (87.0%) – up from 83.2%. This large group accounts for the vast majority of spending in every segment. They gained in share and their performance increased to 126.9% from 120.5%, but this category still ranks #4 in terms of importance in Pet Food Spending demographic characteristics. While Hispanics, African Americans and Asian American account for 31.4% of U.S. CU’s, they spend only 13% of Pet Food $. This is down from 17% last year. All minorities spent less on Pet Food in 2019, -$0.78B, a stark contrast to the $3.13B increase by White, Not Hispanic CUs.
  2. Housing – Homeowners (81.9%) – up from 76.8%. Homeownership is a huge factor in pet ownership and more pet spending and it became even more important in 2019. They gained over 5% in share and their performance grew from 121.0% to 128.5%. Homeownership remained 3rd in terms of importance for increased pet Food spending. It was a good year for Homeowners, with or without a mortgage and a bad year for renters.
  3. # in CU – 2+ people (80.2%) – down from 80.3%.The share of market for 2+ CU’s is now only over 80% for Pet Food. Last year they had 80+% in all but Services. While their share fell slightly performance grew from 113.8% to 114.9%. This happened because the 2019 $ were produced by 360K fewer CUs. (over 1M fewer 2 person CUs). 3 Person households took over as the performance leader and now in the 2+ group, only 2 & 3 person CU’s perform over 100%. 2+ Person CUs are still the 6th most important group in Pet Food $ but Singles are growing in numbers and $.
  4. Education – Associates Degree or Higher (61.6%) – down from 62.8%. Education lost a little importance in Pet Food Spending. The performance of higher education fell from 115.2% to 110.7%. All groups with at least a High School Diploma spent more. However, HS Grads with no degree of any kind (Assoc/BA/BS) spent $1.84B more.
  5. # Earners – “Everyone Works” (66.4%) – up from 58.2%. There was a big increase from last year and their performance also grew from 100.7% to 113.6%. Income matters most in Pet Food Spending and the # of Earners also became more important.
  6. Occupation – All Wage & Salary Earners (61.7%) – up from 60.4% – All wage & salary workers, both Blue & White Collar increased spending. Only Retirees spent less. This drove the performance of All Wage & Salary earners up from 98.9% to 101.2%. This big group is again earning their share in Pet Food Spending.
  7. Income – Over $70K (60.9%) – up from 55.6%. Their performance rating also grew significantly from 137.8% to 146.9%. CU income remains the single most important factor in increased Pet Food Spending. The dividing line was $40K. All groups <$40K spent less. All over $40K spent more. The gain in share and performance was driven by a $2.97B increase in spending by $70K>. Pet ownership is common across all income levels but in 2019 higher income became even more important in Pet Food Spending.
  8. Age – 35>64 (62.9%) – up from 59.6%. The performance of the group grew from 112.7% to 120.2% so the “Age” category rejoined the 120+% club at #5. Only the <25 group spent less on Pet Food. However, a $2B increase drove the big lift in share and performance by the 35>64 year olds.
  9. Area – Suburban (61.6%) up from 60.1%. Their performance grew from 108.4% to 110.7. All Suburban areas spent more but the gains were driven by a $1.61B increase by Suburbs 2500>, along with -$0.17B drop by Center City.
  10. CU Composition – Married Couples (63.0%) – up from 61.3%. They gained in share and their performance grew from 123.5% to 129.0%, so they stayed in 2nd place. Only Married couples with an oldest child 6>17 spent less.

The big spenders for Pet Food are the same as those for Total Pet and Pet Products and in the past they generally had a lower market share and performance. That was not always true in 2019. Pet Food Spending grew $2.35B and 8 of the 10 big groups gained in both share and performance.  Pet Food spending became a little less balanced in many demographic categories.

Now, we’ll look at 2019’s best and worst performing Pet Food spending segments in each category.

Even as we drill down to the Industry segment level, many of the best and worst performers are the ones that we would expect. In Pet Food spending, there are  7 that are different from 2018, which is 2 more than for Total Pet but the same as Pet Products. 9 of 12 winners are the same as Pet Products and 10 of the losers match. This demonstrates the impact that the Food spending increase had on overall Pet Products. Changes from 2018 are “boxed”. We should note:

  • Income is important in every segment but the “need” segments, Food and Veterinary are the only ones in which the winner is not $200K+. Also, all income groups above $40K perform at 92+% in Food, by far the best of any segment.
  • # Earners – 2 Earner CU’s took the top spot as the number of Earners became more important.
  • CU Size – With a 25% increase in spending, 3 Person CUs edged out the usual winner, 2 Person.
  • Occupation – After a good 2018, Retirees returned to the bottom.
  • Generation – The Boomers remain the perennial best performers in Pet Food, but Gen X is closing the gap.
  • Age – The 45>54 yr olds replaced the 55>64-yr olds on top and the <25 group returned to the bottom.
  • CU Composition – Married, Couples Only won for the 5th straight year and Single Parents fell to a very low bottom.
  • Area – Rural CUs increased spending and performance, but it wasn’t enough to hold off the <2500 Suburbs.

It’s time to “Show you the money”. Here are segments with the biggest $ changes in Pet Food Spending.

There are 4 repeats from 2018 and only 5 of the 24 segments (21%) flipped from 1st to last or vice versa. That’s considerably calmer than 2018 when there was only 1 repeat and 71% flipped. The only true surprise winner was High School Grads. The South flipped from last to first but even more importantly, all regions spent more on Pet Food. This indicates that the Food rebound was geographically widespread across America. Here are the specifics:

  • Race/Ethnic – A dual flip as the rebound in Pet Food spending was only for the White group…
    • Winner – White, Not Hispanic – Pet Food Spending: $27.14B; Up $3.13B (+13.0%)     2018: Hispanic
    • Loser – Hispanic – Pet Food Spending: $2.30B; Down $0.44B (-16.1%)                        2018: White, Not Hispanic
    • Comment – The U.S. is slowly becoming more racially/ethnically diverse but White, Not Hispanic is still by far the biggest spender in every Pet Industry Segment. In 2018 Whites had their smallest share in Food, 83.2%. In 2019 all minorities spent less on Food and the White share of spending jumped to 87%, the highest in 7 years.
  • # Earners – Income grew in importance as did the # of Earners.
    • Winner – 2 Earners – Pet Food Spending: $12.98B; Up $2.54B (+24.4%)                       2018: No Earner, Single
    • Loser – 1 Earner, 2+ CU – Pet Food Spending: $5.90B; Down $1.23B (-17.2%)             2018: 1 Earner, 2+ CU
    • Comment – 1 Earner, 2+ CUs stayed at the bottom. Everyone Works CUs of all sizes spent $3.92B more while all others spent -$1.57B less.
  • Housing – Renters flipped from first to last.
    • Winner – Homeowners w/Mtge – Food: $17.35B; Up $2.32B (+15.5%)            2018: Renters
    • Loser – Renters – Food: $5.64B; Down $1.05B (-15.7%)                                         2018: Homeowners w/o Mtge
    • Comment – Homeowners with and without mortgages spent $3.4B more and Renters spent -$1.05B less. This is a more expected result in this category.
  • Generation – Gen X edged out the Boomers for the win.
    • Winner – Gen X – Pet Food Spending: $10.03B; Up $1.71B (+20.5%)                         2018: Millennials
    • Loser – Born <1946 – Pet Food Spending: $2.48B; Down $0.22B (-8.1%)                 2018: Boomers
    • Comment – Only the oldest group spent less. Gen X dominated in a segment usually ruled by Boomer behavior.
  • Area Type – Winner and Loser are new but not surprising.
    • Winner – Suburbs <2500 – Pet Food Spending: $5.99B; Up $1.61B (+36.7%)        2018: Suburbs 2500>
    • Loser – Center City – Pet Food Spending: $7.63B; Down $0.17B (-2.2%)                  2018: Rural
    • Comment – Center City spent less. Everyone else spent more. This reflects the results of the Housing category.
  • Education – A new and surprising winner, HS Grads and a new loser, <HS Grads which is not much of a surprise.
    • Winner – HS Grads – Food Spending: $5.27B; Up $1.36B (+34.9%)              2018: Associates Degree
    • Loser – <HS Grad – Food Spending: $0.56B; Down $0.59B (-51.2%)            2018: HS Grad w/some College
    • Comment – Every education level except those without a High School Diploma spent more. One possibly is that this group had a delayed reaction to the 2018 FDA warning.
  • Region – Last year every region spent less. This year they all spent more – a second consecutive flip.
    • Winner – South – Pet Food Spending: $12.03B; Up $1.30B (+12.1%)                                         2018: West
    • Loser – Midwest – Pet Food Spending: $7.02B; Up $0.17B (+2.5%)                                            2018: South
    • Comment – The South flipped from the bottom to the top. The fact that the spending behavior of all regions has been the same for 3 consecutive years shows the universality of recent trends in Pet Food.
  • Age – The winner and loser are new but not surprising.
    • Winner – 45>54 yrs – Pet Food Spending: $7.09B; Up $1.20B (+20.4%)                           2018: 65>74 yrs
    • Loser – <25 yrs – Pet Food Spending: $0.76B; Down $0.36B (-32.4%)                                2018: 55>64 yrs
    • Comment: The highest income 45>54-yr olds moved to the top but all groups but <25 spent more. The decrease by the youngest group was substantial, but not surprising after an +80% increase last year.
  • # in CU – 3 People CUs continued their strong growth and won for the second consecutive year.
    • Winner – 3 People – Pet Food Spending: $5.85B; Up $1.18B (+25.3%)                                   2018: 3 People
    • Loser – 5+ People – Pet Food Spending: $2.46B; Down $0.35B (-12.4%)                               2018: 2 People
    • Comment: In 2018 only 3 person CU’s and singles increased Food spending. In 2019 only the largest, 5+ person CUs spent less. We are increasingly moving up from the previously magic “2” number, which probably reflects the growing strength of the younger groups, even in the Food segment.
  • Occupation – Self-Employed held their winning position.
    • Winner – Self-Employed– Pet Food Spending: $3.38B; Up $0.97B (+40.1%)           2018: Self-Employed
    • Loser – Retired – Pet Food Spending: $4.66B; Down $1.02B (-18.0%)                        2018: Blue Collar Workers
    • Comment – Retirees were the only big group to spend less on Pet Food. Blue Collar Service workers spent a little less too, but the total Blue Collar worker group spent $0.41B more on Food. Overall, the “bosses” – Managers, Professionals and Self-Employed spent +$1.83B more, which was 78% of the total increase.
  • Income – The $150>199K group won again.
    • Winner – $150 to $199K – Pet Food Spending: $3.77B; Up $0.94B (+33.4%)                   2018: $150 to $199K
    • Loser – $30 to $39K – Pet Food Spending: $4.04B; Down $0.80B (-27.8%)                      2018: $50 to $69K
    • Comment – Only the groups below $40K spent less on Food in 2019. However, the increases didn’t become significant until income reached $70K or more which increased the income disparity in Food spending.
  • CU Composition – Married Couple Only flipped from last to first and remain the performance leader.
    • Winner – Married, Couple Only – Food: $9.92B; Up $0.86B (+9.5%)          2018: Married, Oldest Child <6
    • Loser – Single Parents – Food: $0.61B; Down $0.44B (-41.6%)                       2018: Married, Couple Only
    • Comment – Married, Couple Only returned to the top, no surprise. In 2018 Married, Oldest Child 6>17 and Single Parents spent more on Food. In 2019 they were the only segments to spend less. Although Married CUs with children spent $0.74B more, the bulk of the increase, $2.0B (85%) came from all adult CUs – Singles, married or unmarried – just no kids.

We’ve now seen the “winners” and “losers” in terms of increase/decrease in Pet Food Spending $ for 12 Demographic Categories. The results reinforce just how widespread the spending rebound to the 2018 FDA warning was. Most of America remains firmly committed to high quality Pet Food. However, super premium Food comes with super premium prices, so income has grown in importance in Pet Food spending. I suspect that the internet and value shopping will become even more important in this segment. We have identified the winning segments in performance and $ increase but they were not alone. Not every good performer can be a winner. Some “hidden” segments should also be recognized for performance. They don’t win an award, but they get…

HONORABLE MENTION

Married Couples, Oldest Child 18> came in second to Couples Only by just $0.04B. They are generally older and may soon be a couple only. Rural finished 2nd to the Small Suburbs and together areas <2500 in population spent $2.26B more on Food.  4 Person CUs narrowly beat 2 People for the 2nd biggest increase. All Homeowners spent more and those with no mortgage finished 2nd despite having a $1B increase. All regions spent more but the Northeast finished 2nd despite being the worst performer at 94%. High School Grads with no College were the winners but those who had some College courses finished second. This combined performance helped reduce the importance of higher education to increased Pet Food spending. The lift was widespread as 75% of 96 demographic segments spent more.

Summary

Pet Food has been ruled by trends over the years. The drop in 2018 due to the FDA grain free warning broke a pattern of 2 years up followed by 1 year of flat or declining sales which had been going on since 1997. This trendy nature increased with the first significant move to premium foods in 2004. The Melamine crisis in 2007 intensified the pattern and resulted in a series of “waves” which became a tsunami with the introduction of Super Premium Foods.

The 25 to 34 yr old Millennials were the first to “get on board” with Super Premium in the second half of 2014. In 2015 a substantial portion of consumers began to upgrade to this new trend. The result was a $5.4B spending increase. These consumers were generally more educated, often worked as managers or were self-employed and had higher incomes. One negative was that they often paid for the upgrade by spending less in other segments. In 2016 the anticipated drop in spending happened. The “upgraded” group began value shopping for their new food and found great deals online and in some stores. They spent some of the $3.0B “saved” Food dollars in other segments but not enough to make up for the drop in Food. Total Pet Spending was down $0.46B. In 2017 we were ready for a new “wave”. Thanks to a very price competitive market, what we got was a deeper penetration of Super Premium foods. This group of upgraders was mostly middle-income, not college educated and often Blue-collars workers. Most also were in the 55>64 year old age group. The result was a $4.6B increase but this time there was no trading $ with other segments.

In 2018 we were “due” a small annual increase in Pet Food and spending in the first half was up $0.25B. Then the bottom dropped out as spending fell $2.51B in the second half in reaction to the FDA warning on grain free dog food. It turned out that the big decrease in pet food spending came directly from the groups who had fueled the big 2017 increase. This turmoil was illustrated by the fact that 71% of the demographic groups with the biggest change in Pet Food $ switched from first to last or vice versa from their position in 2017.

That brought us to 2019. The impact of the FDA warning faded as there was little evidence to back it up. Pet Parents either returned to Super Premium or in some cases chose even higher priced options. Premium supplements $ also grew as the health and wellbeing of their Pet Children remained the number 1 priority. Pet Food $ grew $2.35B with less turmoil and 72 of 96 (75%) demographic segments spending more. Higher Education became a little less important but income and income related categories – from # Earners to Race/Ethnicity mattered more. Overall, Pet Food Spending became a little less demographically balanced in 2019, reversing a previous trend. Indications are that the 2020 Pandemic, with stay at home protocols, caused consumers to place an even greater focus on their pets and that Pet Food Spending increased, but by whom? A 2020 lift was likely again driven by income. We’ll have to wait and see.

Finally – 2019’s “Ultimate” Pet Food Spending CU is 3 people – a married couple, with 1 child over 18. They are 45>54 years old and White, but not of Hispanic origin. At least one has an advanced college degree and they both work in their own business. They earn $150>$200K but still have a mortgage on their house in a small suburb in the Midwest. By the way, they just barely edged out their neighbors, a Married Couple Only.