2019 Pet Products Spending was $48.01B – Where did it come from…?
We looked at the Total Pet Spending for 2019 and its key demographic sources. Now we’ll start drilling down into the data. Ultimately, we will look at each individual segment but the first stop in our journey of discovery will be Pet Products – Pet Food and Supplies. Food and Supplies are the industry segments that are most familiar to consumers as they are stocked in over 200,000 U.S. retail outlets, plus the internet. Every week over 21,000,000 U.S. households buy food and/or treats for their pet children. Pet Products accounted for $48.01B (61.2%) of the $78.44B in Total Pet spending in 2019. This was down $0.64B (-1.3%) from the $48.65B that was spent in 2018. Pet Food spending rebounded from the reaction to the 2018 FDA warning on grain free dog food, but the impact on Supplies from the new tariffs really hit home in 2019. Supplies prices rose sharply which affected virtually every demographic segment and spending plummeted.
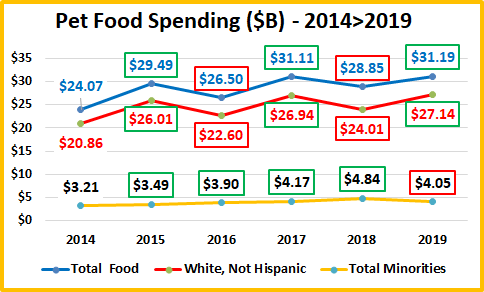
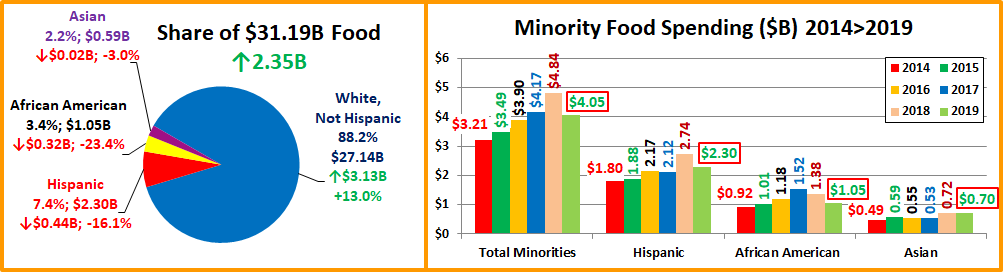
Overall, in 2019 Pet Food spending rose +$2.35B, while Supplies spending fell a record -$2.98B. We’ll combine the data and see where the bulk of Pet Products spending comes from.
We will follow the same methodology that we used in our Total Pet analysis. First, we will look at Pet Products Spending in terms of the same 10 demographic category groups that were responsible for 60+% of Total Pet spending. Then we will look for the best and worst performing segments in each category and finally, the segments that generated the biggest dollar gains or losses in 2019.
The first chart details the biggest pet product spenders for each demographic category. It shows their share of CU’s, share of pet products spending and their spending performance (spending share/share of CU’s). Although their share of the total products $ may be different from their share of the Total Pet $, the biggest spending groups are the same. The categories are shown in the order that reflects their share of Total Pet Spending. This highlights the differences. In Pet Products spending, the # of earners, age and marriage are more important while education matters less. We should note that, like Total Pet Spending, Income is the highest performing demographic characteristic. In Pet Products there are 5 groups with a performance rating of over 120%, up from 4 last year. This is one less than Total Pet, which indicates that Pet Products spending is growing more concentrated but is still spread more evenly across the category segments.
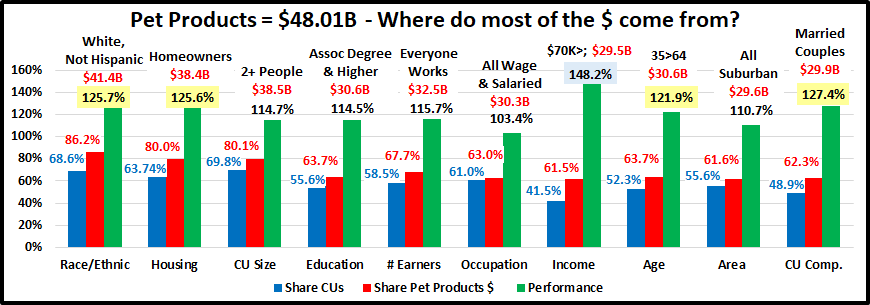
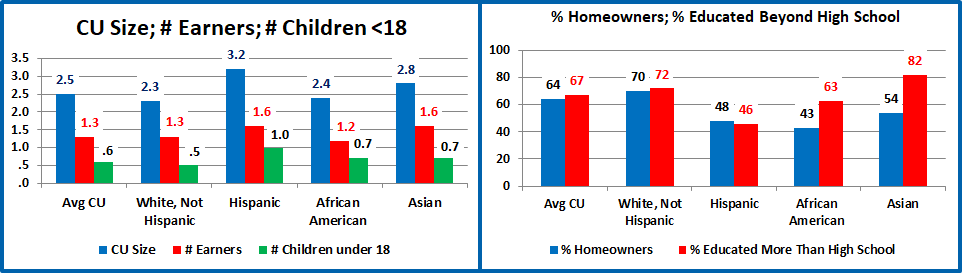
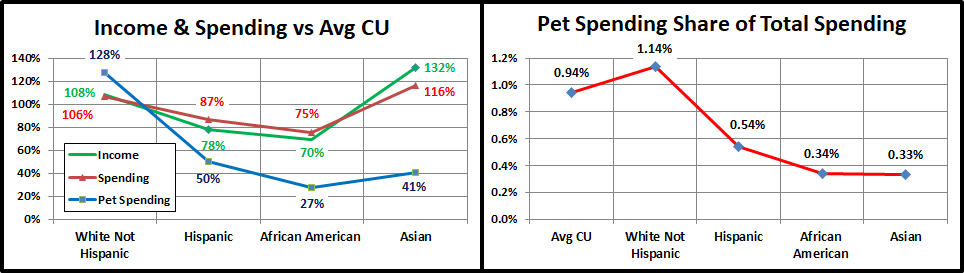
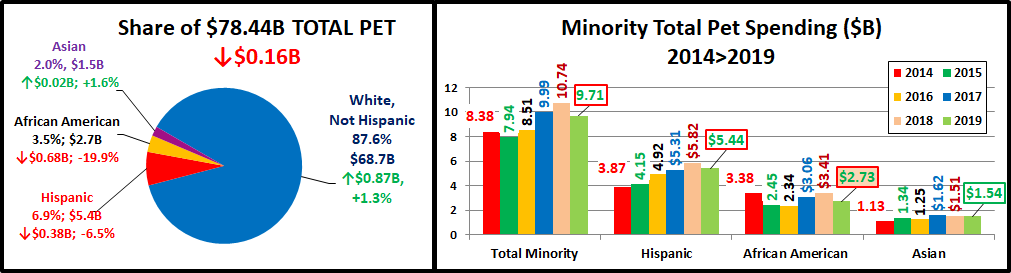
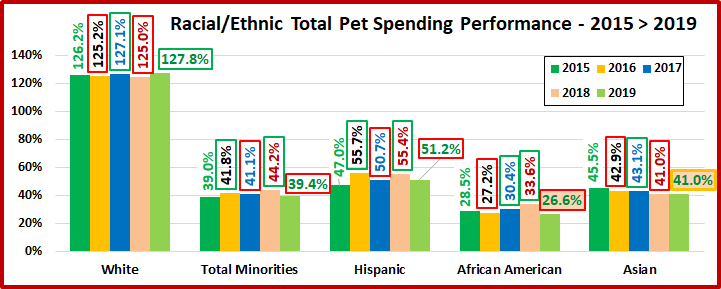
- Race/Ethnic – White, not Hispanic (86.2%, up from 84.5%) They are no longer the largest group but still account for the vast majority of spending in every segment. With a 125.7% performance rating, this category now ranks 3rd in terms of importance in Pet Products Spending demographic characteristics. Hispanics, African Americans and Asian American account for 31.4% of U.S. CU’s, but they only spend 13.8% of Pet Products $. Although pet ownership is relatively high in Hispanic households, it is significantly lower for African Americans and Asians.
- Housing – Homeowners (80.0% up from 78.1%). Controlling your “own space” has long been the key to pet ownership and more pet spending. Their performance grew from 123.0% to 125.6% but they officially fell from third to fourth place in terms of importance for increased pet products spending. Homeowners spending only increased by 0.1% in 2019. The small increase was totally driven by those without a mortgage. Those with a mortgage spent less. Their overall gain in share and performance was due to a bad year for Renters, -10.1%.
- # in CU – 2+ people (80.1%, down from 81.3%) The share for Pet Products is higher than for Total Pet, 78.2%. If you put 2 people together, pets very likely will follow. If you have a pet, you must spend money on food and supplies. Their performance of 114.7% is down from 115.2% because of a bad year for 2, 4 and 5+ person CUs and a good year for singles. Performance peaks at 3 people but only CUs with 5+ people and singles perform below 100%.
- Education – Associates Degree or Higher (63.7%, down from 65.0%). Their performance level also fell significantly from 119.2% to 114.5%. Formal Education mattered less in 2019. Those without a High School diploma spent less, $0.61B, but the biggest decrease came from those with either an Associates or College degree, -$1.05B. The only group to spend more were High School Grads with or without some college courses, +$1.02B.
- # Earners – “Everyone Works” (67.7%, up from 61.2%). Their performance is 115.7%, up from 105.8%. In this group, all adults in the CU are employed. Every segment in the group spent more while everyone else spent less. The 2+ people and only one earner segment was down -$2.58B in 2019 and -$4.3B from 2017. Income is a growing priority in Pet Products Spending, but now how many people work to get it is also becoming more important.
- Occupation – All Wage & Salary Earners (63.0%, up from 62.4%). Their performance also grew from 102.1% to 103.4. These small changes are somewhat deceptive as there was some turmoil. Internally, there was a big spending drop from Managers but a lift from Blue Collar. Externally, Self-Employed also spent more while Retirees spent less.
- Income – Over $70K (61.5%, up from 57.4%). Pet Parenting is common in all income groups but money increasingly matters in spending behavior for all industry segments. With a performance rating of 148.2%, up from 142.4%, CU income continues to grow as the single most important factor in increased Pet Products Spending. As a general rule, Higher Income = Higher Pet Products Spending. This was especially true in 2019. All income groups over $70K spent more, +$1.61B but couldn’t make up for the decrease by all groups under $70K, -$2.24B.
- Age – 35>64 (63.7%, up from 61.9%). Their performance also bounced back from 117.0% to 121.9% and they rejoined the 120+% performance club. Every group under 45 or over 64 spent less. The 45>64 yr olds spent $0.91B more but couldn’t overcome the -$1.55B drop by the older and younger groups. The <35 group was down -$0.72B.
- Area – Suburban (61.6%, up from 61.4%). Their performance stayed at 110.7%. Suburban households are the biggest pet spenders but space mattered in 2019. Suburban and Rural areas under 2500 population spent $0.95B more while Suburban areas over 2500 were down -$1.19B and Center City $ fell -$0.39B.
- CU Composition – Married Couples (62.3%, down from 62.7%). Their performance grew from 126.4% to 127.4% due to fewer CUs and a big $ drop by Single Parents. Couples only and those with an oldest child 6>17 spent less. The other Married segments spent more. They kept 2nd place so Marriage remains very important in Pet Products $.
The biggest spending groups are the same for Pet Products as for Total Pet, but there are subtle differences in market share and performance. Money matters most but now how many earners also matters. It also appears that Pet Products Spending is becoming less balanced across almost all demographic categories.
Now, let’s drill deeper and look at 2019’s best and worst performing Products spending segments in each category.

Most of the best and worst performers are the ones that we would expect. However, there are 7 that are different from 2018. That is the same as last year and 2017, but again is 2 more than Total Pet. Changes from 2018 are “boxed”.
We should note: Only 1 of the Product winners is different from Total Pet – the West, who lost in Total Pet to the Northeast because of their Veterinary segment performance.
The average performance of the 2019 Product winners was 140.7%, up from 134.6% – 10 were up. The average for the losers was 56.8%, down from 63.4% – 11 were down. The significant widening of the gap between best and worst indicates that Pet Products spending became less balanced across America in 2019. We should also note:
- Generation – Gen X replaced the Boomers at the top in 2018 and they continue to hold their ground.
- CU Composition, CU Size and # Earners – The new winners in all of these categories reinforce the growing “youth” and “higher income” movements in Pet Products and the total industry.
- Age – The high income 45>54 group replaced 55>64, specific evidence of the transition from Boomers to Gen X and of the growing importance of income in Pet Spending in all categories.
- Region – The West held on to the top spot but once again only 2 regions are performing above 100%
Almost all of the winners are the ones we expected, but the gap between them and the losers has increased.
It’s time to “Show you the money”. Here are segments with the biggest $ changes in Pet Products Spending.
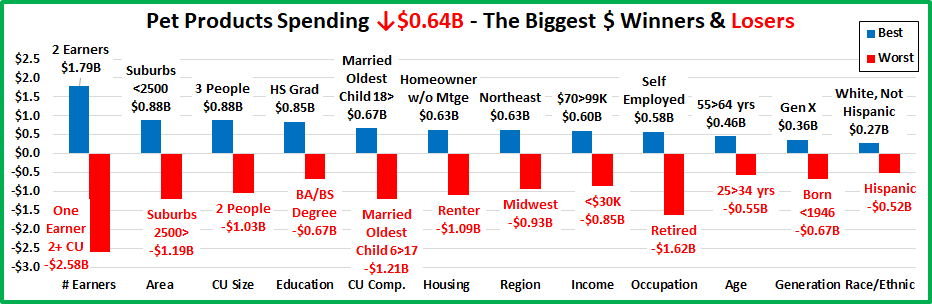
In this section we will see who drove Pet Products spending down. There are three repeats from 2018 and 9 Segments switched positions – from first to last or vice versa. This is less turmoil as 2018 had only 1 repeat but 15 flips. There is only 1 truly surprising winner, High School Grads Only. Here are the specifics:
- # Earners – The winner is new but 1 Earner, 2+ People CUs held on to the bottom spot.
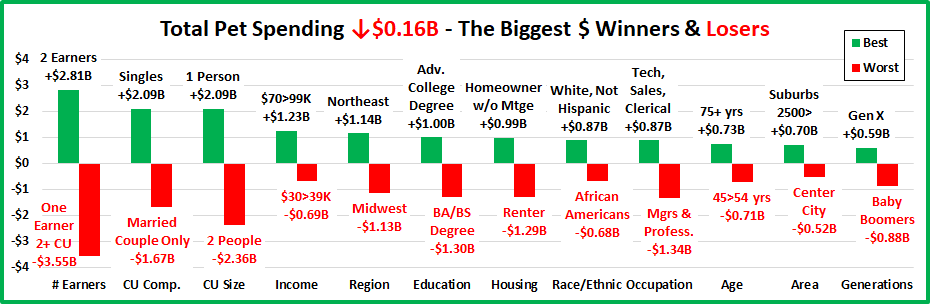
- Winner – 2 Earners – Products Spending: $20.49B; Up $1.79B (+9.6%) 2018: No Earner, Single
- Loser –– 1 Earner, 2+ CU – Products Spending: $8.67B; Down $2.58B (-23.0%) 2018: 1 Earner, 2+ CU
- Comment – The # of Earners is becoming more of a factor in Pet Products spending. Only CUs where all adults worked spent more, +$2.72B. The other CUs were down -$3.36B.
- Area Type – The larger Suburbs flipped from first to last.
- Winner – Suburbs <2500 – Products Spending: $8.90B; Up $0.88B (+11.0%) 2018: Suburbs 2500>
- Loser – Suburbs 2500> – Products Spending: $20.67B; Down $1.19B (-5.4%) 2018: Rural
- Comment – Anti-Urbanization? All areas under 2500 pop.: Up $0.95B; Areas over 2500 pop.: Down $1.58B.
- # in CU – The winner and loser held their spots. 1 and 3 People CUs were the only groups to spend more.
- Winner – 3 People – Products Spending: $8.96B; Up $0.88B (+10.9%) 2018: 3 People
- Loser – 2 People – Products Spending: $19.18B; Down $1.03B (-5.1%) 2018: 2 People
- Comment: All CU sizes spent less on Supplies but only 5+ CUs spent less on Food.
- Education – BA/BS Degree holders flipped from first to last.
- Winner – HS Grad Only – Products Spending: $7.08B; Up $0.85B (+13.6%) 2018: BA/BS Degree
- Loser – BA/BS Degree – Products Spending: $13.49B; Down $0.67B (-4.7%) 2018: HS Grad w/some College
- Comment – Education became less of a factor in 2019 Pet Products Spending. Only HS Grads with no formal degree spent more. Everyone else, <HS Grads and anyone with an Associates or College degree, spent less.
- CU Composition – Both the winner and loser are new.
- Winner – Married, Oldest child 18> – Products: $5.41B; Up $0.67B (+14.2%) 2018: Married, Oldest Child <6
- Loser – Married, Oldest Child 6>17 – Products: $5.55B; Down $1.21B (-17.9%) 2018: Married, Couple Only
- Comment – It truly was a strange year. Married Couples Only and Single Parents were down again. If you were married and had children, the oldest had to be under 6 or over 18 to spend more. Singles had a good year plus other all adult CUs with no kids, whether Married or not, also spent more.
- Housing – The winner and loser swapped places for the second year in a row.
- Winner – Homeowner w/o Mtge – Products: $12.77B; Up $0.63B (+5.2%) 2018: Renter
- Loser –– Renter – Products Spending: $9.58B; Down $1.09B (-10.2%) 2018: Homeowner w/o Mtge
- Comment– Wealthier Homeowners who have paid off their homes, but are not retired, appear to be the drivers.
- Region – Both the 2018 winner and loser flipped in 2019.
- Winner – Northeast – Products Spending: $8.47B; Up $0.63B (+8.0%) 2018: Midwest
- Loser – Midwest – Products Spending: $10.19B; Down $0.93B (-8.4%) 2018: Northeast
- Comment – All regions spent less on Supplies but more on Food. Only the Northeast had a Products $ increase.
- Income – Both winner and loser were new.
- Winner – $70 to $99K – Products Spending: $8.76B; Up $0.60B (+7.4%) 2018: $150 to $199K
- Loser – <$30K – Products Spending: $6.06B; Down $0.85B (-12.3%) 2018: $50 to $69K
- Comment – There was a clear divide in spending by income. Every income group making less than $70K spent less. Every group above $70K spent more. The lowest income member of both either won or lost.
- Occupation – Both the Winner and Loser are new, but neither is surprising.
- Winner – Self Employed – Products Spending: $4.92B; Up $0.58B (+13.4%) 2018: Tech, Sales, Clerical
- Loser – Retired – Products Spending: $7.12B; Down $1.62B (-18.5%) 2018: Blue Collar Workers
- Comment – Blue Collar workers and low level white collar workers also spent more. Spending decreases by their Managers and Retirees produced the decrease in Products $.
- Age – The 55>64 year olds (mostly young Boomers) flipped from last to first.
- Winner – 55>64 yrs – Products Spending: $11.54B; Up $0.46B (+4.2%) 2018: 65>74 yrs
- Loser – 25>34 yrs – Products Spending: $6.09B; Down $0.55B (-8.3%) 2018: 55>64 yrs
- Comment: The spending dividing line was unusual to say the least – 25 years old. The <25 yrs group spent more on Supplies. All older groups spent less. For Food, the exact opposite was true. However, when you added up the changes in Food and Supplies, only the 45>54 and 55>64 year olds spent more on Pet Products.
- Generation – Both the winner and loser are new, but neither is a surprise.
- Winner – Gen X – Products Spending: $15.50B; Up $0.36B (+2.4%) 2018: Millennials
- Loser – Born <1946 – Products Spending: $3.58B; Down $0.67B (-15.7%) 2018: Baby Boomers
- Comment – All Generations spent less on Supplies and everyone born after 1945 spent more on Food. However, when you add them up, Gen X was the only Generation to spend more on Pet Products.
- Race/Ethnic – White, Non-Hispanics gained ground in 2019 and now account for 86.2% of Pet Products’ $.
- Winner – White, Not Hispanic – Products Spending: $41.37B; Up $0.27B (+0.7%) 2018: Hispanic
- Loser – Hispanic – Products Spending: $3.73B; Down $0.52B (-12.1%) 2018: White, Not Hispanic
- Comment – White, Not Hispanics spent more on Food which produced positive Products $pending. All Minorities spent less on both Food and Supplies. African Americans & Hispanics had double digit % drops in Products $.
We’ve now seen the winners and losers in terms of increase/decrease in Pet Products $ for 12 Demographic Categories. 2019 was not a good year for Pet Products Spending. Food rebounded from the negative impact of the 2018 FDA warning on grain free dog food but couldn’t overcome the record drop in Supplies $ due to Tarifflation. All but 3 segments spent less on Supplies, but 75% spent more on food so that 36 (37.5%) spent more on Pet Products. Of course, not every good performer can be a winner but some of these “hidden” segments should be recognized for their outstanding effort. I’ve narrowed the group down to 6. They don’t win an award, but they deserve….
HONORABLE MENTION
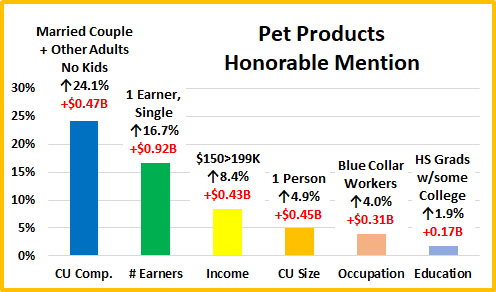
Honorable Mention
Pet Products spending was down $0.64B in 2019. However, It was again a mixed bag. A rebound in Food couldn’t quite counter the big, widespread drop in Supplies. Married Couples often lead the way but not in 2019. Only select segments like those with Other Adults but No Kids spent more. The # of Earners mattered more, including 1 Earner, Singles. In 2019 it was basically all about money as all groups with income over $70K spent more, including $150>199K. Spending by 1 Person CUs also continued to increase as they had a second consecutive year of 5% growth. They are still the worst performing size but are 30.2% of U.S. CUs and their numbers are increasing, +1.1M CUs in 2019. Spending by Blue Collar workers, especially nonService workers, began to bounce back after their drop in 2018. Finally, Education became a little less important in 2019 as High School Grads, including those with some College were the only segments in the category to spend more on Pet Products. Pet Products spending was down again in 2019 and like 2018, this drop was due to outside factors. 2018: FDA Warning; 2019: Tariffs
Summary
Spending has seen a lot of turmoil since 2015. Many consumers upgraded to Super Premium Food and cut back on Supplies in 2015. In 2016 they value shopped for Food and Spent some of the saved money on Supplies. In 2017 there was increased availability and value in both segments. More Consumers recognized the opportunity and spent $7B more. 2018 was calm, until the second half when the FDA warning on grain free dog food caused many consumers to downgrade their food and new tariffs on Supplies flattened spending growth. The result was -$1B drop in Products $.
In 2019 Pet Food spending rebounded to a new record level but the full impact of higher prices in the Supplies segment really hit home, with a record $2.98 decrease in spending. The drop was almost universal as 93 of 96 demographic segments spent less. The result was a -$0.64B drop in Pet Products $, the second consecutive decrease.
On the surface, one change was immediately apparent. In the demographic groups responsible for most of Pet Products Spending, $50K> was replaced by $70K>. In their spending share and rankings, # Earners and Age moved up while Higher Education and Marriage became less important. In performance, Income, Marriage and now Race/Ethnicity are the top 3. There were again 5 groups with 120+% performance as the Age Group rejoined the club. Total Pet has the same 5, plus Higher Education so Pet Products spending is still slightly more balanced than Total Pet.
When we looked at the performance of individual segments, most winners were expected. The 4 new winners reflect the movement to younger (Gen X vs Boomers) and higher income CUs.
The $ drop was smaller in 2019 and there was more stability than in 2018. In terms of $ change, 3 segments held their position (only 1 in 2018) and 9 flipped from 1st to last or vice versa (15 in 2018). However, there were fewer segments with increased spending, 36, compared to 54 last year. Most of the winners were the “usual suspects”. There was only one true surprise – High School Grads with no college. Many of the other winners support the trends to higher income and younger CUs – 2 Earners, 3 People, Married, Oldest Child >18. These segments all tend to be a big part of another winning segment – Gen X. However, Baby Boomers aren’t done yet – 55>64 yr olds and Homeowners w/o Mtges also won. Now…2020. By almost any measure, the pandemic made it a year like no other. Indications are that Pet Parents spent more time with and money on their pet children. The year was radically different, but our question will remain the same. Who was spending the money?
Finally,… The “Ultimate” 2019 Pet Products Spending CU is a married couple with 1 child over 18. They are in the 45>54 age range and are White, but not Hispanic. At least one has an advanced College Degree. Both of them work in their own business, earning over $200K. They still have a mortgage on their house located in a small Suburb in the West.