
Petflation: Pet Food – Comparing the CPI to the PPI
Inflation has certainly become top of mind recently. It’s a complex subject. In this report, we will look at how the Pet Food CPI (Retail Price) compares to its Producer Price Index (PPI – Manufacturers’ selling price). Both are important. Changes in the PPI affect the CPI (Retail Price). We will start with a chart that shows the cumulative annual inflation in the Pet Food PPI & the Pet Food CPI from 1997 to 2025.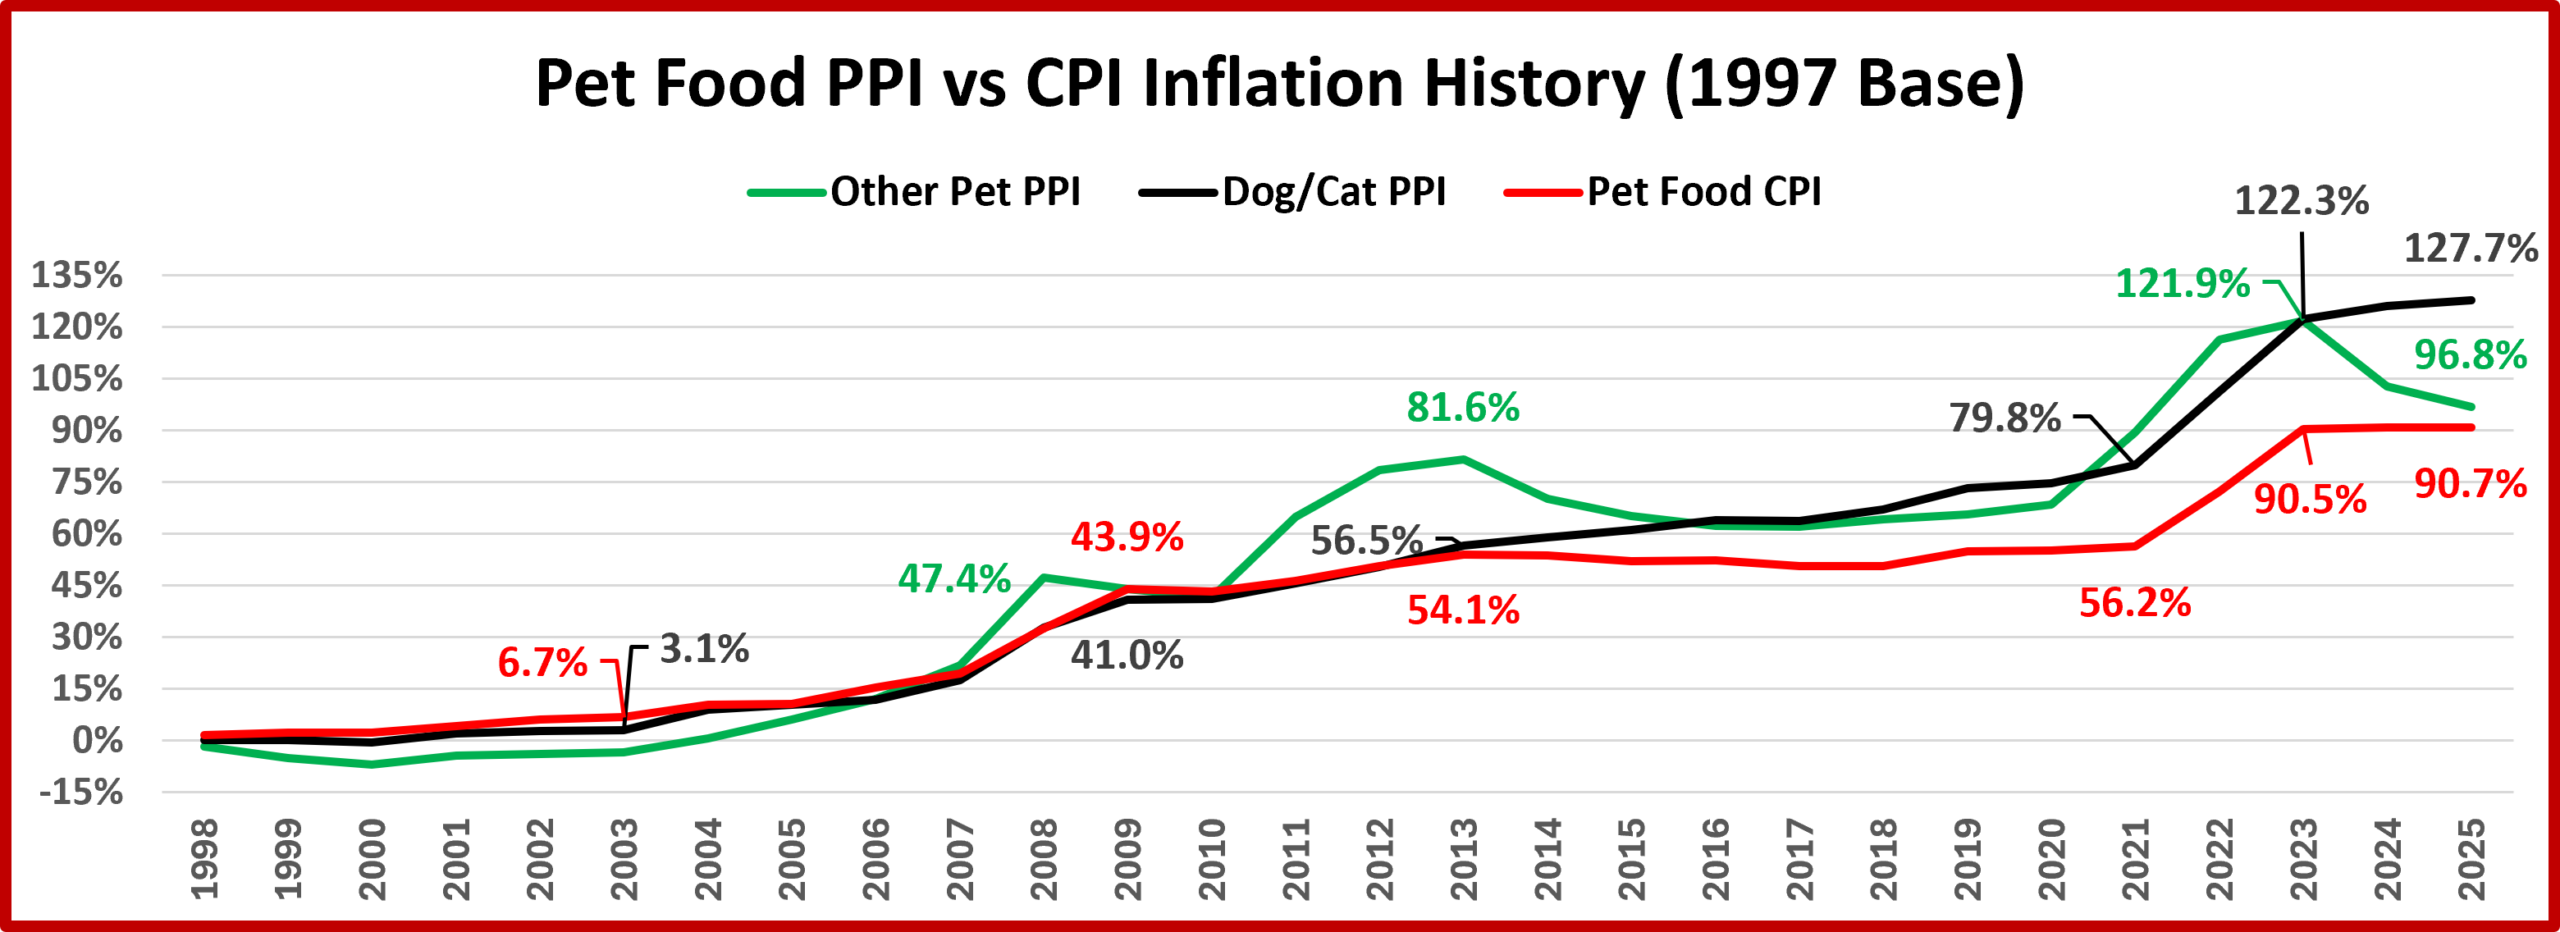
The chart is very simple. It includes the Pet Food CPI plus the Dog/Cat PPI and the PPI for Non Dog/Cat, Other Pets. Dog/Cat Food makes up the vast majority of Pet Food sales, and it drives the Pet Food CPI. However, I thought that this chart would be of interest. From 1997 to 2007 the Other Pet PPI matches Dog/Cat, but It had bigger lifts in 2008 and 2011>13. The biggest difference occurred recently. Both had lifts from 2021 to 2023 but the Other Pet PPI fell -11.3% 2023>2025 while the Dog/Cat PPI continued slow growth, +2.4%.
The Dog/Cat PPI is obviously the most important. Its path almost exactly matches the CPI until 2014 when it rose above retail price growth. What happened in 2014? In the 2nd half of the year, Super Premium Pet Food was launched. This included raw food, which requires constant refrigeration. In all previous years, the path to the consumer was Manufacturer > Distributor > Retailer > Consumer. Manufacturers began to think of ways to shorten the trip. The obvious choice was to eliminate distributors and sell directly to Retail, especially for items that required refrigeration. The internet facilitated this plan and even made it possible for some Manufacturers to sell direct to consumers. This allowed the Manufacturers to increase their selling price without impacting retail. This disparity continues but the Dog/Cat Food PPI and Pet Food CPI have had the same pattern since 2019. Now, let’s look deeper within Dog & Cat Food.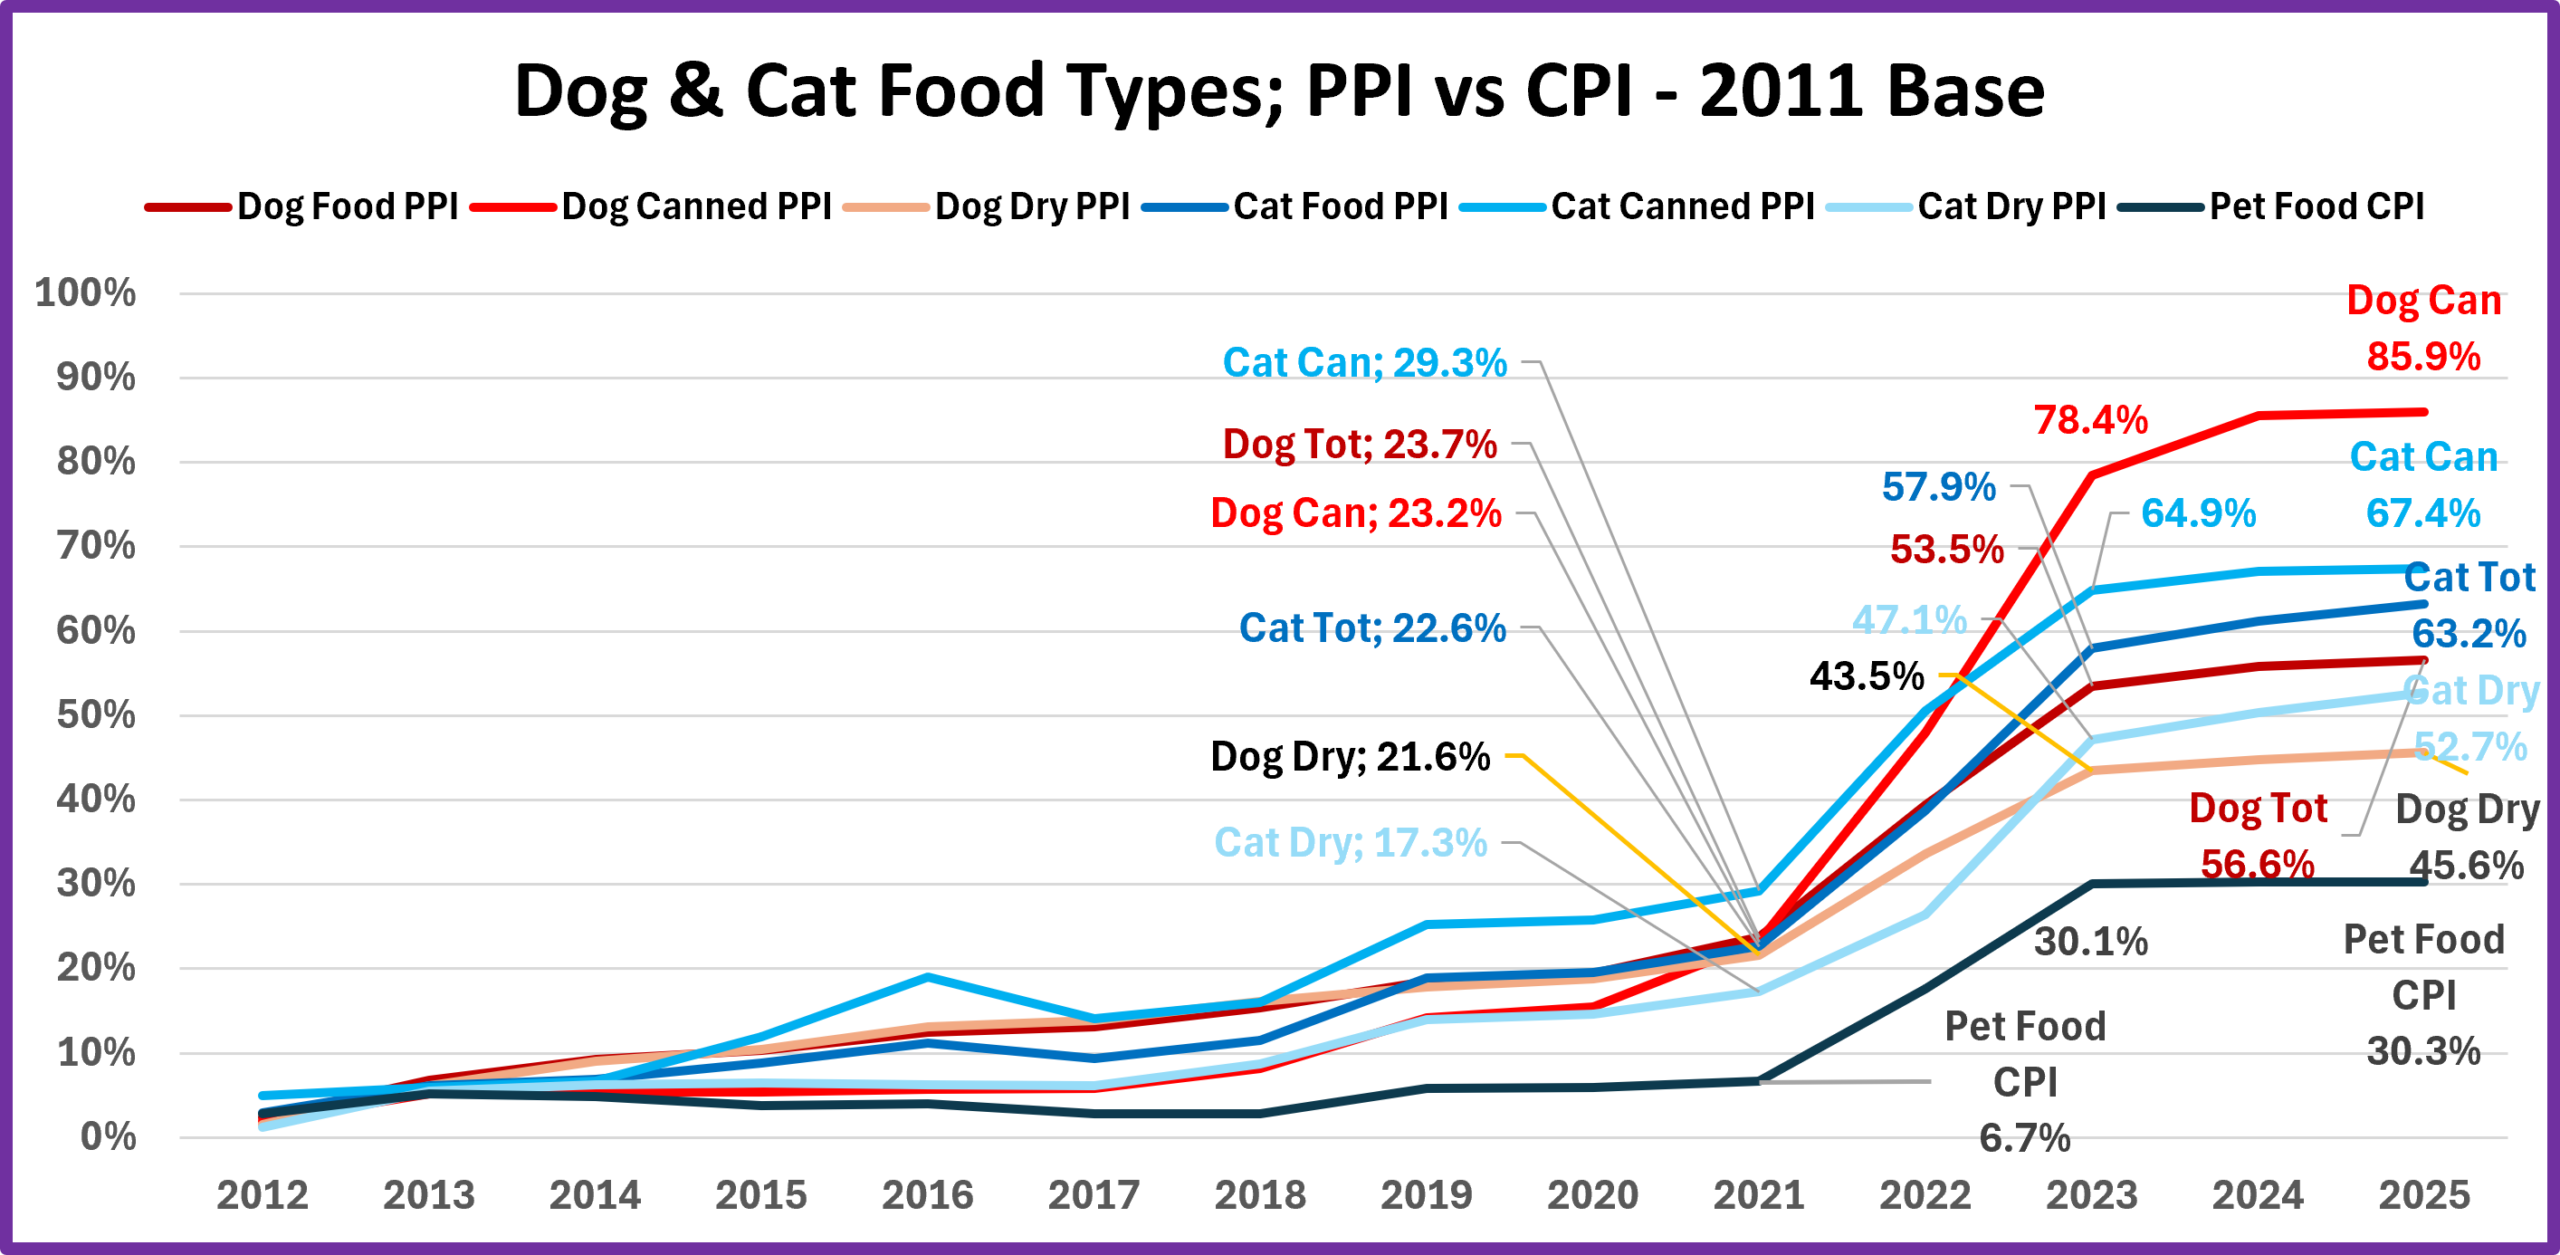
All significantly exceed the CPI but generally match its pattern. Canned/Wet/Raw have the 2 highest inflation rates, but Dog didn’t take the top spot from Cat until 2023. Canned Dog PPI inflation is 88% more than dry Dog. All cumulative rates are more than double 2021, but the CPI is 4.5 times more. No real surprises, just reinforced expectations. Finally, we’ll take a closer look at recent history. This chart shows the monthly CPI vs specific PPIs from May 2024 to May 2026.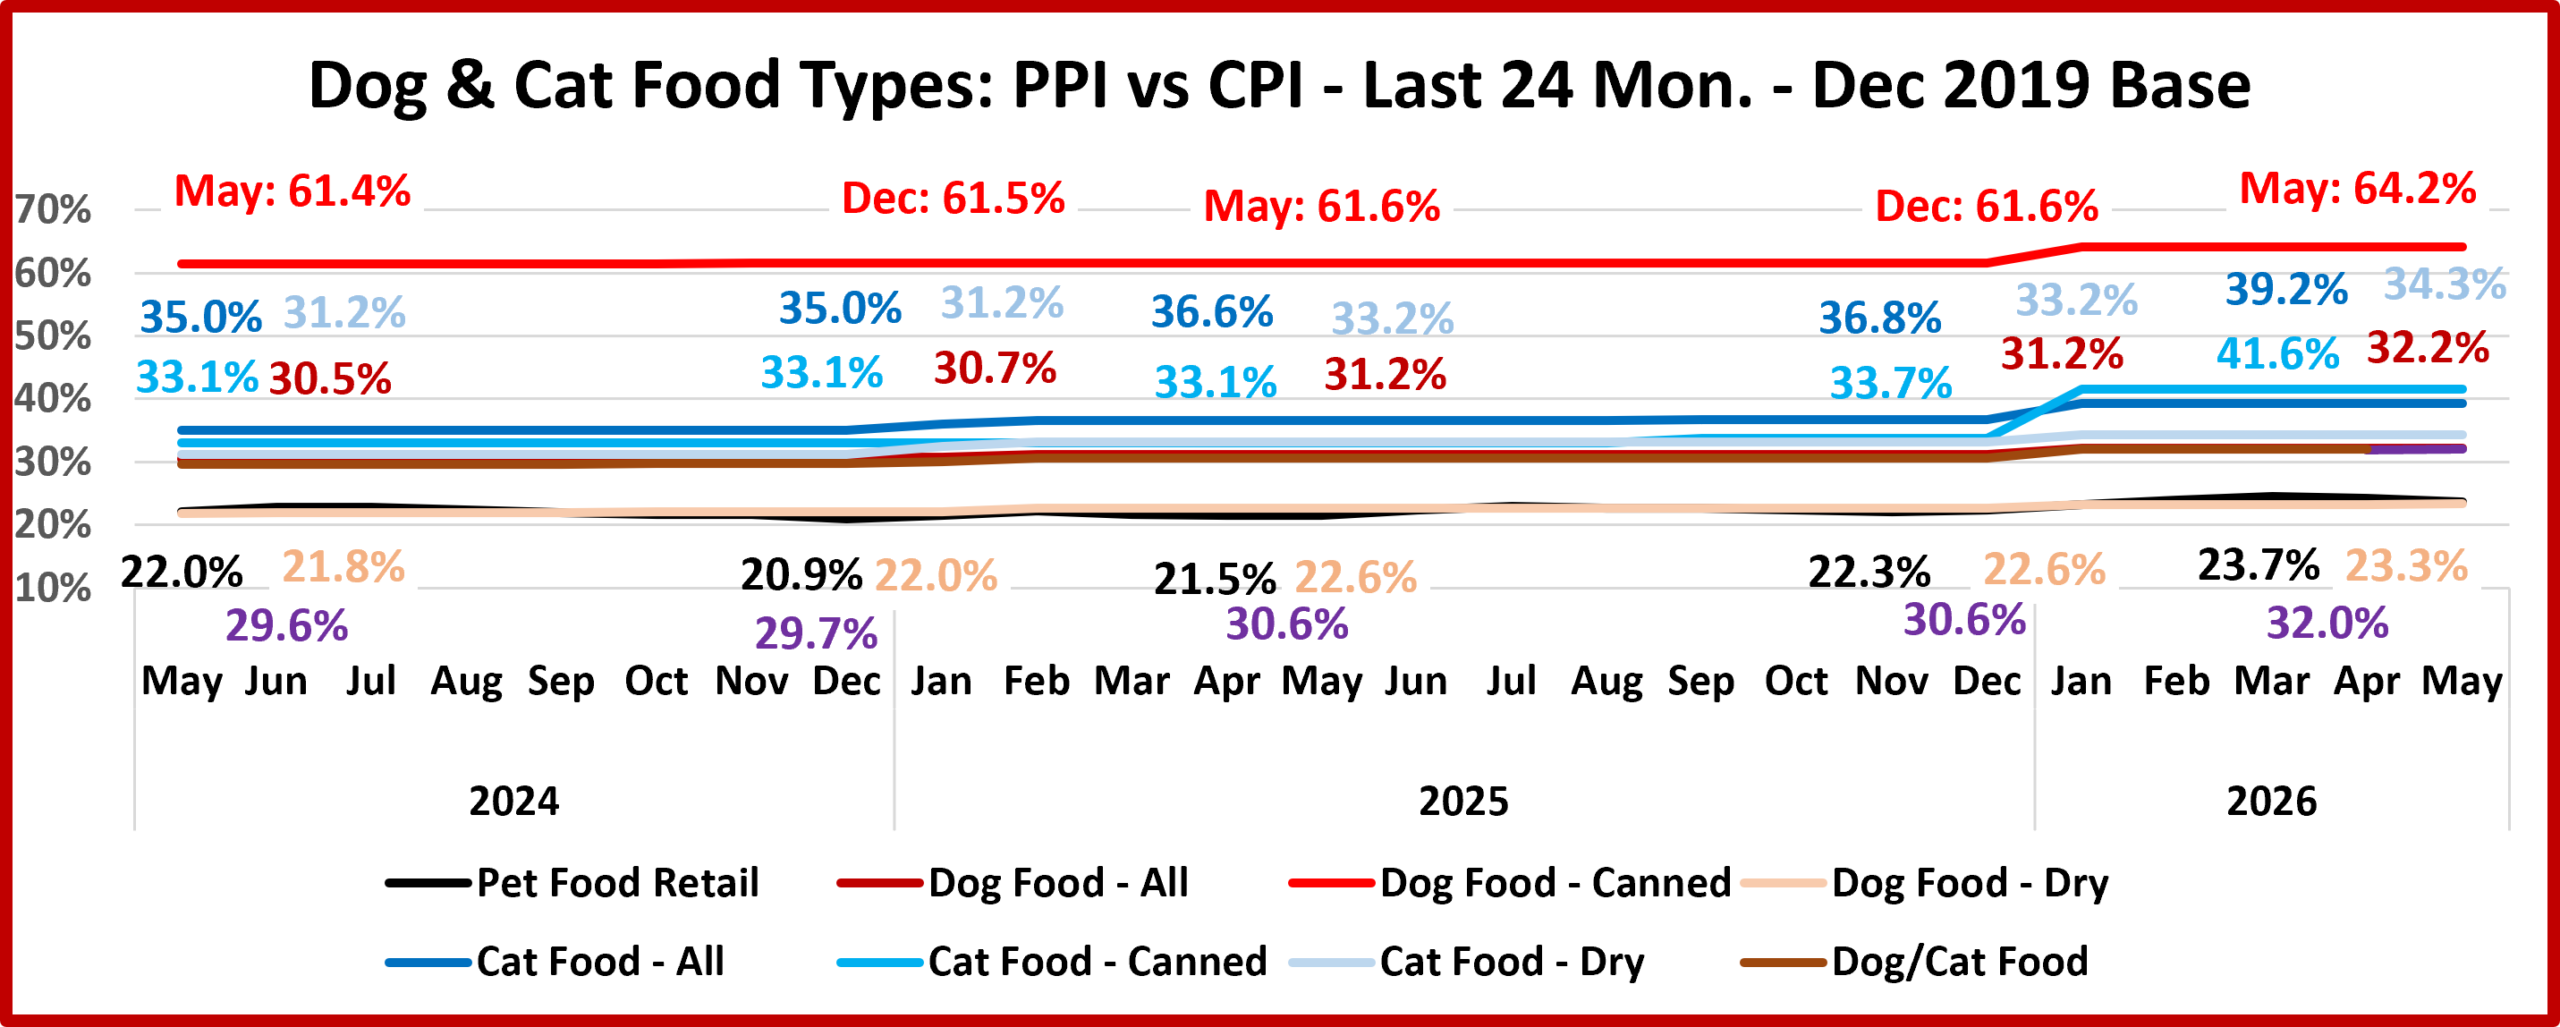
We see a lot of “flat” in both the PPIs and the Pet Food CPI. There are only 2 significant lifts on the whole chart. Both are canned food PPIs and occurred in January 2026. The biggest was Canned Cat Food, +5.9%. #2 was Dog Canned, +1.6%.
The Pet Food CPI has only risen 1.4% in the last 24 months. That’s a big change from -0.02% deflation but almost nothing when compared to the 21.9% price lift from 2021 to 2023. We can’t forget that inflation is cumulative. Although the CPI is flat, the May 26 retail price of Pet Food is within 0.6% of the March record high.
Canned/Wet/Raw Dog & Cat Food drove the 22/23 pricing surge and still lead the way in the current PPIs. Here are recent PPI % lifts by animal and type: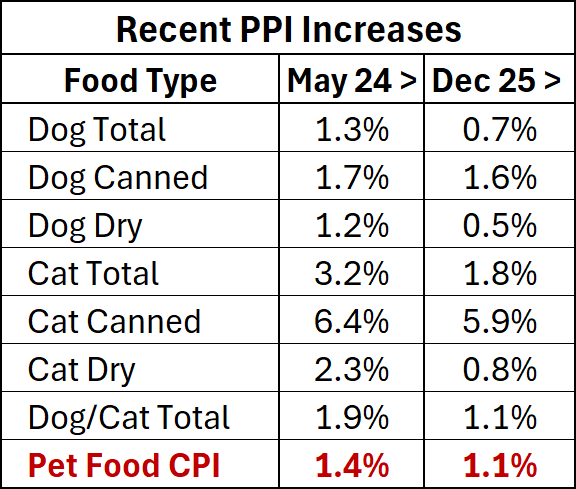
You see that the Pet Food PPI lift over the last 2 years was primarily driven by Cat Food. That’s not unexpected. The Canned/Wet Cat Food PPI is up 6.4% since May 24, 3.8 times more than the 1.7% lift in Canned/Wet Dog Food. Almost all of both canned lifts came from a big December 25 > January 26 PPI increase. The Dry Cat PPI lift since May 24 was +2.3%, almost double the 1.2% increase in Dry Dog Food. That means that Total Cat was +3.2%, 2.5 times more than the +1.3% in Total Dog. As stated, this was not unexpected. However, the difference was much larger than average. The lift in the Total Cat PPI from 2011>2025 was only 14% more than the lift in Total Dog.
The Pet Food CPI spiked in 22/23, flattened in 24 and even fell slightly in 2025. Prices rose from Dec 25 to Mar 26 (Record High), then fell slightly in Apr/May. You see that the Total Dog/Cat PPI lift in 2026 is +1.1%. This is exactly equal to the Pet Food CPI increase. This is a good sign. It says that pet parents have already paid for the recent PPI lifts. Both Retail and Manufacturers’ Prices should stay high but remain relatively stable at least for the next few months. Of course, this could all change quickly due to an unexpected event, like a sudden new supply chain problem. We’ll just wait and see.
Before I end the report, I want to bring up an observation that is largely under the radar but may be significant. It is in the Food Types chart with the 2019 base. We have noted that the different Food PPIs have a big disparity with the Pet Food CPI but a very similar pattern. If you look at the 2024>2026 value line for the Dry Dog Food PPI, you see that the pattern is more than just similar to the CPI. In fact, the data and resulting line almost exactly match the CPI. Consider these facts. Dry Dog food is the largest $ segment in Pet Food. It is still expensive but has the lowest price for this needed product category. It is also the easiest to value shop – in store and online. Maybe Pet Parents who buy dry dog food are helping to slow Petflation.

