GLOBAL PET EXPO 2024…Innovation in Motion!

Global Pet Expo, the Pet Industry’s premiere event, is back to near “normal”. The exhibitor count is up from 2023 and should reach 1136 (+11% vs 23) by showtime. This is lower than the 1173 peak in 2019 but it is still more than enough.

Live events are critical in the Pet Industry because of our attitude towards Pets and Pet Products. Pets are an integral part of our families, and we now increasingly personify them. Pet shows are primarily focused on Pet Products. Studies have shown that over 60% of consumers prefer to make initial buying decisions on Pet Products in person. This makes Pet Products 2nd  only to fresh groceries in this behavior. This preference applies to all Pet Products buyers, not just consumers. The retailers and distributors attending GPE and SuperZoo want to see and touch a new product before they buy. Live shows are not just important, they are critical to the continued growth and strength of the Pet Industry.

The Pandemic crisis is over, but it has been replaced by a new worry – strong inflation. You will see evidence of its impact in the makeup of exhibitors at GPE 2024. Consumers are looking for Value (Quality + Price). One way to get it is through Private Label products. GPE 24  has  over 120 companies actively soliciting EOM customers. Foreign companies are especially capable of EOM, so their booth share has surged to 36%. The previous peak was 25% in 2019. These trends have also affected individual product categories. Now, let’s take a brief look at what awaits attendees of GPE 2024.

As we said, the show is smaller than the 2019 peak, both in square footage (-2.5%) and number of exhibitors (-3.3%) but there is still more than enough to satisfy the needs and wants of every buyer that attends. Here are some relevant facts.

  • 1110 Booths – assigned as of 2/16 but, with commitments the final count should be 1136
  • 344,000 sq ft of exhibit booth space (Not counting the 45,000 sq ft new product area)
  • 20 x 10 is again the most popular size – 411 (36.2%), but 10 x 10 is a close 2nd with 389 (34.2%)
  • Booths are smaller – the average size is 303 sq ft, -4% from 2023, largely due to the 10.9% increase in exhibitors.
  • Size matters – Booths 300 to 800 sq ft (25%) occupy 41% of the space. Those with 1000+ sq ft (5%) cover 24%.

Will you see any new exhibitors or is it the usual group? There have been 8 live pet trade shows from 2019>23 – 4 GPEs and 4 SZs. There are 1110 exhibitors at GPE 24 but It took 3305 companies to fill all 9 shows. Of the GPE 2024 exhibitors:

  • 167 (15%) – Did all 8 other shows
  • 692 (62%) – Did GPE 2023
  • 328 (30%) – Are new to GPE (at least from 2019>23)
  • 267 (24%) – Did NO other shows from 2019>2023

The percentage of exhibitors new to GPE this year is slightly above “normal”. There is definitely plenty of “New” to see.

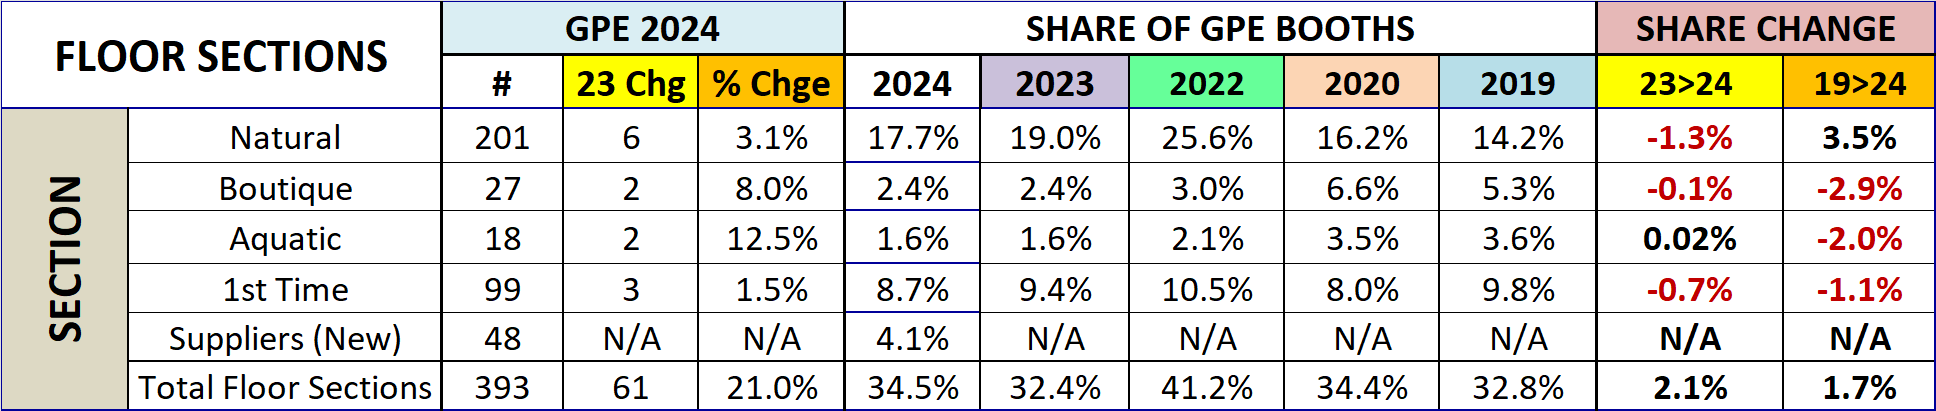
Special “Floor Sections” at GPE account for 34.5% of Booths, up from 32.8% in 2019. This was due to the addition of Suppliers. The primary comparison of GPE 2024 to previous years in this and other areas will be by share of booths.

  • Natural – 201 Booths. The number of booths in this section is again at an all-time high. The share is down slightly from 2023 but +25% vs 2019. This reflects the strength of the natural trend in our whole society.
  • Boutique (Modern Pet) – 27 Booths. The booth share is even with 2023 but down 55% from 2019. Boutique is essentially the opposite of Natural and more discretionary in a country that is increasingly focused on “needs”.
  • Aquatic – 18 Booths. The popularity of this category stabilized but the booth share is down 56% from 2019.
  • 1st Time Exhibitors – 99 Booths. The share continues to trend down but most of the 328 exhibitors who didn’t exhibit at GPE (at least from 2019>2023) chose the regular floor or another special section. GPE is a “must do” for new companies and New – products and companies are a major focus of GPE.
  • Supplier – 47 Booths. The APPA added this section in response to the growing popularity of EOM products.
  • International – The big news is the foreign surge. There are 406 exhibitors (36%) from 35 countries outside the U.S at GPE 2024. GPE is truly GLOBAL!

There are large numbers of exhibitors in the “regular” floor space who would qualify for inclusion in these sections. You need to “work” the whole show to ensure that you get a full view of the product categories of interest to you. I will again be creating a GPE Exhibitor Visit Planner that allows attendees to plan their floor time by targeting the exhibitors with products of interest. The GPE 2024 SuperSearch will be made available by March 4th and be regularly updated with last minute changes. Now, let’s take a look at the results from this year’s research on exhibitors’ product offerings.

1st, we’ll Compare Exhibitor Types– By function: By Animal type (Numbers are based on booths assigned by 2/16/24)

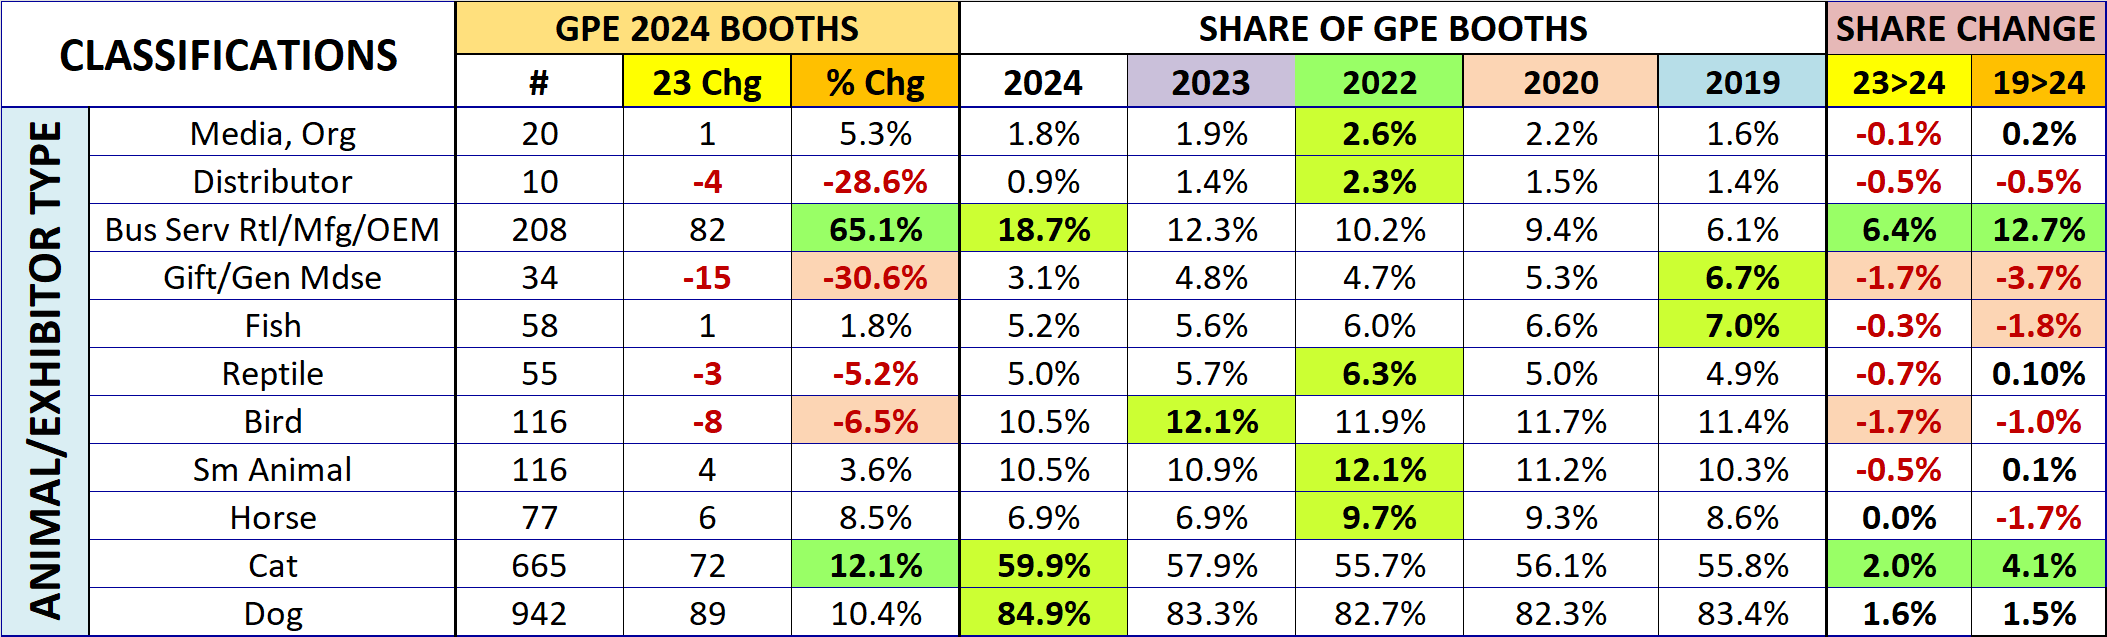
Results were mostly negative as only 3 categories gained share from 2023.

  • Dogs Still Rule – They are up to 84.9% of all booths. 6 out of every 7 booths are selling dog products.
  • Cats had the biggest gain of any animal, now offered by 59.9% of exhibitors. Up from 40% back in 2014.
  • Fish/Aquatic – This category continues to lose share and is down 51% from 2017.
  • Other Animals – Horses were stable. All others lost share. The biggest drop was in Birds, -1.7%.
  • Business Services – Inflation continues to drive the popularity of private label/OEM products. The huge lift in count and share reflects the changing needs in the industry. BTW, there were only 8 exhibitors in 2014.
  • Distributors – Their share fell below 1% for the 1st The supply chain is shortening for many categories.
  • Gift/Gen Mdse – A big drop after a slight lift in 23. It has been generally declining since peaking at 7.8% in 2016.

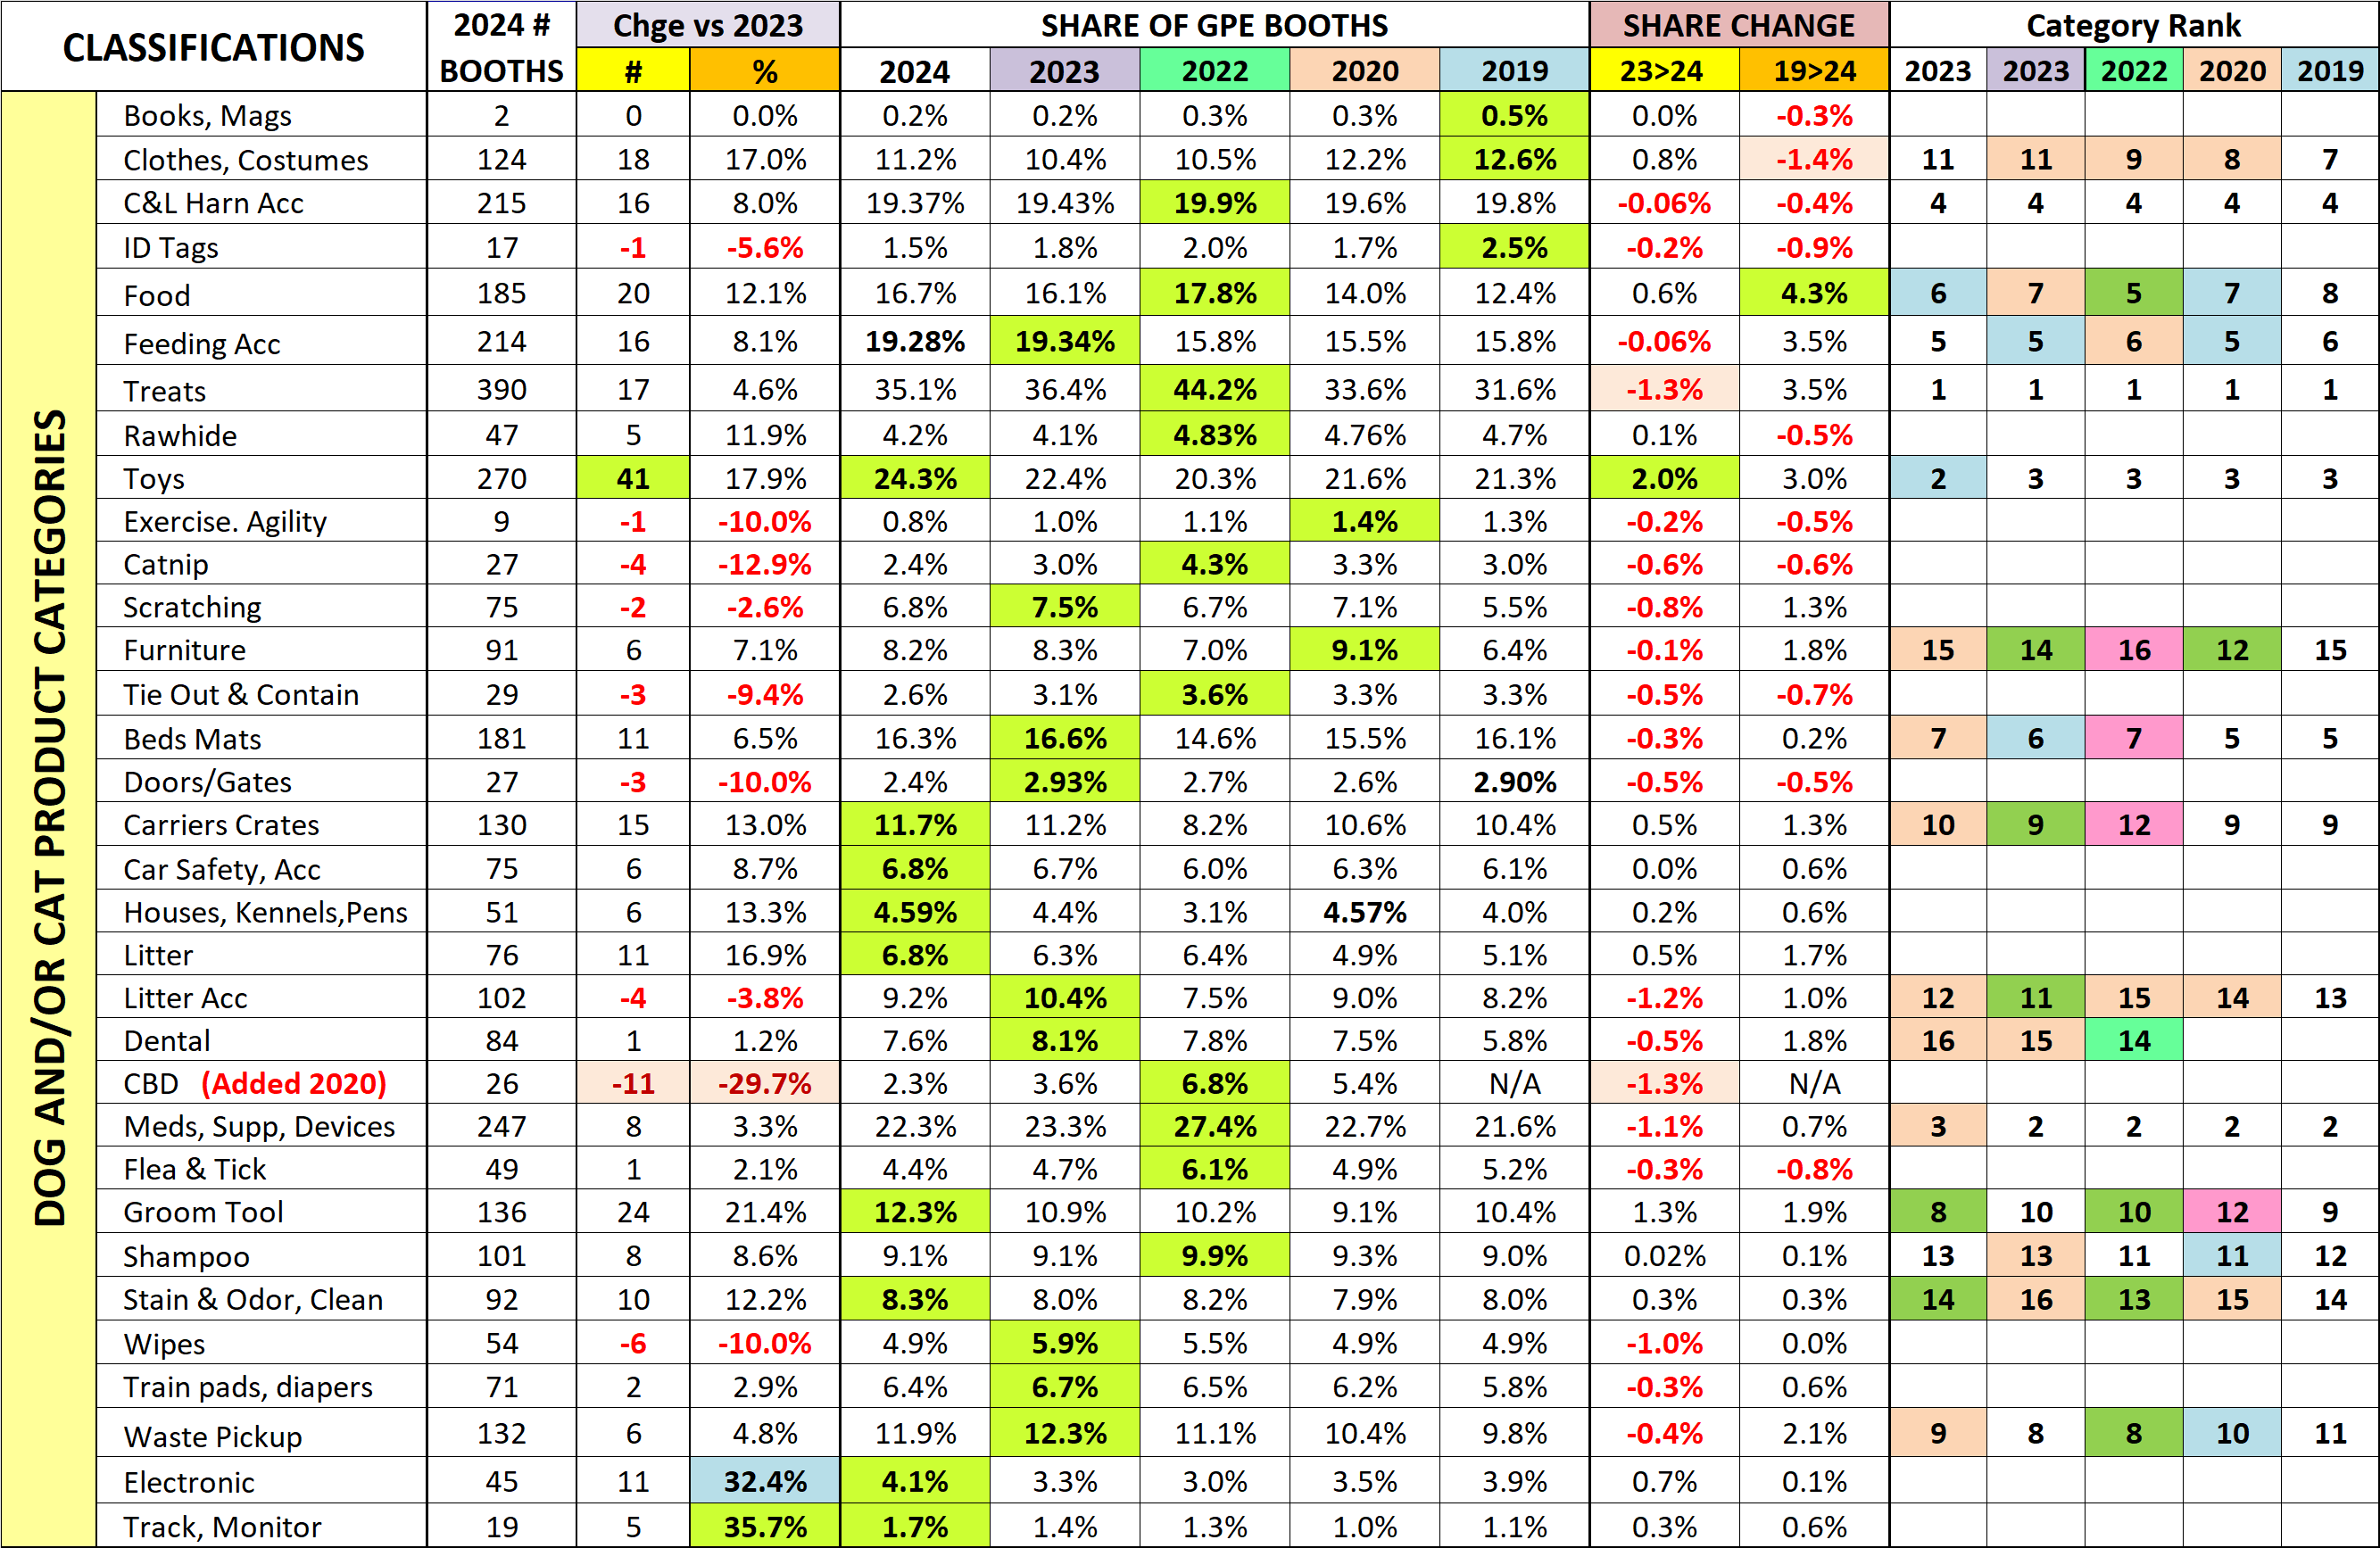
Dogs and Cats are still the undisputed royalty of Pet. Because of their huge impact on the industry. I have divided the products designed for them into 33 subcategories. Let’s see how this year’s GPE Top Ten (by booth count) are doing.

All have more booths than 2023, but the ranking  changed for 7 – 3 up & 4 down, including the 1st change in the top 4 in years. The biggest share gain was by Toys, while Treats had the biggest loss.

  • Treats are still #1 although their share fell by -1.3%. Their priority is reflected in their frequency – 1 in 3 booths offers treats. Many supplements are in treat form and have helped maintain treats at the top.
  • Toys – With a big increase in booths, Toys moved up to #2. This is directly tied to the huge surge in Chinese companies. 246 exhibitors (21.7%) – 1 in 5 booths, are now based in China.
  • OTC Meds/Supplements/Devices – A slight gain in booths but a -1.1% drop in share. They are down 5.1% in share from their peak in 2022. However, in 2014, their share of boot was only 11%.
  • Collars, Leads & Harnesses – They held the #4 spot and their share has been stable since 2019 after falling from 22.1% in 2018. In 2016, they also had a 22.1% share which earned them the #2 ranking.
  • Feeding Acc. They held on to #5. Their share surged in 23 & held in 24 with the return of foreign exhibitors.
  • Food remains a priority as Pet Parents focus on nutrition, health and wellness. However, almost all is USA made.
  • Beds/Mats – Fell from #6 to #7. Their share has improved in 23 & 24 with the influx of Far East exhibitors.
  • Grooming Tools – They moved up from #10 to #8 and reached a record share. Once again, Chinese companies are a primary source for this product category.
  • Waste Pickup – They fell from #8 to #9 largely because of the huge surge by Grooming Tools.
  • Carriers/Crates – Fell from #9 to #10 but set a record share, due to the continued increase in Chinese exhibitors.

Pet Parents’ concern for the overall health and wellness of their “pet children” remains a big priority but the impact of strong Petflation has pushed the “value” of Private Label products to the forefront. Their EOM capabilities plus the end of travel restrictions has caused an unparalleled surge in foreign exhibitors. They now occupy over 400 booths (36%). In pre-pandemic 2019 they had 295 booths (25%). You first see the impact at the animal type level. In EOM, Dog & Cat are where the $ are and both reached a record booth share in 2024. Some product categories are also showing an elevation in share including Toys, Bowls/Feeders, Beds, Carrier/Crates and Grooming Tools.

The last chart details the specifics for all 33 of the Dog/Cat product categories that I defined. Of note: All the data inputs for this report and the SuperSearch tool come from a review of the GPE online exhibitor product listings AND visits to over 1300 websites. They’re not 100% accurate, but pretty close. Which categories are of interest to your business?

GPE 2024 is about innovation and fulfilling needs. There are products, services and education to fulfill every need and…want. There is also an abundance of “new” – both in products and the 260+ exhibitors who are new to Pet Industry shows. However, to reap the benefits, you need a plan. Exhibitors must showcase the “right” items. Attendees need to strategically analyze their data, determine what they need to improve their business and develop a plan to find the products to fulfill their needs. Then…execute the plan. If they do nothing else at GPE, attendees will have 1 minute and 10 seconds to spend at each booth. You definitely need a plan! The GPE 2024 SuperSearch will be available the week of March 4th. It can help. Try it out. Good luck in Orlando!

Petflation 2024 – January Update: Down to +4.7% vs Last Year

Inflation slowed in January. The monthly Consumer Price Index peaked back in June 2022 at 9.1% then began to slow until turning up in Jul/Aug 2023. Prices fell in Oct>Dec but turned up in January. However, the CPI actually decreased to +3.1% from +3.4% due to a big monthly price lift in 2023. Grocery inflation continues to slow. After 12 straight months of double-digit YOY monthly increases, grocery inflation is now down to +1.2%, 11 consecutive months below 10%. As we have learned, even minor price changes can affect consumer pet spending, especially in the discretionary pet segments, so we will continue to publish monthly reports to track petflation as it evolves in the market.

Petflation was +4.1% in December 2021 while the overall CPI was +7.0%. The gap narrowed as Petflation accelerated and reached 96.7% of the national rate in June 2022. National inflation has slowed considerably since June 2022, but Petflation generally increased until June 2023. It passed the National CPI in July 2022 and at 4.7% in January, it is still 51.6% above the national rate of 3.1%. We will look deeper into the numbers. This and future reports will include:

  • A rolling 24 month tracking of the CPI for all pet segments and the national CPI. The base number will be pre-pandemic December 2019 in this and future reports, which will facilitate comparisons.
  • Monthly comparisons of 24 vs 23 which will include Pet Segments and relevant Human spending categories. Plus
    1. CPI change from the previous month.
    2. Inflation changes for recent years (22>23, 21>22, 20>21, 19>20, 18>19)
    3. Total Inflation for the current month in 2023 vs 2019 and vs 2021 to see the full inflation surge.
    4. Average annual Year Over Year inflation rate from 2019 to 2023
  • YTD comparisons (Since it is January, this month’s numbers are the YTD rate.)

In our first graph we will track the monthly change in prices for the 24 months from January 22 to January 24. We will use December 2019 as a base number so we can track the progress from pre-pandemic times through an eventual recovery. This chart is designed to give you a visual image of the flow of pricing. You can see the similarities and differences in segment patterns and compare them to the overall U.S. CPI. The year-end numbers and those from 12 and 24 months earlier are included. We also included and highlighted (pink) the cumulative price peak for each segment. In January, Pet prices were up from last month as lifts in Services & Supplies overcame drops in Food & Veterinary.

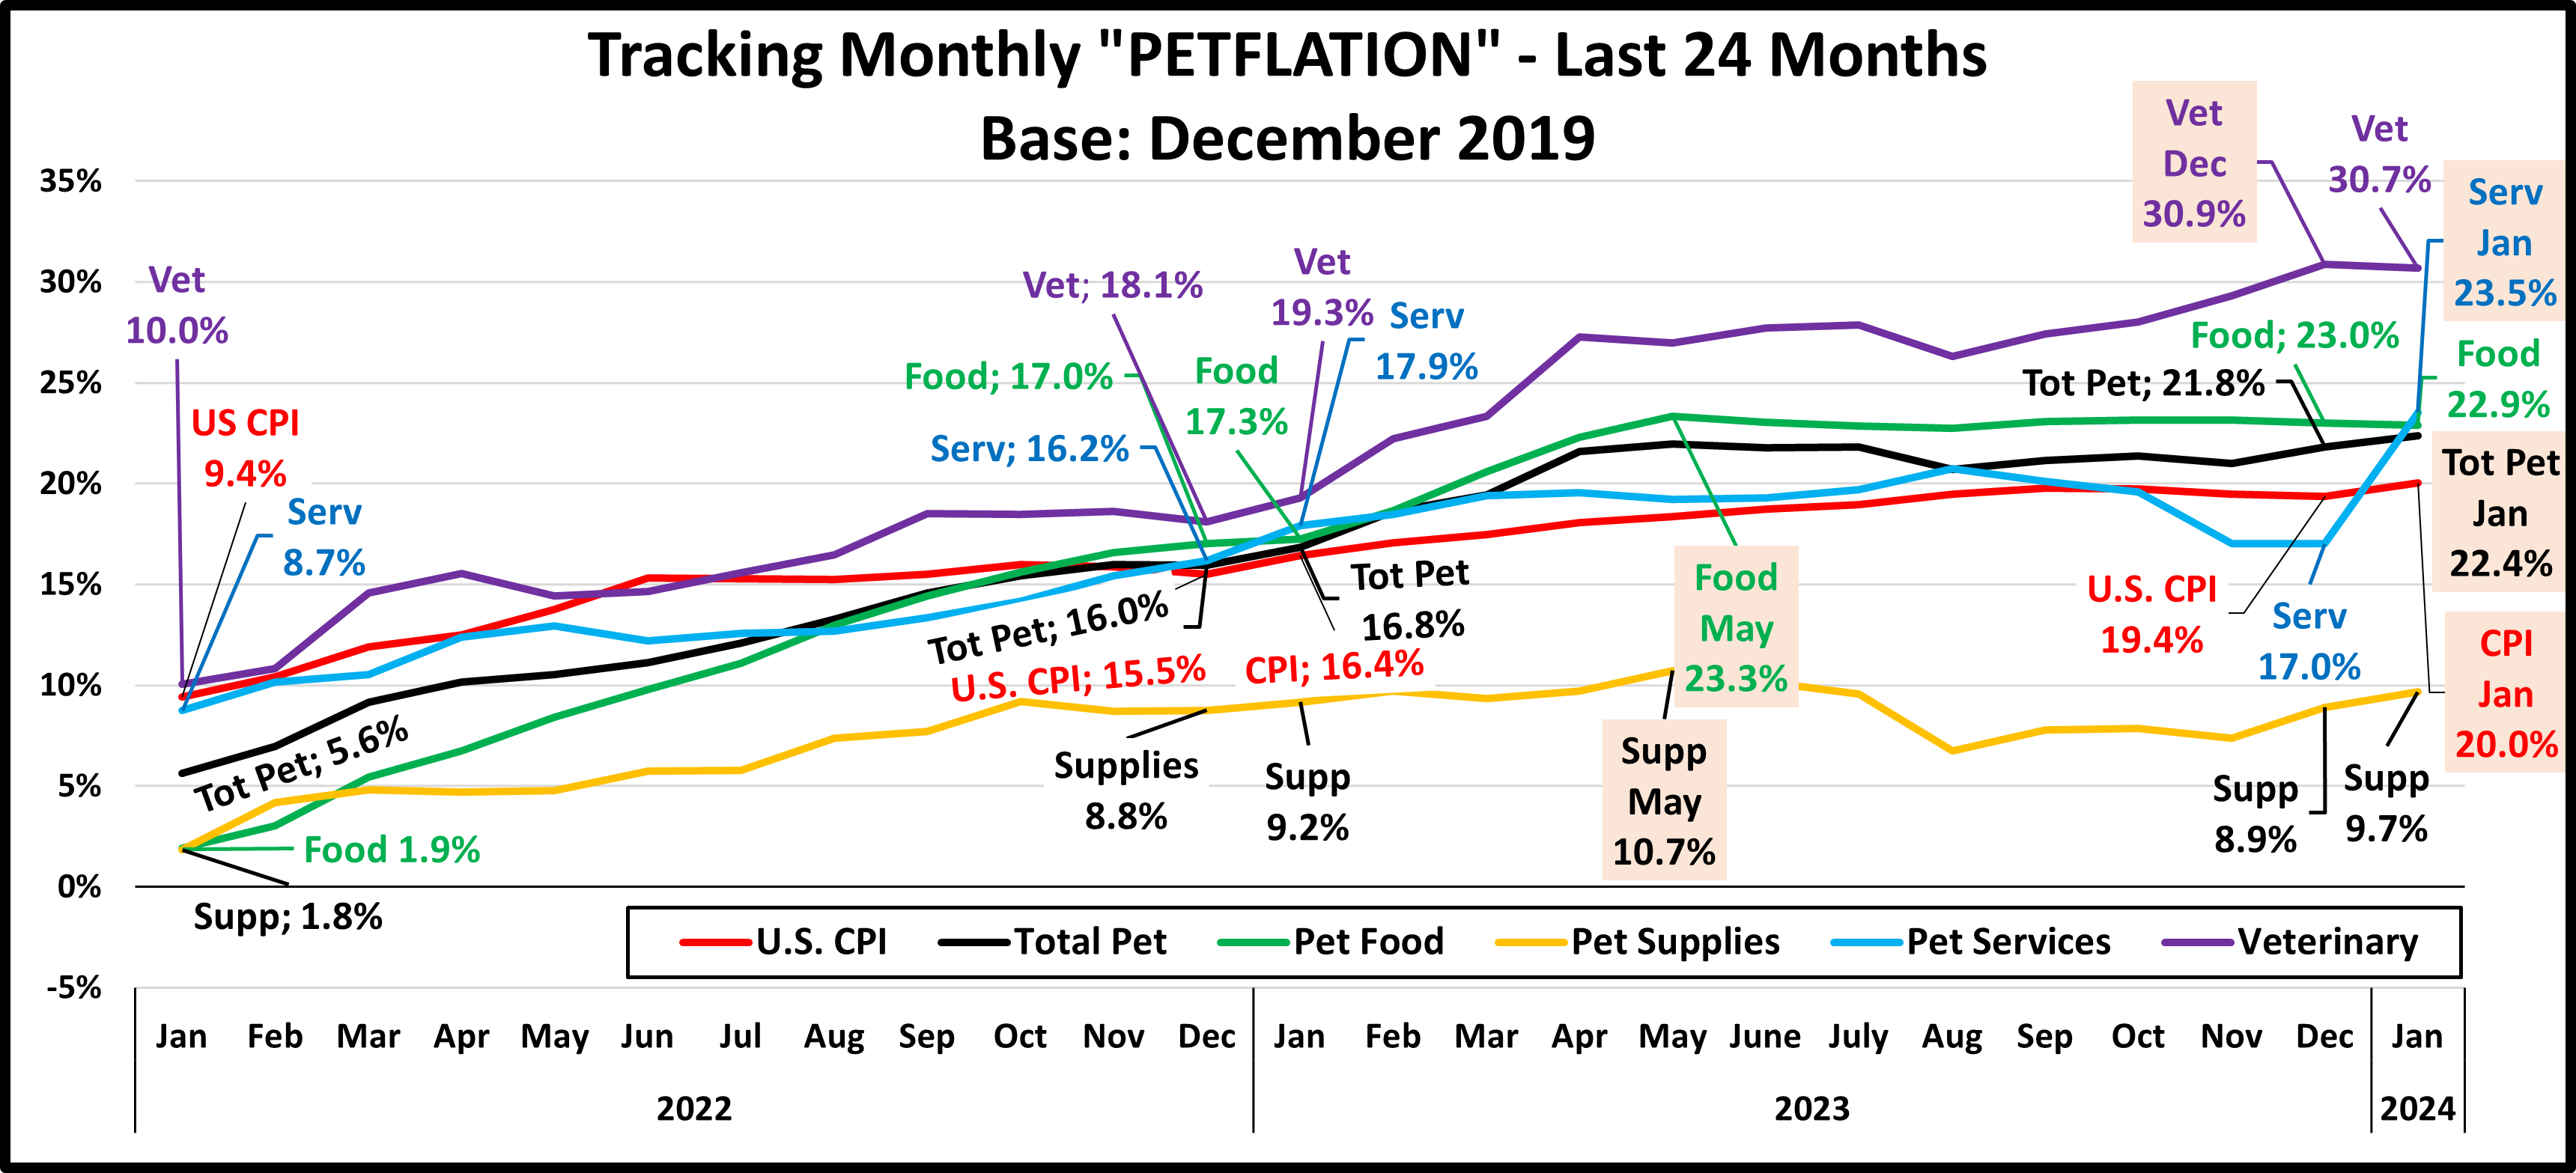
In January 22, the cumulative CPI was +9.4% and Pet prices were +5.6%. Like the CPI, prices in the Services segments generally inflated after mid-2020, while Product inflation stayed low until late 21. In 22 Petflation took off. Food prices grew consistently but the other segments had mixed patterns until July 22, when all increased. In Aug>Oct Petflation took off. In Nov>Dec, Services & Food prices continued to grow while Vet & Supplies prices stabilized. In Jan>Apr 23, prices grew every month except for 1 dip by Supplies. In May Products prices grew while Services slowed. In June/July this was reversed. In August all but Services fell. In Sep/Oct this was reversed. In November, all but Food & Vet fell. In December Supplies & Vet  drove Total Pet prices up. In January, Food & Vet prices fell while Supplies & especially Services prices surged. Note: With cumulative inflation, all but Supplies are now at or within 0.4% of their pricing peak.

  • U.S. CPI – The inflation rate was below 2% through 2020. It turned up in January 21 and continued to grow until flattening out in Jul>Dec 22. Prices turned up Jan>Sep, dipped in Oct>Dec then rose in Jan. but 30% of the 22.4% increase in the 49 months since December 19 happened in the 6 months from Jan>Jun 22 – 12.2% of the time.
  • Pet Food – Prices were at or below Dec 19 levels from Apr 20>Sep 21. They turned up and grew, peaking in May 23. They have essentially stabilized at this record level. 93% of the 22.9% increase has occurred since 2021.
  • Pet Supplies – Supplies prices were high in Dec 19 due to added tariffs. They then had a “deflated” roller coaster ride until mid-2021 when they returned to Dec 19 prices and essentially stayed there until 2022. They turned up in January and hit an all-time high, beating the 2009 record. They plateaued in Feb>May, grew in June, flattened in July, then turned up in Aug>Oct setting a new record. Prices stabilized in Nov>Dec but turned up in Jan>Feb 23. They fell in March, peaked at a new record in May, then continued their rollercoaster ride with lifts in Dec>Jan.
  • Pet Services– Normally inflation is 2+%. Perhaps due to closures, the rate slowed in 2020. In 2021 consumer demand increased but there were fewer outlets. Inflation grew in 2021 with the biggest lift in Jan>Apr. It was stronger in 2022 but it got on a rollercoaster in Mar>Jun. It turned up again Jul>Mar 23 but the increase slowed in April. Prices fell -0.3% in May, turned up Jun>Aug, fell in Sep>Dec. then surged to a new record high in January.
  • Veterinary – Inflation has been consistent. Prices turned up in March 20 and grew through 21. A surge began in December 21 which put them above the overall CPI. In May 22 prices fell and stabilized in June causing them to fall below the National CPI. However, prices rose again and even with dips, they have stayed above the CPI since July 22. In 23 prices grew Jan>May, stabilized Jun>Jul, fell in Aug, grew Sep>Dec (Record high) then fell in January.
  • Total Pet – Petflation is a sum of the segments. In Dec 21 the price surge began. In Mar>Jun 22 the segments had ups & downs, but Petflation grew again from Jul>Nov. It slowed in Dec, grew Jan>May 23 (peak), fell Jun>Aug, grew in Sep/Oct, fell in Nov then grew in Dec>Jan to a new record high. The January lift came from Services (+5.6%) and Supplies (+0.7%) which overcame drops in Food & Vet. However, the YOY CPI fell from 5.1% to 4.7%.

Now, we’ll turn our attention to the Year Over Year inflation rate change for January and compare it to last month, last year and to previous years. We will also show total inflation from 21>24 & 19>24. Petflation slowed to 4.7%, down from 5.1% in December but it is still 1.5 times higher than the National rate. The chart will allow you to compare the inflation rates of 23>24 to other years but also see how much of the total inflation since 2019 came from the current pricing surge which took off in 2022. Again, we’ve included some human categories to put the pet numbers into perspective.

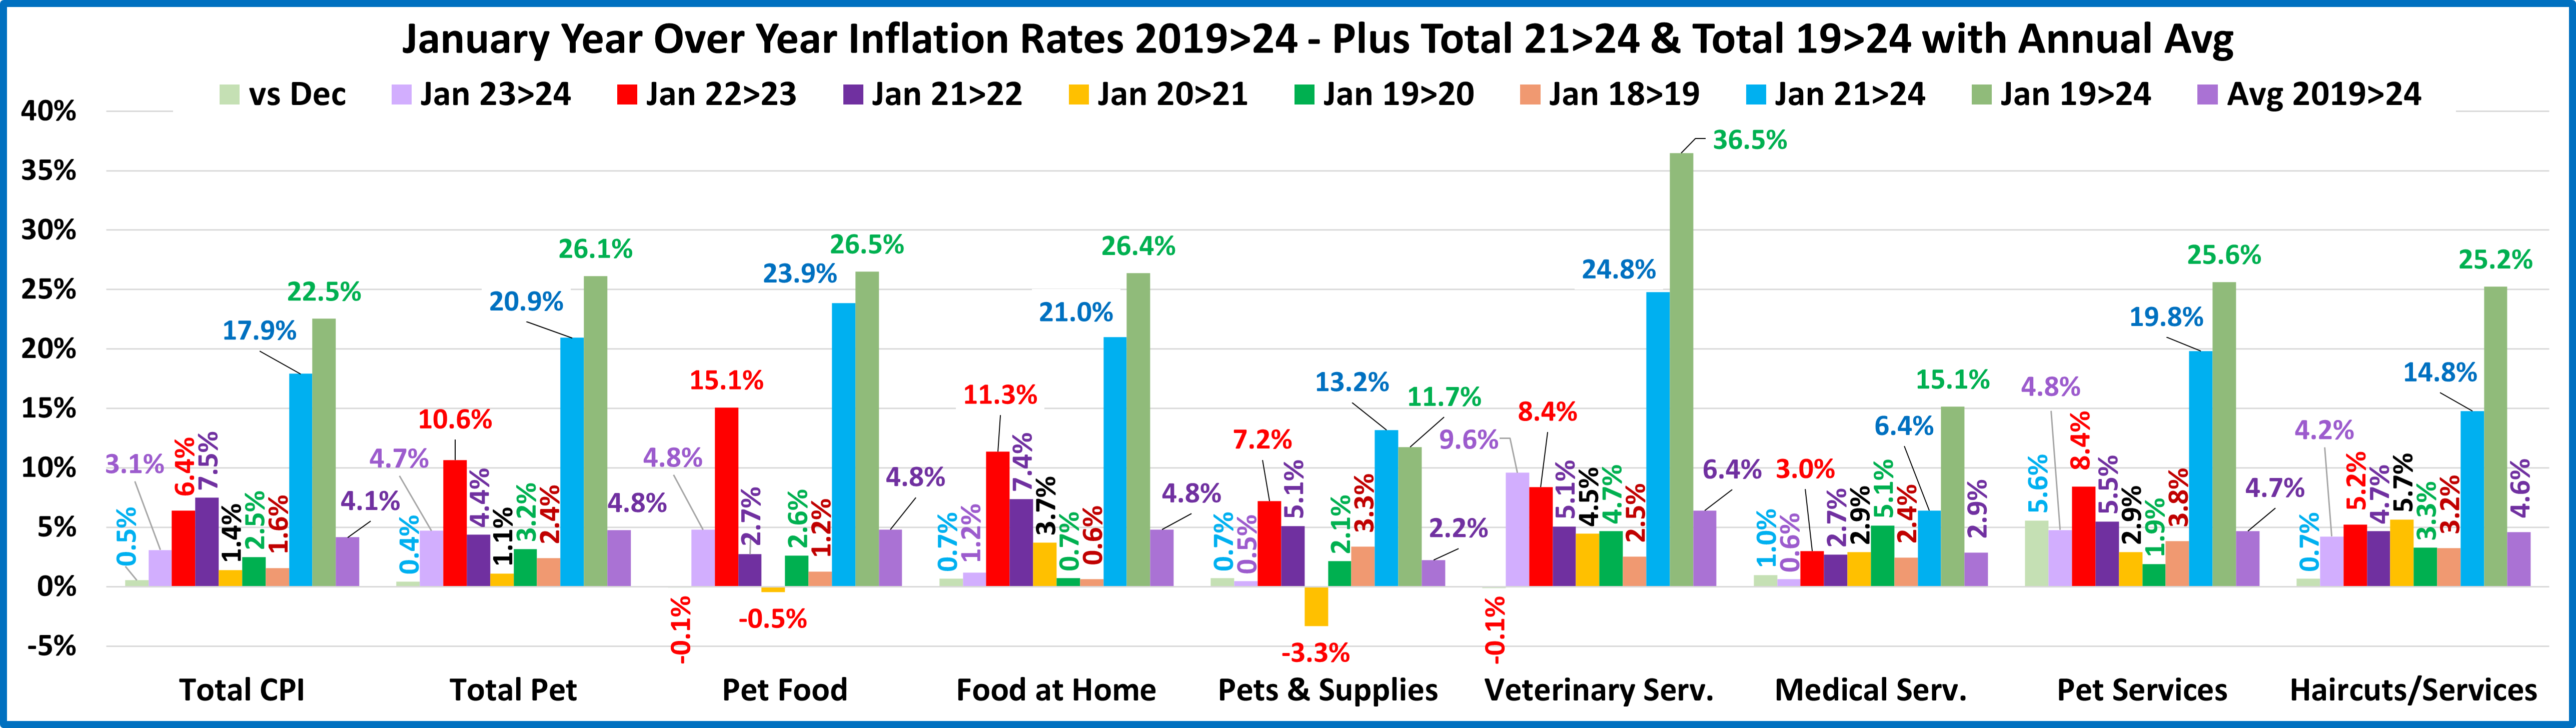
Overall, Prices were +0.5% from December but were +3.1% vs January 23, down from +3.4% last month. Grocery inflation is down again, to +1.2% from +1.3%. 7 of 9 categories had a price increase from last month – only Vet & Pet Food prices fell. There were 5 increases in December. Pet Services had a big turnaround. After 4 monthly drops, prices rose 5.6%. The national YOY monthly CPI rate of 3.1% is only 48% of the 22>23 rate and 41% of 21>22. The 23>24 inflation rate is below 22>23 for all categories but Veterinary Services. In our 2021>2024 measurement you also can see that over 65% of the cumulative inflation since 2019 occurred in all but 2 segments – Medical Services & Haircuts – both Services categories. Service Segments have generally had higher inflation rates so there was a smaller pricing lift in the recent surge. Pet Products have a very different pattern. The 21>24 inflation surge provided 95.6% of their overall inflation since 2019. This happened because Pet Products prices in 2021 were just starting to recover from a deflationary period. Services expenditures now account for 64.1% of the National CPI so they are very influential. Their current CPI is +4.9% while the CPI for Commodities is +0.1%. Services are driving virtually all of the current 3.1% inflation.

  • U.S. CPI– Prices are +0.5% from December. The YOY increase is 3.1%, down from 3.4%. It peaked at +9.1% in June 2022. The targeted inflation rate is <2% so we are still 55% higher than the target. After 12 straight declines, we had 2 lifts, a stable month, 2 consecutive drops, now 2 lifts – not good news! The current rate is 52% below 22>23 but the 21>24 rate is still 17.9%. That is 79.6% of the total inflation since 2019. Inflation was very low in early 2021.
  • Pet Food– Prices are -0.1% vs December and +4.8% vs January 23, down from 5.1%. However, they are still 4 times the Food at Home inflation rate. The YOY increase of 4.8% is being measured against a time when prices were 17.3% above the 2019 level, but that increase is still 4 times the pre-pandemic 1.2% increase from 2018 to 2019. The 2021>2024 inflation surge has generated 90.2% of the total 26.5% (Now: 2nd highest) inflation since 2019.
  • Food at Home – Prices are up +0.7% from December, but the monthly YOY increase is 1.2%, down from 1.3% last month and radically lower than Jul>Sep 2022 when it exceeded 13%. The 26.4% Inflation for this category since 2019 is 17% more than the national CPI and is in 3rd place behind Vet & Pet Food. 79.5% of the inflation since 2019 occurred from 2021>24. This mirrors the national CPI, but we should note that Grocery prices began inflating in 2020>21 then the rate accelerated. It appears that the pandemic supply chain issues in Food which contributed to higher prices started early and foreshadowed problems in other categories and the overall CPI tsunami.
  • Pets & Supplies– Prices were up 0.7% from December and 0.5% vs January 2023. They still have the lowest increase since 2019. As we noted, prices were deflated for much of 2021. As a result, the 2021>24 inflation surge accounted for 100+% of the total price increase since 2019. They reached an all-time high in October 2022 then prices deflated. 3 months of increases pushed them to a new record high in February. Prices fell in March, bounced back in Apr/May to a new record high, fell in Jun>Aug, grew in Sep>Oct, fell in November, then grew sharply in Dec>Jan.
  • Veterinary Services – Prices are -0.1% from December, but they are +9.6% from 2023, again the highest rate in the Pet Industry. Plus, they are still the leader in the increase since 2019 with 36.5% compared to Pet Food, 26.5% and Groceries, 26.4%. For Veterinary, relatively high annual inflation is the norm. However, the rate has increased during the current surge, especially in 23 & now 24, so 68% of the cumulative inflation since 2019 occurred from 2021>24.
  • Medical Services – Prices turned sharply up at the start of the pandemic but then inflation slowed and fell to a low rate in 20>21. Prices grew 1.0% from December and after 8 straight months of deflation are now +0.6% vs last year. Medical Services are not a big part of the current surge as only 42% of the 2019>24 increase happened from 21>24.
  • Pet Services – Inflation slowed in 2020 but began to grow in 2021. January 24 prices surged, +5.6% from December and were +4.8% vs last year, a big change from +0.7% last month, but well below the 8.0% back in March. Now, 77% of their total 2019>24 inflation has occurred since 2021. Last month it was only 49%.
  • Haircuts/Other Personal Services – Prices are +0.7% from December and +4.2% from 23, after 2 consecutive months below 4.0%. Inflation has been rather consistent as 59% of the inflation from 19>23 happened in 60% of the time.
  • Total Pet– Petflation is 56% lower than the 22>23 rate, but still 1.5 times the U.S. CPI. For January, +4.7% is the 4th highest rate since 1997 (2023: 10.6%; 2009: 10.3%; 2008: 5.2%). Vs December, prices fell -0.1% for Pet Food & Veterinary Services but grew strongly in Non-Vet Services, +5.6% and Supplies, +0.7% so Total Pet was +0.4%. A Dec>Jan price increase has happened 9 straight times and in 25 of the last 27 years with an average lift of 0.4%. In terms of Petflation, 2024 started just as we should have expected. Veterinary & Food are still the Petflation leaders, but all segments have an influence. Pet Food has largely been immune to inflation as Pet Parents are used to paying a lot, but inflation can reduce purchase frequency in the other segments.

Petflation is slowing, but it is still strong, with the 4th highest rate for January and 2023 had the 2nd highest annual rate in history. It is also 1.5 times the National CPI. In 2021 it was only 75% of that rate. Even if it slows to 0%, you can’t ignore the fact that inflation is cumulative. Pet prices are 20.9% above 2021 and 26.1% higher than 2019. Those are big lifts. Since price/value is the biggest driver in consumer spending it is likely to affect the Pet Industry. The Non-Vet Services segment will be the least impacted as it is the most driven by high income CUs. Supplies and Veterinary will likely see a reduction in purchase frequency. Food is the most needed segment so the response will be complex. It could include a movement to online shopping, switching to private label or even downgrading the quality of food.

In fact, one impact of high cumulative inflation will be very visible soon at the industry’s preeminent trade show, Global Pet Expo 2024. There are over 1100 exhibitors with 120+ actively soliciting OEM (Private Label) customers. Because many have expertise in OEM this private label trend has caused a record surge in Foreign Exhibitors, 36% of all booths including 250 from China. Inflation has further enhanced  the importance of “Value” to consumers.

2022 Veterinary Spending was $29.71B – Where did it come from…?

Now we will turn to the final Industry Segment, Veterinary Services. For years, Veterinary Services have had high inflation. This has resulted in CU income becoming the dominant factor in spending and a reduction in visit frequency.

In 2017 low inflation spurred an unusual 7.2% increase in visit frequency and a $2.5B increase in spending. In 2018 inflation returned to more normal levels. Consumers spent $0.56B more (+2.7%), but inflation was 2.6% so virtually all of the lift was from increased prices. In 2019 the situation got worse. Consumers spent $0.58B (+2.7%) more but inflation was 4.14%. This means that there was an actual decrease in the amount of Veterinary Services purchased. In 2020 the pandemic hit, and Pet Parents focused on needs – Food & Veterinary. Veterinary spending grew $3.05B, (+14.0%). In 2021, this behavior grew even stronger and produced a record $7.82B (+31.5%) increase. In 2022 inflation reached 8.8%. Spending fell -$2.95B (-9.0%) but the amount of Veterinary Services sold fell 16.4%. Pricing matters to almost everyone.

We’ll start our analysis with the groups who were responsible for the bulk of Veterinary spending in 2022 and the $2.95B decrease. The first chart details the biggest Veterinary spenders for each of 10 demographic categories. It shows their share of CU’s, share of Veterinary spending and their spending performance (Share of spending/share of CU’s). In terms of performance – 5 of 10 groups perform above 120%, 1 less than 2018>2021. This is currently 2 less than Supplies (7) and 1 less than Services (6) but 1 more than Food (4). This means that these big spenders are performing well but it also signals that there is still disparity between the best and worst performing demographics in this “needed” segment. Only the College Grads group is different from Total Pet and the categories are listed in the order that reflects their share of Total Pet $pending. Again, High Income is the most important factor in Spending.

  1. Race/Ethnic – White, not Hispanic (86.0%) up from 84.7%. This group accounts for the vast majority of spending in every segment and gained share in Vet $ in 2022. Their 128.0% performance is also up from 126.0% but they fell from #4 to #5 in importance in Veterinary Spending. Whites spent $2.2B less but African Americans (+$0.18B) and Asians (+$0.09B) spent more. Whites gained in share & performance because of a -$1.1B decrease by Hispanics.
  2. Housing – Homeowners (83.9%) up from 81.0% Homeownership is a major factor in pet ownership and spending in all industry segments. In terms of importance to Veterinary spending, their 128.9% performance rating is up from 125.2%, and they moved up to 4th from 5th place. All segments decreased spending but the biggest drop was by Renters, -$1.40B (-22.6%). This is produced the gains for Homeowners. However, we should note that Homeownership is still not nearly as important to Veterinary Spending as it once was. In 2015 their share was 88.4% with performance of 141.8%.
  3. # in CU – 2+ people (79.8%) up from 79.7% This group, which is 69.0% of U.S. CUs, gained minimally in share and their performance grew from 114.7% to 115.7%. Their rank in terms of importance in Vet Spending stayed at #8. All sizes spent less. The gains happened because Singles had a slightly bigger % decrease (-9.7%) than 2+ CUs (-8.9%).
  4. Area – Suburban & Rural (70.9%) down from 73.0% Suburban CU’s are the biggest spenders in every segment. All areas spent less. The Big Suburbs had the biggest decrease, -$1.93B (-12.1%) while Center City was only down -2.3%. This drove the big decrease in share and caused their performance to fall substantially to 108.2%, from 113.2%.
  5. Education – College Grads (60.9%) down from 65.4%. Income generally increases with education. It is also important in understanding the need for regular Veterinary care. Their performance also dropped from 138.1% to 130.3% and they fell from #2 to #3 in importance. In 2022, College grads spent -$3.27B less while those without at least a BA/BS spent $0.31B more. This lift was small but widespread as only HS Grads with some college spent less.
  6. Income – Over $70K (69.9%) down from 71.7% Their performance also fell significantly from 160.0% to 147.8% but higher income is still the most mportant factor in Veterinary spending. The only lifts were from $200K>, +$0.39B and $30>49K, +$0.04B. The biggest drops were $150>199K, -$1.51B and $70>99K, -$1.47B.
  7. # Earners – “Everyone Works” (67.7%) down from 68.6% Their Performance also fell from 121.0% to 116.1%. They dropped out of the 120+% club & fell from #6 to #7 in importance. All adults in the CU work. Only Single, No Earner CUs spent more. 2 Earners had the biggest $ drop, -$0.99B while 1 Earner, Singles had the biggest % drop, -15.8%.
  8. Occupation – All Wage & Salaried (65.9%) down from 66.4% and their performance decreased from 111.9% to 109.3%. Only Blue Collar Workers and Tech/Sls/Clerical spent more. The group lost share and performance primarily because of big drops by Mgrs/Professionals, -$1.47B and Service Workers, -$1.23B. Their perforrmance drop was also accelerated because they had 1.6 million more CUs than in 2021.
  9. CU Composition – Married Couples (62.5%) up from 60.9% Their performance also grew to 130.8% from 128.4% and they moved up to #2 from #3 in importance. Only 2 segments spent more – Married Couple with an Oldest Child 6>17, +$0.67B and Single Parents, +$0.25B. The biggest drop was by All Adult, Unmarried CUs, -$1.26B.
  10. Age – 35>64 (61.1%) down from 62.1% Their performance also fell from 118.7% to 117.1% but they moved up to 6th from 7th place in importance. Only 45>54, +$0.80B and 75>, +$0.18B spent more. The 2 biggest drops were 55>64, -$1.51B and 35>44, -$1.45B. These caused the group’s drops in share and performance.

Spending disparity fell in 6 categories and the average group performance was 123.2%, down from 125.7% in 2021. Spending became slightly more balanced. Notably, higher income & education became a little less important. Also, Married Couples reached #2 in iimportance. In 2020, they were #6.

Now, we’ll look at 2022’s best and worst performing Veterinary spending segments in each category.

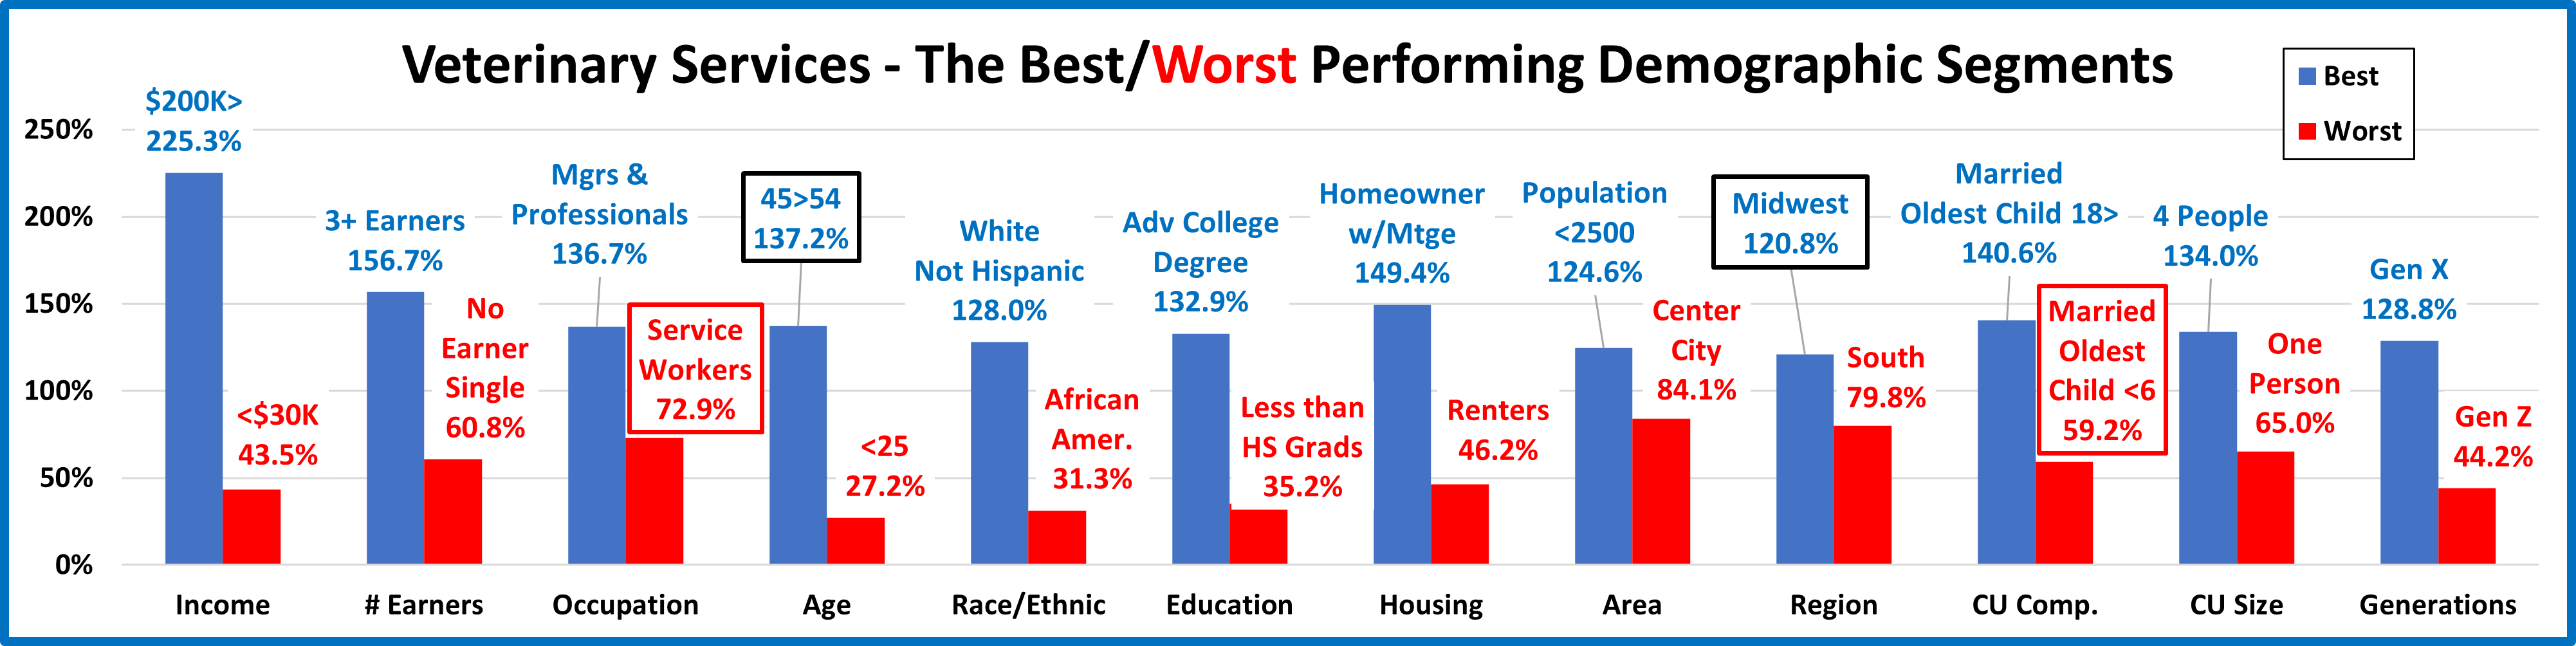
Almost all of the best and worst performers are those that we would expect and there are only 4 that are different from 2021, down from 5 last year. This is 1 more than Services, but 1 less than Supplies and far fewer than the 11 in Food. Also, the average difference between Best & Worst was 88.8%, down from 94.4% in 2021.There was slightly less turmoil and spending disparity between segments in 2022. The changes from 2021 are “boxed”. We should note:

  • Income– The Winner & Loser are the same. The gap is 181.8% but 5.3% less than 2021.
  • Earners – This repeat winner and loser have the highest and lowest incomes. The gap narrowed by 23.2%.
  • Occupation – Service workers replaced Retirees at the bottom, but the gap was 3.5% smaller.
  • Age – The 45>54 yr-olds, the highest income group, replaced 55>64 at the top. The gap actually widened by 9.3%.
  • Race/Ethnic; Another set of expected repeats. The gap between winner and loser narrowed by 5.9%
  • Education; Housing; Area – These all had an expected repeat winner & loser, but the performance gap grew for all. Education: +1.8%; Housing: +14.3%; Area: +16.2%.
  • Region –Midwest replaced Northeast at the top. The South has now finished last for 7 years in a row, but the win/lose gap decreased by 15.2%. Also, for the second consecutive year, 2 regions performed at 100+%.
  • CU Composition – Married, Oldest child <6 replaced Single Parents at the bottom. The gap narrowed 33.6%.
  • # in CU – The same winner & loser but the gap widened by 10.7%. Only 2,3 & 4 people CUs perform above 100%.
  • Generation – No change again and the performance gap widened, but only by 1.6%.

It’s time to “Show you the money”. Here are segments with the biggest $ changes in Veterinary Spending.

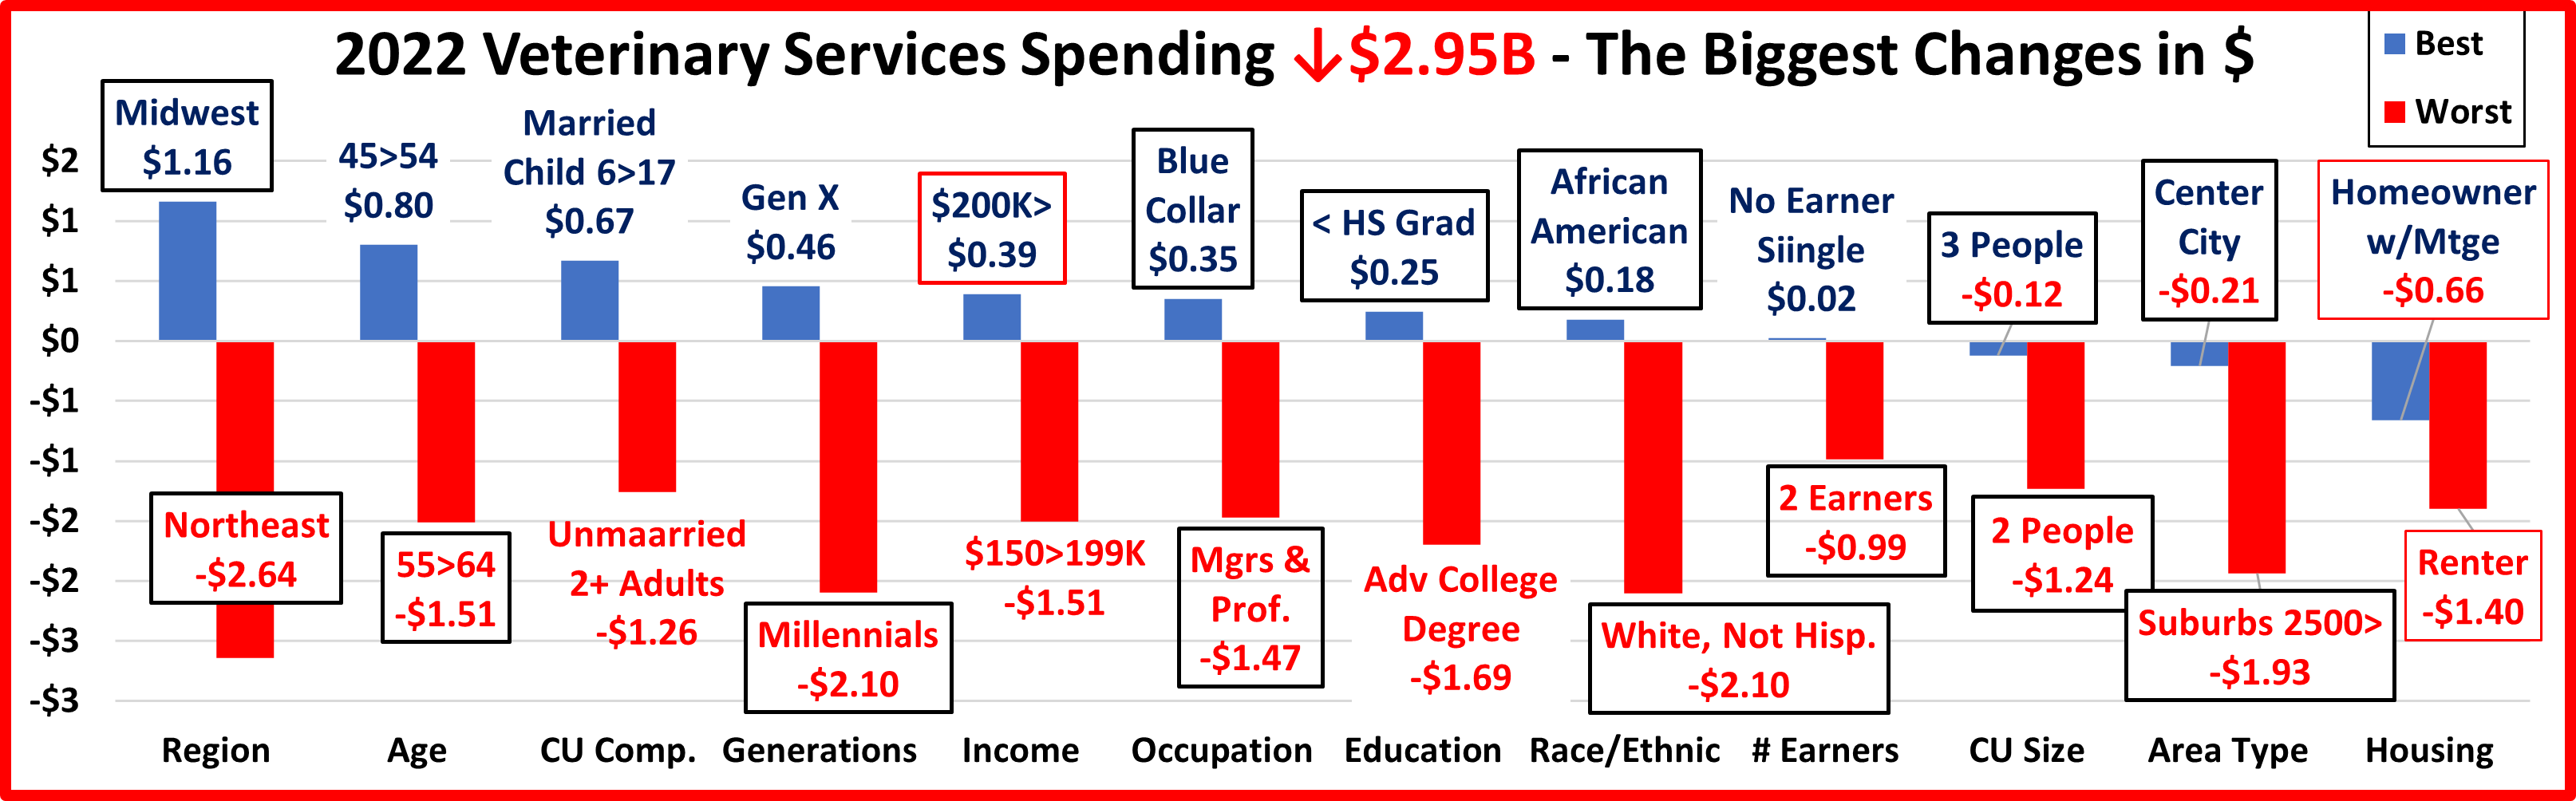
We saw little turmoil in performance. That’s not true here. There were 3 repeats and 14 segments flipped from 1st to last or vice versa. Last year there were 8 repeats and 3 flips. There were 5 surprise winners – Blue Collar, <HS Grads, African Americans, No Earner, Singles & Center City. There were only 3 losers that weren’t a surprise – Northeast, Unmarried, 2+ Adults & Renters. ln 3 categories all segments spent less. In 2021, there were 9 where all spent more. Plus, in 2021, 93% of 96 demographic segments spent more. That fell to 23% in 2022.

  • Region – Both winner and loser flipped. This is 5 consecutive years of flips for the Northeast.
    • Winner – Midwest – Veterinary Spending: $7.62B; Up $1.16B (+18.0%)                               2021: Northeast
    • Loser – Northeast – Veterinary Spending: $4.88B; Down $2.64B (-35.1%)                           2021: Midwest
    • Comment – Only the Midwest increased spending. In 2021, all had double digit % increases.
  • Age – 55>64 flipped from 1st to last. 45>54 is a new winner.
    • Winner – 45>54 yrs – Veterinary Spending: $6.90B; Up $0.80B (+13.2%)                                2021: 55>64 yrs
    • Loser – 55>64 yrs – Veterinary Spending: $6.14B; Down $1.51B (-19.7%)                                2021: <25 yrs
    • Comment: Only 45>54 and 75> spent more. In 2021 all segments increased Veterinary spending. While 55>64 had the biggest individual decrease, 25>44 spending fell -$2.25B. In 2021 they spent $3.34B more, 44% of the record increase. Despite a slightly younger winner, spending skewed a little older in 2022.
  • CU Composition – This was the only category with no repeats or flips. The winner & loser are both new.
    • Winner – Married, Oldest Child 6>17 – Veterinary: $4.51B; Up $0.67B (+17.4%)              2021: Married, Couple Only
    • Loser – Unmarried, 2+ Adults – Veterinary: $4.29B; Down $1.26B (-22.7%)                       2021: Single Parents
    • Comment – Single Parents were the only group to spend less in 2021. In 2022, they were 1 of only 2 segments to spend more and it was a big lift, +41.1%. Married, Oldest Child <6 had the biggest % drop, -62.6%.
  • Generation – Millennials flipped to the bottom as Gen X replaced them on top.
    • Winner – Gen X – Veterinary: $9.73B; Up $0.46B (+4.6%)                                                        2021: Millennials
    • Loser – Millennials – Veterinary: $7.13B; Down $2.10B (-22.7%)                                           2021: Born <1946
    • Comments – Only Gen X and Gen Z had increases. 2022 was the year that Gen Z “got on board” in every aspect of Pet Parenting. They more than doubled their spending on Food & Services, spent 73% more on Supplies and had a +$0.32B (+80.9%) increase in Veterinary. Millennials had the biggest drop, but they are still up $1.1B from 2020.
  • Income – $200K> held on to the top spot while $150>199K replaced the low income $30>39K group at the bottom.
    • Winner – $200K> – Veterinary Spending: $6.72B; Up $0.39B (+6.2%)                                    2021: $200K>
    • Loser – $150>199K – Veterinary Spending: $3.43B; Down $1.51B (-30.5%)                          2021: $30>39K
    • Comment – In 2021, only the $30>39K group spent less. In 2022, 3 groups spent more – $30>39K, $40>49K and $200K>. Their increases were small and when you factor in 8.8% inflation, all groups bought a smaller amount.
  • Occupation – The winner and loser both flipped, producing 2 surprises.
    • Winner – Blue Collar – Vet Spending: $1.92B; Up $0.35B (+22.4%)                                      2021: Mgrs & Profess.
    • Loser – Mgrs & Professionals – Vet Spending: $10.67B; Down $1.47B (-12.1%)                 2021: Construction Workers
    • Comment – Tech/Sls/Cler and All Other/Unemployed also spent a little more. Service workers had the 2nd biggest $ decrease, -$1.23B, but the highest % drop, -31.3%. They had a $1.55B lift in 2021.
  • Education – <HS Grads flipped to the top while Adv. College degree replaced them at the bottom.
    • Winner – <HS Grads – Veterinary Spending: $0.62B; Up $0.25B (+66.5%)                             2021: BA/BS Degree
    • Loser – Adv. College Degree – Veterinary Spending: $8.06B; Down $1.69B (-17.4%)          2021: <HS Grads
    • Comment – In 2021, all Education levels spent more but the lift was very much skewed towards higher Education. In 2022, the situation reversed. College grads spent -$3.27B less. <College Grads only spent +$0.31B more but all segments in the group but HS Grads w/some college increased their Veterinary spending.
  • Race/Ethnic – The winner and loser flipped.
    • Winner – African Americans – Veterinary: $1.18B; Up $0.18B (+18.0%)                                2021: White, Not Hispanic
    • Loser – White, Not Hispanic – Veterinary: $25.55B; Down $2.10B (-7.6%)                           2021: African Americans
    • Comment– Asian Americans also spent more. In 2020 & 2021 all groups spent more. The 2 groups with the highest level of Pet ownership drove most of the 2019>21 increase and all of the 2022 decrease. The two groups with the lowest level of pet ownership have now spent more for 3 straight years. That’s encouraging.
  • # Earners – 2 Earners flipped from 1st to last and we have another surprise winner. No Earner, Singles.
    • Winner – No Earner, Single – Veterinary Spending: $2.44B; Up $0.02B (+0.9%)                   2021: 2 Earners
    • Loser – 2 Earners – Veterinary Spending: $12.20B; Down $0.99B (-7.5%)                              2021: 1 Earner, Single
    • Comment – No Earner, Singles had the only increase, and it was minuscule. The drops were pretty balanced across the segments. Except for 2 Earners, all CUs with 1+ earners had a drop between -$0.55B and -$0.68B.
  • # in CU – The winner and loser flipped again.
    • Winner – 3 People – Veterinary Spending: $4.89B; Down $0.12B (-2.5%)                               2021: 2 People
    • Loser – 2 People – Veterinary Spending: $11.93B; Down $1.24B (-9.4%)                                 2021: 3 People
    • Comment: In 2020 and 2021, all groups spent more. In 2022, all groups spent less. The $ drop by 2 People CUs was twice as big as #2, Singles. Most drops were small. Only 5+ CUs, -21.4% was over -10%.
  • Area Type – Another dual flip.
    • Winner – Center City – Veterinary Spending: $8.62B; Down $0.21B (-2.3%)                          2021: Suburbs 2500>
    • Loser – Suburbs 2500> – Veterinary Spending: $14.04B; Down $1.93B (-12.1%)                  2021: Center City
    • Comment – In 2020 and 2021 all groups spent more. In 2022, all spent less. Center City has now flipped for 3 straight years. The Suburbs 2500> have the biggest share of Vet $ and had a $4.4B lift in 2021. With the 2022 drop, they are still +$2.47B (+21.3%) from 2020.
  • Housing – Both Homeowners w/Mtges and Renters held onto their “usual” spots at the top and the bottom.
    • Winner – Homeowner w/Mtge – Veterinary: $16.90B; Down $0.66B (-3.8%)                        2021: Homeowner w/Mtge
    • Loser – Renter – Veterinary: $4.79B; Down $1.40B (-22.6%)                                                      2021: Renter
    • Comment – In 2021, all spent more and had an increase of at least $2B. In 2022, all spent less but Renters had the only drop over -$1B. From 2020>2022: Homeowners w/Mtges are +$2.84B (+20.1%); Homeowners w/o Mtges are +$1.43B (+21.7%); Renters are +$0.60B (+14.3%).

We’ve now seen the winners and losers in terms of increase/decrease in Veterinary Spending $ for 12 Demographic Categories. 2021 had a record lift but 2022 brought a $2.95B drop. The decrease brought little turmoil in performance as 88% held their position. However, the change in $ was a different story. Only 3 were the same as 2021 and 14 of 24 flipped from 1st to last or vice versa. However, the biggest difference was that in 2021, 93% of demographics spent more including 9 categories where all segments had increases. In 2022, only 23% spent more and there were 3 categories where all spent less. This made the “hidden gems” harder to find, but we did. Here are some segments that didn’t win but helped slow the drop in Veterinary spending. These groups don’t win an award, but they certainly deserve…

                                                                                                         HONORABLE MENTION
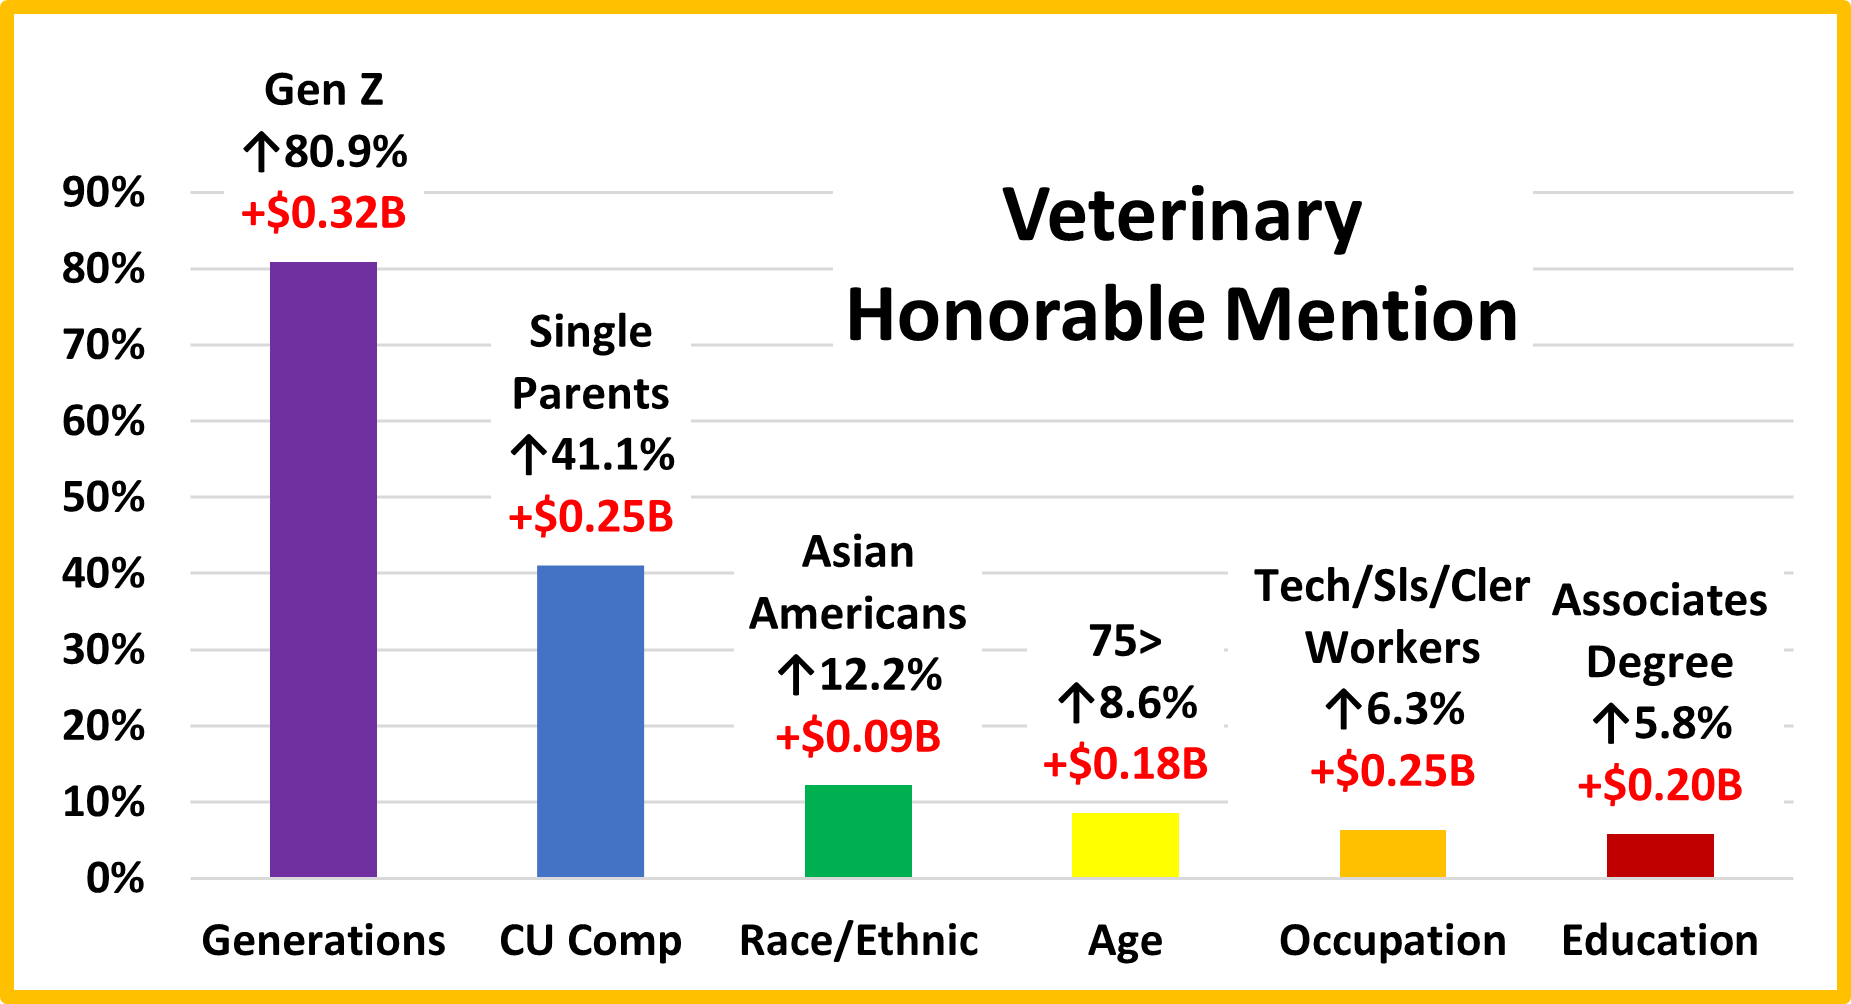
With huge lifts in all segments, Gen Z “got on board” with all aspects of Pet Parenting. Because of strong family and financial pressures, Single Parents are often at the bottom in Pet spending. In 2022, they spent 54.1% more with lifts in all segments but Supplies, including a 41% increase in Vet Services. Asians have the highest income but the lowest percentage of Pet Parents. In 2022, they focused on services, with lifts in both Non-Vet & Veterinary Services. The 75+ group is also under tremendous financial pressure. Inflation caused them to dial back Food spending, but they had lifts in all other segments. Tech/Sls/Clerical workers are low profile. In 2022, they stood out with lifts in all but Supplies. Associates Degree also usually gets little notice, but 2022 was different. They increased spending in all segments.

Summary

2016 & 2017 produced a combined increase of $3.6B in Veterinary Spending as inflation moved to record low levels. In 2018 & 2019 a Baby Boomer Spending “Bust” impacted Food & Veterinary. Fortunately, Gen X and Millennials stepped up to produce a 2.7% increase in both years. In 2020 the pandemic focused Pet Parents on the needed segments. This drove a $3B increase in Veterinary $. Boomers & Millennials led the way, but the lift was widespread as 85% of demographic segments spent more. In 2021 the lift grew to a record $7.82B with 93% of all segments spending more including 9 categories where all segments had increases. In 2022, the “binge” was not repeated. Inflation also increased radically to 8.8% and spending fell -$2.95B (-9.0%). There was little turmoil in the best and worst performing demographics as only 3 were different from 2021. However, there was considerable turmoil in the segments with the biggest changes. Only 3 of 24 winners & losers were the same as 2021 and 14 flipped from 1st to last or vice versa. 77% of all demographics spent less and in 3 categories, all segments decreased spending.

The performance of big spending groups is very important in all industry segments. In Veterinary we identified 5 demographic categories with high performing (120+%) large groups. That is 1 less than 2021. It is also 1 more than Pet Food, but 1 less than Services and 2 less than Supplies. The big groups with a high performance level in Veterinary are:

  • Income: $70K> (147.8%) Performance increases with income but doesn’t reach 100+% until income reaches $100K
  • CU Composition: Married Couples (130.8%) Only Married Couples perform at 100+%. (All but those w/oldest child <6)
  • Education: College Grads (130.3%) Performance increases with education. All with an Associate’s Degree> are 100+%
  • Housing: Homeowners (128.9%) Only Homeowners w/Mtge perform above 100%.
  • Race/Ethnic: White, Not Hispanic (128.0%). Hispanics, African Americans & Asians only perform between 31% and 53%

Consumers have no control over Race/Ethnicity but can make decisions in the other categories. Income is still the most important factor. The others are important but essentially equal in performance – 128>131%. Although spending fell, it became slightly more balanced with the drop from 6 to 5 big groups performing over 120%. Another indication of this is that the average spending disparity between the best and worst performing segments dropped from 94.4% to 88.8%.

Another big concern is high inflation. In 2021 spending grew 31.5% in the pandemic surge. Inflation was high at 4.2% but 84% of the growth was real. In 2022 spending fell -9.0%. Inflation was 8.8% so the amount sold was really down -16.4%. Also 77% of 96 demographic segments spent less $ but if we factor inflation into the numbers, 91% actually bought less Veterinary Services. If high inflation continues it could have a major impact on Veterinary Spending.

Finally – The “Ultimate” Veterinary Services Spending Consumer Unit consists of 4 people – a married couple with an oldest child over 18. They are 45>54 years old. They are White, but not of Hispanic origin. At least one of them has an Adv. College Degree and works as a Mgr/Professional. Their oldest child also works. Their total income is $200K>. They live in a small suburb, adjacent to a big city in the Midwest and are still paying off the mortgage on their home.

2022 Pet Services Spending was $12.36B – Where did it come from…?

Next, we will look at Pet Services. It is still by far the smallest Segment, but like Supplies and Veterinary, it had a record increase in 2021. However, unlike them, there was no $ drop in 2022. The lift grew stronger, up $3.26 (+35.8%). After the great recession, Services’ annual spending slowly but steadily increased. During this time, the number of outlets offering Services strongly grew as brick ‘n mortar retailers looked for a way to combat the growing influence of online outlets. After all, you can buy products, but you can’t get your dog groomed on the Internet. This created a highly price competitive market for Pet Services. In 2017 there was a slight increase in visit frequency, but Pet Parents just paid less. This resulted in a 1.0% decrease in Services spending. In 2018 consumer behavior changed as a significant number decided to take advantage of the increased availability and convenience of Pet Services and spending literally took off, +$1.95B (+28.9%), the biggest increase in history. In 2019 Pet Parents, especially the younger ones, value shopped, and spending turned down $0.10B. In the 2020 pandemic Services outlets were often deemed nonessential and were subject to restrictions and closures which drove a huge drop in $. In 2021 things opened up again and Pet Parents came back to Services generating the biggest $ increase ever. The trend didn’t end in 2022. It accelerated with a new record increase.

Services spending is the most discretionary, but its reach is expanding. Let’s look deeper into the demographics.

Let’s start by identifying the groups most responsible for the bulk of Services spending in 2022 and the $3.26B increase. The first chart details the biggest Pet Services spenders for each of 10 demographic categories. It shows their share of CU’s, share of Services spending and their spending performance (Share of spending/share of CU’s). In order to better target the bulk of the spending we had to alter the groups in 3 categories – income, area & education. The performance level should also be noted as 6 of 10 groups have a performance level above 120%. This is 1 less than 2021 but the 2nd most for any segment only behind Supplies with 7. Veterinary and Total Pet have 5 and Food has only 4. This indicates that the disparity between the best and worst performing segments shrank a little in 2022, but it is still the highest of any segment. Income is still the biggest factor in Services Spending. The categories are presented in the order that reflects their share of Total Pet $ which highlights the differences of the 7 matching groups. For Services, the share ranking differences from Total Pet are small. The # of Earners and Occupation are more important in Services.

  1. Race/Ethnic – White, not Hispanic (84.9%) up from 84.6%. This big group accounts for most of the spending in all segments. Their performance grew from 125.9% to 126.3% and they moved up from 5th to 4th place in importance. All groups spent more. The Hispanics’ increase was below average which produced the gains in share & performance
  2. Housing – Homeowners (80.8%) up from 80.5%. Homeownership is a big factor in spending in all industry segments. Their performance fell from 124.5% to 124.1% but they moved up from #6 to #5 in importance. All segments spent more. Homeowners gained share because of more CUs. This and a big % lift by Renters made Performance drop.
  3. # in CU – 2+ people (80.0%) down from 82.2% Their performance also decreased from 118.3% to 116.0% but they moved up from #8 to #7 in importance. All sizes spent more. The drop in share and performance is due to a spectacular 52.5% increase by Singles while spending for 5+ CUs grew only +0.1%.
  4. Area – City/Suburbs >2500 (77.8%) down from 80.0% in share, and performance fell from 98.1% to 96.2%. Again they are the only group not earning its share of $pending. Services is an Urban Segment. All Areas spent more but Suburbs had the biggest lift, +$1.48B. Center City “lost” with a $0.83B, 27.1% increase. Areas <2500 were +53.1%.
  5. Education – College Grads (69.8%) down from 71.7%. Income generally increases with education so Services spending grows with increasing education. Performance fell from 151.5% to 149.3% but education stayed #2 in importance. Only HS Grads spent less but the <College group was +45.3% while College Grads were only +32.1%.
  6. Income – $100K> (64.2%) up from 63.3% This group’s performance rating is 193.6%, down from 211.4%. CU income is still by far the most important factor in increased Pet Services Spending. Only the $30>39K and $50> 69K income groups spent less, They gained in share but their performance fell. The biggest factor in this situation was a change in CU count. The number of CUs <$100K fell -4.2% while those $100K> increased by 11.1%.
  7. # Earners – “Everyone Works” (72.2%) down from 72.8%. All adults in the CU are employed. Income is important so a high market share is expected. Their performance dropped to 123.7% from 128.3% and they fell from #4 to #6 in importance. All CUs, with or without Earners spent more. Spending became slightly more balanced but again the big change was in # of CUs. The Everyone Works group grew by 2.5 million CUs causing the big performance drop.
  8. Occupation– All Wage & Salaried (70.3%) up from 67.6% and their performance rating increased from 114.0% to 116.5%. – #9 to #8. Only All Other/Unemployed spent less on Services in 2022. Managers & Professionals had the biggest increase, +$1.75B (+46.0%). Tech/Sls/Cler were up 25.7% but all other segments were up at least 38.9%. Spending within the group became a little more balanced. The Wage and Salary group had a 1.6 million increase in CUs which increased share but slowed the performance lift.
  9. CU Composition – Married Couples (63.6%) up from 63.3%. Married couples are a big share of $ and have 127+% performance in all segments. Their performance fell slightly to 133.1% from 133.6% but they stayed #3 in importance in Services spending. All CU types spent more. The biggest $ increase came from Married Couple Only, +$1.18B. The performance of the Married group fell because of a $0.85B, 52.5% increase by Singles.
  10. Age – 35>64 (60.0%) down from 63.9%. Their performance fell from 122.0% to 115.0%. They dropped out of the 120+% club and fell to 9th in importance. Only <25 spent less. 35>64 was up $1.60B, +27.5%. The other age groups spent $1.66B more, +50.6%. This produced the drop in share and the big decrease in performance.

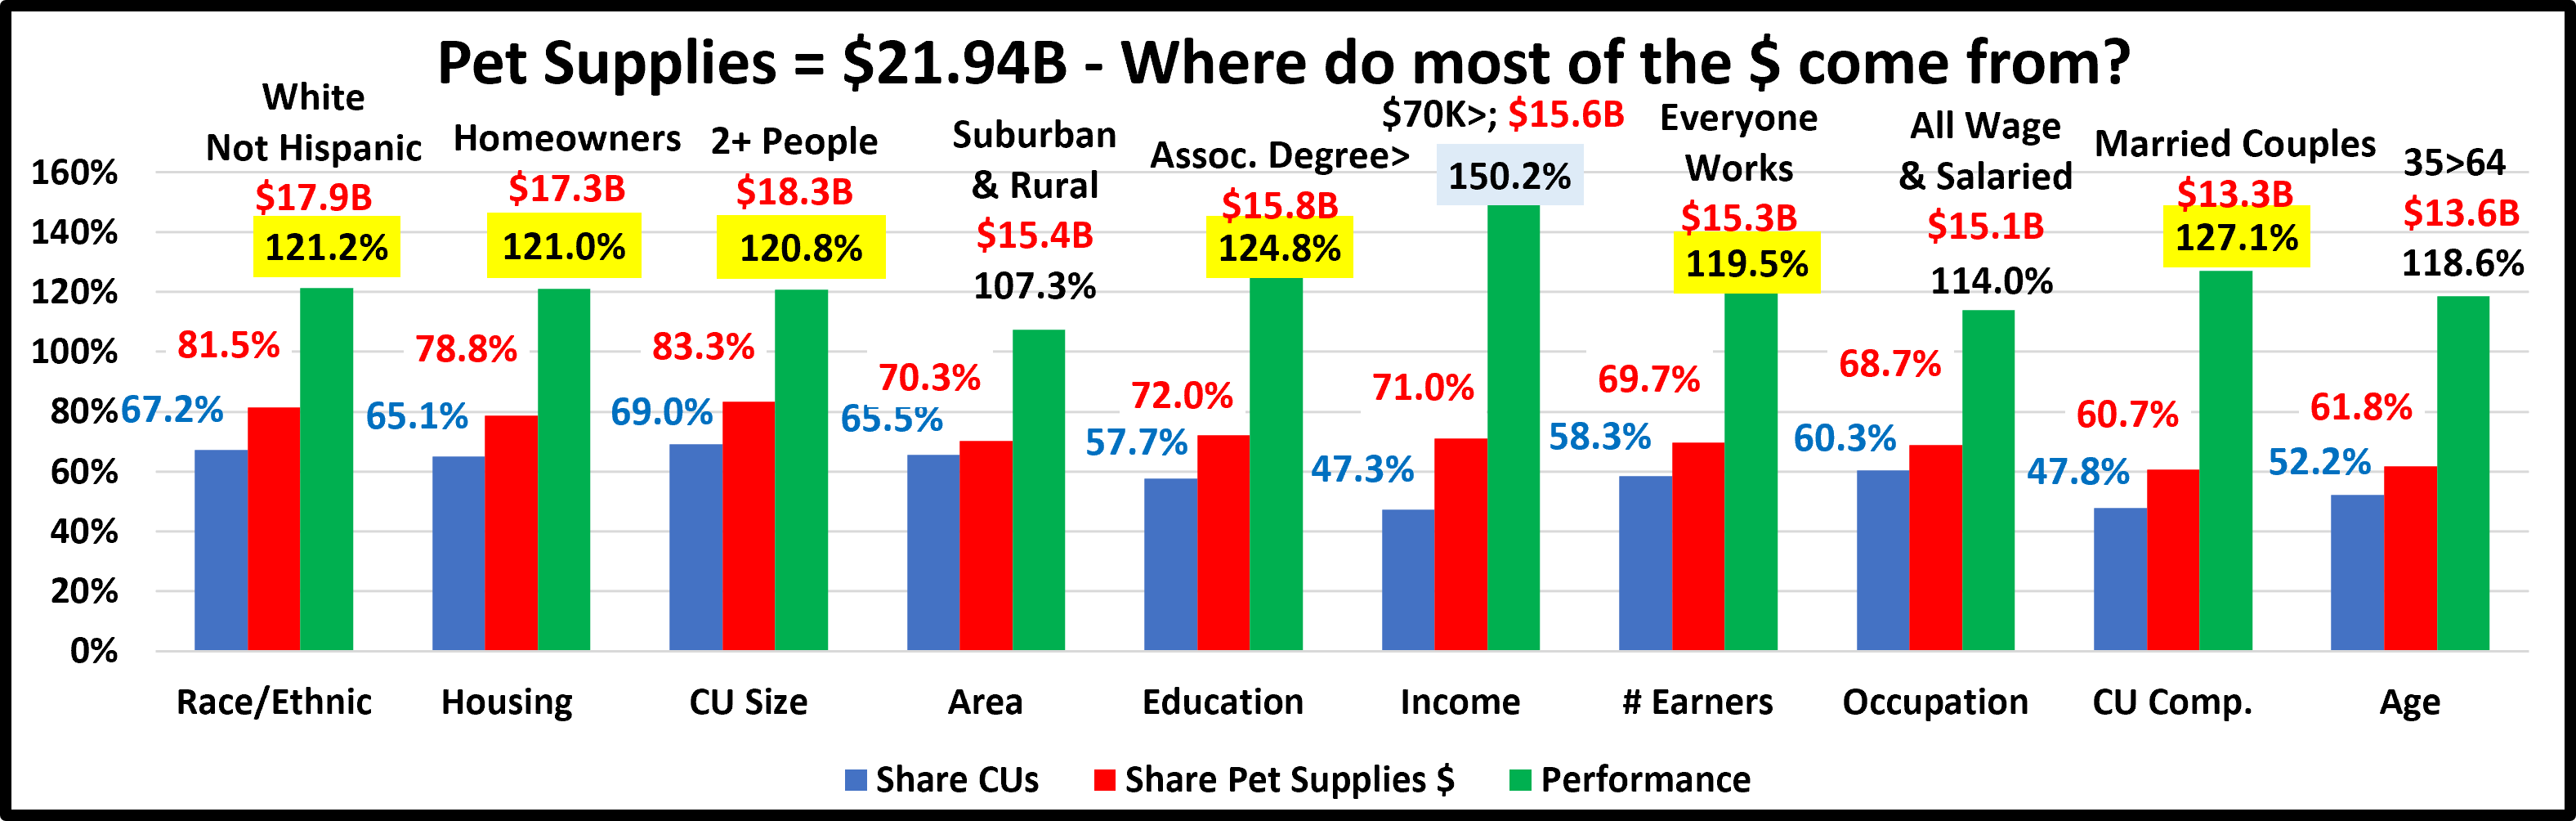
We changed 3 of the groups for Services – Income, Area & Education, to better target the biggest spenders. We should also note that Income is still more important to spending in Services than in any other segment. Only Race/Ethnic and Occupation gained in both share and performance. Also, Services now has 6 groups performing at 120+%, down from 7 in 2021. Overall, in 2022 Services spending became slightly more demographically balanced.

Now, we’ll look at 2022’s best and worst performing Pet Services spending segments in each category.

Except for Area, the best & worst performers are not a surprise. There are 3 that are different from 2021, all in the best group, 7 less than last year. Area shows the continued move away from high population. Income is a big factor for almost all categories. Gen X is still on top, but spending shifted towards their older members, 45>54. The average difference between Best & Worst is 100.3%, the highest of any segment. However, it is better than 108.5% in 2021. Pet Services spending became slightly more balanced in 2022. Changes from 2021 are “boxed”. We should note:

  • Income is even more important to Pet Services. The $200K> group has its best performance in this segment.
  • # Earners – 3+ Earners replaced 2 Earners on top but No Earner, Singles stayed on the bottom. No Surprises.
  • Age – 45>54 is all Gen X and the highest income group. All groups from 35>74 performed at 100+%. 25>34 was close at 94.6%. The lowest performers were at both ends of the age spectrum.
  • Area – Services $ are still skewed towards population density. However, the performance of Rural areas has tripled from 2019 and Center City has been below 100% for 3 straight years.
  • CU Composition – Married, Couple Only barely edged out last year’s winner Married, Oldest child 6>17 – 142.8% to 142.5%. This was basically a tie. Single Parents remain firmly entrenched at the bottom.
  • Generation – Gen X retained the Top Spot and Gen Z stayed at the bottom. Both Boomers and Millennials earned their share with 103.6% performance. Born <1946 was next to last with 54.5%.

In Pet Services spending performance, income is still the major factor. Spending began skewing younger in 2018. They slipped a little in 2019 but they basically held their ground during the 2020 pandemic. In 2021, Boomers, Millennials and the younger Gen Xers got on board. In 2022, spending skewed a little towards the older Gen Xers – 45>54.

It’s time to “Show you the money”. Here are segments with the biggest $ changes in Pet Services Spending.

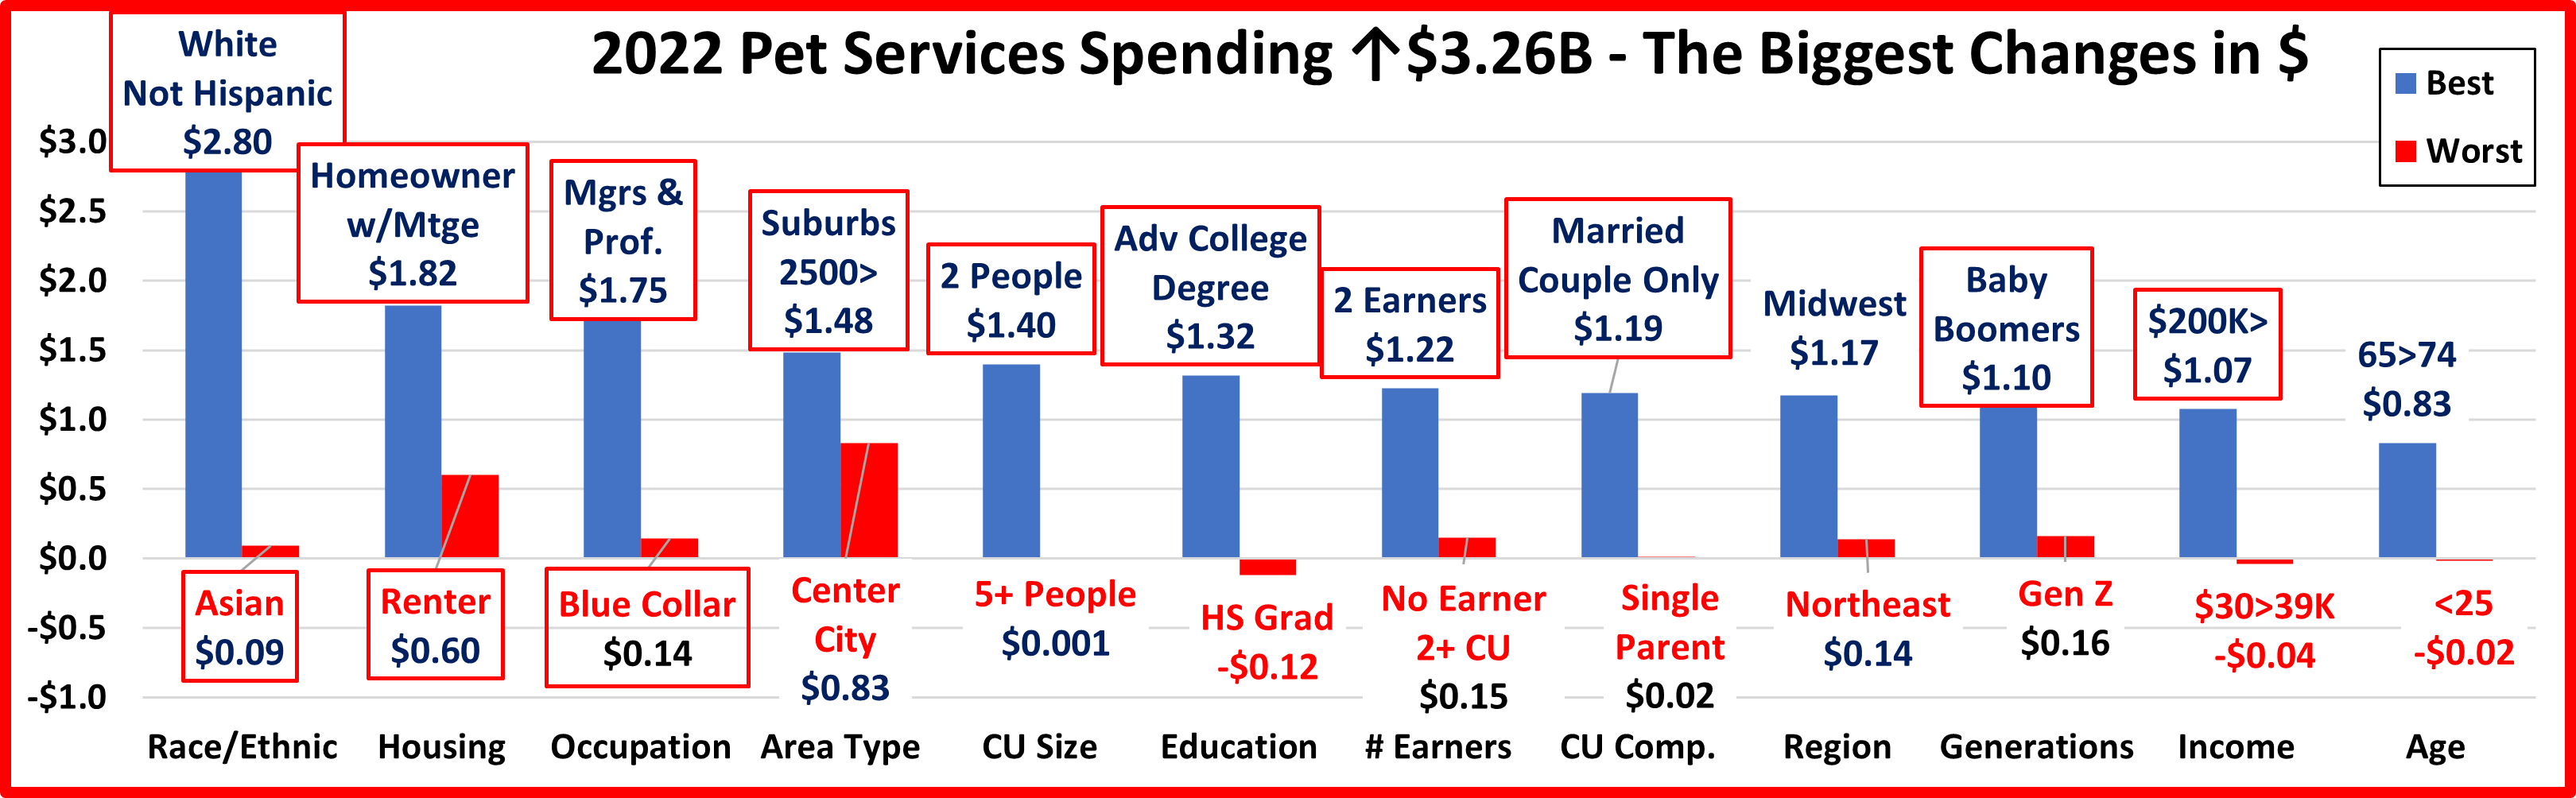
In this chart you immediately see the difference from last year. In 2022 you first notice stability. There were 13 repeats. In 2021 there were none. Also, no segments flipped from 1st to last or vice versa. In 2021 there were 13 flips. While 2021 brought a record increase, the lift in 2022 was even stronger and more widespread. In 9 categories all segments spent more compared to 5 in 2021. Also 93% of 96 demographic segments spent more, up from 90% In 2021. One thing is slightly worse. The biggest drop was -$0.12B. In 2021 it was only -$0.07B. 😊

Here are the specifics:

  • Race/Ethnic – Both the winner and loser are the same as 2021.
    • Winner – White, Not Hispanic – Services: $10.50B; Up $2.80B (+36.3%)                       2021: White, Not Hispanic
    • Loser – Asian – Services: $0.31B; Up $0.09B (+43.8%)                                                        2021: Asian
    • Comment– All segments spent more. Minorities were up $0.46B, +32.8%.
  • Housing – Both winner and loser are the same as 2021. All segments spent more.
    • Winner – Homeowner w/Mtge – Services: $7.01B; Up $1.82B (+35.2%)                          2021: Homeowner w/Mtge
    • Loser – Renter – Services: $2.37B; Up $0.60B (+34.1%)                                                       2021: Renter
    • Comment – Homeowners w/o Mtges had the biggest percentage increase, +39.0%.
  • Occupation – For the 3rd and last time, no change in winner and loser.
    • Winner–– Mgrs & Professionals – Pet Services Spending: $5.56B; Up $1.75B (+46.0%)         2021: Mgrs & Profess.
    • Loser – Blue Collar – Pet Services Spending: $0.44B; Up $0.14B (+48.9%)                                2021: Operators/Laborers
    • Comment – Self-Employed had the 2nd biggest $ lift and the highest % increase, +$0.47B (+60.1%)..
  • Area Type – Suburbs 2500> stayed on top while Center City replaced Rural at the bottom.
    • Winner – Suburbs 2500> – Pet Services Spending: $5.72B; Up $1.48B (+34.9%)                 2021: Suburbs 2500>
    • Loser – Center City – Pet Services Spending: $3.90B; Up $0.83B (+27.1%)                          2021: Areas <2500
    • Comment – Center City “lost” with an $0.83B increase. This shows how well the Services segment is doing.
  • # in CU – 2 People won again but 5+ People is a new loser.
    • Winner – 2 People – Pet Services Spending: $5.15B; Up $1.40B (+37.3%)                         2021: 2 People
    • Loser – 5+ People – Pet Services Spending: $1.01B; Up $0.001B (+0.1%)                          2021: 3 People
    • Comment: All segments spent more. The 2 People lift was primarily driven by the Married Couple Only segment.
  • Education – College Degree returned as #1. HS Grads replaced those with no HS Diploma at the bottom.
    • Winner – Adv. College Degree – Pet Services Spending: $4.77B; Up $1.32B (+38.1%)              2021: Adv. College Degree
    • Loser – HS Grads – Services Spending: $0.47B; Down $0.12B (-20.5%)                                       2021: <HS Grads
    • Comment – Only HS Grads spent less. College Grads have 46.7% of CUs but generated 64.3% of the increase. However, those with an Associate’s degree more than doubled their spending, +$0.81B (+116.3%).
  • # Earners– 2 Earners held their spot at the top while No Earner, 2+ CUs replaced No Earner, Singles at the bottom.
    • Winner – 2 Earners – Pet Services Spending: $5.49B; Up $1.22B (+28.7%)                                  2021: 2 Earners
    • Loser – No Earner, 2+ CU – Pet Services Spending: $0.82B; Up $0.15B (+21.9%)                      2021: No Earner, Single
    • Comment – All segments spent more. The biggest % lifts were in Singles – 1 Earner: +52.9%; No Earner: +51.6%
  • CU Composition – Married, Couple Only stayed on top. Single Parents were a new loser.
    • Winner – Married, Couple Only – Services: $3.80B; Up $1.19B (+45.5%)                       2021: Married, Couple Only
    • Loser – Single Parents – Services: $0.27B; Up $0.02B (+6.0%)                                           2021: Married, Oldest Child <6
    • Comment – All groups spent more. Last year only Married, Oldest Child <6 spent less. This year they spent 33.9% more. Single Parents don’t spend much on Services. They spent 6% more, slightly less than the 6.3% inflation rate
  • Region – Both the winner, Midwest, and loser, Northeast, are new.
    • Winner – Midwest – Pet Services Spending: $2.82B; Up $1.17B (+71.5%)                            2021: West
    • Loser – Northeast – Pet Services Spending: $1.90B; Up $0.14B (+7.8%)                              2021: South
    • Comment – In 2020 all Regions spent less. In 2021 & 2022, all spent more. The South finished a close 2nd, +$1.15B
  • Generation – Boomers won again but the youngsters, Gen Z, replaced the oldsters, Born <1946, at the bottom.
    • Winner – Baby Boomers – Services: $4.15B; Up $1.10B (+35.9%)                                        2021: Baby Boomers
    • Loser – Gen Z – Services: $0.27B; Up $0.16B (+143.5%)                                                          2021: Born <1946
    • Comment – In 2021, only Gen Z and those Born <1946 spent less. In 2022, all generations spent more, but the strongest lifts again came from Boomers (+$1.10B), Millennials (+$1.00B) and Gen X (+$0.74B).
  • Income – $200K> won again but $30>39K replaced $40>49K at the bottom.
    • Winner – $200K> – Pet Services Spending: $3.66B; Up $1.07B (+41.6%)                           2021: $200K>
    • Loser – $30 to $39K – Pet Services Spending: $0.37B; Down $0.04B (-9.4%)                   2021: $40 to $49K
    • Comment – The $50>69K group also spent-$0.02B less but <$30K spent 30% more and $40>49K doubled their spending. All income groups over $70K had 31+% increases, led by $70>99K at +60.9%.
  • Age – Both winner and loser are new.
    • Winner – 65>74 yrs – Pet Services Spending: $2.20B; Up $0.83B (+61.1%)                        2021: 35>44 yrs
    • Loser – <25 yrs – Pet Services Spending: $0.17B; Down $0.02B (-8.4%)                            2021: 45>54 yrs
    • Comment: In 2021, only the high-income 45>54 yr-olds spent less. In 2022 only the low income <25 group had a drop in spending. The lift skewed a little older, but it was actually pretty balanced among big age ranges. 25>44 was up +$0.90B; 45>64 was +$1.24B; 65> was +$1.13B.

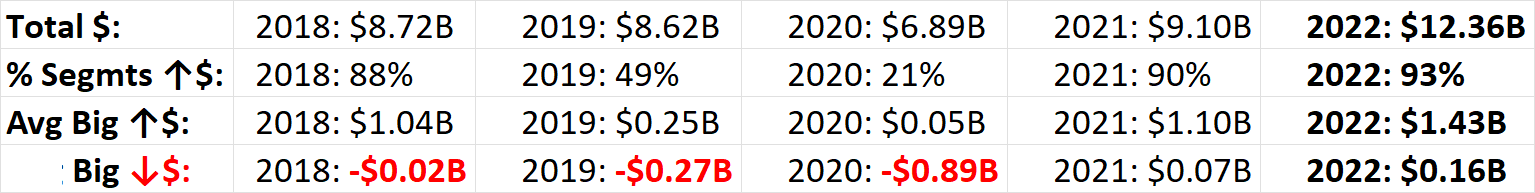
We’ve seen the winners and losers in terms of change in Services Spending $ for 12 Demographic Categories. The lift set another new record and was even more widespread than 2021. Here’s some data which shows the evolution from 2018 to 2022. Services were hit hard by the pandemic but recovered stronger than ever with 2 record lifts. They were the only segment to do this which reflects an attitudinal change by Pet Parents. You see the differences in the big swings.

We found the winners in performance and $, but there were others who performed well but didn’t win. They deserve….

HONORABLE MENTION

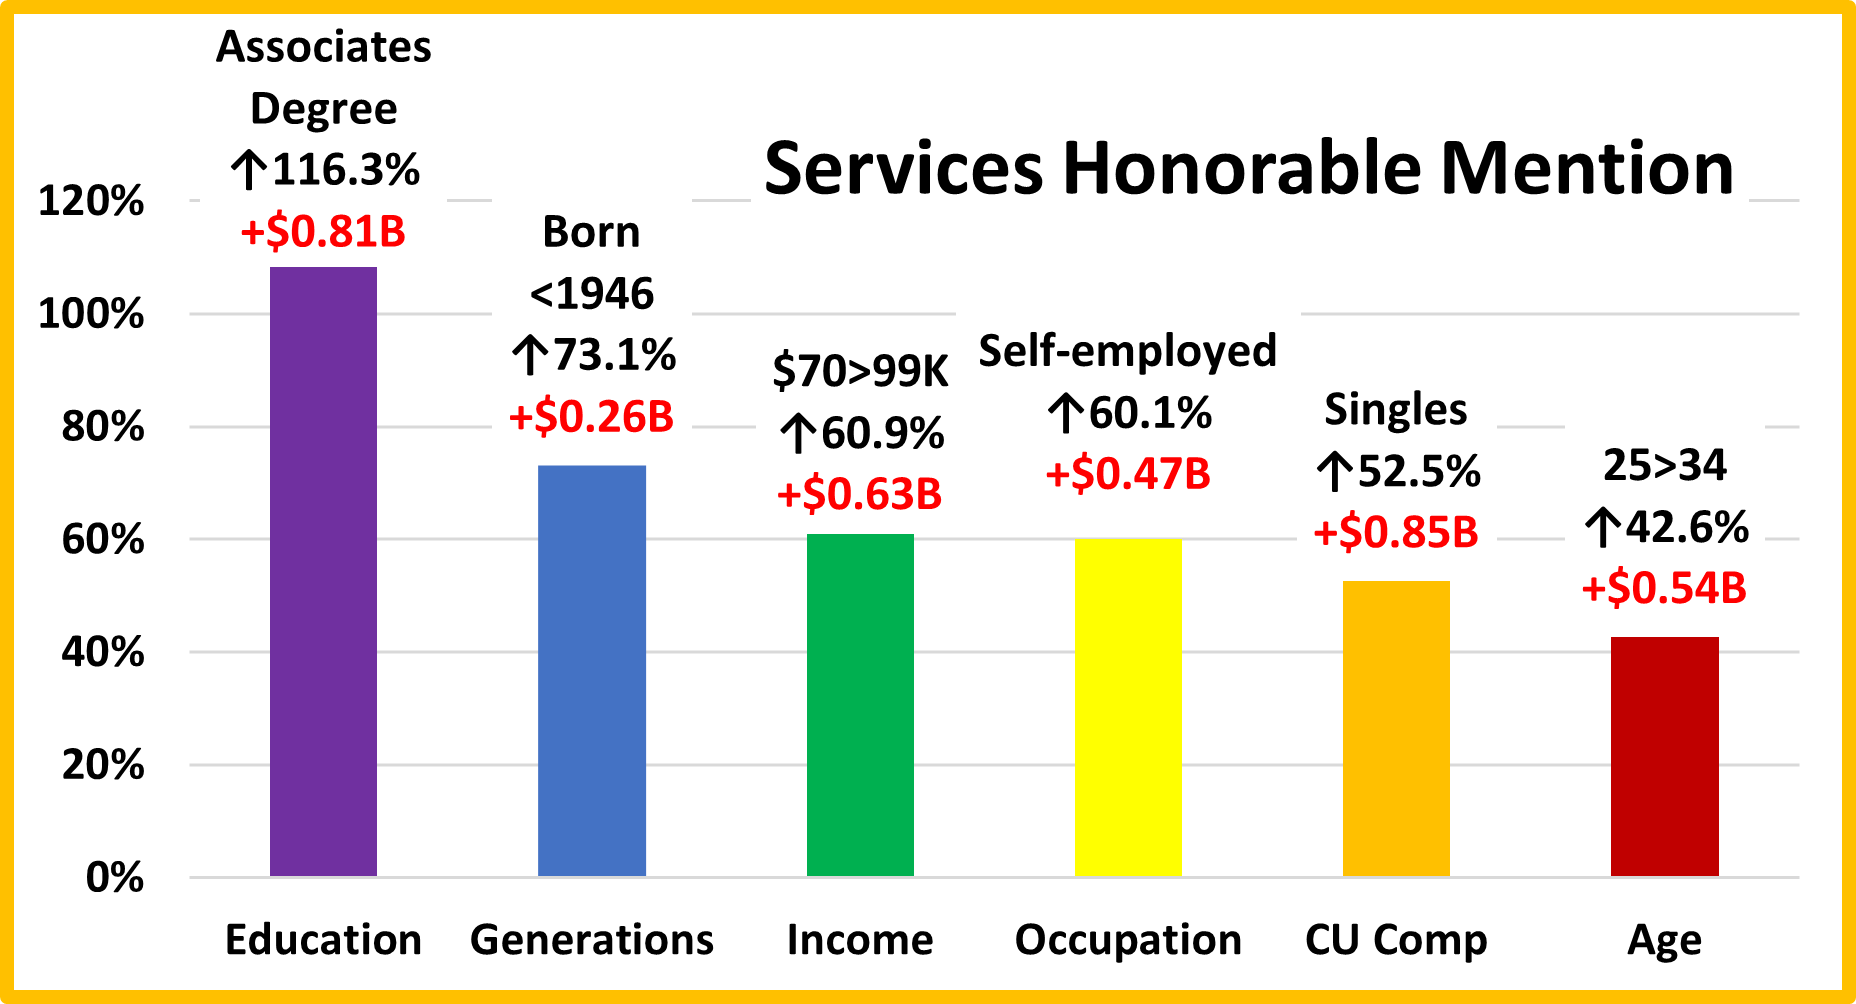
As usual this group is an eclectic mix. The Associate’s degree group immediately stands out as they more than doubled their Services’ spending. While spending skewed a little older, it also became a little more balanced among age groups which is shown by the strong performances of 25>34 yr-olds and those Born <1946. The Self-Employed group is often a winner, so they are no surprise. Their big lift didn’t happen until 2022 but their Services spending has generally grown every year, including aa 24% increase in 2020. Singles are often at the bottom in spending. They too had a small, 8% increase in spending in 2021 and followed it up with a 52% lift in 2022. Finally, the $70>99K group. Their income is below average and they have big CUs. However, they still managed to have a huge 60.9% lift in spending. In 2022, 93% of all segments increased Services spending. That means that we could have added many more to this honored group.

Summary

For years, Services’ spending slowly but steadily increased. However, the number of outlets offering Services was radically increasing. In 2017, this competitive pressure caused Pet Parents to shop for value and spending fell 1%. In 2018, the abundance of outlets and competitive prices finally had their intended impact. Many more consumers took advantage of the convenience of Pet Services and spending literally took off with a record increase to a new all-time spending high. In 2019 Consumers held their ground at the new higher level but we saw turmoil similar to 2017. Again, value shopping likely contributed to the small decrease.

In 2020, pandemic Services outlets were often deemed nonessential, so they were subject to restrictions and closures. Services are definitely needed by some groups. However, for most demographics, Services are a convenience and spending is very discretionary in nature. The reduced availability and the pandemic driven focus on the “needed” segments – Food and Veterinary caused a 20% drop in Services $.

In 2021 the Retail Marketplace opened up again and many Pet Parents strongly returned to their previous Services mantra, “I need help with my Pet “children” and I have the money to pay for it!”. This behavior was widespread as 90% of all demographics spent more on Services, producing a record increase. In 2022 Services showed that it was different from other segments. All had record lifts related to the Pandemic followed by drops, except for Services. 2022 spending didn’t decrease, it grew even stronger, +$3.26B and more widespread as 93% of demographics increased spending. However, Services is the segment where spending is the most driven by income, so it has always had a big disparity between segments. This improved slightly in 2022. Performance differences are a key measurement of disparity. Let’s consider the performance of the big groups. There were 6 categories with a 120+% performing big group, down 1 from 2021, and now 1 less than Supplies (7) but more than Veterinary (5) and Food (4). There is an even better measure of the improvement. In 2021, the average difference between best & worst performers was 108.5%. In 2022 it was 100.3%.

Another key trend in 2022 was that Gen X & Boomers are still the top 2 spenders, but their older members drove the lift.

Services were hit the hardest by the pandemic in 2020 but they had a record, widespread recovery in 2021. They are the segment most driven by high income so the 6.3%  inflation in 2022 had less of an impact. It affected the spending of some specific, financially challenged groups, but the 2022 lift was even bigger and more widespread than 2021.

At Last – The “Ultimate” Pet Services Spending Consumer Unit consists of 2 people – a married couple with no kids at home. They are 45>54 yrs-old and White, but not of Hispanic origin. They both work and at least one of them has an Advanced College Degree and is a Manager or Professional. They have an income of over $200K. They live in a small suburb of a metropolitan area of 2.5>5 MM in the Western U.S. and are still paying off their home mortgage.