Retail Channel Monthly $ Update – January Final & February Advance

The Retail recovery has been generally successful, but now, our attention has turned to an unexpected factor also attributed to the pandemic – extreme inflation. Since this can affect retail sales, we will continue to track the retail market with data from two reports provided by the Census Bureau and factor in the CPI from US BLS.

The Census Bureau Reports are the Monthly and the Advance Retail Sales Reports. Both are derived from sales data gathered from retailers across the U.S. and are published monthly at the same time. The Advance Report has a smaller sample size so it can be published quickly – about 2 weeks after month end. The Monthly Final Report includes data from all respondents, so it takes longer to compile the data – about 6 weeks. Although the sample size for the Advance report is smaller, the results over the years have proven it to be statistically accurate with the final monthly reports. The biggest difference is that the full sample in the Final report allows us to “drill” a little deeper into the retail channels.

We begin with the Final Retail Report for January and then move to the Advance Report for February.  We will now compare 2022 to 2021, 2020 and 2019. In both reports we will show both the actual and the “real” change in $ as we factor inflation into the data.

Both reports include the following:

  • Total Retail, Restaurants, Auto, Gas Stations and Relevant Retail (removing Restaurants, Auto and Gas)
  • Individual Channel Data – This will be more detailed in the “Final” reports, and we fill focus on Pet Relevant Channels

The information will be presented in detailed charts to facilitate visual comparison between groups/channels of:

  • Current Month change – % & $ vs previous month
  • Current Month change – % & $ vs same month in 2021, 2020 and 2019.
  • Current YTD change – % & $ vs 2021, 2020 and 2019 (In the Jan. Final, YTD is unnecessary, so we add the Avg chge)
  • Monthly and Year To Date $ will also be shown for each group/channel

First, the January Final. Retail hit bottom in April 2020 but began recovery. The recovery strengthened in 2021 and became widespread. Total Retail $ broke the $700B barrier for the 1st time in December. As usual, $ dropped from December but 2022 started strong. Here are the major retail groups. (All $ are Actual, Not Seasonally Adjusted)

The January Final is $5.5B more than the Advance Report. Only 1 group was down. Specifically: Restaurants: -$0.3B; Auto: +$1.7B; Gas Stations: +$0.2B; Relevant Retail: +$3.9B. The normal big drop in retail sales from December is readily apparent but it is less than in past years. The recovery for Restaurants and Gas Stations is late and still surging. All groups have now been positive vs past years for 8 consecutive months. Now, let’s look at the “Real” January lift, factoring in inflation. The Jan 22 to Jan 21 inflation was 7.5% overall. That would put the “real” increase for Total Retail at +5.9% (44% of 13.4%); Restaurants – Inflation = 6.4%. Real Increase: 18.0% (73.8%); Auto – New & Used Vehicle Inflation = 23.1%. It’s likely that sales were down as much as -10%; Gas Stations – Gasoline Inflation = 40.0%. Real Change: -6.7%. Relevant Retail – Inflation = 7.5%. Real Increase: 1.9% (20.2%). Inflation is a major problem.

Now, let’s see how some Key Pet Relevant channels did in January.

Overall – You see the importance of the holiday buying surge to these channels as all were down vs December and only the most essential channels – Supermarkets and Drug Stores had less than double digit decreases.

  • Building Material Stores – Their amazing lift has slowed in the winter months, especially in Farm Stores, which had the only decrease vs January 2021. Most of the increase from 2019 for both Home Ctr/Hdwe and Farm Stores came from the 20>21 lift. Home Ctr/Hdwe $ continued to grow but Farm Stores just held their ground. The January YOY inflation for Tools, Hdwe, Outdoor Equip/Supp was 10.7% That makes the January “real” numbers:

Home Ctr/Hdwe: +10.9%, Real: +0.2%; Farm Stores: -0.05%, Real: -10.8%

  • Food & Drug – Both of these channels are truly essential. Except for the food binge buying in the early part of the pandemic, they tend to have smaller fluctuations in $. Supermarkets have had stronger growth since 2019. Much of that is due to more families choosing to cook at home. Here are the real January numbers which may be a surprise. The inflation rate for Food at Home in January was 7.4%. Prices for Drugs (Rx & OTC) were up only 1.3%. The YOY growth was

Supermarkets: +7.8%, Real: +0.4%; Drug Stores: +9.1%, Real: +7.8%

  • Sporting Goods Stores – Like Hardware/Farm stores, they benefited from the pandemic in that consumers turned to self-entertainment, especially sports & outdoor activities. They had a huge drop from December but managed to stay at the extraordinarily high 2021 level. The high demand has pushed the inflation rate for Sporting Goods to 8.2%. There was literally no $ growth from January 2021 to 2022. Considering inflation, that equates to an -8.2% drop in sales.
  • General Merchandise Stores – $ in all channels fell substantially from December but were up slightly from January 2021. SuperCtrs/Clubs have a higher percentage of groceries which makes for more frequent visits and generally higher numbers, including growth rate. Discount Dept Stores were struggling before COVID but had a strong 2021. Using the overall inflation rate of 7.5%, here are the January numbers

SupCtr/Club: +4.5%, Real: -3.0%; $/Value Strs: +2.5%, Real: -5.0%; Disc. Dept. Strs: +1.8%, Real: -5.7%

  • Office, Gift & Souvenir Stores – These non-essential stores started to recover in the spring of 2021, but they are still not there yet. Sales are up vs January 2021, but every other measurement is negative, including vs 2019. The available inflation number most appropriate for them is “limited” as it cuts out food, energy, shelter and used vehicles – +5.1%. Their sales were +3.1% so real sales were actually down -2.0%.
  • Internet/Mail Order – The sales growth of the undisputed “hero” of the Pandemic is slowing as they were up 13.6% from 2021, slightly slower than their average growth rate of 17.3%. With inflation at 7.5%, their real growth is 6.1%.
  • A/O Miscellaneous – This is a group of specialty retailers. Pet Stores are 22>24% of total $. In May 2020 they began their recovery which reached a record level by December 2021 as annual sales reached $100B for the first time. January $ are up 22.4% from 2021. Using the 5.1% “limited” inflation rate, their real sales are +17.3%. However, by any measure, they are the percentage leader in January growth. Take note: In January 2022, this group, of which Pet Stores are an important and growing segment, beat the growth rate of Internet/Mail Order over both last year and since 2019.

Inflation is an important factor. In actual $, 9 of 11 channels increased sales over January 2021. However, when you factor in inflation, including the rate most in tune with each Channel’s offerings, the number with any “real” growth falls to 5. Until things change, inflation will be a big part of retail sales discussions. Now, the Advance numbers for February.

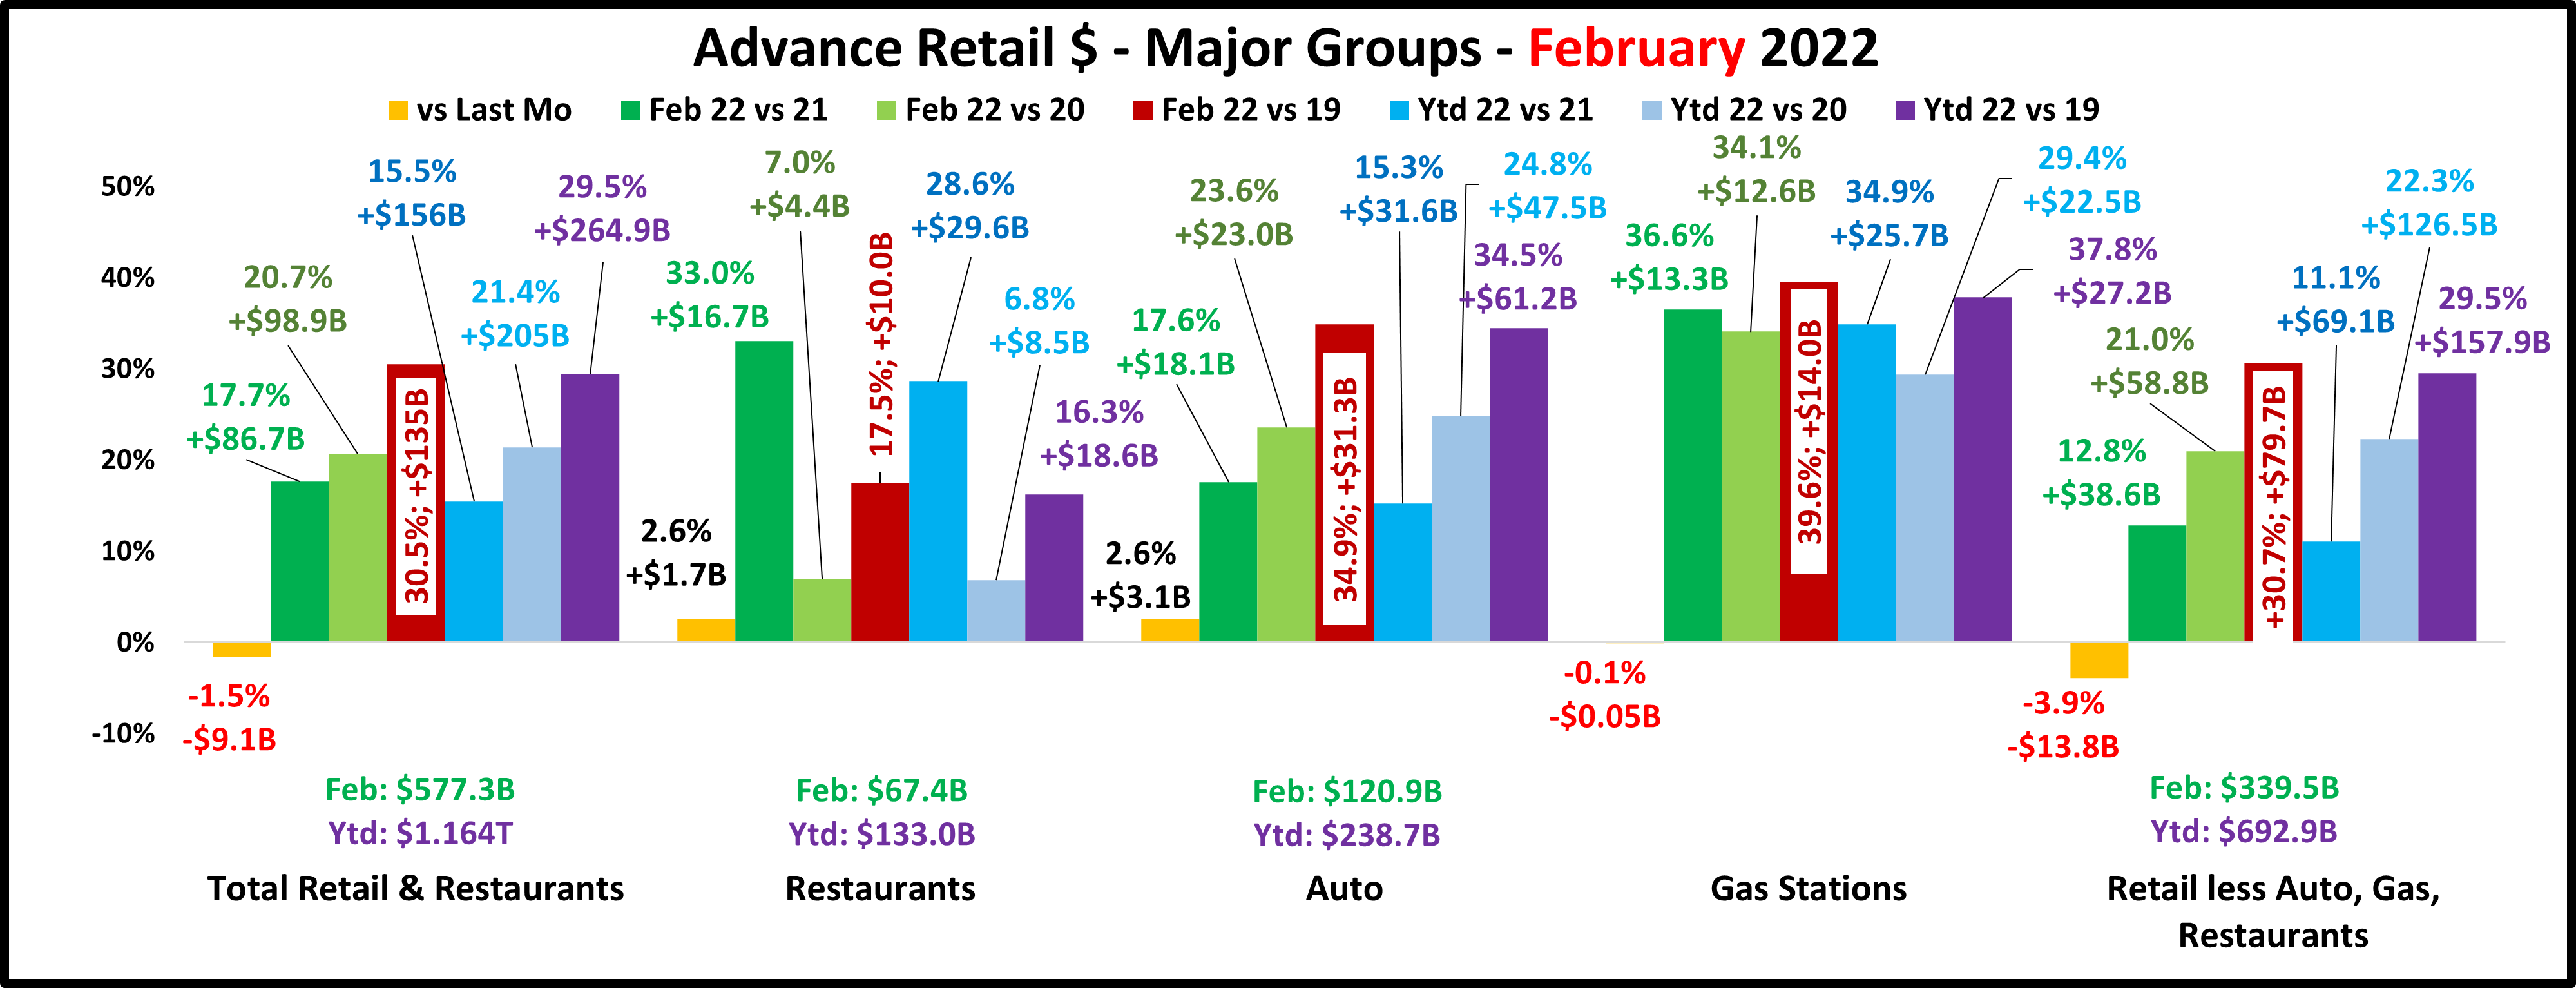
We have had 2 straight memorable years. 2020 saw the 2 biggest monthly drops in history but Total Retail finished by reaching $600B for the first time in December. In 2021, the recovery strengthened with all big groups positive in all measurements vs 2019 & 2020 for the final 7 months. Total Retail reached $713B in December and broke the $7T barrier for the year. Relevant Retail was also strong as annual sales reached $4T but in fact, all big groups set annual sales records in 2021. As usual, sales fell in January from their December peak and driven down by Relevant Retail, Total Retail $ continued to decline in February. In virtually every year, February is the low point for retail sales.

Overall – The only negative numbers are vs January and not for all groups. We should also note that the February sales patterns since 2019 look normal for Total Retail, Relevant Retail and Auto with annual increases. Remember, February 2020 was pre-pandemic and by February 2021, only Restaurants and Gas Stations had not begun a strong recovery.

Total Retail – January Sales set a record beating the 2021 record by 13.4%. February was even better, breaking the $500M barrier for the 1st time and beating the 2021 record by 17.7%. YTD numbers are up 15.5%, with an annual growth rate since 2019 of 9.0%. However, 59% of the growth since 2019 occurred from 2021 to 2022 which brings inflation into the conversation. The inflation rate for February 2022 vs 2021 was 7.9%, even higher than January. YTD prices are up 7.7%. Here are the numbers. February: +17.7%, Real: +9.8% (55.4%); YTD: +15.5%, Real: +7.8% (50.3%). Inflation is a big factor, but real growth is still strong.

Restaurants – They were hit hard by the pandemic and didn’t truly start to recover until March 2021. However, sales in 7 of the last 8 months of 2021 exceeded $70B and 2021 was the biggest year in history, $821B. January sales fell from December but turned up in February. This happens about half of the time as these 2 months compete for the low point in Restaurant sales. Their February sales pattern clearly reflects their late recovery, especially from a $12B drop in 2021. YTD sales are up an average of 5.1% since 2019, becoming more normal. Inflation for Food away from home in February was 6.8%. YTD, it is 6.6%. Here is real growth. February: +33.0%, Real: +26.2% (79.4%); YTD: +28.6%, Real: +22.0% (76.9%) This is by far the best performance of any group and significantly improves the Total Retail numbers.

Auto (Motor Vehicle & Parts Dealers) – This group actively worked to overcome the stay-at-home attitude with great deals and a lot of advertising. They finished 2020 up 1% vs 2019 and hit a record $1.54T in 2021. In January, sales fell but then turned up in February, the usual pattern in a normal year. Their YTD growth rate since 2019 is 10.4%, the highest of any big group. But what about inflation? The overall inflation rates of Feb: 7.9% and YTD: 7.7% would produce real increases of Feb: +9.7%; YTD: +7.7%. However, the inflation rates for new & used vehicles, which account for most of the sales in this group, were Feb: +23.5%, YTD: +23.3%. This would create a real drop in sales of Feb: -5.9%, YTD: -8.0%. It seems likely that there is an ongoing drop in the actual amount sold in this group which is tied to extreme inflation.

Gas Stations – Gas Stations were also hit hard. If you stay home, you drive less and obviously need less gas. This group started recovery in March 2021 and reached a record $588B for the year. January sales fell -5.1% from December and February sales also dropped slightly. However, they were up 36.6% vs 2021. Gasoline inflation is in all the headlines so let’s get right to the numbers. Gasoline inflation vs 2021 for February is 38% and YTD is 39% which generates the following. February: +36.6%, Real: -1.4%; YTD: +34.9%, Real: -4.1%. While the gap is narrowing, extraordinarily high prices are hindering growth. People are ready to get out and about, but high gas prices are causing them to reconsider.

Relevant Retail – Less Auto, Gas and Restaurants – This the “core” of U.S. retail and accounts for 60+% of Total Retail Spending. There are a variety of channels in this group so they took a number of different paths through the pandemic. However, their only down month was April 2020. They finished 2020, up +7.1% and 2021 got even better as they reached a record $4.47T. They have led the way in Total Retail’s recovery which became widespread across the channels. In January and February sales fell from the previous month but this is the normal pattern. Sales hit bottom in February then begin a Spring lift. Both January & February set new monthly $ records and the YTD annual growth rate is 9.0% with a relatively normal growth pattern. Although over 40% of the increase since 2019 occurred this year. That says we should look at the impact of inflation. We’ll use the overall inflation rates: February: 7.9%, YTD: 7.7%. February: +12.8%, Real: +4.9% (38.3%); YTD: +11.1%, Real: +3.1% (27.9%). Although this is significantly better than January when real growth was only 0.7%, it is still concerning when only 1/3 of the growth in this big group is real.

Gas Stations are unquestionably the inflation loser but now Relative Retail and Auto, which had the strongest recovery from COVID are starting to feel the effect of strong inflation. Next, we’ll drill down to look at what is happening in the individual retail channels. Remember, the channels in the chart are less defined than in the Final Monthly reports and we will look across the whole market, not just pet relevant outlets.

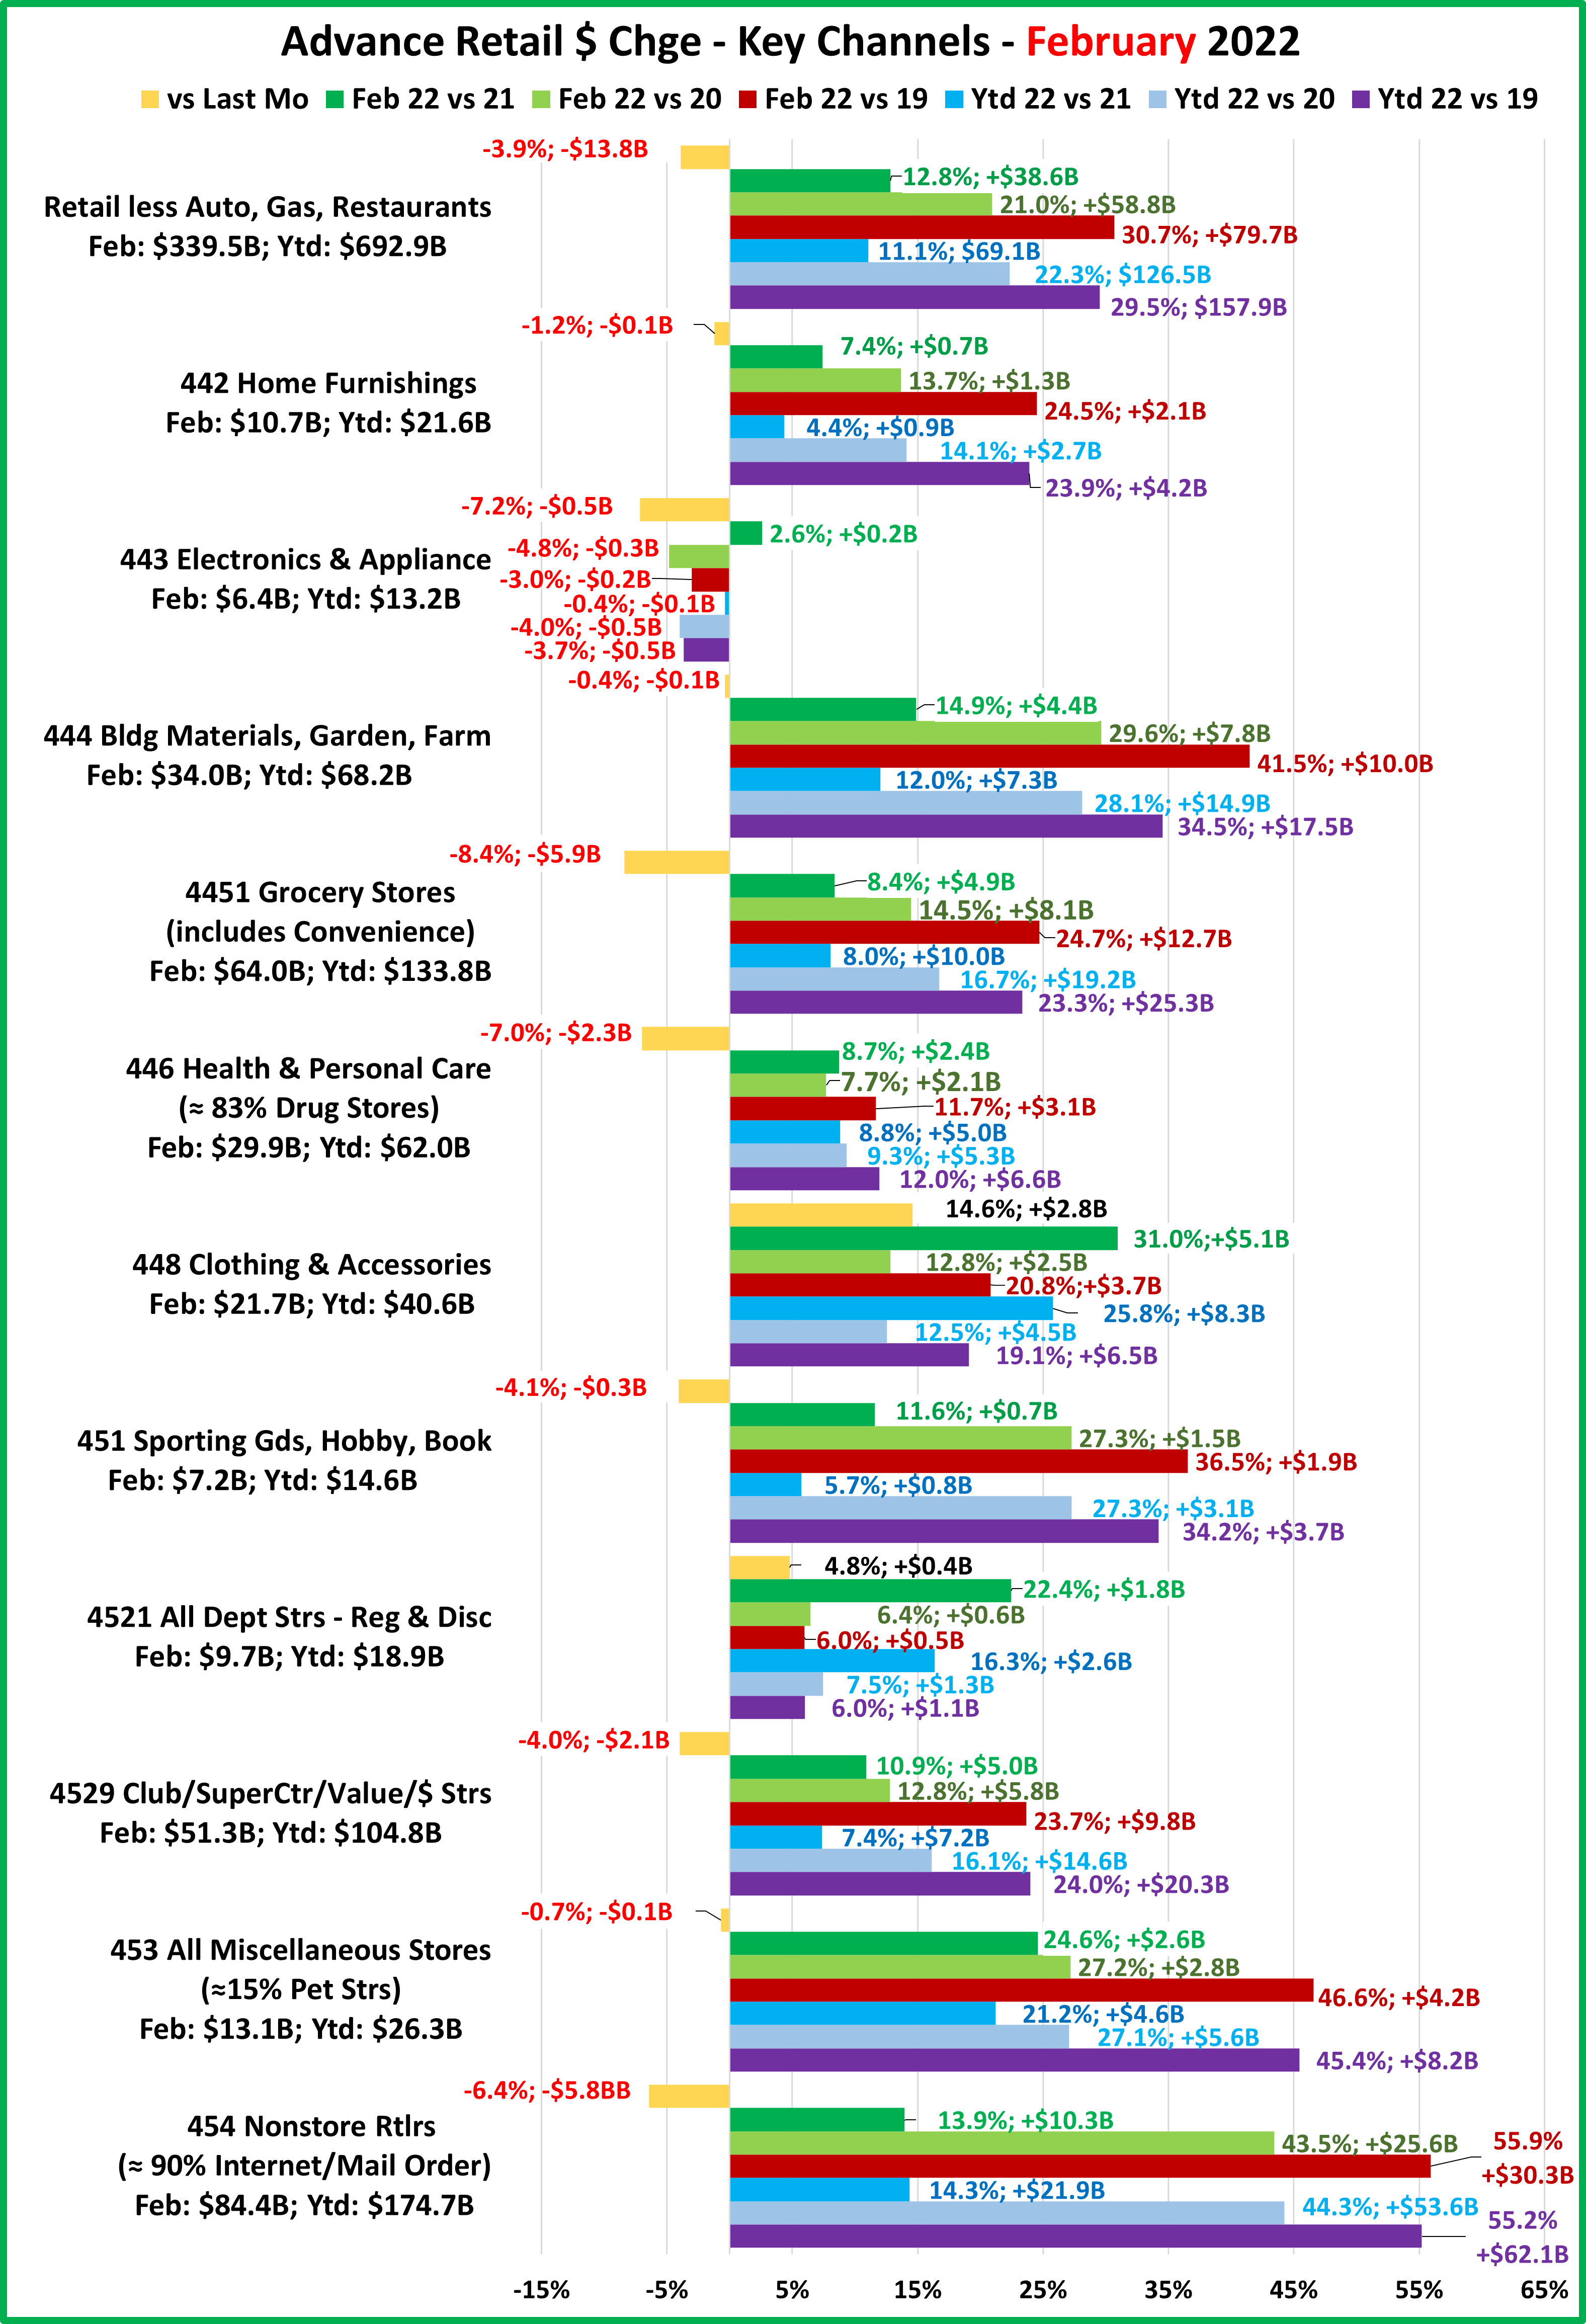
  • Relevant Retail: Feb: +12.8%, Real: +4.9%; YTD: +11.1%, Real: +3.4%. 9 of 11 channels were down vs January but all were up vs February 2021. In fact, 10 of 11 were up in all measurements vs 2019>2021. It was a record month.
  • All Dept Stores – This group was struggling before COVID, and the pandemic hit them hard. They began to recover in March 2020, and they have continued to grow through February. The most appropriate inflation rate to use for them is less Food, Energy, Shelter & used vehicles which are Feb: 5.3%, YTD: 5.1%. That puts their numbers at Feb: +22.4%, Real: +17.1%; YTD: +16.3%, Real: +11.2%. Their recovery is getting stronger by any measure.
  • Club/SuprCtr/$ – They fueled a big part of the overall recovery because they focus on value which has broad consumer appeal. Inflation is a big factor in their current numbers as their lift has slowed at least temporarily. Using the national CPI, Feb: +10.9%, Real = +3.0%, YTD: +7.4%, Real: -0.3%
  • Grocery – These stores are the most essential and depend on frequent purchases so except for the binge buying in 2020, their changes are generally less pronounced. However, inflation has also hit Groceries, 8.6% in February and 8.0% YTD. This is the biggest increase since 1981. February: +8.4%, Real = -0.2%; YTD: 8.0%, Real: 0.0% – No Change
  • Health/Drug Stores – At least the drug stores in this group are essential, but consumers visit far less frequently than Grocery stores. Their February sales actually dropped in 20>21 but most of their COVID ride has been rather calm. Using the CPI for Rx & OTC drugs (Feb: 2.5%, YTD: 1.9%) their numbers are: Feb: +8.7%, Real: +6.2%; YTD: +8.8%, Real: +6.9%
  • Clothing and Accessories – They were also nonessential and what you were wearing didn’t matter when you stayed home. That changed in March 2021 and consumers’ pent-up needs caused explosive growth which has continued through February. Apparel inflation is Feb: 6.6%, YTD: 6.0%. Their $ are Feb: +31.0%, Real: +24.4%; YTD: +25.8%, Real: +19.8%
  • Home Furnishings – They were also less impacted by COVID. Sales dipped Mar>May in 2020. Then as consumers’ focus turned to their homes, furniture became a priority. Inflation on Furniture is extremely high, 17.1% for both February and YTD. That causes a big turnaround in their numbers. Feb: +7.4%, Real: -9.7%; YTD: +4.4%, Real: -12.7%
  • Electronic & Appliances – Look at the graph. This channel has problems beyond the pandemic. Sales fell in Apr>May of 2020 and didn’t reach 2019 levels until March 2021. Right now, their sales are stagnated. We’ll wait and see if they have a yearend lift. We’ll use the “limited” CPI: Feb: 5.3%, YTD: 5.1%. Feb: +2.6%, Real: -2.7%; YTD: -0.4%, Real: -5.5%.
  • Building Material, Farm & Garden & Hardware –They truly benefitted from the consumers’ focus on home. Their spring lift has become almost year-round and it’s ready to start again. The CPI for Hdwe & Outdoor is Feb: 10.6% YTD: 10.7%. Here are their February numbers. Feb: +14.9%, Real: +4.3%; YTD: +12.0%, Real: +1.3%.
  • Sporting Goods, Hobby and Book Stores – Consumers turned their attention to personal recreation and sales in Sporting Goods outlets took off. Book and Hobby Stores recovery was slower. It appears that the YTD lift has slowed in 2022. The product groups in these outlets have radically different CPIs so using the “limited” inflation version seems to be the best choice. Feb: 11.6%, Real: 5.3%; YTD: 5.7%, Real: 0.6%.
  • All Miscellaneous Stores – Pet Stores have been a key part of the strong and still growing recovery of this group. They finished 2020 +0.9% but sales took off in March 21, setting a new monthly record in December. The growth continues in 2022 as they are 2nd to Clothing in February & YTD lift. Since 2019 their growth is 2nd to NonStore. The “limited” CPI also seems right for this group and generates these great numbers. Feb: +24.6%, Real: +19.3%; YTD: +21.2%, Real: +16.1%
  • NonStore Retailers – 90% of the volume of this group comes from Internet/Mail Order/TV. The pandemic accelerated the movement to online retail. They ended 2020 +21.4%. The growth continued in 2021 and in December monthly sales exceeded $100B for the 1st time and they broke the $1 Trillion barrier in annual sales. Growth is a little slower in 2022 but still strong. Using the national CPI, their latest numbers are Feb: +13.9%, Real: +6.0%; YTD: +14.3%, Real: +6.7%

Note: Almost without exception, online sales by brick ‘n mortar retailers are recorded with their regular store sales.

Recap – 2020 was quite a year, with the trauma of April & May followed by the triumph of breaking $600B for the first time in December. 2021 was even more memorable as it produced record sales for all major groups and Total Retail exceeded $7T for the 1st time. Relevant Retail was the major driver in this recovery. Since May of 2020 their sales have exceeded past years in all measurements, and they reached $4.47T in 2021. The recovery was widespread as all but 2 groups on our Advance Chart set sales records in 2021. 2022 began pretty normally for Relevant Retail as sales fell from December but exceeded 2021. The big change was that inflation that began in late 2021 hit levels not seen in decades and came to the forefront of every conversation. As we saw in our analysis, it affected virtually every channel and even turned 4 channels from positive to negative. This will not go away quickly and if it continues or worsens it will ultimately result in consumers buying less, ending retail growth by any measurement. We will continue to monitor the situation.


“Petflation” 2022 – February Update – Inflation Surges in All Segments

Inflation continues to make headlines. There have been year over year increases in the monthly Consumer Price Index (CPI) larger than we have seen in decades. Just recently it was announced that Food at Home (groceries) prices were up 8.6% over 2021, the biggest increase since 10.7% in 1981. This month’s huge increase is only in 4th place with 2nd place going to 1979, +13.9% and the top spot going to 1974, +22.3%. By the way, the average interest rate for a 30 year fixed rate mortgage in 1981 was 16.6%. As bad as things look right now, they can get much worse. As we have seen in recent years, even minor price fluctuations can affect consumer pet spending, especially in the more discretionary segments. With that in mind, we will initiate monthly reports to track petflation as it evolves in the marketplace.

Total Pet Products & Services prices were 4.1% higher in December 2021 than in December 2020. That’s high, but still much better than the overall CPI increase of 7.0%. We’ll start tracking 2022 in greater detail. Each report will include:

  • A rolling 24 month tracking of the CPI for all pet segments and the national CPI. The base number will be pre-pandemic December 2019 in this and future reports, which will facilitate comparisons.
  • Monthly comparisons of 22 vs 21 which will include Pet Segments and relevant Human spending categories. Plus
    1. CPI change from the previous month
    2. Inflation changes for recent years (20>21, 19>20, 18>19
    3. Total Inflation for the current month in 2022 vs 2019
    4. Average annual Year Over Year inflation rate from 2019 to 2022
  • YTD comparisons
    1. YTD numbers for the monthly comparisons #2>4 above

In our first graph we will track the monthly change in prices for the 24 months from February 2020 to February 2022. We will use the December 2019 as a base number in this and future reports so we can track the progress from pre-pandemic times through an eventual recovery. Inflation is a complex issue. This chart is designed to give you a visual image of the flow of pricing. You can see the similarities and differences in patterns between segments and compare them to the overall U.S. CPI. The current numbers plus those from 12 and 24 months earlier are included as are the yr-end numbers for 2020 & 2021.This will give you some key waypoints for comparisons.

You immediately see a distinct difference in patterns between the 2 Services segments and the 2 Products segments. While there were some dips and differences, Veterinary and Services prices generally inflated during the whole 2-year period with an accelerated rate in 2021, a pattern similar to the overall CPI. Food and Supplies were generally deflated

below December 2019 prices until mid-year 2021. At that time, Food turned slowly up and Supplies returned to 2019 levels. In December inflation accelerated for all segments but Supplies, which turned sharply up in 2022. In the 1st two months of 2022 inflation rates continue to grow nationally and for all pet segments. Here are some things to note:

  • U.S. CPI – The inflation rate was below 2% through 2020. It turned up in January 2021 and continued to grow stronger through February 2022. 87% of the overall 10.4% increase since 2019 occurred in the last 14 months.
  • Pet Food – Prices stayed generally below December 2019 levels from April 2020 to September 2021, when they turned up. There was a sharp increase in December which has grown larger through February.
  • Pet Supplies – Remember that Supplies prices were high in December 2019 due to the added tariffs. They had a “deflated” roller coaster ride until mid-2021 when they returned to December 2019 prices and essentially stayed there until 2022 when they turned sharply up reaching a new all-time pricing high in January, then again in February, breaking the old record which was set way back in September 2009.
  • Pet Services – A normal inflation rate is about 2+%. Despite or maybe because of closures, price increased at a lower rate in 2020. In 2021 consumer demand increased but there were fewer outlets. Prices increased strongly in 2021 with the biggest lifts coming in the 2nd and 4th In 2022, inflation has grown even stronger.
  • Veterinary – Inflation has always been something that you can count on in Veterinary Services. Prices were flat in February 2020 (amazing) but began moving up in March and grew consistently through the 2021 recovery. A pricing surge that started in December allowed them to beat the overall CPI with an inflation rate of +10.8%.
  • Total Pet – You can see that the blending of the segment patterns made the Pet Industry look very price calm compared to the overall market. That ended in December 2021 as prices surged up in all segments.

Next, we’ll turn our attention to the headlines, which largely focus on the Year over Year inflation rate change for the month. We’ll do a little “catch up” as this report will show comparisons for both January and February. We’re also going to look a little deeper to see how the recent numbers compare to the past, including:

  • Vs last month
  • 21>22
  • 20>21
  • 19>20
  • 18>19
  • Tot 19>22
  • Avg 19>22

We also included some “human” categories that can be compared to a pet segment. First, a look at January!

The inflation rate from January 2021 was large and growing significantly for all pet segments. We should also note that it is getting significantly worse as prices were up over 1% from December for 6 of 9 categories.

  • U.S. CPI – Through the pandemic and early recovery, inflation remained at or near normal levels. In 2021 and now 2022, inflation accelerated, resulting in increases not seen in decades.
  • Pet Food – Inflation is the lowest in this segment and only about 1/3 the rate of human groceries. Note the every other year up/down pattern. Because of the size of the Food segment, you see a similar pattern in Total Pet. The 2.7% lift is small vs 2021 but it is larger because it is going against deflated numbers in 2021.
  • Food at Home – You can see the low pre-pandemic inflation rate (normal) which turned sharply up in the pandemic and continues to accelerate. It is now 10 times higher than “normal”. It is largely being driven by shortages due to supply chain problems.
  • Pet Supplies – Prices surged in January to a new all-time record high. (beating Sept 2009). However, we should put this increase into perspective as it comes vs a period of strong deflation
  • Veterinary – Veterinary inflation had slowed before the pandemic, but it returned to more normal high levels. It is high and growing so much that the increase since 2019 is 27% greater than that of the national CPI.
  • Medical Services – Inflation spiked in 2020 but has returned to a more normal rate, well below Veterinary.
  • Pet Services – With closures and consumers’ DIY attitude in the pandemic, demand slowed as did inflation. That ended in 2021 as prices started up again. In January, the price increase vs 2021 was the biggest of any pet segment.
  • Haircuts & Personal Services – Inflation was consistent pre-pandemic. It has grown about 50% in 2021 and 2022.
  • Total Pet – Pre-pandemic, Total Pet inflation was above the national average. The deflation in the products segments drove the inflation rate for Total Pet down. However, all segments have now turned sharply up so the inflation rate is 4 times higher than it was just 1 year ago.

We have seen that prices increased strongly in January vs December producing year over year numbers that are now concerning in the Pet Industry as well as the overall market. Let’s look at February.

As you can see, a bad situation in January, got even worse in February. Prices vs February 2021 were up 7.9% overall with the Grocery increase being the largest since 1981. Again 6 of 9 categories had price increases over 1% from last month, and the increases were generally larger than the January over December increases.

  • U.S. CPI – Prices are up 0.9% since January. The targeted inflation rate is less than 2%. In February, prices were up 7.9%, basically 4 times higher than the “targeted” rate.
  • Pet Food – Prices are up 1.1% vs January and 3.7% vs February 2021. Granted, they are being measured against a deflationary year, but that increase is more than double the pre-pandemic increase from 2018 to 2019.
  • Food at Home – As we said earlier, the year over year increase in February is the largest since 10.7% in 1981 but only 40% of the 22.3% increase in 1974. Things are bad but could get a lot worse. The inflation for this category since 2019 has now increased 10% more than the national CPI.
  • Pets & Supplies – Prices were up 2.3% from their record in January, setting a new record. February prices are being compared to deflated prices in 2021 but the increase is still high, only trailing Food at Home and the national CPI.
  • Veterinary Services – February 2020 was still pre-pandemic. You can see that inflation then was at more normal levels, about twice the national CPI. It then increased to a new higher level and stayed there. However, in February it fell to 2nd place in the overall increase since 2019 as it now trails Haircuts and Other Personal services.
  • Medical Services – Prices sharply increased in pre-pandemic February 2020 but then inflation slowed and has returned to a more normal rate in 2020. Prices were up 0.4% from January, the smallest increase for any category.
  • Pet Services – While inflation slowed during the pandemic and early recovery, it is spiking now – Up 1.3% from January and 6.5% from 2021, the biggest increase in history and almost triple the rate of the previous 2 years.
  • Haircuts & Other Personal Services – This category is obviously important to consumers and they will pay the price.
  • Total Pet – The inflation rate is getting larger and is now 5 times the rate of last year. Only Food is keeping it down as it gets closer to the national CPI rate of increase. Inflation has caused problems in the past by reducing the frequency of purchase in Supplies, Services and Veterinary. Super Premium Food is generally immune as consumers are used to paying big bucks and it is needed every day. We’ll see if consumers are still willing to pay the higher prices for more discretionary products and services at the same frequency as they did in the past.

Now we’ll use the same chart format to look at Year to Date numbers – what does January + February add up to and how does 2022 compare to previous years…so far?

The strong current increase in inflation seen in January and February is reflected in YTD numbers. The increase from 2021 to 2022 is the biggest for 7 of 9 categories. The average annual increase since 2019 is over 3% for all but Pet Food & Pet Supplies. This is due to deflation in 2021.

  • U.S. CPI – The current increase is double the average increase from 2019>2022, but over 4 times the average increase from 2018>2021. Inflation is a big problem that started recently.
  • Pet Food – Inflation is growing stronger, especially after deflation in 2021.
  • Food at Home – Thanks to February, the 2022 YTD increase in prices surpassed that of the overall CPI. You can clearly see how supply chain issues have grown more impactful on prices.
  • Pets & Pet Supplies – Prices have strongly turned up since the beginning of the year, breaking their all-time record set 13 years earlier. Although this year’s increase is being measured against a deflationary 2021, it is very significant and in 3rd place, trailing only Food at Home and the national CPI.
  • Veterinary Services – This chart clearly shows that the inflation rate has consistently grown each year throughout the pandemic and recovery. Regardless of the circumstances, just charge more.
  • Medical Services – Prices went up significantly just before the pandemic, but the rate has slowed since and is now essentially returned to pre-pandemic levels.
  • Pet Services – February 2022 was the largest year over year monthly increase in history and now has helped produce a YTD increase that is 2nd only to 6.6% in 2009. Demand has grown for Pet Services while the availability has decreased, a formula for inflation.
  • Haircuts & Personal Services – The services segments, essential and non-essential were hit hardest by the pandemic. Now as consumers move closer to their normal patterns of spending, the segment is not prepared so the increased demand is driving prices up at an astounding rate.
  • Total Pet – When we first looked at the pandemic impact on Petflation. We saw basically two different patterns. Prices in the Services segments continued to increase, and the rate accelerated as we moved into 2021. The product segments – Food and Supplies, were on a different path. They generally deflated in 2020 and didn’t return to 2019 levels until mid-year 2021. Food prices began a slow increase, but Supplies remained stable until we neared yearend. In 2022, everything changed as Food and Supplies prices turned sharply up. Supplies had the biggest YTD increase of any segment. This change in Products, in conjunction with the strong inflation rate in both Services segments has pushed Total Petflation ever closer to the extraordinarily high rates in the overall market.

Inflation is radically increasing in the Pet Industry. Will it impact spending? Let’s put it into perspective. The 4.9% YTD increase in Total Pet is far below the 10.3% record set in 2009 but over 3 times larger than the 1.5% average since then.

Although pet spending is increasingly moving to higher income groups, the impact of inflation varies by segment. Supplies has been impacted the most. Many categories are commoditized and very price sensitive. The move to high priced Super Premium Food has become widespread because the perceived value has grown so higher prices just push people to value shop. Veterinary prices have strongly inflated for years. The result has been a reduction in visit frequency. Spending in the Services segment has taken off in recent years, but it is driven by higher incomes because of its convenience so inflation is less impactful. We’ll continue to monitor the situation but we’ll just have to wait and see the impact of the latest surge in Petflation.


Attending Global Pet Expo 2022? – Where Big Ideas Come to Life! You Definitely Need a Plan!

The first Global Pet Expo (APPMA) occurred 64 years ago with 17 exhibitors in 30 booths. The industry & the show have both come a long way since then.  Although a little smaller due to COVID, attendees at GPE 22 will see and experience:

  • 716 separate exhibitor booths
  • Over 273,000 square feet of booths (Plus 45,000 sq ft for the New Product Showcase) Global Pet Expo 2022 actually occupies more than 15 acres of prime Florida “real estate”.
  • 3000+ new items in the New Product Showcase and on the exhibit floor
  • Sharing the aisles with an expected 12,000+ attendees, including more than 5000 “buyers”.
  • The opportunity to choose from 34 different educational seminars – 41 hours of classes
  • 5 miles of aisles – just to walk the exhibit floor

The show floor is open for 26 hours so let’s put this in perspective and… “Do the Math!”

 If you don’t attend any seminars, visit the New Product Showcase, stop to chat with anyone in the aisles or for food, a drink or to go to the bathroom and maintain a walking speed of 2.5 mph, you can spend about 2 minutes and 1 second with each exhibitor…You definitely need a plan!

Global Pet Expo definitely has it all… and more. Attendees will find the broadest selection of products and services while Exhibitors have the opportunity to reach a wide range of buyers across all retail channels.

First and foremost, Global is about Pet Products – Food, treats and a vast array of Supply categories. A regular flow of New Products is always critical to keep businesses and the whole industry strong and growing. Obviously, you must take the time to visit the New Product Showcase. You should also sign up for any relevant classes, network with other industry professionals and…walk the whole show.  There are at least twice as many new products being “launched” on the show floor as there are on display in the New Product Showcase. Plus, 28% of the exhibitors are new to GPE. Global is about gathering information and making decisions to improve your business – whether they are made on the spot or put on your “must do” list.

Every business can improve in terms of products. If you are a retailer, what sections of your store are not doing as well as you hoped and need a “facelift” or conversely, what areas are growing and need products to fill additional space? Category managers for distributors and retail chains may only be interested in targeted visits to exhibitors relevant to their “categories”. Representatives may be looking for new manufacturers…in specific product categories. Manufacturers could be looking to find distributors to handle their products or just looking to “check out” the competition. In regard to products, there is always something to see…for everyone!

And Global is the place to see it. It’s all there! With so much to see and do, Time is perhaps the most valuable commodity at the show. How do you make the most of your time on the show floor? Here’s an idea.

In 2014 I first designed a tool in Excel, the Super Search Exhibitor Visit Planner to make “working Global & SuperZoo easier and more productive for ALL attendees – retailers, distributors, reps, groomers, vets…even exhibitors. I have updated the data and produced a tool for every GPE and SuperZoo since then…including GPE 2022.

The “update” is not just exhibitor lists but also to the product category offerings for every exhibitor. I reviewed every exhibitor profile on the show site, but I also visited over 700 websites and conducted separate internet searches to “validate” the product offerings. It is not 100% accurate, but it is close.

What does the SuperSearch do?… It searches for and produces a list of Exhibitors by product categories.

  • From the simplest – “give me a list that I can look at on my phone or tablet in either Booth # order or alphabetically”
  • To the most complex…”can do a simultaneous search for multiple specific product categories, allowing you to personally narrow down the initial results and see the “final” alphabetically or by booth number. The GPE Super Search Exhibitor Visit Planner does both…and more…and does it quickly! Take a look at the Quick Start Guide. You will see that it looks complex but is really quite simple.

GPE 2022 Super Search Exhibitor Visit Planner – Quick Start Guide

First: When you download the Excel file, Remember to Enable Editing & Macros!

The GPE Super Search Exhibitor visit planner is designed to make your time on the show floor more efficient and more productive. With the Super Search you can conduct up to 5 separate and distinct product category searches simultaneously with consolidated results produced in booth # order to facilitate your “journey”. There are detailed instructions for reference and to help you understand the nuances of the tool. However, it is really very simple so let’s get started. (Note: No changes in instructions from 2020) Here is the Dashboard where you set up your searches.

On the dashboard, the first things to note are the numerous category columns. There are 5 different floor sections, 11 different Exhibitor or Animal Types and 33 Dog and/or Cat Product categories. You can search exhibitors for any combination of these.

Let’s take a specific example running 3 simultaneous searches for several Dog/Cat categories:

  • Toys
  • Treats
  • Catnip & Litter (Must sell both)

Now referring to the Dashboard, let’s take it by the numbers:

  1. This column is where you activate each search. Type in a “Y” (Cells C3>C7 will auto-capitalize) This search “line” becomes active.(cell turns green) In our example we are running 3 searches so we have 3 “Ys”
  2. Now we enter a 1 in the correct column for each search line. Search Line 1: Toys; Search Line 2: Treats.
  3. In Search Line 3 we want exhibitors that sell both Catnip and Litter so we put a 1 in both of these columns.
  4. Now we just “click” the Execute Search Button. The searches are done simultaneously and the results combined into a single list in alphabetical order.
  5. If you would like to view the list in Booth # order, just click the Booth # Sort.
  6. You can switch the list back to an alpha view by clicking the Alpha Sort Button.
  7. To Clear all your search categories and start a new search, Click the Clear Criteria Button. Then click Execute (#4) again and you will be back to the full list

Note: Any Search Line with a Y and no 1’s in any column will always deliver the entire list regardless of what is selected in other lines. Change the Y back to an N in unused search lines. Now a sample of the results:

Company A – Has Toys Only; Company B has Dog Treats Only; Company C is on the list for Treats and also has Catnip, but no Litter. This is not unusual as Catnip is often a Treat; Company D has Treats & Toys. Company E has both Catnip and Litter and in fact, actually has it all!

Note: The Super Search highlights your search categories so you know “why you are there”. However, it also shows all categories that are available. Some might “pique” your interest while you are visiting the booth.

You can review the exhibitors alphabetically then put the list in Booth # order to make it easier to “work”. The Super Search also allows you to “cut down” the list during your review. (Pg 2; Point #11 – “U Pick ‘em” in Detailed Instructions) But First, I suggest that you “play” with the Super Search to get a “feel” for the tool, and then review the Detailed Instructions. With your “play” experience, the detailed instructions will become a “quick read” and a valuable reference. You will soon be “up to speed” on the full capabilities of Super Search. Good Luck and Good “Hunting” at GPE 2022!

Ready to Start Planning?

Use the links below to download the Super Search Tool (Be Sure to Enable Editing/Macros/Content if asked by your computer), the Quick Start Guide and the Detailed Instructions. Then GET STARTED!

NOW DOWNLOAD THE SEARCH TOOL

(For the Excel file to work on your computer, be sure to enable saving/macros/editing/content if asked.)

NOTE: The file has been updated to a FINAL version. Since 3-14 five new exhibitors were added and 1 moved, but none dropped out. The new exhibitors and other changes are highlighted in light green. The changes from 3/7 to 3/14 are still highlighted in pink and the changes from 2/28 to 3/7 are still highlighted in light blue. This is the FINAL version of the file.