2022 Pet Supplies Spending was $21.94B – Where did it come from…?

Next, we’ll turn our attention to Pets and Supplies. We’ll see definite differences from Pet Food as the spending in the Supplies segment is more discretionary. There are other factors too. Spending can be affected by the spending behavior in other segments as consumers often trade $ between segments. However, the biggest factor is price. Many categories have become commoditized so pricing changes can strongly impact Consumers’ buying behavior. In the 2nd half of 2016, deflation began, and Supplies started a 24 month spending lift, totaling $5B. Prices turned up in mid-2018 due to new tariffs and Supplies $ fell a record -$3B in 2019. In the 2020 pandemic, Supplies weren’t a necessity, so sales continued to drop, -$1.7B. In 2021, Pet Parents caught up with their children’s needs and Supplies spending exploded, +$8.65B. In 2022, the “binge buy” was not repeated and inflation was high. Spending fell -$1.86B, -7.8% to $21.94B.

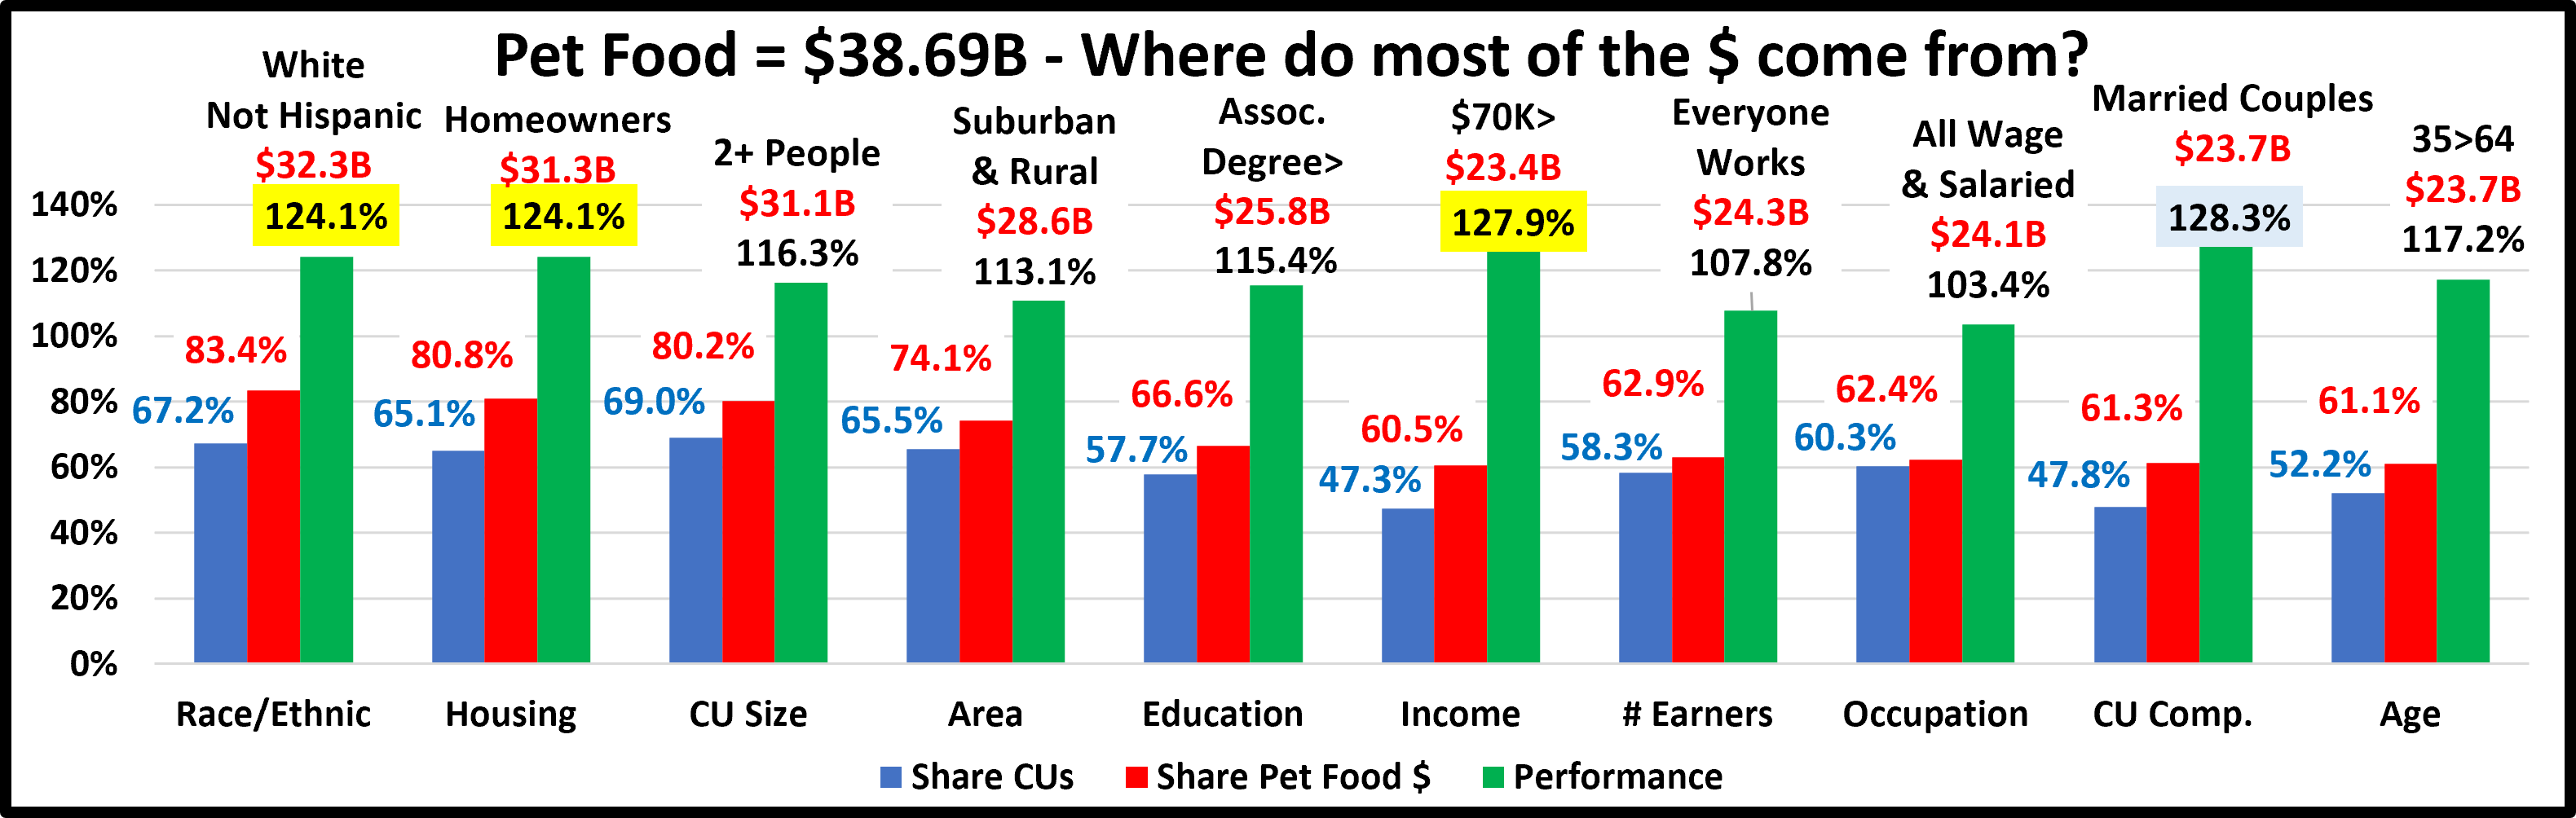
Let’s see which groups were most responsible for the bulk of Pet Supplies spending in 2022 and the $1.86B decrease. The first chart details the biggest pet supplies spenders for each of 10 demographic categories. It shows their share of CU’s, share of Supplies spending and their spending performance (Share of spending/share of CU’s). All groups are the same as Total Pet and are presented in the order that reflects their share of Total Pet Spending. This highlights the differences in importance. The biggest difference is in performance. There are 7 groups with performance of 120% or more, the most of any segment. That’s 2 more than Total Pet and 3 more than Pet Food. It’s also 1 more than 2021 which indicates that Supplies spending became less balanced in terms of the big groups in 2022.

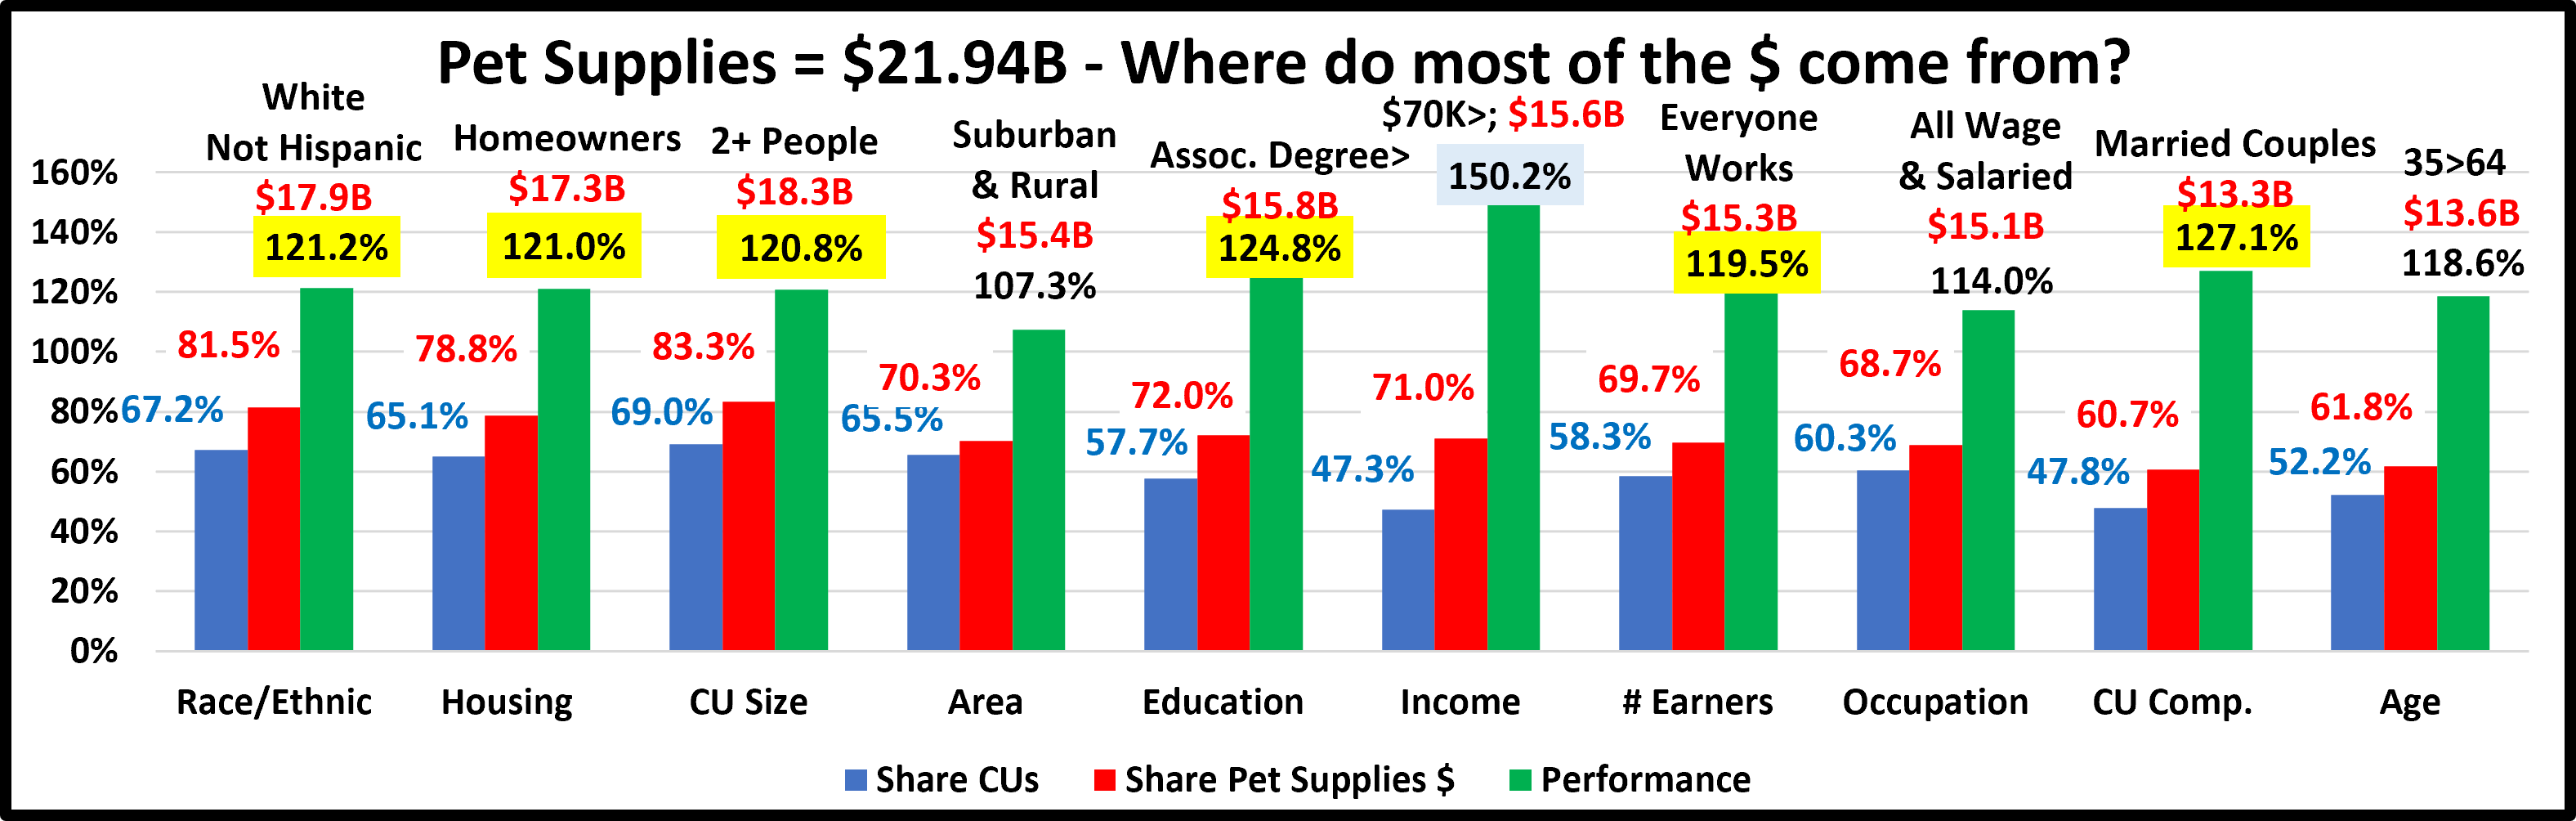
  1. Race/Ethnic – White, not Hispanic (81.5%) down from 83.2%. This large group accounts for the vast majority of spending in every segment. Their share decreased and their performance fell from 123.9% to 121.2% but they moved up from #6 to #4 in importance in Supplies Spending. Minority groups account for 32.8% of all CUs but spend only 18.5% of Supplies $. This is actually their biggest share of any segment. Only African Americans spent more.
  2. Housing – Homeowners (78.8%) up from 76.9%. Homeownership is a big factor in pet ownership and spending in all segments. Their performance grew to 121.0%, from 118.9% and they joined the 120% club at #5 in importance in Supplies spending, up from #8 in 2021. Only Homeowners w/o a Mortgage spent more on Supplies in 2022.
  3. # in CU – 2+ people (83.3%) the same as 2021 but their performance increased to 120.8%, from 119.8%. Only 3 People CUs spent more, +$0.44B and $4+ People CUs were down -$1.93B. Performance was aided by a drop in CUs.
  4. Area – Suburban & Rural (70.3%) down from 76.0%. A big drop in share and their performance fell to 107.3%, from 117.8% in 2021. They’re now last in importance. The big Suburbs, over 2500 population were the only segment to spend less, but the decrease was substantial, -$2.74B. The Areas <2500 Population spent a little more, +$0.08B (+1.5%) but Center City had double digit percentage growth, +$0.80B (+14.0%).
  5. Education – Associate’s Degree> (72.0%) down from 76.1%. This expanded group lost market share in 2022 and their performance level also decreased from 131.9% to 124.8%. Higher Education fell from 2nd to 3rd in importance. The drop was driven by College Grads, especially those with Advanced Degrees, who spent -$2.99B less. There was a clear spending divide. College Grads spent less while all groups with less than a BA/BS spent more. Those with an Associate’s Degree had the biggest lift, +$1.18 (+63.6%).
  6. Income Over $70K (71.0%) up from (68.4%) A gain in share but their performance fell from 152.7% to 150.2%. Income remains the most important factor in increased Pet Supplies Spending. Both <$70K and $70K> spent less. However, all segments from $70K to $199K spent more while $200K> spent -$2.68B less. The <$70K group had a different pattern. The $40>49K group spent $0.23B more but all other groups spent less. Of Note: All incomes over $70K perform above 100% with an average of 150.2%. Those <$70K have a performance average of 55.0%.
  7. # Earners – “Everyone Works” (69.7%) down from 73.4%. Their performance fell from 129.5% to 119.5% and they dropped from #4 to #7 in importance. In this group, all adults in the CU work. The # Earners is more important than in Food but it is income that truly matters. The results were mixed. No Earner, Singles, 1 Earner, 2+ CUs & 3+ Earners spent more. All other segments spent less, especially 2 Earners. Only CUs with 2+ earners perform above 100%.
  8. Occupation – All Wage & Salary Earners (68.7%) up from 60.9%. Their performance was 114.0%, up from 102.6%. Tech/Sls/Cler had the only decrease in the group. Mgrs/Prof were +$0.58B. The gain in share and performance was largely due to a small spending lift by the group, while All Other/Unemployed & Self-Employed spent a lot less.
  9. CU Composition – Married Couples (60.7%) down from 62.0%. Their performance also decreased from 130.8% to 127.1% but they moved up from 3rd to 2nd in importance. Married, Oldest Child 18> had the biggest lift, +$1.17B but Married, Couples Only & those with additional Adults also spent more. Married, Oldest Child 6>17 had the biggest drop , down -$2.77B but all other CU types with or without kids spent less..
  10. Age – 35>64 (61.8%) down from 66.3%. Their performance level decreased to 118.6% from 126.6%. They fell from #5 to #8 in importance and dropped out of the 120% club. Only the 25>44 yr-old groups spent less. All others spent more. A -$2.81B decrease in spending by 35>44 yr-olds caused the big drop in share and performance. The biggest lift was only +$0.42B by 45>54 yr-olds. Supplies spending skewed a little older in 2022.

Pet Supplies spending still skews more towards younger and higher income CUs than Food. However, the biggest difference may be in the spending disparity in segments within the big groups. Supplies now has 7 big groups with perfomance of at least 120%. That’s up from 6 in 2021 and 5 in 2020. It’s also almost twice as many as the 4 in Pet Food.

Now, we’ll look at 2022’s best and worst performing Pet Supplies spending segments in each category.

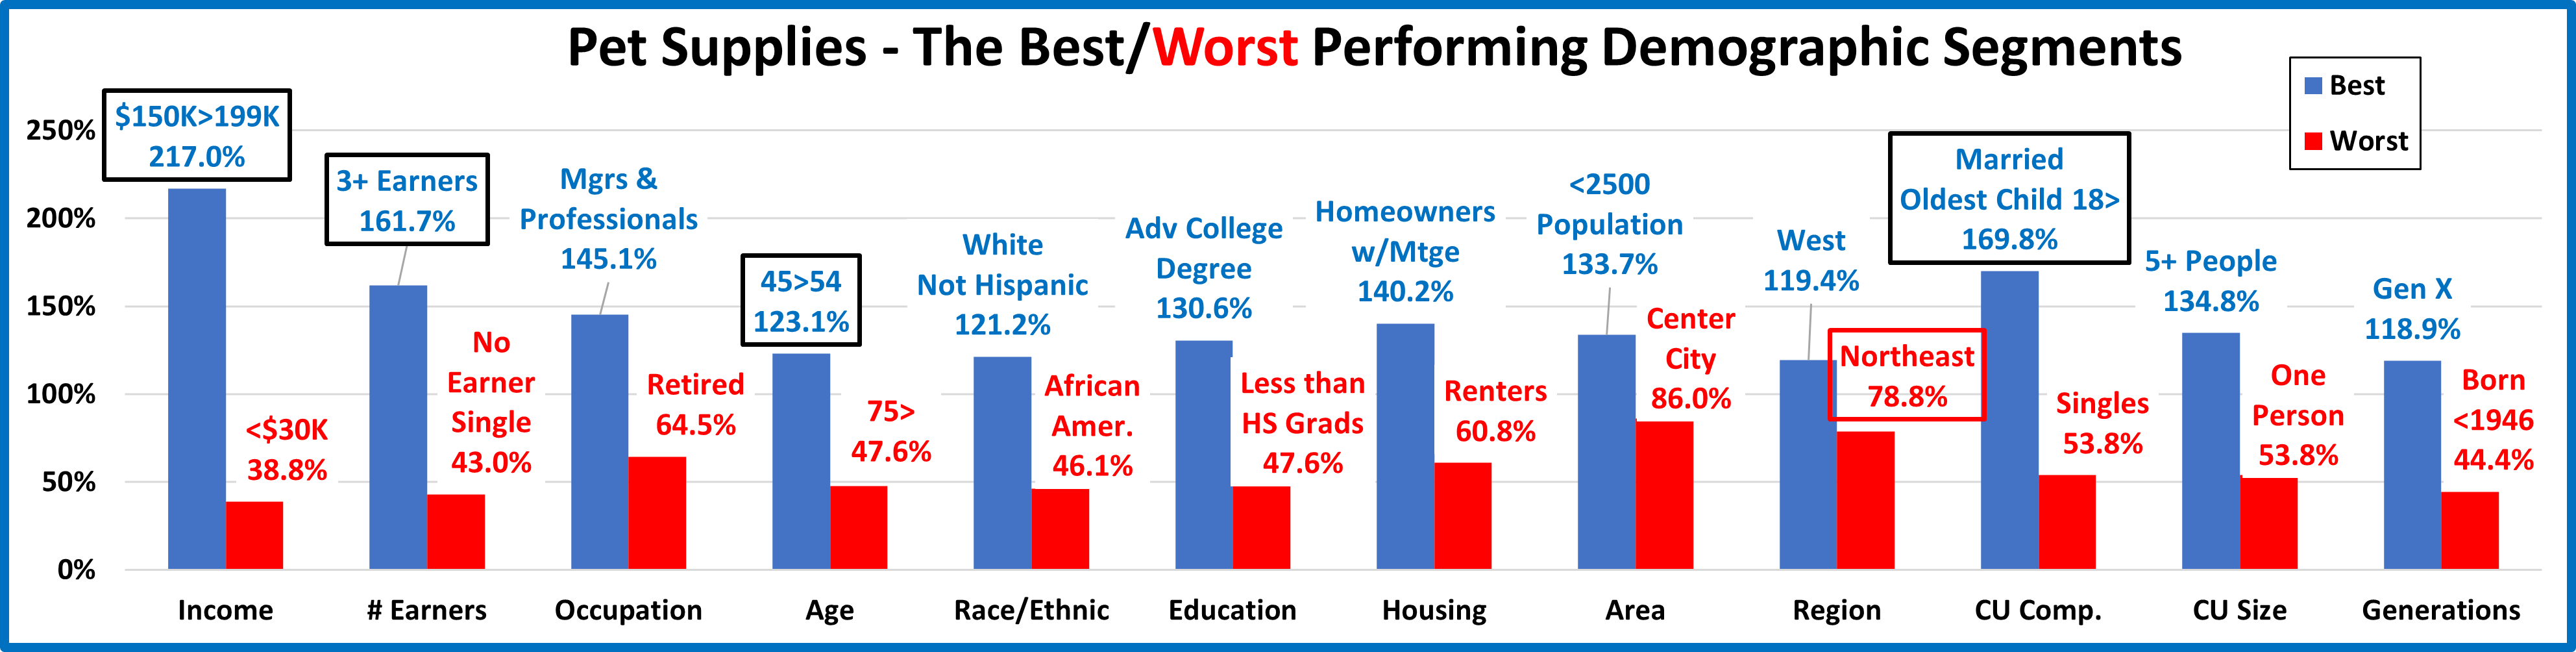
Almost all of the best and worst performers are those that we would expect. There are truly no big surprises. In Pet Supplies spending, there are only 5 that are different from 2021, up from 4 last year. That is 2 more than Veterinary & Services but 2 less than Total Pet and 6 less than Pet Food. They are also tied with Total Pet & Food for the most new winners – 4. In 2021, Supplies had the fewest changes and new winners. In terms of disparity, the difference between the avg winner & loser was 87.5%, down radically from 123.6% in 21. Changes from 2021 are “boxed”. We should note:

  • Income matters in Supplies spending.
    • Like Pet Food, the $150>199K> group was the top performer. They replaced $200K> which is the top performer in both Service Segments and Total Pet. BTW: It is #2 in Food & Supplies so $150K> is #1 for all.
  • # Earners – 3+ Earners replaced 2 Earners at the top but again, only these 2 groups performed above 100%.
  • Age – 45>54 traded places with 35>44 for the win. However, 35>44, 116.7% barely edged out 55>64, 116.1% for 2nd place. The 35>54 groups are mostly Gen Xers. Gen X “rules” in Supplies spending.
  • Region – The West won again but the Midwest also performed over 100%. The Northeast replaced the South at the bottom. However, the performance disparity from 1st to last fell from 103% in 2021 to 41% in 2022.
  • CU Composition – Married, Oldest Child 18> replaced Oldest Child 6>17 at the top while Singles held their spot at the bottom. In 2022, all Married CUs – with or without children, performed over 100%.

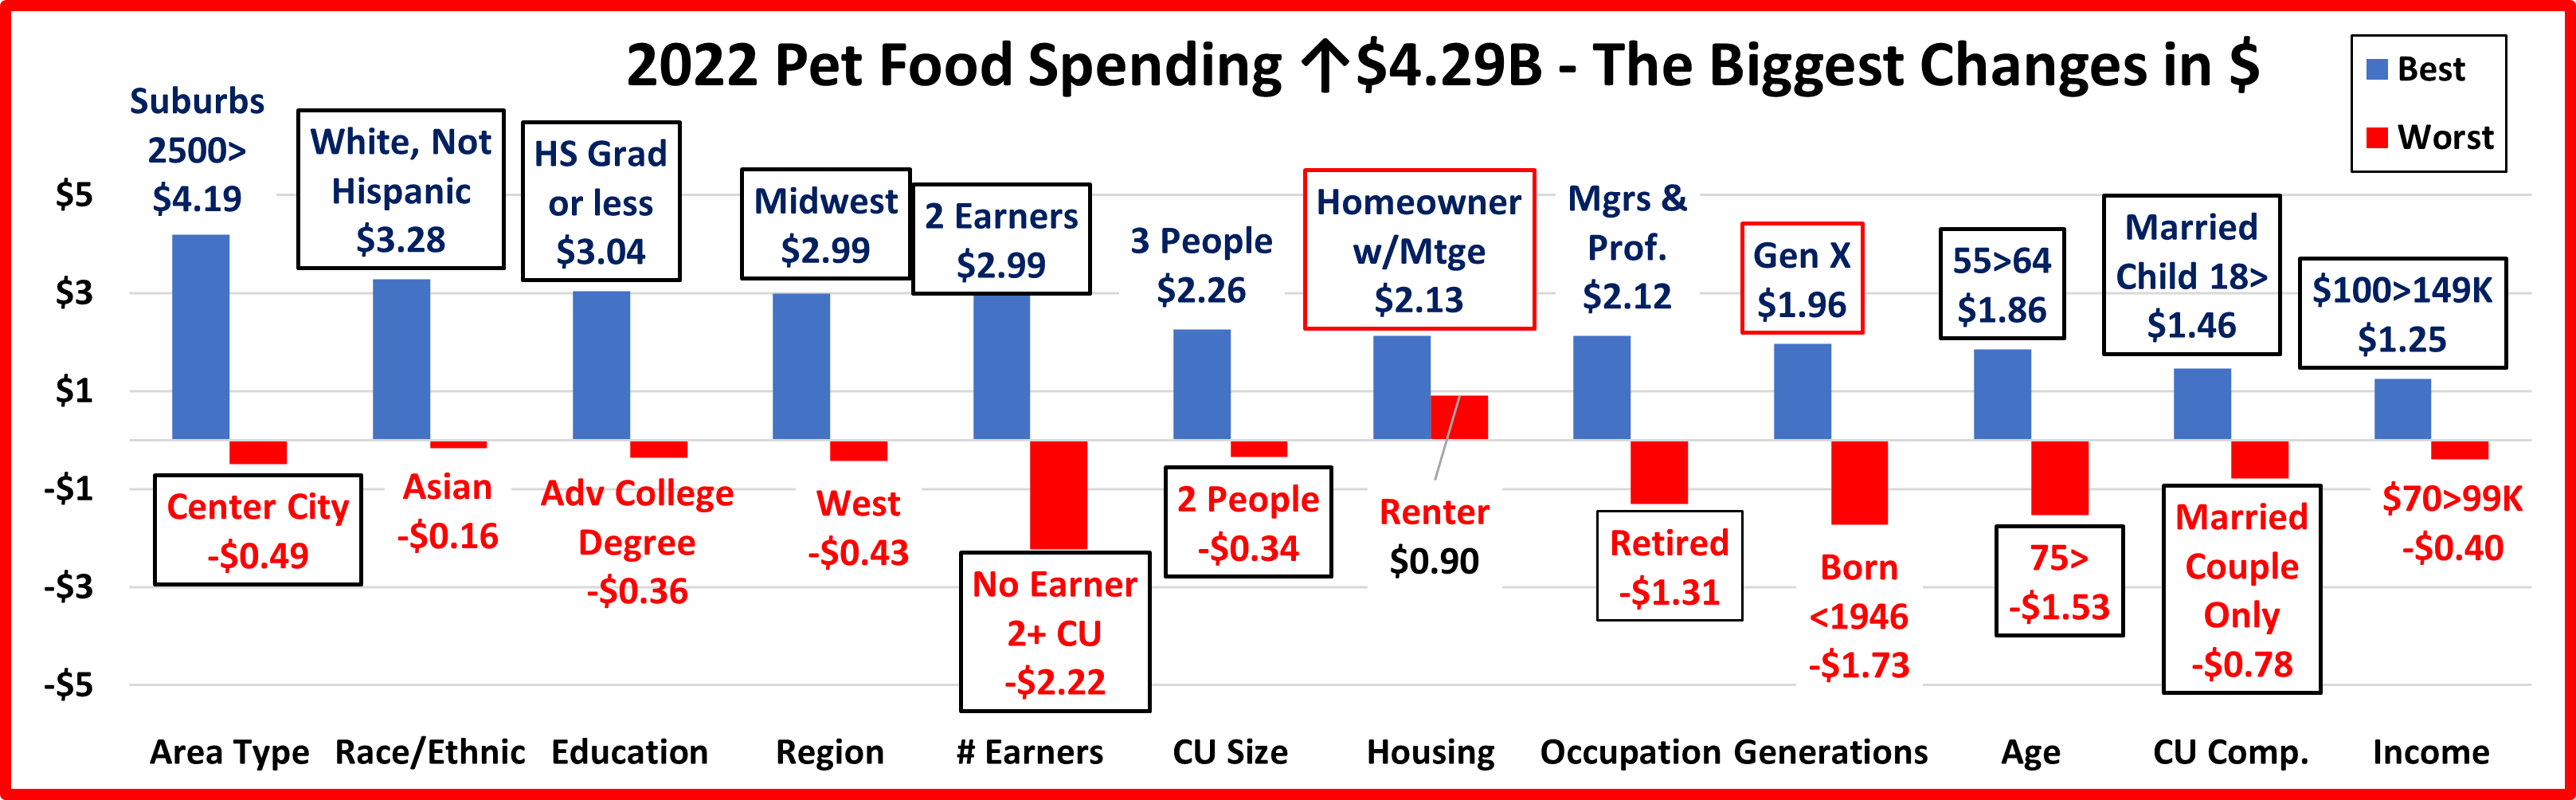
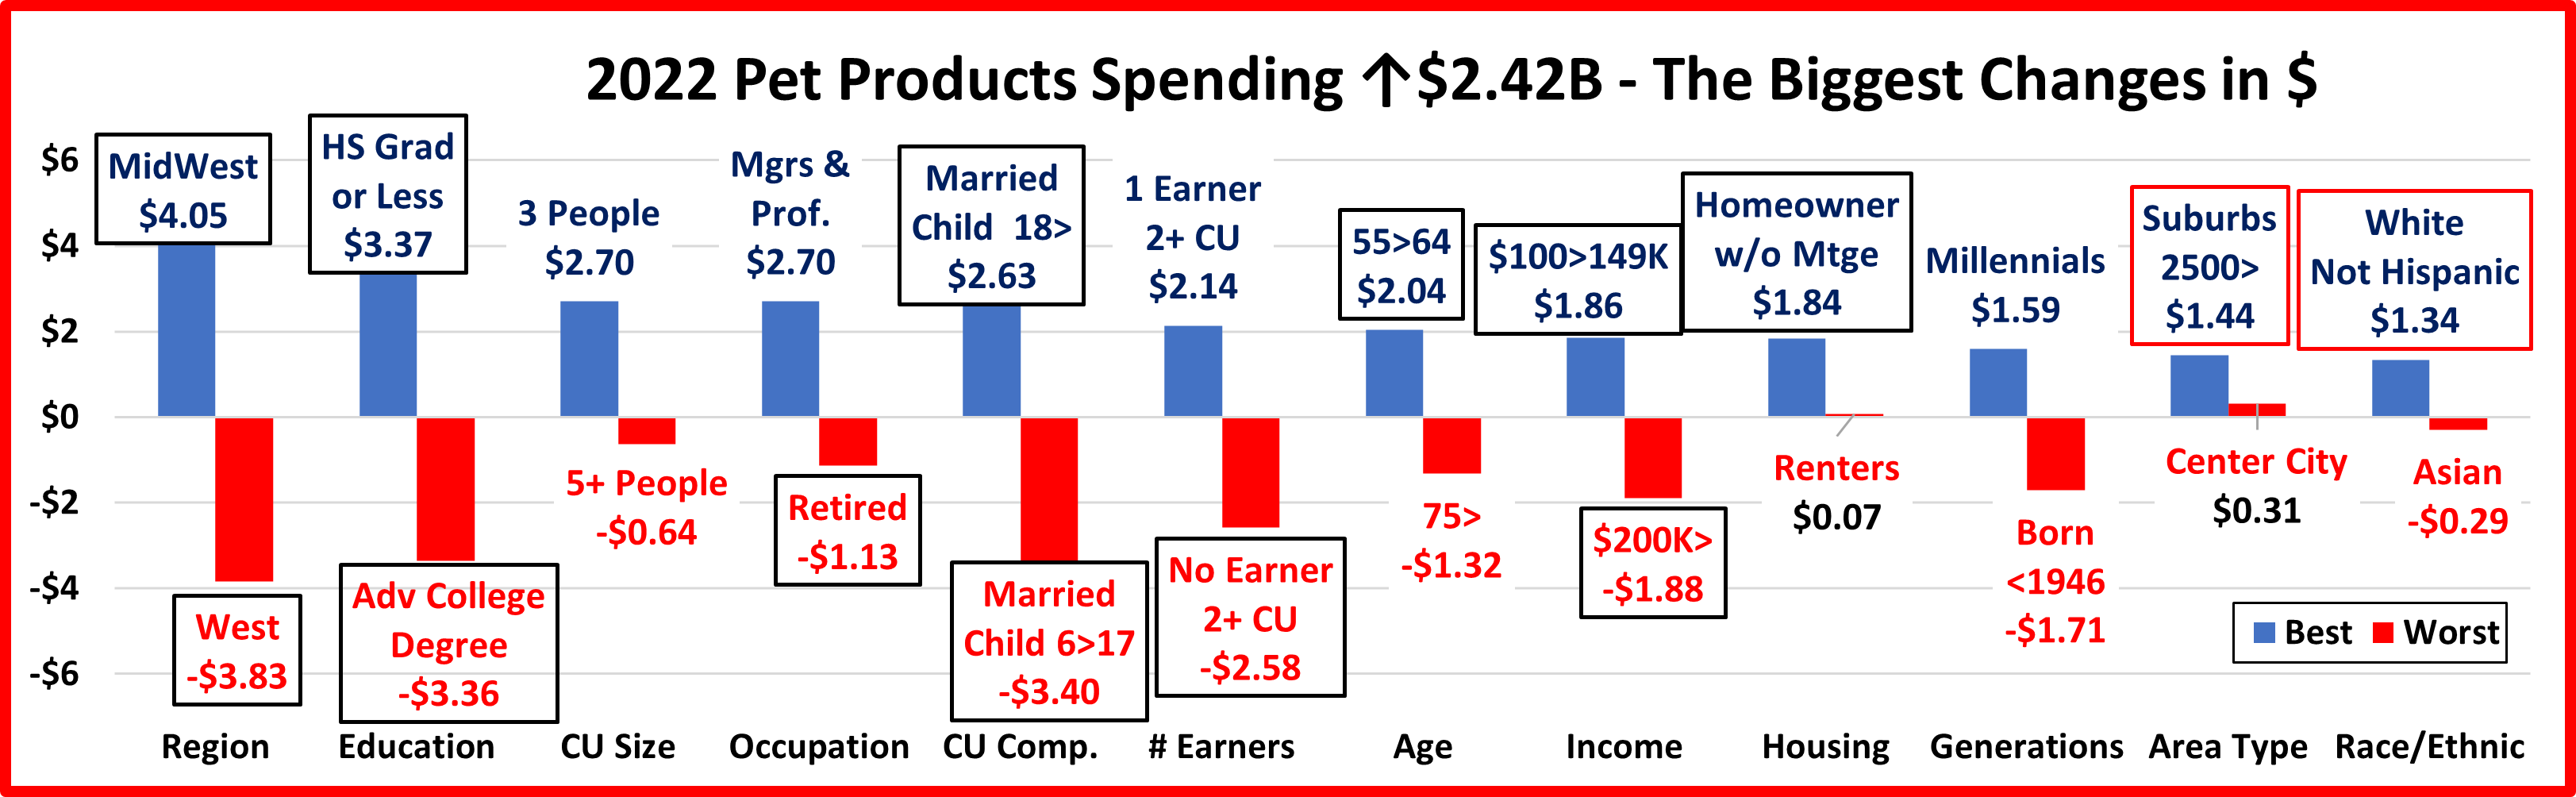
It’s time to “Show you the money”. Here are segments with the biggest $ changes in Pet Supplies Spending.

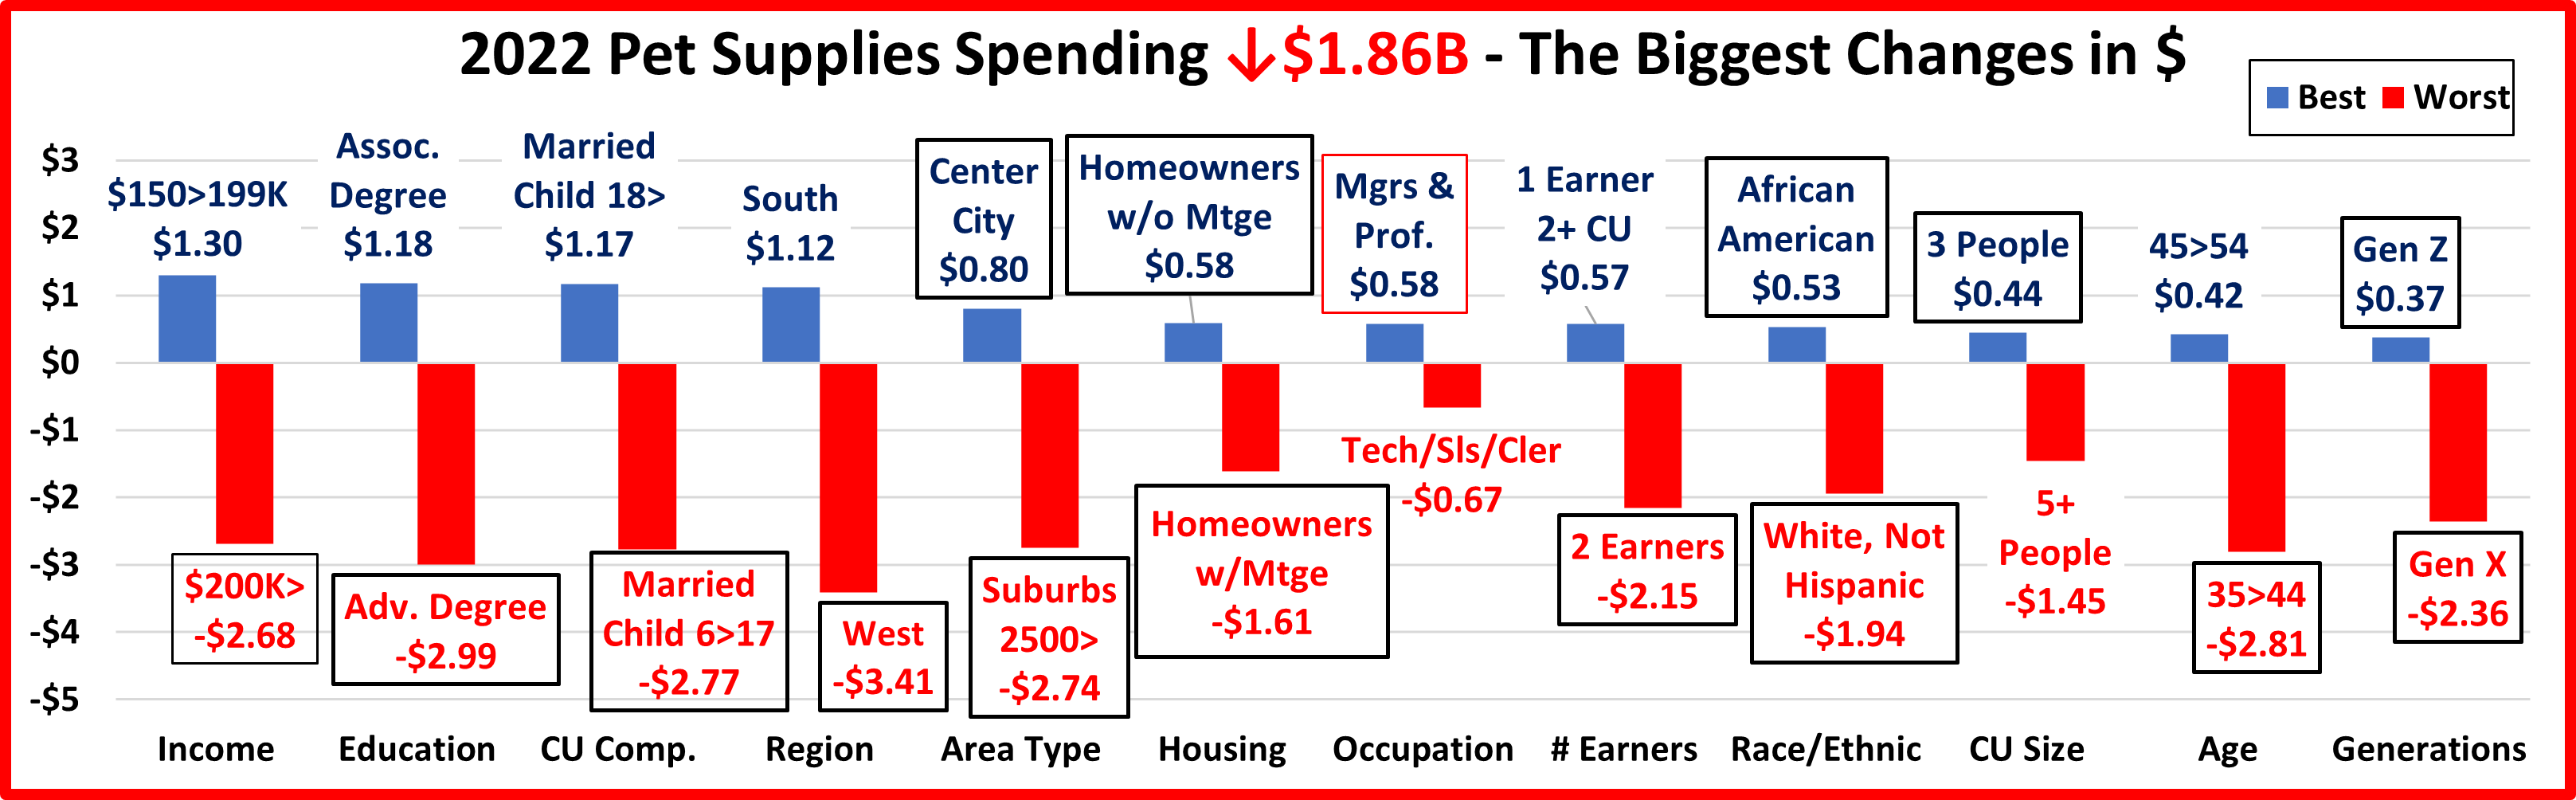
In 2019, Tarifflation caused a record $2.98B drop in Supplies spending. 2020 brought the pandemic and pet parents focused on “needs” so the more discretionary Supplies segment fell another $1.65B. In 2021 Pet Parents caught up on  the Supplies needed by their “children” and spent a record $8.65B more. In 2022, the binge wasn’t repeated so the $ fell -$1.86B. In the chart, there is only 1 repeat from 2021, but 5 segments switched from last to 1st  and 10 flipped from 1st to last. This is a lot of turmoil. In 2021, 97% of all segments spent more and in 9 categories all segments had increases. In 2022, despite the decrease, 52% of segments still spent more but no category was all positive. Here are the specifics:

  • Income – $150>199K took the top spot as $200K> flipped from 1st to last.
    • Winner – $150>199K – Pet Supplies Spending: $3.64B; Up +$1.30B (+55.3%)                            2021: $200K>
    • Loser – $200K> – Pet Supplies Spending: $3.73B; Down -$2.68B (-41.9%)                                   2021: $40>49K
    • Comment – In the <$70K group, only the 2021 loser, $40>49K spent more. In the $70K> group, only the 2021 winner, $200K> spent less, but it was substantial , -$2.68B. Overall, in both the under/over $70K and the under/over $100K groups both higher & lower spent less but the lower incomes had the biggest drop.
  • Education – Associate’s Degree won while Advanced College Degrees flipped to the bottom.
    • Winner – Associate’s Degree – Supp. Spending: $3.03B; Up +$1.18B (+63.6%)                         2021: Adv College Degree
    • Loser – Adv. College Degree – Supplies Spending: $5.84B; Down $2.99B (-33.9%)                   2021: <HS Grad
    • Comment – The spending pattern was the opposite of what we expected. All College Grads spent less while all groups without a BA/BS spent more. The lift did increase with education, but peaked at an Associate’s degree.
  • CU Composition – Married, Oldest Child 18> finished on top while Married, Oldest Child 6>17 flipped from 1st to last.
    • Winner – Married, Oldest Child 18> – Supplies: $2.92B; Up $1.17B (+66.9%)                        2021: Married, Oldest Child 6>17
    • Loser – Married, Oldest Child 6>17 – Supplies: $3.13B; Down $2.77B (-46.9%)                     2021: Married, + Other Adults
    • Comment – Only Married, Couples Only, Married, plus Adults, but no Kids & those with a Child 18> spent more. Overall, CUs w/kids spent -$1.79B less while those w/o kids were only down -$0.07B.
  • Region – The South won while the West flipped from 1st to last.
    • Winner – South – Pet Supplies Spending: $7.65B; Up $1.12B (+17.2%)                                  2021: West
    • Loser – West – Pet Supplies Spending: $5.98B; Down -$3.41B (-36.3%)                                 2021: Northeast
    • Comment – In 2018, all regions spent more on Supplies. In 2019 and 2020 all Regions spent less. In 2021, like 2018 all regions spent more. In 2022 spending was divided. The South and Midwest each spent over $1B more while the West (-$3.41B) and the Northeast (-$0.63B) spent less.
  • Area Type– Center City and the Big Suburbs swapped places.
    • Winner – Center City – Pet Supplies Spending: $6.51B; Up +$0.80B (+14.0%)                           2021: Suburbs 2500>
    • Loser – Suburbs 2500> – Pet Supplies Spending: $9.84B; Down -$2.74B (-21.8%)                    2021: Center City
    • Comment– The Areas <2500 Population also spent a little more, +$0.08B. The Big Suburbs had the only decrease.
  • Housing – The winner and loser flipped positions.
    • Winner – Homeowner w/o Mtge – Supplies: $5.58B; Up +$0.58B (+11.7%)                               2021: Homeowner w/Mtge
    • Loser – Homeowner w/Mtge – Supplies: $11.71B; Down -$1.61B (-12.1%)                                2021: Homeowner w/o Mtge
    • Comment – Last year’s loser “lost” with a 45.7% increase. In 2022 they won with a lift of 11.7%. Homeowners w/Mtges had the biggest decrease, but Renters also spent less, -$0.83B (-15.2%).
  • Occupation – Managers & Professionals held their spot at the top and Tech/Sls/Clerical finished last.
    • Winner – Managers & Professionals – Supplies Spending: $8.37B; Up +$0.58B (+7.4%)            2021: Mgrs/Profess.
    • Loser – Tech/Sls/Cler – Supplies Spending: $2.82B; Down -$0.67B (-19.2%)                                  2021: Operators & Laborers
    • Comment – Managers & Professionals are the only segment that spent more in 2020, 2021 & 2022. In 2021 all Occupations, including Retirees, spent more on Supplies. In 2022, only Tech/Sls/Clerical, Self-Employed and All Other/Unemployed spent less.
  • # Earners – 2 Earners flipped to the bottom.
    • Winner – 1 Earner, 2+ CU – Pet Supplies Spending: $4.02B; Up +$0.57B (+16.5%)                     2021: 2 Earners
    • Loser – 2 Earners – Pet Supplies Spending: $9.62B; Down -$2.15B (-18.3%)                                2021: No Earner, Single
    • Comment – Income is a big factor, but the # of Earners became a little less important in Supplies Spending. The ups & downs were mixed with no clear pattern. No Earner, Singles, 1 Earner, 2+ CU and 3+ Earners spent more. 1 Earner, Singles, No Earner, 2+ CU and 2 Earners spent less. The big drop by 2 Earners drove Supplies $ down.
  • Race/Ethnic – White, Not Hispanic and African Americans swapped positions at the top and bottom.
    • Winner – African Americans – Supplies: $1.28B; Up +$0.53B (+70.2%)                                    2021: White, Not Hispanic
    • Loser – White, Not Hispanic – Supplies: $17.87B; Down -$1.94B (-9.8%)                                 2021: African Americans
    • Comment – Although their share of Pet Supplies $ has fallen from 86.3% in 2018 to 81.1% in 2022, White, Not Hispanics still drive this discretionary segment. They have the highest % of pet ownership and the second highest income. The interaction of these two factors is very apparent in this category. Whites had the biggest gain in 21 so they had the most to lose in 22 and they did. Only African Americans spent more but their lift was +70.2%.
  • # in CU – 3 People flipped from last to 1st but 5+ People was a new loser.
    • Winner – 3 People – Pet Supplies Spending: $3.71B; Up $0.44B (+13.5%)                              2021: 2 People
    • Loser – 5+ People – Pet Supplies Spending: $2.94B; Down -$1.45B (-33.1%)                         2021: 3 People
    • Comment: 5+ CUs more than doubled their spending in 2021 so a big drop was not unexpected. 3 People CUs were the only size to spend more in 2022. In 2021 all segments increased spending.
  • Age – 45>54 is a new winner but 35>44 flipped from 1st to last.
    • Winner – 45>54 yrs – Pet Supplies Spending: $4.57B; Up $0.42B (+10.0%)                                2021: 35>44 yrs
    • Loser – 35>44 yrs – Pet Supplies Spending: $4.35B; Down -$2.81B (-39.2%)                              2021: <25 yrs
    • Comment: Only the groups from 25>44 spent less and the drop by 25>34 was only -$0.06B. The lifts were widespread but small. The <25 & 75> groups were both up over 20% but their combined lift was only +$0.32B.
  • Generation – Our 4th dual flip as the youngsters stepped up.
    • Winner – Gen Z – Supplies: $0.87B; Up $0.37B (+73.4%)                                   2021: Gen X
    • Loser – Gen X – Supplies: $7.04B; Down -$2.36B (-25.1%)                                 2021: Gen Z
    • Comment – Gen X had the biggest drop but they’re still up $1.5B from 2020. Gen Z had the biggest increase, especially in percentage. Millennials, Boomers and Born <1946 all spent more but the biggest lift was only +2.3%.

We’ve now seen the winners and losers in Pet Supplies Spending $ for 12 Demographic Categories. In 2020, only 18 of 96 segments spent more and 1 category had no segments with an increase. In 2021, 93 segments spent more, and 9 categories had no segments that spent less. In 2022, despite the -$1.86B decrease, 52% of demographic segments spent more but there was no category where all segments were positive. In performance, there were no surprise winners and 8 of 12 were the same as 2021. All of the winners were either 1st or 2nd in CU income in their category, which reflects the importance of income in Supplies spending. However, not every good performer can be “the” winner and some of these “hidden” segments should be recognized for their performance. They don’t win an award, but they deserve…

HONORABLE MENTION

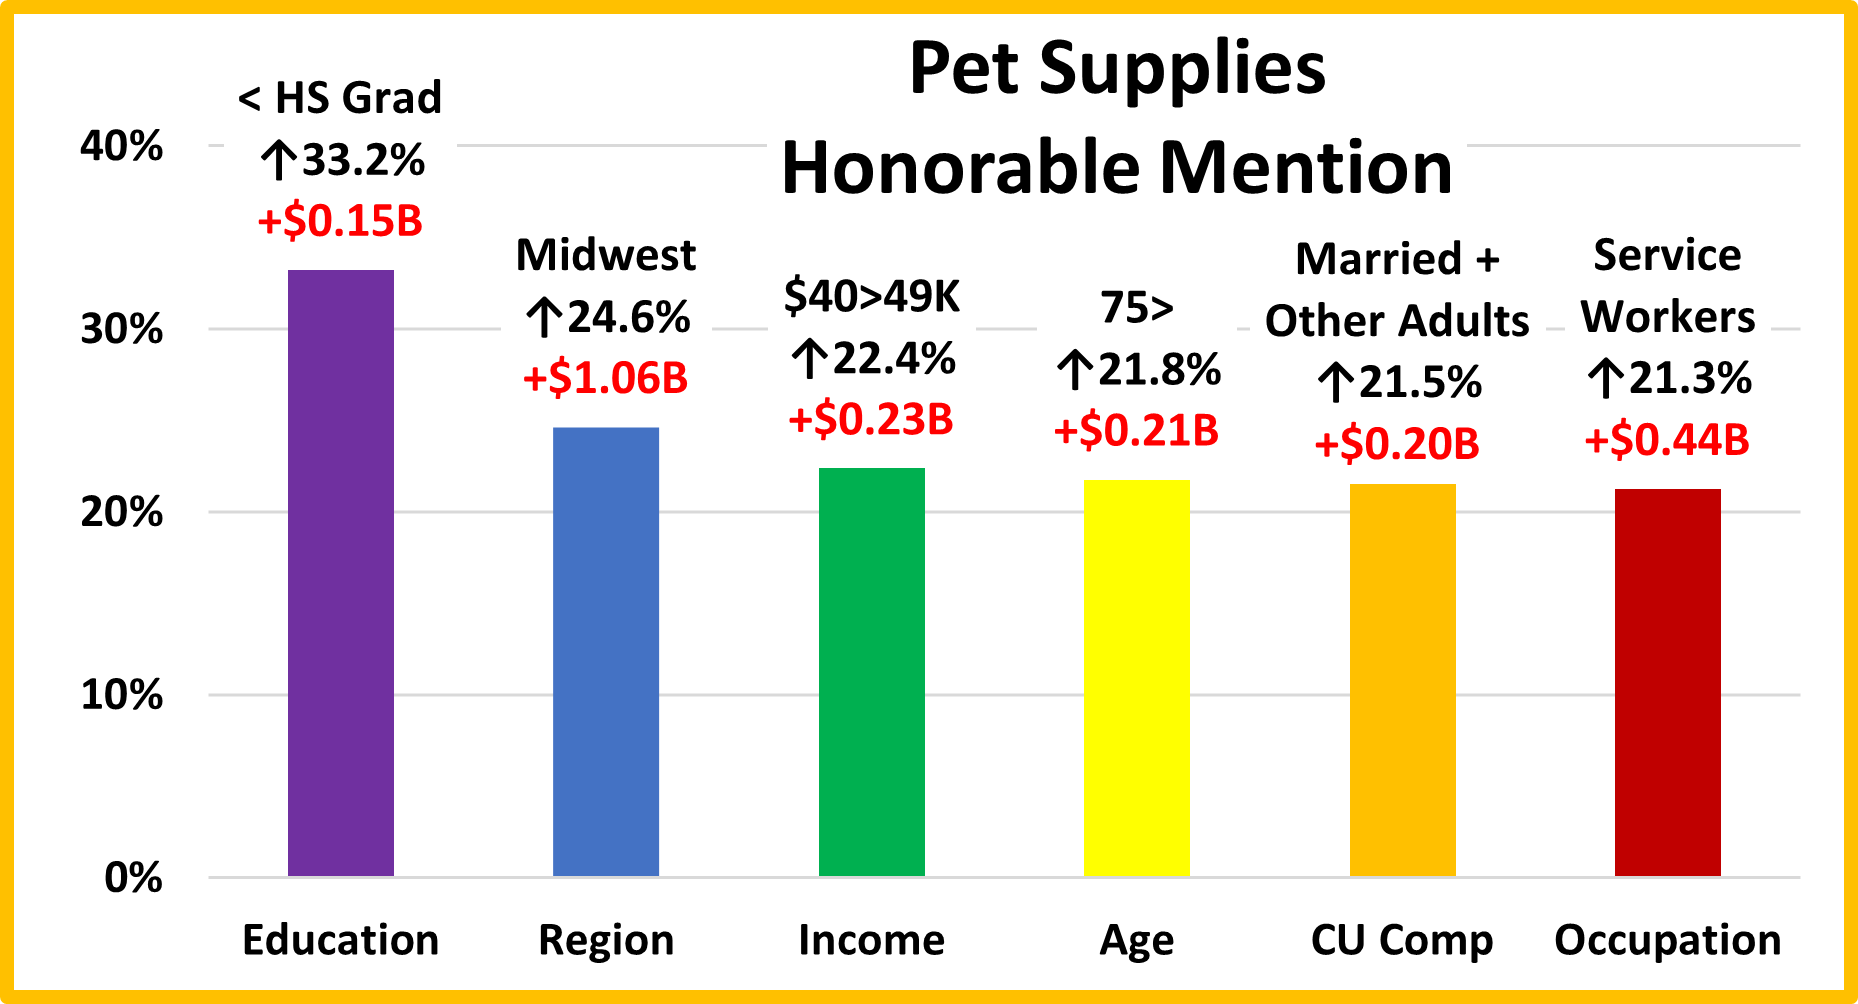
Supplies spending is driven by income, but Pet Parenting is widespread. This is very apparent in the strong performance of these segments. All have below average incomes, with many at or near the bottom in their category. Their spending increases were even more impressive because 2022 was a year of strong inflation. The <HS Grad group spends the least on Supplies in the Education category, The Midwest finished 2nd to the South but they only “lost” by $0.06B and had the biggest % increase. The $40>49K group had the only spending increase by any income segment below $70K. The 75> group obviously has many financial and health concerns, but they are still committed Pet Parents. This is very evident by their 21.8% spending increase in this more discretionary segment. Married couples with children spend the most on Supplies but kids are not “required”. Married couples with additional adults, but no kids had the 2nd biggest $ and %  increases of any CU composition segment. Finally, Service Workers. These low income “pink” collar workers make up 12.5% of all CUs. In 2022, they increased Supplies spending by 21.3% and had the 2nd highest lift in $ in Occupations.

Summary

While Pet Food spending has shown a definite pattern, Pet Supplies have been on a roller coaster ride since 2009. Many Supplies categories have become commoditized and react strongly to changes in the CPI. Prices go up and spending goes down…and vice versa. Supplies spending has also been reactive to big spending changes in Food. Consumers spend more to upgrade their Food, so they spend less on Supplies – trading dollars. We saw this in 2015. In 2016 the situation reversed. Consumers value shopped for Food and spent some of the “saved” money on Supplies.

That brought us to 2017. Both Supplies and Food prices deflated while the inflation rate in both of the Services segments dropped to lows not seen in recent years. Value was the “word” and it was available across the market. Perhaps the biggest impact was that the upgrade to super premium Food significantly penetrated the market. This could have negatively impacted Supplies Spending, but it didn’t. Supplies’ spending increased in 93% of all demographic segments.

2018 started out as expected with a $1B increase in Supplies and a small lift in Food. Then the government got involved. In July the FDA issued a warning on grain free dog food and spending dropped over $2B. New tariffs were implemented on Supplies and spending flattened out then turned down -$0.01B in the 2nd half. The full retail impact of Tariffs hit home in 2019 when Supplies spending fell -$2.98B, affecting 97% of all demographic segments.

In 2020 The pandemic caused consumers to focus on needs. That resulted in big spending lifts for Food and Veterinary and big drops in Supplies and Services. Some good news was that Supplies spending became more balanced. The performance gap between best and worst narrowed by 10.25%.

In 2021 the overall Retail Market had strongly recovered but with no replication of the 2020 buying binge, Pet Food $ dropped. In Supplies, the pent-up buying desires of Pet Parents were unleashed. They bought all the Supplies items that had been on purchase “hold” for the last 2 years. The result was the biggest spending increase in history.  In 2022, the buying binge was also not repeated, and inflation took off, so spending fell -$1.86B. However, 52% of 96 demographic segments still spent more on Supplies. The results were mixed. The biggest drop came from the $200K> group followed by the lowest income groups. Supplies spending is still strongly driven by income as the $70>199K segments spent more. This meant that <$70K generated 58% of the decrease. In terms of income, Supplies spending is still far from balanced.

Finally – The “Ultimate” Pet Supplies Spending CU consists of 5 people – a married couple, with an oldest child over 18. They are 45>54 yrs old. They are White, but not of Hispanic origin. They both work and at least one has an Advanced College Degree and is a Manager or Professional. Their oldest child also works, and their household income is $150>199K. They live in a small suburb in the Western U.S. and are still paying off the mortgage on their home.

Retail Channel Monthly $ Update – November Final & December Advance

In December, Commodities prices inflated 0.8% vs 2022, after deflating in November. Although down from its peak, cumulative inflation still impacts consumer spending. The sales increase rate is lower than the inflation rate in a number of channels, which indicates a drop in the amount of product sold. The recovery continues but there is still a long road ahead, so we’ll continue to track the retail market with data from 2 reports provided by the Census Bureau and factor in a targeted CPI from US BLS data.

The Census Bureau Reports are the Monthly and the Advance Retail Sales Reports. Both are derived from sales data gathered from retailers across the U.S. and are published monthly at the same time. The Advance Report has a smaller sample size so it can be published quickly – about 2 weeks after month end. The Monthly Final Report includes data from all respondents, so it takes longer to compile the data – about 6 weeks. Although the sample size for the Advance report is smaller, the results over the years have proven it to be statistically accurate with the final monthly reports. The biggest difference is that the full sample in the Final report allows us to “drill” a little deeper into the retail channels.

We will begin with the November Final Report and then go to the Advance Report for December. Our focus is comparing to last year but also 2021 & 2019. We’ll show both actual and the “real” change in $ as we factor inflation into the data.

Both reports include the following:

  • Total Retail, Restaurants, Auto, Gas Stations and Relevant Retail (removing Restaurants, Auto and Gas)
  • Individual Channel Data – This will be more detailed in the “Final” reports, and we’ll focus on Pet Relevant Channels.

The data will be presented in detailed charts to facilitate visual comparison between groups/channels. The charts will show 11 separate measurements. To save space they will be displayed in a stacked bar format for the channel charts.

  • Current Month change – % & $ vs previous month
  • Current Month change – % & $ vs same month in 2022 and 2021.
    • Current Month Real change for 2023 vs 2022 and vs 2021 – % factoring in inflation
  • Current Ytd change – % & $ for 2023 vs 2022, 2021 and 2019. (Ytd numbers for Dec are actually the Yr-End, (Y/E) totals)
    • Current Ytd Real change % for 2023 vs 2022, 2021 and 2019
  • Monthly & Ytd $ & CPIs for 22>23 and 21>23 which are targeted by channel will also be shown. (CPI Details are at the end of the report)

First, the November Final. Only Relevant & Total Retail were up from October. However, all but Gas Stations were up vs 22, 21 & 19. Considering inflation, the # of real drops vs 22 & 21 (4) were down from (6) in October. Gas Stations are still really down vs 2019 but for the 1st time in 2023, Relevant Retail is “really” up vs all years. ($ are Not Seasonally Adjusted)

The November Final is $1.3B less than the Advance report. Restaurants: -$0.3B; Auto: +$0.4B; Gas Stations: -$0.5B; Relevant Retail: -$0.7B. $ were only up vs October for Relevant & Total but actual sales for all but Gas Stations were positive in all measurements vs 22, 21 & 19. Gas prices fell but Gas Stations sales were down again monthly & YTD vs 22. There were 5 “real” sales drops, 4 from Gas Stations. The YTD real measurement vs 22 for Relevant Retail turned positive at +0.1%. They joined Total Retail and Restaurants with all positive measurements (actual & real) vs 22, 21 & 19. They are still the top “real” performer vs 2019 but only about half (48%) of their growth is real.

Now, let’s see how some Key Pet Relevant channels did in November in the Stacked Bar Graph Format

Overall– 7 were up from October. vs 22, 7 were up vs Nov and 8 YTD. 5 were “really” up monthly & Ytd. Vs 21, 7 were up monthly & 10 Ytd, but only 6 monthly & 3 Ytd were real. Vs 2019, Off/Gift/Souv & Disc Dept Strs were really down.

  • Building Material Stores – The pandemic focus on home has produced sales growth of 34.4% since 2019. Prices for the Bldg/Matl group have inflated 13.1% since 2021 which is having an impact. HomeCtr/Hdwe stores are only actually up Ytd vs 21 & 19, but Farm Stores are up for all. However, Farm Stores vs Nov 21 is the only real positive number vs 22 & 21 for either channel. Importantly, only 20.1% of their 19>23 lift was real. It was only this high because most of the lift came prior to the inflation wave. Avg 19>23 Growth: HomeCtr/Hdwe: 7.1%, Real: 1.1%; Farm: 11.4%, Real: 5.2%
  • Food & Drug – Both channels are truly essential. Except for the pandemic food binge buying, they tend to have smaller fluctuations in $. They have been very different in inflation and the situation has flipped as the Grocery rate is now 66% lower than Drug/Med products. Drug Stores are positive in all measurements and 73% of their growth since 2019 is real. All actual $ are up for Supermarkets but their 23 real sales are down vs 22 & 21 and just slightly positive vs 2019. Only 7% is real growth. Avg 19>23 Growth: Supermarkets: +6.3%, Real: +0.5%; Drug Stores: +6.0%, Real: +4.5%.
  • Sporting Goods Stores – They also benefited from the pandemic in that consumers turned to self-entertainment, especially sports & outdoor activities. Sales are up +10.4% from October. Their only other positives are YTD vs 22 & 19. Prices are still deflating, -1.8% and YTD, -0.3%, a big change from +5.6% in 21>22 and +6.5% in 20>21. The result is that 61% of their 42.6% lift since 2019 is real. Their Avg 19>23 Growth Rate is: +9.3%; Real: +5.9%.
  • Gen Mdse Stores – All were up vs October. Actual sales vs 22, 21 & 19 were up for Clubs & $ stores but Disc Dept Stores were only up YTD vs 21 & 19. In real sales Clubs were down Ytd vs 22 & 21. $/Value Stores were only down Ytd vs 21. Disc Dept Strs were down for all, even vs 2019, -2.0%. The other channels average 37% In real growth. Avg 19>23 Growth: SupCtr/Club: 6.2%, Real: 2.3%; $/Value Strs: +6.9%, Real: +2.9%; Disc. Dept. Strs: +2.1%, Real: -0.5%
  • Office, Gift & Souvenir Stores – Actual sales are down from October (-34.3%) and in all measurements but YTD vs 21 & 19. Their real sales numbers are all negative including -7.2% Ytd vs 2019. Their recovery started late, and their slow progress has stalled since June. Avg Growth Rate: +0.8%, Real: -1.8%
  • Internet/Mail Order – Sales are up 16.5% from October and set a new monthly record of $124B. All measurements are positive, but their Ytd growth is only 50% of their average since 2019. However, 79.5% of their 94.6% growth since 2019 is real. Avg Growth: +18.1%, Real: +15.0%. As expected, they are still by far the growth leaders since 2019.
  • A/O Miscellaneous – Pet Stores are 22>24% of total $. In May 2020 they began their recovery which reached a record level of $100B for the first time in 2021. In 2022 their sales dipped in January, July, Sept>Nov, rose in December, fell in Jan>Feb 23, grew Mar>May, fell in Jun>Aug, then rose in Sep>Nov. All measurements are positive. They are in 2nd place in the % increase vs 21 & 19, trailing only the internet, and 72% of their 54.2% growth since 2019 is real. Average 19>23 Growth: +11.4%, Real: +8.5%. .

Inflation remains an important factor in Retail. In actual $, 7 channels reported monthly sales increases vs 22 & 21. When you factor in inflation, the number with “real” growth drops to 5 vs 22 and 6 vs 2021. Inflation’s impact is slowing but it is still lowering sales increases. The November lift vs 2022 was still 20% below Jan/Feb. The impact is also visible in specific retail channels. The commodities CPI inflated in December. Let’s look for any impact on Retail $ales.

In November, sales vs last month were down in Auto, Restaurants, Gas Stations & 4 small channels. December was better as only Gas stations & 2 small channels had a sales decrease from November. A Nov>Dec lift in Total Retail has happened every year since 1992. The average increase was 15.4% so the 8.3% lift in 2023 was about half of the average. All actual $ measurements are again positive vs 22, 21 & 19 for all big groups but Gas Stations, but the lifts vs 2022 are slightly smaller than in November. Inflation is still a big factor. The national CPI rose from 3.1% to 3.4% and the all commodities rate, which is the best pricing measure for Retail, rose from -0.05% to 0.8%. There is some significant “real” good news. The big groups have 20 “real” sales measurements vs 22 & 21. In December, again only 4 were negative and 3 of those came from Gas Stations. Relevant Retail’s real monthly sales vs 22 have now been positive for 6 straight months, but the best news is that Relevant Retail is positive in all measurements for the 2nd consecutive month.

Overall – Inflation Reality – For Total Retail, prices inflated, but all real sales are again positive. For Restaurants, inflation remains high, +5.2% but they are still really positive vs 22 & 21. Gas prices are deflating but that group is in turmoil. Auto prices are down Y/E vs 22 but up 9.9% Y/E vs 21 which pushed their real sales down. Inflation is 0.5% for Relevant Retail and all of their monthly & Y/E real sales are positive for the 2nd straight month. They continue to make slow progress.

Total Retail – Since June 20, every month but April 23 has set a monthly sales record. In 2023 Sales have been on a roller coaster. Up in Jul>Aug, down in Sept, then up in Oct>Dec to new record highs of $771.4B & $8.333T. Prices inflated 0.8% and sales growth is still low. Sales are up 4.0% monthly vs last year & 3.2% Y/E but the Y/E is only 41% of their avg 19>23 growth. All real sales are positive again but only 34% of the 19>23 growth is real. Inflation in Total Retail has radically slowed vs 2022 but we still see its cumulative impact. Growth: 22>23: 3.2%; Avg 19>23: +7.8%, Real: +2.9%.

Restaurants – They were hit hard by the pandemic and didn’t begin recovery until March 2021. However, they have had strong growth since then, setting an all-time monthly record of $91B in December and exceeding $1T in 2022 for the 1st time. They have the biggest increases vs 22, 21 & 19 and all real sales are positive. Inflation slowed to 5.2% from 5.3% last month but is still +13.8% vs 21 and +22.6% vs 19. 36.1% of their 40.7% growth since 19 is real but they remain 2nd in performance behind Relevant Rtl. Recovery started late but inflation started early. Growth: 22>23: 11.3%; Avg 19>23: +8.9%, Real: +3.5%. They just account for 13.0% of Total Retail $, but their performance improves the overall retail numbers.

Auto (Motor Vehicle & Parts Dealers) – They actively worked to overcome the stay-at-home attitude with great deals and a lot of advertising. They finished 2020 up 1% vs 2019 and hit a record $1.48T in 2021 but much of it was due to skyrocketing inflation. In 22 sales got on a rollercoaster. Inflation started to drop mid-year, but it caused 4 down months in actual sales which are the only reported sales negatives by any big group in 21>22. This is bad but their Y/E real 2022 sales numbers were much worse, down -8.2% vs 2021 and -8.9% vs 2019. 2023 was a true rollercoaster but the $ grew in December pushing them to a new record, $1.595T. Only Y/E real $ vs 21 are down. Prices vs 22 are -0.9% monthly and -1.5% Y/E. Only 5% of their 19>23 growth is real. Growth: 22>23: 4.2%; Avg 19>23: +6.6%, Real: +0.4%.

Gas Stations – Gas Stations were also hit hard. If you stay home, you drive less and need less gas. They started recovery in March 2021 and inflation began. Sales got on a rollercoaster in 2022 but reached a record $583B. Inflation started to slow in August and prices slightly deflated in Dec & Feb, strongly dropped in Mar>Jul to -20.2%. In August they turned up to -3.7%. In Sep they were +2.7% but then began deflating and are -2.3% in Dec. Pricing is a big factor in the actual sales drops vs 22 and only real sales vs Dec 21 are positive.  Growth: 22>23:  -11.5%; Avg 19>23: +6.4%, Real: -1.2%. The numbers show the cumulative impact of inflation and demonstrate how strong deflation can be both a positive and a negative.

Relevant Retail – Less Auto, Gas and Restaurants – They account for 60+% of Total Retail $ in a variety of channels, so they took many different paths through the pandemic. However, their only down month was April 2020, and they led the way in Total Retail’s recovery. Sales got on a roller coaster in 2022 but all months in 2022 set new records with December reaching a new all-time high, $481B, and an annual record of $4.81T. In 2023, sales continued on the roller coaster. A December lift set a new monthly record of $494.7B and annual record of $4.997T so actual sales are again up vs 22, 21 & 19. However, the big news is that all real sales vs 22, 21 & 19 are positive for a second consecutive month. 48% of their 36.9% 19>23 growth is real – #1 in performance. Growth: 22>23: 3.5%; Avg 19>23: +8.2%, Real: +4.1%. This is where America shops. Another month and now a full year of all positive sales vs 22, 21 & 19 is a great news.

Inflation is still low, but the cumulative impact is still there. Sales increases are still small, but the fact that 94% of all Non-Gas Station real sales numbers vs 22 & 21 are still positive is a good sign. Restaurants are still doing well, and Auto is improving. Inflation/Deflation has caused turmoil in Gas Stations’ sales. The biggest positive is from Relevant Retail. All sales measurements are positive again. This means that consumers not only spent more $ monthly in Nov, Dec & Annually in 2023 vs 22, 21 & 19, they also bought more product. The turnaround continues to gain ground.

Here’s a more detailed look at December by Key Channels in the Stacked Bar Graph Format

  • Relevant Retail: Growth: 22>23: 3.5%; Avg 19>23: +8.2%, Real: +4.1%. 9 were up from Nov. Vs 22: 8 were up monthly & Y/E, Real: 7 monthly, 6 Y/E. Vs 21: 8 monthly & Y/E, Real: 7 Monthly, 5 Y/E. Vs 19: Furnishing & Dept Strs had the only negatives.
  • All Dept Stores – This group was struggling before the pandemic hit them hard. They began recovery in March 2020. Their Actual $ are up 35.2% from November but down for all comparisons vs 22, 21 & even 19. Their real sales are also down in all measurements. Growth: 22>23: -2.7%; Avg 19>23: -0.4%, Real: -2.9%.
  • Club/SuprCtr/$ – They fueled a big part of the overall recovery because they focus on value which has broad consumer appeal. $ales are up from November and in all other measurements, both actual and real. However, only 35% of their 27.7% 19>23 lift is real – the impact of inflation. Growth: 22>23: 3.6%; Avg 19>23: +6.3%, Real: +2.4%.
  • Grocery- These stores depend on frequent purchases, so except for the binge buying in 2020, their changes are usually less radical. $ are up from November and in all measurements vs 22, 21 & 19. However, inflation hit them hard. Real $ are down for all but Y/E vs 2019 and only 6.5% of the growth since 2019 is real. Growth: 22>23: 2.5%; Avg 19>23: +6.3%, Real: +0.5%.
  • Health/Drug Stores – Many stores in this group are essential, but consumers visit far less frequently than Grocery stores. Sales are up from November and positive in all other measurements but real vs December 21. Inflation has been relatively low so 73% of their 26.2% growth from 2019 is real. Growth: 22>23: 8.5%; Avg 19>23: +6.0%, Real: +4.4%.
  • Clothing and Accessories – Clothes initially mattered less when you stayed home. That changed in March 21 with strong growth through 2022. Actual $ales are up 41.5% from November and in all comparisons vs 22, 21 & 19. Real sales are down Y/E vs 22 & 21, but 65% of their 19>23 growth is real. Growth: 22>23: 1.6%; Avg 19>23: +3.9%, Real:+2.6%
  • Home Furnishings – In mid-2020 consumers’ focus turned to their homes and furniture became a priority. Prices are now deflating but they were high in 2022. Sales are down from November and negative in all other measurements but actual Y/E 2023 vs 2019. Their real sales are even down -4.4% vs 2019. Growth: 22>23: -5.4%; Avg 19>23: +2.6%, Real: -1.1%.
  • Electronic & Appliances – This channel has many problems. Sales fell in Apr>May of 2020 and didn’t reach 2019 levels until March 2021. $ales are up 16% from November and are now only down Y/E vs 21. Consistent deflation has caused real sales to be positive in all measurements. Growth: 22>23: 0.6%; Avg 19>23: +0.5%, Real: +2.8%.
  • Building Material, Farm & Garden & Hardware –They truly benefited from the consumers’ focus on home. In 2022 the lift slowed as inflation grew to double digits. Inflation has slowed to 0.9%. Sales are down from November, and they are only positive Y/E vs 21 & 19. They have the highest Y/E 22>23 Inflation rate of any channel so real sales are negative in all but Y/E vs 2019. Also, just 20% of their 19>23 sales growth is real. Growth: 22>23: -3.0%; Avg 19>23: +7.6%, Real: +1.7%.
  • Sporting Goods, Hobby and Book Stores – Consumers turned their attention to recreation and Sporting Goods stores sales took off. Book & Hobby Stores recovered more slowly. Actual $ales are up 31.9% from November and positive for all measurements. Real sales are only down Y/E vs 21. Prices deflated again and their inflation rate has been lower than most groups so 67.8% of their 29.8% growth since 2019 is real. Growth: 22>23: 0.4%; Avg 19>23 +6.7%, Real: +4.7%.
  • All Miscellaneous Stores – Pet Stores have been a key part of the strong and growing recovery of this group. They finished 2020 at +0.9% but sales took off in March 21 and have continued to grow. Sales are up vs November and positive in all other measurements – actual & real. They are 2nd to NonStore in increases vs 21 & 19. 66% of their 40.4% 19>23 growth and 46% of their 16.0% 21>23 growth is real. Growth: 22>23: 3.2%; Avg 19>23: +8.9%, Real: 6.1%.
  • NonStore Retailers – 90% of their volume comes from Internet/Mail Order/TV. The pandemic accelerated online spending. They ended 2020 +21.4%. The growth continued in 2021 as sales exceeded $100B for the 1st time and they broke the $1 Trillion barrier. Their growth slowed significantly in 2022 and now 2023. $ales are up from November and in all other measurements. 77.8% of their 83.0% growth since 2019 is real. Growth: 22>23: 8.0%; Avg 19>23: +16.3%, Real: +13.3%.

Note: Almost without exception, online sales by brick ‘n mortar retailers are recorded with their regular store sales.

Recap – The Retail recovery from the pandemic was largely driven by Relevant Retail and by the end of 2021 it had become very widespread. In 2022, there was a new challenge, the worst inflation in 40 years. Overall, inflation has slowed considerably from its peak in June 2022, which has helped the Retail Situation. Sales were up from November for Total & Relevant Retail & most channels. Inflation is slowing in many channels and even deflating in a few. However, some channels like Gas Stations, Grocery and Bldg Material stores still have high cumulative inflation rates so they are still struggling. Only a few channels are doing well. The new problem is that the sales increase rate vs 2022 for many channels has slowed. The evidence for this is now in. Only Restaurants, Health/Drug & Electronic/Appliances had a 22>23 change above their 19>23 average lift. Most of the other channels had an increase that was less than half of their 19>23 average. Some great news is that Relevant Retail has been positive in all measurement for 2 straight months. However, 5 of 11 channels were really down Y/E vs 22. The turnaround is a little more widespread, but 2023 was a mixed bag of pluses and minuses. We are making progress but still have a long way to go for a full recovery.

Finally, here are the details and updated inflation rates for the CPIs used to calculate the impact of inflation on retail groups and channels. This includes special aggregate CPIs created with the instruction and guidance of personnel from the US BLS. I also researched data from the last Economic Census to review the share of sales by product category for the various channels to help in selecting what expenditures to include in specific aggregates. Of course, none of these specially created aggregates are 100% accurate but they are much closer than the overall CPI or available aggregates. The data also includes the CPI changes from 2021 to 2023 to show cumulative inflation.

Monthly 22>23 CPI changes of 0.2% or more are highlighted. (Green = lower; Pink = higher)

I’m sure that this list raises some questions. Here are some answers to some of the more obvious ones.

  1. Why is the group for Non-store different from the Internet?
    1. Non-store is not all internet. It also includes Fuel Oil Dealers, the non-motor fuel Energy Commodity.
  2. Why is there no Food at home included in Non-store or Internet?
    1. Online Grocery purchasing is becoming popular but almost all is from companies whose major business is brick ‘n mortar. These online sales are recorded under their primary channel.
  3. 6 Channels have the same CPI aggregate but represent a variety of business types.
    1. They also have a wide range of product types. Rather than try to build aggregates of a multitude of small expenditure categories, it seemed better to eliminate the biggest, influential groups that they don’t sell. This method is not perfect, but it is certainly closer than any existing aggregate.
  4. Why are Grocery and Supermarkets only tied to the Grocery CPI?
    1. According to the Economic Census, 76% of their sales comes from Grocery products. Grocery Products are the driver. The balance of their sales comes from a collection of a multitude of categories.
  5. What about Drug/Health Stores only being tied to Medical Commodities.
    1. An answer similar to the one for Grocery/Supermarkets. However, in this case Medical Commodities account for over 80% of these stores’ total sales.
  6. Why do SuperCtrs/Clubs and $ Stores have the same CPI?
    1. While the Big Stores sell much more fresh groceries, Groceries account for ¼ of $ Store sales. Both Channels generally offer most of the same product categories, but the actual product mix is different.

Petflation 2023 – December Update: Turns up to +5.1% vs 2022

Inflation turned up in December. The monthly Consumer Price Index peaked back in June 2022 at 9.1% then began to slow until turning up in Jul/Aug 2023. Prices fell in Oct>Dec, but in December the CPI actually increased to +3.4% from +3.1% due to a big monthly price drop back in 2022. However, Grocery inflation continues to slow. After 12 straight months of double-digit YOY monthly increases, grocery inflation is now down to +1.3%, 10 consecutive months below 10%. As we have learned, even minor price changes can affect consumer pet spending, especially in the discretionary pet segments, so we will continue to publish monthly reports to track petflation as it evolves in the market.

Petflation was +4.1% in December 2021 while the overall CPI was +7.0%. The gap narrowed as Petflation accelerated and reached 96.7% of the national rate in June 2022. National inflation has slowed considerably since June 2022, but Petflation generally increased until June 2023. It passed the National CPI in July 2022 and at 5.1% in December, it is still 50.0% above the national rate of 3.4%. We will look deeper into the numbers. This and future reports will include:

  • A rolling 24 month tracking of the CPI for all pet segments and the national CPI. The base number will be pre-pandemic December 2019 in this and future reports, which will facilitate comparisons.
  • Monthly comparisons of 23 vs 22 which will include Pet Segments and relevant Human spending categories. Plus
    1. CPI change from the previous month.
    2. Inflation changes for recent years (21>22, 20>21, 19>20, 18>19)
    3. Total Inflation for the current month in 2023 vs 2019 and now vs 2021 to see the full inflation surge.
    4. Average annual Year Over Year inflation rate from 2019 to 2023
  • YTD comparisons (Since it is December, this month’s YTD numbers are the annual inflation rate.)
    1. YTD numbers for the monthly comparisons #2>4 above

In our first graph we will track the monthly change in prices for the 24 months from December 21 to December 23. We will use December 2019 as a base number so we can track the progress from pre-pandemic times through an eventual recovery. This chart is designed to give you a visual image of the flow of pricing. You can see the similarities and differences in segment patterns and compare them to the overall U.S. CPI. The current year-end numbers from 12 and 24 months earlier are included. We also included and highlighted (pink) the cumulative price peak for each segment. In December, Pet prices were up from last month as lifts in Vet & Supplies overcame drops in Food & Services.

In December 21, the CPI was +8.5% and Pet prices were +4.5%. Like the CPI, prices in the Services segments generally inflated after mid-2020, while Product inflation stayed low until late 21. In 22 Petflation took off. Food prices grew consistently but the other segments had mixed patterns until July 22, when all increased. In Aug>Oct Petflation took off. In Nov>Dec, Services & Food prices continued to grow while Vet & Supplies prices stabilized. In Jan>Apr 23, prices grew every month except for 1 dip by Supplies. In May Products prices grew while Services slowed. In June/July this was reversed. In August all but Services fell. In Sep/Oct this was reversed. In November, all but Food & Veterinary Services fell. In December Supplies & Vet  drove Total Pet prices up 0.7% vs Nov. Petflation has been above the CPI since Nov 22.

  • U.S. CPI – The inflation rate was below 2% through 2020. It turned up in January 21 and continued to grow until flattening out in Jul>Dec 22. Prices turned up Jan>Sep, then dipped in Oct>Dec, but 35% of the 19.4% increase in the 48 months since December 2019 happened in the 6 months from January>June 2022 – 12.5% of the time.
  • Pet Food – Prices were at or below Dec 2019 levels from Apr 20>Sep 21. They turned up and grew, peaking in May 23. In Jun>Aug they dipped, grew Sep>Nov, then fell in Dec. 93% of the 23% increase has occurred since 22.
  • Pet Supplies – Supplies prices were high in Dec 19 due to added tariffs. They then had a “deflated” roller coaster ride until mid-2021 when they returned to Dec 19 prices and essentially stayed there until 2022. They turned up in January and hit an all-time high, beating the 2009 record. They plateaued Feb>May, grew in June, flattened in July, then turned up in Aug>Oct setting a new record. Prices stabilized in Nov>Dec but turned up in Jan>Feb 23. They fell in March, peaked at a new record in May, then continued their rollercoaster ride with a big lift in Dec.
  • Pet Services– Normally inflation is 2+%. Perhaps due to closures, prices increased at a lower rate in 2020. In 2021 consumer demand increased but there were fewer outlets. Inflation grew in 2021 with the biggest lift in Jan>Apr. Inflation was stronger in 2022 but it got on a rollercoaster in Mar>June. It turned up again July 22>Mar 23 but the increase slowed to +0.1% in April. Prices fell -0.3% in May, turned up again, peaking in Aug, then fell in Sep>Dec.
  • Veterinary – Inflation has been consistent. Prices turned up in March 20 and grew through 21. A surge began in December 21 which put them above the overall CPI. In May 22 prices fell and stabilized in June causing them to fall below the National CPI. However, prices rose again and despite some dips they have stayed above the CPI since July 22. In 23 prices grew Jan>May, stabilized Jun>Jul, fell in Aug, then grew Sep>Dec to a new high.
  • Total Pet – Petflation is a sum of the segments. In Dec 21 the price surge began. In Mar>Jun 22 the segments had ups & downs, but Petflation grew again from Jul>Nov. It slowed in Dec, grew Jan>May 23 (peak), fell Jun>Aug, grew in Sep/Oct, then fell in Nov. In December big increases in Veterinary & Supplies overcame drops in Food & Services to push Total Pet close to their May 23 high point. Petflation has been above the CPI since Nov 22

Next, we’ll turn our attention to the Year Over Year inflation rate change for December and compare it to last month, last year and to previous years. We will also show total inflation from 21>23 & 19>23. Petflation rose to 5.1%, up from 4.3% in November and it is now 1.5 times the National rate. The chart will allow you to compare the inflation rates of 22>23 to 21>22 and other years but also see how much of the total inflation since 2019 came from the current pricing surge. Again, we’ve included some human categories to put the pet numbers into perspective.

Overall, Prices were -0.1% from November but were +3.4% vs December 22, up from +3.1% last month. Grocery inflation is down again, to +1.3% from +1.7%. 4 of 9 categories had a price decrease from last month – National CPI, Groceries, Pet Food & Services. There were 5 in November. That’s 4 months in a row for Pet Services. The national YOY monthly CPI rate of 3.4% is up but still only 52% of the 21>22 rate. The 22>23 inflation rate is below 21>22 for all categories but Veterinary Services. In our 2021>2023 measurement you also can see that over 65% of the cumulative inflation since 2019 occurred in only 4 segments – Total Pet, Pet Food, Pet Supplies and Veterinary – All Pet. We should also note that the segments with the lowest percentages are Haircuts, Pet Services and Medical Services. Service Segments have generally had higher inflation rates so there was a smaller pricing lift in the recent surge. Services expenditures account for 62.3% of the National CPI so they are very influential. We also see that Pet Products have a very different pattern. The 21>23 inflation surge provided 94.1% of their overall inflation since 2019. This happened because Pet Products prices in 2021 were just starting to recover from a deflationary period.

  • U.S. CPI– Prices are -0.1% from November. The YOY increase is 3.4%, up from 3.1%. It peaked at +9.1% back in June 2022. The targeted inflation rate is <2% so we are still 55% higher than the target. After 12 straight declines, we had 2 lifts, a stable month, 2 consecutive drops, now another lift – not good news! The current rate is 48% below 21>22 but the 21>23 rate is still 10.0%. That is 51.5% of the total inflation since 2019, but down from 54% last month.
  • Pet Food– Prices are -0.1% vs November and +5.1% vs December 22, down from 5.6%. However, they are still 3.9 times the Food at Home inflation rate. The YOY increase of 5.1% is being measured against a time when prices were 17.0% above the 2019 level, but that increase is still 1.5 times the pre-pandemic 3.4% increase from 2018 to 2019. The 2021>2023 inflation surge has generated 91.3% of the total 23.0% inflation since 2019.
  • Food at Home – Prices are down -0.5% from November. The monthly YOY increase is 1.3%, down from 1.7% in November and radically lower than Jul>Sep 2022 when it exceeded 13%. The 25.3% Inflation for this category since 2019 is 30% more than the national CPI and remains 2nd to Veterinary. 52% of the inflation since 2019 occurred from 2021>2023. The pattern mirrors the national CPI, but we should note that Grocery prices began inflating in 2020>2021 then the rate accelerated. It appears that the pandemic supply chain issues in Food which contributed to higher prices started early and foreshadowed problems in other categories and the overall CPI tsunami.
  • Pets & Supplies– Prices were up 1.4% from November and 0.1% vs December 2022. They still have the lowest increase since 2019. As we noted, prices were deflated for much of 2021. As a result, the 2021>2023 inflation surge accounted for 100% of the total price increase since 2019. They reached an all-time high in October 2022 then prices deflated. 3 months of increases pushed them to a new record high in February. Prices fell in March, bounced back in Apr/May to a new record high, fell in Jun>Aug, grew in Sep>Oct, fell in November, then grew sharply in December.
  • Veterinary Services – Prices are up +1.2% from They are +10.8% from 2022, again the highest rate in the Pet Industry. Plus, they are still the leader in the increase since 2019 with 30.9% compared to Food at home at 25.3%. For Veterinary Services, relatively high annual inflation is the norm. However, the rate has increased during the current surge, especially in 23, so 66% of the 4 years’ worth of inflation occurred in the 2 years from 2021>2023.
  • Medical Services – Prices turned sharply up at the start of the pandemic but then inflation slowed and fell to a low rate in 20>21. Prices grew 0.4% from November but are -0.5% vs 22. Prices have now deflated for 8 straight months. Medical Services are not a big part of the current surge as only 39% of the 2019>23 increase happened from 21>23.
  • Pet Services – Inflation slowed in 2020 but began to grow in 2021. December 23 prices were -0.02% from November and only +0.7% vs 22, which is down 50% from 1.4% last month but an amazing 91% drop from 8.0% in March. Now, only 49% of their total 17.0% inflation since 2019 occurred from 21>23.
  • Haircuts/Other Personal Services – Prices are up 0.1% from November and +3.7% from 2022, 2 consecutive months below 4.0%. Inflation has been rather consistent as 48% of the inflation from 19>23 happened from 21>23.
  • Total Pet– Petflation is 53% lower than the 21>22 rate, but still 1.5 times the U.S. CPI. For December, +5.1% is the 4th highest rate since 1997 (2022: 10.9%; 2008: 9.7%; 2007: 5.5%). Vs November, prices grew in Vet & Supplies so Total Pet was +0.7%. An Nov>Dec price increase has happened in 6 of the last 7 years so it was no surprise. Veterinary & Food are still the Petflation leaders, but all segments have an influence. Pet Food has been immune to inflation as Pet Parents are used to paying a lot, but inflation can reduce purchase frequency in the other segments.

Now, let’s look at the YTD (Year-End) numbers

The inflation rate for 22>23 is the highest for 2 of 9 categories – both Pet, Pet Food and Veterinary Services. The 22>23 rates for Haircuts, Pet Services & Total Pet are slightly below 21>22. However, the CPI, Pet Supplies, Medical Services and Food at Home are significantly down from 21>22. The average annual national inflation in the 4 years since 2019  is 4.5%. Only 2 of the categories are below that rate – Medical Services (2.7%) and Pet Supplies (2.4%). It comes as no surprise that Veterinary Services has the highest average rate (6.5%), but 3 other categories are over 5% – Groceries (5.8%), Pet Food (5.3%) & Total Pet (5.1%).

The U.S. government began tracking inflation in 1913. It is a critically important measurement as pricing affects spending behavior and the economy. Moreover, the income of over 90 million people is directly tied to changes in the CPI. The US BLS began tracking pricing in Total Pet and the individual industry segments in 1997. Here are some 2023 comments.

  • U.S. CPI – The 2023 rate was 4.1%, the 3rd highest since 1997, trailing 2022 (8.0%) and 2021 (4.7%). It was down 49% from 21>22 and 8.9% less than the average increase from 2019>2023, but it’s 60% more than the average annual increase from 2018>2021. 65% of the 19.2% inflation since 2019 occurred from 2021>23. Inflation is a big problem that started recently.
  • Pet Food – Inflation was 10.6% in 2023, edging out 2022 (10.2%) for 2nd place. The top spot still belongs to 2008 (11.1%). Pet Food has the highest 22>23 & 21>23 rates on the chart. Deflation in the 1st half of 2021 kept YTD prices low then prices surged in 2022. 96% of the inflation since 2019 occurred from 2021>23.
  • Food at Home – The 2023 inflation rate slowed from 11.2% in 2022 to 5.0% but was the 3rd highest rate since 1997 (also trailing 2008’s 6.4%) It also still beat the U.S. CPI by 22%. You can see the impact of supply chain issues on the Grocery category as 67% of the inflation since 2019 occurred from 2021>23.
  • Pets & Pet Supplies – Prices increased in December, but the 2023 inflation rate was only 2.6%, 6th highest since 1997. 1st place belongs to 2022 (7.7%). Supplies’ prices deflated significantly in both 2020 & 2021 which helped to create a very unique situation. Prices are up 10.1% from 2019 but 105% of this increase happened from 2021>23. Prices are up 10.6% from their 2021 “bottom”.
  • Veterinary Services – At 9.4%, 2023 beat 8.8% in 2022 and is now the highest inflation rate in history for Veterinary Services. On the chart they are #1 in inflation since 2019 but they have only the 2nd highest rate since 2021. At +6.5%, they have the highest average annual inflation rate since 2019. Inflation was high and consistent, around 4% from 2019>2021. It took off in 2022 & worsened in 2023. Strong Inflation is the norm in Veterinary Services.
  • Medical Services – Prices went up significantly at the beginning of the pandemic, but inflation slowed in 2021. In 2023 prices have generally been deflating and finished the year at -0.3%, the only deflation in any segment. It was also the only deflationary year since the US BLS began tracking this category in 1935.
  • Pet Services – The January 2023 increase of 8.4% set a new monthly record. Prices have dropped Sep>Dec and they finished the year at 5.7%, tied for 2nd place with 2008. 2022 is the winner at 6.3%. Their price surge started in 2021 when inflation jumped to 4.7% from 2.5% in 2019 & 2020. It appears to have ended in late 2023 but prices are still +20.6% vs 2019.
  • Haircuts & Personal Services – The services segments, essential & non-essential, were hit hardest by the pandemic. The industry responded by raising prices. The 4 highest inflation years since 1997 were 2022 (5.4%), 2021 (5.1%), 2023 (4.9%) and 2020 (4.4%). Consumers are paying 21% more than in 2019, which usually reduces the frequency.
  • Total Pet – The Nov>Dec price lift was normal, so it had little impact on the annual numbers. Petflation in 2023 was 8.0%, 2nd place all time to 8.9% in 2022. It only finished 2nd because the rate slowed significantly in the 2nd half of the year. In the 1st half it was 44% higher than the 2022 rate. There was a mixture of roller coaster patterns, but inflation slowed somewhat for all segments during the 2nd  half. However, all did end up with high annual inflation rates and Veterinary even set a new record. 2023 Petflation is about double the CPI. In 2021 it was 43% below the CPI.

Petflation is slowing, but it is still strong, with the 4th highest rate for December and the 2nd highest annual rate in history. It is also double the CPI. In 2021 it was only half of that rate. Even if it slows to 0%, you can’t ignore the fact that inflation is cumulative. Pet prices are 17.7% above 2021 and 22.2% higher than 2019. Those are big lifts. Since price/value is the biggest driver in consumer spending it is likely to affect the Pet Industry. The Services segment will be the least impacted as it is driven by high income CUs. Supplies and Veterinary will likely see a reduction in purchase frequency. Food is the most needed segment so the response will be complex. It could include a movement to online shopping, switching to private label or even downgrading the quality of food. We’ll see what happens.

2022 Pet Food Spending was $38.69B – Where did it come from…?

As we continue to drill ever deeper into the demographic Pet spending data from the US BLS, we have now reached the level of individual Industry segments. We will start with Pet Food, the largest and arguably most influential of all. We have previously noted the trendy nature of Pet Food Spending. In 2018 we broke a pattern which began in 1997 – 2 years up then spending goes flat or turns downward for a year. We expected a small increase in 2018 but what we got was a $2.27B decrease (-7.3%). This was due to the reaction to the unexpected FDA warning on grain free dog food. A pattern of 20+ years was broken by 1 statement. The grain free warning lost credibility and spending rebounded in 2019, +$2.35B (+7.1%). In 2020 the market was hit by an even bigger outside influence – the pandemic. The impact varied by segment. In Pet Food, it created a wave of panic buying out of fear of shortages, resulting in a $5.65B (18.1%) lift. The panic buying wasn’t repeated in 2021 resulting in a $2.44B (-6.6%) drop in spending. In 2022 spending returned to more “normal” behavior with a strong $4.29B, +12.5% increase to $38.69B, a new record high. Let’s take a closer look.

First, we’ll see which groups were most responsible for the bulk of Pet Food spending and the $4.29B increase. The first chart details the biggest pet food spenders for each of 10 demographic categories. It shows their share of CU’s, share of pet Food spending and their spending performance (Share of spending/share of CU’s). All are the same as Total Pet. The categories are presented in the order that reflects their share of Total Pet Spending. The big difference is that $70K> income has the smallest share of Food $. This difference is magnified in performance. Being Married is the most important factor in Food spending. In Total Pet and other segments, Income is the most important. Food spending is also a little more balanced than Total Pet Spending. This is evident by the fact that the Performance of only 4 groups exceeds 120%. In Total Pet and Pet Products there were 5. In 2022, Pet Food accounted for 63.8% of Pet Products $ and 37.7% of Total Pet. This is better than 59.1% and 34.4% in 2021 but still far below 70.8% of Pet Products and 44.0% of Total Pet in 2020 and even 65.0% and 39.5%  in pre-pandemic 2019. Spending is a little more balanced between industry segments.

  1. Race/Ethnic – White, not Hispanic (83.4%) down from 84.2%. This large group accounts for the vast majority of spending in every segment. They lost share and their performance decreased to 124.1% from 125.2%, but this category moved up from #4 to a tie for #3 in terms of importance in Pet Food Spending demographic characteristics. Hispanics, African Americans and Asians account for 32.8% of U.S. CU’s, but they spend only 16.6% of Pet Food $. Asians were the only minority to spend less on Food. Hispanics and African Americans spent $1.2B more.
  2. Housing – Homeowners (80.8%) – down from 81.0%. Homeownership is a huge factor in pet ownership and pet spending. In 2022, homeowners lost a little share and their performance fell from 125.1% to 124.1%. However, homeownership moved up from 5th to a tie for 3rd in importance. Renters were +13.8%. Homeowners were +12.1%
  3. # in CU – 2+ people (80.2%) – up from 79.1%. The share of market grew for 2+ CUs and is again back over 80% for Pet Food. Their performance also grew from 113.8% to 116.3% but their rank stayed at #6. Only 2 person CUs spent less, but 79% of the increase in Food $ came from a $2.3B lift from 3 people CUs and a $1.1B lift by 4 people CUs. Although Singles spent more, their increase was only 6.1%, less than half of the 14.1% for 2+ CUs. This drove the increase in share and performance. Singles are the only CU size performing below 100% – 63.7%.
  4. Area – Suburban + Rural (74.1%) up from 69.4%. Their performance grew from 107.6% to 113.1%. (still 8th) Only Center City spent less but 98% of the Food increase came from a $4.2B, +33.0% lift by Suburbs over 2500 population.
  5. Education – Assoc. Degree> (66.6%) – down from 71.5%. College Grads share fell below 60% due to a big lift by <College Grads. The group now includes Associate’s degrees. Performance fell from 123.9% to 115.4% (No longer in the 120+% Club) and higher education fell from 3rd to 7th in importance in increased Pet Food Spending.
  6. Income – Over $70K (60.5%) – down from 63.1%. Their performance also dropped from 140.9% to 127.9% and they fell from 1st to 2nd in importance. High income is still very important in Pet Food Spending but the bar was lowered slightly in 2022. The 50/50 $ divide fell from $92K in 2021 to $91K in 2022. The <$100K group was up $2.2B while $100K> was up $2.09B – pretty balanced. The only spending decrease came from $70>99K, -$0.4B. This caused the drop in share and performance. Pet ownership is common across all income levels but only groups with an income over $70K perform at 100+%.
  7. # Earners – “Everyone Works” (62.9%) – up from 57.6%. This was a huge increase from last year and their performance also increased from 101.7% to 107.8%. They moved up from 10th (last) to 9th in importance. No Earner, 2+ CUs spent $2.2B less while 2+ Earners CUs spent $4.5B more. This drove the lift in share & performance.
  8. Occupation – All Wage & Salaried Workers (62.4%) – up from 60.5% – Only Retirees spent less so this workers group’s performance also grew slightly from 102.0% to 103.4%. However, Occupation is now last in importance in Pet Food spending.
  9. CU Composition – Married Couples (61.3%) – down from 64.8%. They lost share and their performance fell from 136.8% to 128.3%, but they moved up to #1 in importance. Married, Couples Only and those with an oldest child 6>17 years old were the only segments that spent less so Married CUs had a smaller increase than Unmarried CUs.
  10. Age – 35>64 (61.1%) – up from 55.0%. This younger group replaced 45>74 yr-olds. Their performance grew from 105.0% to 117.2% and age moved up from #7 to #5 in importance. 45>64 is in both groups. The change happened because the 35>44 share is 18.6% while 65>74 is 17.2%. Only 25>34 and 75> spent less on Pet Food in 2022.

All of the big spenders for Pet Food are the same as Total Pet. Last year there was 1 special group and in 2020 there were 3. 2022 brought a return to a more normal spending pattern and spending became slightly more balanced. This is best illustrated by the fact that in 2022 the performance for only 4 groups exceeds 120% with the highest at 128.3%. In 2021 there were 5, with 3 over 130%. In 2020 there were 8 at 120+%, 5 of which had a performance level above 130%.

Now, we’ll look at 2022’s best and worst performing Pet Food spending segments in each category.

Almost all of the best and worst performers are the ones that we would expect. 2022 produced just 1 surprise – Married, Oldest Child <6 won in CU Composition. There are 4 different winners from 2021 and 7 different losers. This is much different from 2021, which had 10 new winners and 5 new losers. This reflects a more stable environment among the winners. Changes from 2021 are “boxed”. We should also note the performance gap between winner and loser narrowed in 9 categories. Overall, the average gap fell from 82.8% in 2021 to 73.5%. More evidence of increased spending balance. Here are some more performance specifics:

  • Income No changes. Although the gap narrowed from 141% to 112%, this is the only category with a gap over 100%.
  • # Earners – The highest income group moved to the top, but the gap narrowed from 90% to 71%.
  • Occupation – Mgrs/Prof. stayed on top, but Service Workers replaced Blue Collar & the gap widened – 45% to 54%
  • Age, Generation- The high income, 45>54 Gen Xers stayed on top. The oldest replaced the youngest on the bottom.
  • Race – The usual winner and loser. The gap narrowed from 103.2% to 93.9%.
  • Education – Higher education with its higher income mattered in Pet Food Spending but the gap was only 53.7%.
  • Housing – Owning a home is always important. The usual winner & loser returned. The gap narrowed by only 4.1%.
  • CU Comp., CU Size– Married, Oldest Child <6 was a surprise. Singles replaced Single Parents. 3 replaced 5+ CUs.
  • Region – Midwest flipped from Worst to Best and the South took their place at the bottom.
  • Area – The areas <2500 population stayed on top and Center City regained its usual position as the worst performer.

It’s time to “Show you the money”. Here are segments with the biggest $ changes in Pet Food Spending.

There are 2 repeats from 2021. 6 losers won last year and 7 of the winners were 2021 losers. 54% flipped from 1st to last or vice versa, down from 71% in 2021. Almost all of the winners are expected. The only Surprise winner was HS Grad or Less. The surprising losers were Adv. College Degree, 2 People and Married Couple Only. Spending grew 12.5% as 82% of 96 demographic segments spent more. Plus, all segments in the Housing category had increases. Here are the specifics:

  • Area Type – Center City, the 2021 surprise winner, had the only spending decrease, and flipped to last.
    • Winner – Suburbs 2500> – Pet Food Spending: $16.86B; Up $4.19B (+33.0%)          2021: Center City
    • Loser – Center City – Pet Food Spending: $10.05B; Down $0.49B (-4.7%)                  2021: Areas <2500
    • Comment – The Areas <2500 also spent a little more, +$0.59B (+5.3%).
  • Race/Ethnic – White, Not Hispanics flipped to the top and Asians replaced them at the bottom.
    • Winner – White, Not Hispanic – Pet Food Spending: $32.26B; Up $3.28B (+11.3%)            2021: Hispanic
    • Loser – Asian – Pet Food Spending: $0.84B; Down $0.16B (-15.9%)                                        2021: White, Not Hispanic
    • Comment – The U.S. is becoming more racially/ethnically diverse but White, Not Hispanics are by far the biggest spender in every Pet Segment. Asian Americans had the only decrease, but it was not surprising after growing 130% in 2021. Pet Food spending became more balanced. Both African Americans & Hispanics were up 20+%.
  • Education – Higher education fell in importance in Pet Food spending as HS Grads or Less flipped to the top.
    • Winner – HS Grads or less – Food Spending: $7.78B; Up $3.04B (+64.0%)                        2021: BA/BS Degree
    • Loser – Adv College Degree – Food Spending: $10.03B; Down $0.36B (-3.5%)                 2021: HS Grads or less
    • Comment – The $3.04B lift was almost equally divided between those with only a HS Diploma and those without. Those with an Associate’s Degree finished in 3rd place with a $1.14B, 36.5% increase. In fact, only those with an Advanced College Degree spent less on Pet Food in 2022. Note: In 2021 they were up $2.63B, +33.9%
  • Region – The Midwest flipped from last to 1st.
    • Winner – Midwest – Pet Food Spending: $9.58B; Up $2.99B (+45.5%)                           2021: South
    • Loser – West – Pet Food Spending: $8.56B; Down $0.43B (-4.7%)                                   2021: Midwest
    • Comment – In 2021, only the Midwest spent less. In 2022, it was only the West, but their decrease was only -4.7%.
  • # Earners – The winner and loser flipped putting both in a more normal position.
    • Winner –– 2 Earners – Pet Food Spending: $15.08B; Up $2.99B (+24.7%)                     2021: No Earner, 2+ CU
    • Loser – No Earner, 2+ CU – Pet Food Spending: $3.13B; Down $2.22B (-41.5%)          2021: 2 Earners
    • Comment – 1 Earner, Singles were the only other segment to spend less, and their drop was only -$0.01B (-0.3%). All other segments were up at least 17.5%. The number of earners is definitely less important than income.
  • # in CU – 2 People CUs flipped to the bottom.
    • Winner – 3 People – Pet Food Spending: $7.17B; Up $2.26B (+46.1%)                       2021: 2 People
    • Loser – 2 People – Pet Food Spending: $14.23B; Down $0.34B (-2.3%)                     2021: 4 People
    • Comment: Only 2 People CUs spent less on Pet Food in 2022. While 3 People CUs had the biggest increase, 4 People CUs were also up $1.11B (+25.5%) and 5+ CUs grew by $0.82B (+24.3%).
  • Housing – Homeowners w/Mtges held onto their expected position on top.
    • Winner – Homeowners w/Mtge – Food: $20.90B; Up $2.13B (+11.3%)                        2021: Homeowners w/Mtge
    • Loser – Renters – Food: $7.44B; Up $0.90B (+13.8%)                                                       2021: Homeowners w/o Mtge
    • Comment – All segments spent more so Renters “lost” with a $0.90B increase. Homeowners w/o Mtge, also spent $1.3B more so they are at $10.05B, +22.5% vs 2019. They have recovered from the binge & drop in 20/21.
  • Occupation – After 4 years away, Managers & Professionals returned to the Top. Retirees flipped to the bottom.
    • Winner – Mgrs & Professionals – Pet Food Spending: $12.97B; Up $2.12B (+19.6%)               2021: Retired
    • Loser – Retired – Pet Food Spending: $7.13B; Down $1.31B (-15.5%)                                          2021: Self-Employed
    • Comment – Only Retirees spent less. All occupations including A/O & Unemployed spent more. Mgrs/Profess. had the biggest $ lift but the highest % increase belonged to Blue Collar Workers, +40.2%.
  • Generation – Gen X held on to the top spot.
    • Winner – Gen X – Pet Food Spending: $13.08B; Up $1.96B (+17.6%)                             2021: Gen X
    • Loser – Born <1946 – Pet Food Spending: $1.88B; Down $1.73B (-47.9%)                   2021: Baby Boomers
    • Comment – Much of the 2020>21 Pet Food spending boom and bust was due to the Boomers. Gen X has now taken over and held on to the top position. Only those Born <1946 spent less on Pet Food in 2022. After their big drop in 2021 the Boomers again spent more on Pet Food. However, their $1.50B increase ranked only 3rd behind Gen X, +$1.96B and Millennials, +$1.56B. Gen Z also spent +158% more so they are now entering the “game”.
  • Age – The Winner and loser both flipped.
    • Winner – 55>64 yrs – Pet Food Spending: $8.60B; Up $1.86B (+27.5%)                        2021: 75+ yrs
    • Loser – 75+ yrs – Pet Food Spending: $2.23B; Down $1.53B (-40.8%)                            2021: 55>64 yrs
    • Comment: Only 25>34 & 75> spent less. The big drop by 75> may have been from them downgrading their food due to high inflation. The 55>64 group is about 70% high income Boomers which produced most of their lift.
  • CU Composition – Again the winner and loser both flipped.
    • Winner – Married, Oldest Child 18> – Food: $4.04B; Up $1.46B (+56.7%)             2021: Married, Couple Only
    • Loser – Married, Couple Only – Food: $10.82B; Down $0.78B (-6.7%)                    2021: Married, Oldest Child 18>
    • Comment – Only Married, Couple Only and those with an Oldest Child 6>17 spent less. There were strong increases in a number of unexpected segments. Those with an Oldest Child <6 were +$1.24B. Single Parents were +$1.22B as were Unmarried, 2+ All Adult CUs. Overall, CUs with Children were +3.29B.
  • Income – In a second consecutive flip, $100>149K flipped again to the top.
    • Winner – $100 to $149K – Pet Food Spending: $6.71B; Up $1.25B (+23.0%)            2021: $150 to $199K
    • Loser – $70 to $99K – Pet Food Spending: $5.81B; Down $0.40B (-6.5%)                  2021: $100 to $149K
    • Comment – The $70>99K group was the only segment to spend less. Spending increases were widespread but $50>69K was +$1.23B, a very close 2nd. $40>49K was +40.5%. This made <$70K +20.5% compared to $70> +7.8%.

We’ve now seen the “winners” and “losers” in terms of increase/decrease in Pet Food Spending $ for 12 Demographic Categories. In 2020, very specific segments binge bought Pet Food. In 2021, their pets “ate up” the overstock so Pet Food spending fell. 2022 brought a new challenge, strong inflation. However, most of America remains firmly committed to high quality Pet Food. Super premium Food already had high prices, so income is still very important in Pet Food spending. The pandemic and inflation have accelerated value shopping, especially on the internet. The result was 82% of all demographic segments spent more on Pet Food in 2022 producing a $4.29B, 12.5% increase. We have identified the winning segments in performance and $ increase but they were not alone. Not every good performer can be a winner. Some “hidden” segments should also be recognized for performance. They don’t win an award, but they get…

HONORABLE MENTION

This group clearly demonstrates that the lift in Pet Food spending was very demographically widespread. The first thing that you notice is that the youngest Americans have become much more committed to Pet Parenting. Gen Z and the <25 group (All Gen Z) more than doubled their Pet Food spending in 2022. Also, Super Premium Pet Food prices are high and inflated in 2022 but lower income groups still “found a way”. Single Parents, African American, Blue Collar Workers and $40>49K CUs all have low incomes and are under tremendous financial pressure. They often finish at the bottom in performance, but not in 2022. Single Parents more than doubled their Pet Food spending and the other groups increased spending over 40%. Pet Parenting is widespread, and all are committed to the welfare of their children.

Summary

Pet Food has been ruled by trends over the years. The drop in 2018 due to the FDA grain free warning broke a pattern of 2 years up followed by 1 year of flat or declining sales which had been going on since 1997. This trendy nature increased with the first significant move to premium foods in 2004. The Melamine crisis in 2007 intensified the pattern and resulted in a series of “waves” which became a tsunami with the introduction of Super Premium Foods.

The 25 to 34 yr old Millennials were the first to “get on board” with Super Premium in the 2nd  half of 2014. In 2015, many more groups began to upgrade. The result was a $5.4B spending increase. These consumers were generally more educated and had higher incomes. Unfortunately, they often paid for the upgrade by spending less in other segments. In 2016 the anticipated drop in spending happened. Many value shopped for their new food and found great deals, especially online. They spent some of the $3B “saved” Food $ in other segments but not enough to make up for the drop in Food. Total Pet Spending was down $0.46B. In 2017 we were ready for a new “wave”. However, due to a price competitive market, what we got was a deeper penetration of Super Premium. These upgraders were mostly middle-income and not college educated. The result was a $4.6B increase but this time there was no trading of segment $.

In 2018 we were “due” a small annual increase in Pet Food. Spending in the 1st half was +$0.25B but then the bottom dropped out as spending fell $2.51B in the 2nd  half in reaction to the FDA warning on grain free dog food. The big decrease in spending came directly from the groups who had fueled the 2017 increase. In fact, 71% of the demographic groups with the biggest change in Pet Food $ switched from first to last or vice versa from their position in 2017.

That brought us to 2019. The FDA warning was false, so Pet Parents returned to Super Premium or even pricier options. Supplement $ also grew as the health of their Pet Children remained the #1 priority. Pet Food $ grew $2.35B with 75% of demographic segments spending more. Income and related categories mattered more, and Pet Food Spending became less demographically balanced. In 2020 the Pandemic accelerated this trend. Fear of shortages led to binge buying and a $5.65B increase. This behavior was driven by very specific groups. This spending disparity was manifested in the fact that the performance of 8 of 10 big spending groups exceeded 120% while 49% of all segments spent less.

In 2021, the retail market strongly recovered but the turmoil in Pet Food continued. The 2020 binge buying didn’t increase usage, so Pet Food spending fell by $2.44B. Every segment with the biggest increase in 2020 had the biggest decrease in 2021. The resulting drop in $ hid the fact that 65% of all demographic segments spent more on Pet Food.

In 2022 the situation returned to a more normal, balanced pattern in spending. Pet Parents renewed their commitment to high quality food for their children. Despite strong inflation, 82% of demographic segments increased spending generating a $4.29B (+12.5%) lift and reaching a new record high of $38.69B – even exceeding the 2020 binge by $1.85B.

Finally – The Ultimate Pet Food Spending CU is 3 people – a married couple with a child over 18. They are 45>54 years old and White, but not Hispanic. Everyone works and at least one has an Advanced College Degree and is a Manager or Professional. They earn $150>$199K but are still paying the mortgage on their house in a small suburb in the Midwest.

2022 Pet Products Spending was $60.63B – Where did it come from…?

We looked at the Total Pet Spending for 2022 and its key demographic sources. Now we’ll start drilling down into the data. Ultimately, we will look at each individual segment but the first stop in our journey of discovery will be Pet Products – Pet Food and Supplies. Food and Supplies are the industry segments that are most familiar to consumers as they are stocked in over 200,000 U.S. retail outlets, plus the internet. Every week over 20,000,000 U.S. households buy food and/or treats for their pet children. Pet Products accounted for $60.63B (59.0%) of the $102.71B in Total Pet $ in 2022. This was up $2.42B (+4.2%) from the $58.21B that was spent in 2021. Pet Food spending rebounded after the big drop in 2021 following the binge buy in 2020. Supplies had its own spending rollercoaster. After falling during the 2020 pandemic, there was a record surge in 2021. This couldn’t be repeated so spending fell in 2022.

Overall, in 2022 Pet Food spending rose +$4.29B, while Supplies spending fell a -$1.86B. We’ll combine the data and see where the bulk of Pet Products spending comes from.

We will follow the same methodology that we used in our Total Pet analysis. First, we will look at Pet Products Spending in terms of the same 10 demographic category groups that were responsible for 60+% of Total Pet spending. Then we will look for the best and worst performing segments in each category and finally, the segments that generated the biggest dollar gains or losses in 2022.

The first chart details the biggest pet product spenders for each demographic category. It shows their share of CU’s, share of pet products spending and their spending performance (spending share/share of CU’s). Although their share of the Pet Products $ may be different from their share of the Total Pet $, the biggest spending groups are the same. The categories are shown in the order that reflects their share of Total Pet Spending. This highlights the differences. In Pet Products spending share, larger CUs and age are more important while income matters less. However, we should note that, like Total Pet Spending, Income is the highest performing demographic characteristic. In Pet Products there are only 4 groups with a performance rating of 120+%, 1 less than last year and 1 less than Total Pet in 2022. This reflects the fact that Pet Products spending, especially on Food, is spread more evenly across the category segments.

  1. Race/Ethnic – White, not Hispanic (82.7%) down from 83.8%. They are the 2nd largest group but still account for the vast majority of spending in every segment. Their performance fell from 124.8% to 123.1% but they moved up from 4th to 3rd in terms of importance in Pet Products Spending demographic characteristics. Hispanics, African Americans and Asian American account for 32.8% of U.S. CU’s, but they only spend 17.3% of Pet Products $. Although the minority share of Pet Poducts $ is low, it has improved considerably from 12.8% in 2020. Pet ownership is relatively high in Hispanic households, but it is significantly lower for African Americans and Asians.
  2. Housing – Homeowners (80.0%) up from 79.3%. Controlling your “own space” has long been the key to pet ownership and more pet spending. Their performance grew from 122.6% to 123.0% and they officially moved up from 5th to 4th in terms of importance for increased pet products spending. Although both Homeowners and Renters spent more on Pet Products in 2022, 76% of the increase came from Homeowners w/o a Mortgage. Those with a Mortgage spent $0.51B, +1.6% more but that was much better than Renters. Overall, Homeowneers were +5.2% while Renters were +0.6%. This disparity caused the positive change in Share & Performance for Homeowners.
  3. # in CU – 2+ people (81.4%) up from 80.8%. The share for Pet Products is higher than for Total Pet, 80.8%. If you put 2 people together, pets very likely will follow. If you have a pet, you must spend money on food and supplies. Their performance of 117.9% is up from 116.2%. Only 2 & 5 People CUs spent less but this was overcome by a 33% lift from 3 People CUs. Singles were only +1.0%. This combination improved share & performance for 2+ People CUs.
  4. Area – Suburban & Rural (72.7%) up from 72.1%, but their performance fell from 111.8% to 111.0%. Suburban households are the biggest pet spenders and they are growing in popularity. The increase in the number of CUs is what pushed the group performance down. Rural CUs alone grew by 1331, +5.5%.
  5. Education – Assoc Degree> (68.6%) down from 73.4%. Their performance level also dropped sharply from 127.2% to 118.9%. They fell from 2nd to 5th in importance and are no longer in the 120+% club. The drops in share and performance are only due to a $3.5B decrease in spending by College Grads. All groups with less than a College Degree spent more on Pet Products. The Associates Degree group did especially well, +46.5%.
  6. Income – Over $70K (64.3%, down from 65.3%). Pet Parenting is common in all income groups but money is a big driver in the spending behavior for all industry segments. Although their performance fell to 136.0% from 145.7%, CU income continues to be the single most important factor in increased Pet Products Spending. As a general rule,  Higher Income = Higher Pet Products Spending. In 2022 there was an up & down rollercoaster in Pet Products spending but performance grew with income. All and only, income segments over $70K perform at 100+%.
  7. # Earners – “Everyone Works” (65.3%) up from 64.1%. Their performance is 111.9%, down from 113.0%. In this group, all adults in the CU are employed. While 1 Earner, Singles spent $0.44B less, 2+ Earner CUs spent $2.75B more. This produced the increase in share. The drop in performance was due to a 2.45 million increase in CUs (Note: other groups were down -1.98 million CUs) along with a $2.14B spending lift from 1 Earner, 2+ People CUs. Income is the top priority in Pet Products Spending, but how many people work to get it is less important.
  8. Occupation – All Wage & Salary Earners (64.7%) up from 60.7%. Their performance also grew from 102.2% to 107.2%. Mgrs/Professionals had the biggest lift but only Tech/Sls/Cler spent less among the employed. Blue Collar $ were +32.5%. Retirees & A/O,Unemployed spent $2.1B less. Together, this produced the lift in share & performance.
  9. CU Composition – Married Couples (61.1%) down from 63.7%. Their performance fell from 134.4% to 127.8% but they went from 3rd to 2nd in importance. Only Married, Couple Only & CUs with a Child 6>17 spent less, -$4.1B. Single Parents & Unmarried, 2+ Adult CUs were +$2.3B. These were key factors in the drops in share & performance.
  10. Age – 35>64 (61.3%) up from 59.7%. Their performance also grew from 113.9% to 117.7%. Even with a -$1.26B drop by 35>44, their spending grew by +$2.49B. Outside of the group the combined change was -$0.07B. This produced the big gains in share and performance. However, they stayed in 7th place in terms of importance.

The biggest spending groups are the same for Pet Products as for Total Pet, but there are subtle differences in market share and performance. Money matters most but how many earners, their occupation and education matters less. It also appears that Pet Products Spending is becoming more balanced  across almost all demographic categories.

Now, let’s drill deeper and look at 2022’s best and worst performing Products spending segments in each category.

Most of the best and worst performers are the ones that we would expect. However, there are 9 that are different from 2021. That is 2 less than last year but 2 more than Total Pet this year. Changes from 2021 are “boxed”. We should note: Only 2 of the Product winners are different from Total Pet – $150>199K rather than $200K> and 3 People CUs rather than 4 people CUs. These differences are slight, and both reinforce the importance of Income & Family in Pet Spending.

The average performance of the 2022 Product winners was 136.1%, down from 148.6% – 10 were down. The average for the losers was 60.7%, up from 56.3% – 10 were up. The gap between best and worst narrowed from 92.3% to 75.4% indicating that Pet Products spending became more balanced across America in 2022. We should also note:

  • Generation – Gen X continues to hold their spot at the top. However, Gen Z has “awakened” which has pushed the oldest group, those Born <1946 to the bottom.
  • Income, # Earners – The new winners are still at or near the top In CU income. The importance of income is also reinforced by a number of other winners, including Mgrs/Prof., 45>54, Adv. College Degree & Gen X.
  • CU Composition, CU Size – Families and children remain important. Married, w/Children now outperforms Married, Couple Only. All Married CUs perform at 100+% but even Single Parents are up to 97%.
  • Age – The high-income 45>54 group replaced 35>44. After the “youth” spending surge in 2021, especially on Supplies, spending is skewing towards older Gen Xers.
  • Region – The Midwest took the top spot from the West, and they are the only 2 Regions performing at 100+%. However, the “under performers” are from 91>93% so spending is still relatively regionally balanced.

It’s time to “Show you the money”. Here are segments with the biggest $ changes in Pet Products Spending.

In this section we’ll see who drove Pet Products spending up. There are 2 repeats from 2021 and 12 Segments switched positions – from first to last or vice versa. This is slightly less turmoil than 2021 which had only 1 repeat but 16 flips. There is only 1 truly surprising winner, High School Grads or Less. In 2 categories, all spent more. Here are the specifics:

  • Region – Both the 2021 winner and loser flipped in 2022.
    • Winner – Midwest – Products Spending: $14.93B; Up $4.05B (+37.2%)                     2021: West
    • Loser – West – Products Spending: $14.54B; Down $3.83B (-20.9%)                           2021: Midwest
    • Comment – The West had drops in both Food & Supplies. The NE had the only other decrease – in Supplies only.
  • Education – Both winner and loser flipped.
    • Winner – HS Grad or Less – Products Spending: $10.45B; Up $3.37B (+47.5%)                        2021: Adv College Degree
    • Loser – Adv College Degree – Products Spending: $15.87B; Down $3.36B (-17.5%)                2021: Less than HS Grad
    • Comment – There was a clear dividing line in the 2022 Pet Products spending pattern. Those with at least a BA/BS degree spent less. All segments without a college degree spent more.
  • # in CU – Both the winner and loser are new. Only 3 People CUs spent more on both Food & Supplies.
    • Winner – 3 People – Products Spending: $10.88B; Up $2.70B (+33.1%)                      2021: 2 People
    • Loser – 5+ People – Products Spending: $7.14B; Down $0.64B (-8.2%)                       2021: 4 People
    • Comment: All but 3 people CUs spent less on Supplies but only 2 and 5+ CUs spent less on Pet Products.
  • Occupation – Retirees flipped from 1st to last.
    • Winner – Mgrs & Professionals – Products Spending: $21.33B; Up $2.70B (+14.5%)                        2021: Retired
    • Loser – Retired – Products Spending: $10.23B; Down $1.13B (-9.9%)                                                   2021: Self-Employed
    • Comment – All but Retirees, Tech/Sls/Cler and All Other/Unemployed spent more. Retirees $ were down due to a big drop in Food. The other drops came because of a big decrease in Supplies spending.
  • CU Composition – Again, both the winner and loser flipped.
    • Winner – Married, Oldest child 18> – Products: $6.96B; Up $2.63B (+60.8%)                     2021: Married, Oldest Child 6>17
    • Loser – Married, Oldest Child 6>17 – Products: $8.08B; Down $3.40B (-29.6%)                 2021: Married, Oldest Child 18>
    • Comment – Married Couple Only and Married, Oldest Child 6>17 were the only segments to spend less on Pet Products, but their drop was enough to turn Total Married Couples negative. Most segments were up in Food but down in Supplies. Only Oldest Child 18> and Married, plus Adults, but no kids were up in both Food & Supplies $.
  • # Earners – The winner is new but No Earner, 2+ People CUs flipped to the bottom spot.
    • Winner – 1 Earner, 2+ CU – Products Spending: $12.22B; Up $2.14B (+21.2%)                             2021: No Earner, 2+ CU
    • Loser –– No Earner, 2+ CU – Products Spending: $4.47B; Down $2.58B (-36.6%)                          2021: 2 Earners
    • Comment – While income matters most, the # of Earners is still not a major factor in Pet Products spending as 1 Earner, 2+ CUs won. Only 1 Earner, Singles and No, Earner, 2+ People CUs spent less.
  • Age – The 55>64 yr-olds flipped from last to first and 75> moved to the bottom due to a big drop in Food $
    • Winner – 55>64 yrs – Products Spending: $13.25B; Up $2.04B (+18.2%)                                   2021: 35>44 yrs
    • Loser – 75> yrs – Products Spending: $3.41B; Down $1.32B (-27.9%)                                         2021: 55>64 yrs
    • Comment: The only spending drops came from 25>44 and over 75. The 45>74 yr-olds spent more in both Food & Supplies. Only 25>34 yr-olds spent less on both – minor decreases. Supplies $ drove the 35>44 group down.
  • Income – Both winner and loser flipped.
    • Winner – $100 to $149K – Products Spending: $11.67B; Up $1.86B (+19.0%)                          2021: $200K>
    • Loser – $200K> – Products Spending: $9.77B; Down $1.88B (-16.1%)                                        2021: $100>149K
    • Comment – A spending rollercoaster: <$40K = -$0.63B; $40>69K = +$2.07B; $70>99K = -$0.32B; $100>199K = +$3.19B; $200K> = -$1.88B. Most Impressive: $40>49K was +34.6% and spent more on both Food & Supplies.
  • Housing – Homeowners w/o Mtge flipped from last to 1st but all segments spent more on Pet Products.
    • Winner – Homeowner w/o Mtge – Products: $15.93B; Up $1.84B (+13.1%)                           2021: Homeowner w/Mtge
    • Loser –– Renter – Products Spending: $12.10B; Up $0.07B (+0.6%)                                          2021: Homeowner w/o Mtge
    • Comment– Wealthier Homeowners who have paid off their homes, but are not retired, were the big drivers.
  • Generation – Both the winner and loser are new.
    • Winner – Millennials – Products Spending: $15.14B; Up $1.59B (+11.8%)                              2021: Gen X
    • LoserBorn <1946 – Products Spending: $2.77B; Down $1.71B (-38.2%)                              2021: Baby Boomers
    • Comment – There were only 2 Pet Products negatives – Gen X had a strong lift in Food, but it was overcome by a huge drop in Supplies $ and Born <1946, who were up slightly in Supplies but had a big drop in Food $.
  • Area Type – The larger Suburbs held their spot on top. Center City is a new loser, but all Area Types spent more.
    • Winner – Suburbs 2500> – Products Spending: $26.70B; Up $1.44B (+5.7%)                         2021: Suburbs 2500>
    • Loser – Center City – Products Spending: $16.56B; Up $0.31B (+1.9%)                                    2021: Population <2500
    • Comment – <2500 was the only area to spend more on Supplies & Food. Center City had the only drop in Food $.
  • Race/Ethnic – White, Non-Hispanic held their spot on top while Asians replaced African Americans at the bottom.
    • Winner – White, Not Hispanic – Products Spending: $50.14B; Up $1.34B (+2.7%)                       2021: White, Not Hispanic
    • Loser – Asian – Products Spending: $1.50B; Down $0.29B (-16.4%)                                                 2021: African American 
    • Comment – African Americans didn’t win but they spent 59.7% more overall and were the only group to spend more on Supplies – and on both Food & Supplies. On the flip side, Asians were the only group to spend less on both Food & Supplies. White, Not Hispanic “won” because a $3.28B Food lift overcame a $1.94B drop in Supplies.

We’ve now seen the winners and losers in terms of increase/decrease in Pet Products $ for 12 Demographic Categories. 2022 was a positive, but mixed year for Pet Products Spending. Food rebounded after the big 2021 drop from the binge buy in 2020. The lift was enough to overcome the drop in Supplies $ after the record post pandemic spending surge in 2021. In 2022, 52% of segments still spent more on Supplies, but 82% spent more on Food so that 70% spent more on Pet Products. Of course, not every good performer can be a winner but some of these “hidden” segments should be recognized for their outstanding effort. I’ve narrowed the group down to 6. They don’t win an award, but they deserve…

Honorable Mention

Pet Products spending was up $2.42B in 2022. A rebound in Food exceeded the big drop in Supplies. The lift in Pet Products spending was widespread as 70% of 96 demographic segments spent more. Income was still the most important factor, but spending became a little more balanced. In our honorable mention group, you see that Gen Z truly got into the game by more than doubling their Pet Products spending. Although 2022 spending skewed towards the older Gen X group, 70% lifts by the <25 group and CUs with an oldest child <6 showed that the younger groups were still “strong” pet parents. Some other low-income segments that often finish on the bottom in spending also had a good year. Single Parents and African Americans both increased their Pet Products spending by 58+%. Finally, Higher Education became a little less important. College Grads spent less on Pet Products while all demographic segments w/o a college degree spent more. Those with an Associate’s degree were a big contributor with a 46% increase. The lift in Pet Products spending was widespread and more balanced so there were many “heroes”.

Summary

Pet Products spending has seen a lot of turmoil since 2015. Many consumers upgraded to Super Premium Food and cut back on Supplies in 2015. In 2016 they value shopped for Food and Spent some of the saved money on Supplies. In 2017 there was increased availability and value in both segments. More Consumers recognized the opportunity and spent $7B more. 2018 was calm, until the second half when the FDA warning on grain free dog food caused many consumers to downgrade their food and new tariffs on Supplies flattened spending growth. The result was -$1B drop in Products $.

In 2019 Pet Food spending rebounded to a new record level but the full impact of higher prices in the Supplies segment really hit home, with a record $2.98 decrease in spending. The drop was almost universal as 93 of 96 demographic segments spent less. The result was a -$0.64B drop in Pet Products $, the second consecutive decrease.

2020 brought the COVID pandemic. Out of fear of reduced availability, Pet Parents binge bought Pet Food in the 1st half of the year. As Pet Parents focused on “needs”, discretionary Supplies dropped significantly in importance and $. However, Pet Products spending still grew by $3.99B and exceeded $50B for the 1st time at $52.0B.

In 2021, the Food binge was not repeated and pets “ate down” the overstock so Pet Food spending fell. However, Pet Parents caught up on purchasing all the Supplies that they had postponed buying due to the pandemic. The result was a record increase in Supplies and a $6.21B increase in Pet Products $.

2022 brought a return to more normal spending behavior. Pet Food spending increased $4.29B, +12.5%. Obviously, the binge was not repeated but Supplies spending only fell -7.8% and 52% of demographic segments still spent more. The net was a $2.42B, +4.2% increase which pushed Pet Products $ up to $60.63B. Overall, the lift was widespread as 70% of 96 demographic segments spent more. While the Spending leader remained Gen X, the $ moved towards their older members in the 45>54 yr-old age group. However, the youngsters also made their presence felt as Gen Z more than doubled their Pet Products spending. Spending also became more demographically balanced. The most visible feature of this change was in the big groups doing at least 60% of the dollars. In order to reach the 60% minimum, the Education group was downgraded from College Grads to those with an Associate’s Degree or more. However, the balancing act was not limited to Education. 10 of 12 categories narrowed the gap between their best and worst performing segments. Overall, the average gap narrowed from 92.3% in 2021 to 75.4% in 2022. It’s still big but definitely improving.

Finally,… The “Ultimate” 2022 Pet Products Spending CU is 3 people, a married couple with a child over 18. They are in the 45>54 age range and are White, but not Hispanic. At least one has an Advanced College Degree and is a Mgr/Professional. Everyone works, including their child, producing a CU income of $150>199K.They still have a mortgage on their house located in a small suburb  in the Midwest.