SuperZoo 2015 – How does it compare to 2014…and to GPE 2015?

SuperZoo 2015 will be here next week. Officially, there are 983 exhibitors. That’s up about 7% from 2014, but still about 100 less than GPE 2015. So about 1000 exhibitors participate in both shows, right? Well, actually…No! Just under 600 exhibitors participate in both shows.
• About 400 exhibitors at SZ 2015 didn’t participate at GPE 2015
• About 500 exhibitors at GPE 2015 aren’t participating at SZ 2015

That means that of 1500 total Pet Show exhibitors, 900 only participate in one of these key shows.
While both shows are important to companies committed to the U.S. Pet Market, they do have a slightly different focus. For example, SuperZoo has a higher percentage of independent retail attendees while GPE had over 3 times the number of exhibitors from outside the U.S.

Let’s do some comparisons. We’ll take a look at the exhibitor type and product mix and compare it to both SuperZoo 2014 and GPE 2015. Both shows have designated floor sections which pull together exhibitors with a common theme. Other than this segregation, neither show segregates the other booths in any way.
The chart below and the ones that follow show the exhibitor count, % of total booths and directly compare SZ 2015 to SZ 2014. In the comparison to GPE 2015 we only show the % difference.

SZComp1

Remember SZ 2015 grew about 7% in exhibitor count so any change in count below +7% is actually a decrease in share of exhibitors. Also GPE and SZ have 3 sections in common for direct comparison

  1. Natural – The segment continues strong growth in all shows. SuperZoo is leading the way.
  2. Rodeo Drive – SZ has almost 3 times as many “fashion” exhibitors as GPE but basically no growth over SZ 2014
  3. Groomers – This section, like the Services segment, is growing and is a major emphasis at SZ.
  4. New Vendors – At least in terms of New Vendor section, there is no growth.

A word of caution: Just because a section is smaller, doesn’t mean that there are fewer exhibitors offering products in this category. It can indicate that Companies have broadened their product listings and have opted to not be segregated by only a part of their portfolio.

Now let’s take a look at the classifications that I have made in conjunction with the Exhibitor Visit Planning Tool that I designed to make working these trade shows easier and more productive.

First We’ll Compare Exhibitor Type – By function: By Animal type

SZCompType

  1. Dogs and Cats are the pet “royalty” and increased in booth count but dropped slightly in “share” of booths as SuperZoo 2015 is showing more diversity..
  2. SZ 2015 improved its offerings in Fish, Bird, Small Animal and Equine over 2014 but is still significantly behind GPE in all but Equine. Reptile is slowing for both shows.
  3. Business Services is showing the biggest growth. The other “non-animal” segments are flat or down slightly versus 2014. SuperZoo still has significantly more of all these categories than GPE which reflects their focus on independent retailers.

Now let’s take a closer look at the “royalty” – Dogs and Cats. I have divided products designed for them into 32 subcategories. Here are this year’s top 10 for SZ 2015.

SZTop10

  1. The major difference between SZ 15 and SZ 14 is that Clothes/Costumes loss significant share and dropped from #6 to #7. Feeding accessories moved up to the #6 spot.
  2. In terms of share of booths, only Meds/Supp, Feeding Acc, Carriers and Grooming Tools actually gained.
  3. Vs GPE, the top 3 are the same. SuperZoo has a significantly greater amount of meds/supplements and Grooming Tools. Their wide lead in clothes/costumes has narrowed considerably.

The full list of the “searchable” categories for Dog/Cat products and a comparison between SZ 2015 and SZ 2014 as well as GPE 2015 follows. Take a look at the categories that are of interest to you.

I have color highlighted both positive and negative differences in “share” of booths when they exceed 10 or 20%. Note: The data input for all shows was derived from visits to over 1000 websites – per show. They’re not 100% accurate, but close.

Categories

Although this post is primarily about SZ 2015, both SZ and GPE are “must attend” in the industry.

Regardless of why you are attending the SZ 2015, having a productive show requires planning. It’s too big to just “wing it”. Go to the link below which will take you to my previous post. From there you can download a copy of my SuperZoo Super Search Exhibitor Visit Planner. It can’t hurt and it may help make your show more productive.

Link to SuperZoo SuperSearch Post

SuperZoo 2015 is almost here…… Are you ready?

SuperZoo continues to grow. There are 971 exhibitors at SuperZoo 2015 – 60 more than last year. The show is also “open” for 22 hours – 3 more than last year!

Now the bad news. “Do the Math!” If you don’t stop to chat with anyone in the aisles or for food, a drink or to go to the bathroom, don’t attend any classes, don’t visit the New Products Showcase…and allow no time for walking, you can spend about 1 minute and 20 seconds with each exhibitor…down 10 seconds from last year :-). You definitely need a plan…!

Although SuperZoo has a high percentage of retail pet attendees, it still presents the “whole Pet Industry Package”…New Product Showcase, educational seminars, informative speakers and 400 exhibitors who didn’t showcase their products at GPE 2015. As such, it draws attendees from all retail channels and from around the world.

Together GPE and SuperZoo pack quite a one-two punch and you “must do both” if you’re serious about your U.S. Pet Business.

Pet Food and Supplies represent over 2/3 of the U.S. Pet Industry and every business can improve in terms of products. However, here’s where the abundance of exhibitors creates a problem. You just don’t have the time. You need to be able to target your visits. If you are a retailer, what sections of your store are not doing as well as you hoped and need a “facelift” or conversely, what areas are growing and need products to fill additional space? Category managers are only interested in visiting exhibitors relevant to their “categories”. Representatives also may be looking for new manufacturers…in specific product categories. Manufacturers could be looking to find distributors to handle their products or just looking to “check out” the competition. In regard to products, there is always something!

Much of the rest of this post will be redundant to some of my readers but for the benefit of the new people…

This problem of targeting the search for specific product categories has grown radically with the industry. About a year ago, I decided to try to do something to help.

I designed a tool in Excel, the Super Search SuperZoo 2014 Visit Planner to make “working the show” easier and more productive for ALL attendees – retailers, distributors, reps, groomers, vets…even exhibitors.

This was well received by its users, so I updated and improved the tool for this year’s GPE. I also learned a valuable lesson…never assume. I visited over 1000 exhibitor websites to confirm the product categories available from each…initially for GPE 2015, but again for SuperZoo 2015. If an exhibitor didn’t have an active site I did a separate internet search. For SuperZoo 2015, I was able to validate the product offerings for all but 3 exhibitors.

Is it 100% accurate – no, but it’s pretty darn close.

The SuperZoo 2015 Super Search can help you target your product search:

  • From the simplest…”just give me a list that I can look at on my phone or tablet quickly in either Booth # order or alphabetically”
  • To the most complex…”can do a simultaneous search for multiple specific product categories…then allowing you to personally narrow down the initial results and see the “final” alphabetically or in booth number order”.

The Super Search does both…and more…and does it quickly!

There is a download link below for the Super Search tool as well as one for the instructions. Yes, there are specific instructions for Super Search. I recommend that you read them and print them out for reference during your initial search. They are 4 pages long. Remember, instructions are by necessity long, even when the actions are pretty simple. If you used the search tool for GPE 2015, there is no change!

There is one last thing which could affect some of your searches. In the past, three companies – Central Garden and Pet, United Pet Group and PetSafe were each listed as exhibitors under their corporate “banner”. At SuperZoo 2015, they have each listed their individual subsidiaries/brands like TFH/Nylabone, Four Paws, Dingo, etc. separately, as exhibitors. Nothing has changed regarding the way they exhibit. They still occupy 3 “big” booths. This strategy may reflect the idea that retailers are more familiar with their “brands” than the overall “corporate” entity. Central and PetSafe still have their corporate names listed. However, United Pet Group does not.

I hope that the SuperZoo 2015 Super Search helps you have an enjoyable and productive show. “Plan your work. Work your plan”….See you in Vegas!

REMEMBER – When you download the Super Search tool, you must “enable macros” for it to work.

Download the files and get “planning” right now!

5cat_using_computer

[button link=”https://pmud8a.a2cdn1.secureserver.net/wp-content/uploads/2015/06/SUPERZOO-SUPER-SEARCH-EXHIBITOR-VISIT-PLANNER-INSTRUCTIONS-Prepared-by.pdf” type=”icon” newwindow=”yes”] Download Instructions (PDF)[/button]

(To save the PDF to your computer Right Click the download link and select “Save Link As…”)

imgDL_01

[button link=”https://pmud8a.a2cdn1.secureserver.net/wp-content/uploads/2015/06/SuperZoo2015-Final-SuperSearch-6-26.xlsm” type=”icon” newwindow=”no”] Download SuperSearch (Excel)[/button]

Petflation April Update: Food & Supplies Prices Falling – Driving Total Pet Prices Down

In April, Pet Food and Supplies prices got back on the roller coaster, falling sharply from March. Like the situation in January, despite rising prices in Veterinary and Service segments, the April drop in Food and Supplies segments was enough to pull the Total Pet Prices down for the month and the year to date. Food was the big “driver” giving back all and more of the ground that it had regained in March.

Veterinary continues its usual pattern of strong inflation early in the year (0.5% per month). Services are also on a relatively normal track with a low inflation rate over the first 3 months, then turning sharply upward in the April. If the usual pattern continues, both segments should see continued increases through the Spring, flattening out in the Summer months – starting in July.

Remember, last December Food & Supplies had a price increase rather than the “drop” which had become the norm in recent years. The “drop” occurred in January so December 2014 was a little higher than we would have expected.

Here’s what has happened in each segment since then.

CPIApril-1

SPECIFICS ON CPI CHANGES

Veterinary Services

  • January – Up ↑0.69%; February – Up ↑0.49%; March – Up ↑ 0.39%; April- Up↑0.40%
  • Year To Date: Up ↑1.99%

NonVet Services

  • January – Up ↑0.30%; February – Up ↑0.35%; March – Down ↓ -0.06%; April- Up↑0.42%
  • Year To Date: Up ↑1.01%

Pet Food

  • January – Down ↓-1.14%; February – Down↓-0.06%; March- Up↑0.55%; AprilDown↓-0.65%
  • Year To Date: Down ↓-1.31%

Pets & Pet Supplies

  • January- Down ↓-0.60%; February – Down ↓-0.15%; March- Up ↑0.08%; April- Down↓-0.42%
  • Year To Date: Down ↓-1.09%

Total Pet

  • January- Down↓-0.27%; February- Up ↑0.17%; March- Up↑ 0.26%; April- Down↓ -0.27%
  • Year To Date: Down ↓-0.12%

OBSERVATIONS

  • In 2014 February had an increase followed by a drop in March. In 2015 the increase and subsequent drop occurred a month later – in March and April.
  • Food – April drop was significant…so is down 1.31% for the year to date.
  • Supplies – prices continue to slowly fall.
  • Veterinary prices continue their normal winter/spring increase.
  • The NonVet Service segment continues to increase in price but at about half the rate of Veterinary.
  • The Total Pet Market Prices rose in March due largely to increases in Food and Veterinary Services – the same “drivers” as in the February 2014 increase.

Let’s take a look at the monthly history over the last 18 months to get a better feel for the “rollercoaster” ride in Food and Supplies.  April of 2015 and April of 2014 are outlined so you can see where we were at this time last year.

CPIApril-2

COMMENTS

As we have noted, March was the pricing “low point” for the total industry in 2014. We are about 0.7% above that level this April. All segments but Food are above the pricing of a year ago. Even Supplies are up, primarily due to the residual effect of 4 months of continual increases from September through December. The big question is what will happen with food – the largest segment?

COMMENTS – BY INDUSTRY SEGMENT

Veterinary Services – Once again the price increase from December to April this year actually exceeded last year – up 2.06% in just 4 months. In our consumer expenditure analysis we saw that veterinary spending increased significantly – for the highest incomes. However, it dropped $1B for the <$50K group. Obviously, there is a cost associated with strong inflation beyond just price.

NonVet Services – The price increases in this segment have been regular but more moderate than the Veterinary segment. It appeared that this had not affected consumer purchases. However, the recent Consumer Expenditure survey indicated an overall flattening in spending on Services. Flat spending in conjunction with increased prices indicates a reduction in the amount of services purchased.

Pets and Pet Supplies – Prices are actually 0.5% above April a year ago. However, they are still 3.8% below what they were in April 2009 – 6 years ago. The deflation in this segment is a slow, ongoing and painful issue, with no easy fix. I know that you are all tired of hearing me “preach” about this. However, long term deflation is a serious issue and in many ways harder to handle than inflation. When popular categories become commoditized, price competition drives down prices and ultimately drives out some manufacturers. The only real cure is to innovate – make it better – that’s how you can get today’s value conscious consumer to spend more.

Pet Food – This largest segment is becoming a serious concern. January saw the largest price drop in 17 years. March brought a strong uptick in prices. Then another big drop in April took away the ground regained in March…and more. The Consumer Expenditure survey indicated recent Pet Food Spending is down about $80M. With the deflating prices, the actual amount of food purchased remains at 99.9% of the previous measuring period. It’s a complex story. The >$120K households are spending more on Food. Everyone else is looking for a value and spending less.

Total Pet Market – It’s a “bipolar” situation. Veterinary and Service segments keep going up. Supplies and especially food are trending down. History says all segments should have increasing prices through June. Then Total Services flatten out and Food & Supplies drop in the summer, dragging the Total Market down. We’ll see…We seem to be on track for an overall CPI increase of about 0.66% for 2015.

Here’s a chart that compares our April numbers to recent history

CPIApril-3

The Food & Supplies segments are still on a pricing Roller Coaster ride. We’ll keep you up to date!

Pet Spending Update: Up ↑$3B – Vet and Supplies lead the way!

As you may recall from a Post that I did last Fall, Pet now has its own listing in the Consumer Expenditure Survey conducted by the U.S. Bureau of Labor and Statistics.
Recently, they published a mid-year update. This is a “rolling” report covering the 12 months ending June 2014. The full year for 2014 will be published in September, which will give us the first opportunity for a direct year to year comparison. However, this update also covers 12 mos and shows us the market direction.
In conversations with the personnel who conduct the survey I found out that there is more detailed data which is not published but available if you know what to ask for and who to ask. So here’s what I got:
Total Pet expenditures per household (published) plus 4 subsets:

• Pet Food
• Pets & Supplies
• Non-Vet Pet Services
• Veterinary Services

They provided details for income groupings of $5-20K each from less than $5K to over $150K so the data can be broken in a huge variety of groups.
Their data is only published in terms of expenditures per household – Pet & NonPet together. They also don’t generate total Retail $. Getting these Retail totals is more complex. You must consider how the information was gathered – by quarterly interview or weekly diary. With this knowledge, I developed a formula to turn their annual expenditure numbers into Total Retail $ per category for each product and income segment.
The specifics for Consumer Pet Spending for the 12 months ending June 2014 are in the table below. WARNING: This is going to get somewhat complex. We’ll try to simplify it somewhat with some basic graphs and charts and some “smoking gun” observations. At the end we will provide you with additional detailed data including:

• 2013 Annual numbers
• Actual difference between midyear 2014 and 2013
• % difference between midyear 2014 and 2013

You can then make your own comparisons in the specific areas that are of interest to your business.

P-Spend-1

Right now, Consumer expenditures on Pet are $60.8B – up $3.05B! Let’s see where it comes from!

Here are the overall numbers and the change between Midyear 2014 and the 2013 Full year report. 

P-Spend-2

The difference in the percentages between Households and the total market is due to the increase in the number of households. For this analysis we will focus on the spending in the total market and more specifically the changes. Here’s where the $3.05B comes from in terms of category.

P-Spend-3

Observations

  • Huge growth in Veterinary – ↑$2.12B – Even more than simple price inflation would explain.
  • Food is falling slightly. ↓$86M to be “exact”. There was strong price deflation in food from Nov 2013 to Mar 2014. Remember, Food is a need based purchase. You don’t buy more because prices are down. You just spend less.
  • Pets, Supplies and Medications strongly up. ↑$970M. This is a bit more complicated. Like food, supplies have also had deflationary pressure. However, much of the supply segment is “discretionary” spending. When prices are down, you are likely to buy more. The USBLS also includes Prescription Pet Medications in this segment. Prescription prices for Pets and People have been sharply rising.
  • Pet Services are up slightly ↑$50M but at 0.9% their $ growth is essentially flat. In fact, with the inflation in this segment the amount of services is actually down.
  • In the total Pet Market, the growth comes from Veterinary Services and Supplies.

Income matters.<$70K /$70K> has been the breakpoint for 50% of Pet Spending. Here are the numbers:

P-Spend-4

Once again, let’s focus on the $ change…for each income segment.

 Here’s what it looks like side by side on a graph:

P-Spend-5

Observations

  • Veterinary Sales is still the big driver. Although 90% is coming from the over %70K households!
  • Food is falling slightly in both income segments. The drop is close to equal. Of note: The under $70K has maintained the exact same share of total food sales at 51.3%
  • Pet Supplies shows a big change from the overall market. The over $70K group is up over $1B while the under $70K is actually down about $60M. Apparently the reduced supply prices aren’t driving increased purchases in the lower income group.
  • Pet Services are basically flat in $ for both segments. Considering inflation, the amount of services is definitely slightly down for the under $70K group.
  • Total Pet – 94% of the increase is coming from the over $70K.The under $70K group is now 68% of U.S. households up slightly from 67.8% in 2013. Their share of the total pet business has fallen from 48.1% to 46.0% in just 6 months.

This huge difference in performance suggests a deeper analysis. Let’s look at some details in the under $70K group:

  • Food – The under $30K group actually spent $200M more. The big drop is coming in $50>$70K.
  • Supplies – The $60M decrease is totally due to a $120M drop in spending by the $50>$70K group.
  • Services – In this case the $30K>$40K segment has a $80M increase. Above and below are down.
  • Veterinary – The $50K>$70K are spending their $ here – up $1.4B. Under $50K is DOWN $1.14B.
  • Total Pet – The $1.B increase in Vet Spending is fueling the entire increase in the under $70K group.

Since 94+% of all the growth is coming from households with income above $70K. We definitely need to take a closer look at the spending at higher income levels.

In reviewing the detailed data, one fact can’t be ignored 109.2% of the overall $3.05B increase came from households with income above $120K. 12.9% of U.S. households are driving the increase in Pet Spending. Let’s follow the money and set up a new income division Over/Under $120K.

Pet Spending in <$120K/>$120K H/H’s Here are the numbers.

P-Spend-6

Next…the $ change…for each of this new division’s income segments.

Here’s what they look like side by side on a graph:

P-Spend-7

Observations

  • Veterinary Sales is an even bigger driver. The households under $120K are spending $440M less.
  • Food finally looks up. +$120M in the over $120K group. They actually spent less money per household on Food but a significant increase in the number of households over $150K generated this gain.
  • Pet Supplies – The $970M gain is evenly divided between the over/under $120K groups.
  • Pet Services – Like Veterinary and Food, the entire increase was “funded” by the over $120K group.
  • Total Pet – 109.2% of the increase is coming from the over $120K group. The spending from 116M households (87.1%) is down $280M.

Overall Commentary

  • Veterinary – $2B – 69.5% of the total increase comes from Veterinary Services. The $120K, high income group, is spending whatever is necessary, regardless of the cost. In fact, they account for 35.3% of all Veterinary expenditures. Most other groups are spending less. Of special concern is the under $50K segment. Their spending is down over $1B – in spite of and perhaps because of continuing high price increases. The result is a big reduction in veterinary visits.
  • Food is down $85M primarily to deflation from November 2013 through March 2014. It is significant that the under $70K group maintained its 51.3% share of Pet Food spending. This indicates that Pets are still a major part of households across all income levels. As in supplies, deflation causes extreme competitive pressure for the manufacturers. However, unlike Supplies, lower prices do not generate increased purchases. Let’s hope the Pet Food CPI begins a gradual increase.
  • Pet Supplies – The ongoing low prices are undoubtedly helping to push sales. The $1B increase is specifically being driven by 2 income groups – $70K>$120K and $150K>. More after tax income helps spur increased discretionary purchases. The problem comes for the manufacturers in trying to profitably maintain competitive pricing so they don’t lose their overall appeal across all the income groups. The current increase in spending by the higher income groups also indicates that there is an ongoing and future market for high end products.
  • Pet Service prices primarily appeal to higher income households. In fact 63.6% of purchases come from 32.1% of households – those over $70K in income. 35.6% of purchases are from the 12.9% of households with an income over $120K. With a 3+% inflation rate and a 0.9% increase in sales, the amount of services is actually down from 2013
  • Pet is now 0.93% of all consumer spending – up from 0.9%. It is near 0.9% for most income groups. However, 109.2% of the overall increase comes from the over $120K group. 71% of the increase comes from households with an income of $150K or more – the only income group with increases in spending in all segments. 7.9% of households now generate 18.3% of all Pet Spending. Considering these high income facts, one has to wonder if the growth in the industry is moving from “upscale” households to “elite” households.

Thanks for your patience in “wading” through this complex subject!

As promised, a 2 page detailed Appendix is available through the link below. Just click on the button to download and save the file as a PDF.

[button link=”https://pmud8a.a2cdn1.secureserver.net/wp-content/uploads/2015/05/Pet-Spending-Details-May-15.pdf” type=”icon” newwindow=”yes”] Download Data (PDF)[/button]

Petflation Update: 2015 – 1st Quarter – March saves the day!

When we took a look at 2014 Pet Industry Sales in a recent post, we found a lot of overall positives – 83.1% of the growth was real and inflation was only 0.68%, the second lowest in history. However, when we looked a little closer, we found these “positive” numbers came from combining 2 potentially negative situations.

The service side of the business, especially Veterinary had a continuing high inflation rate which has limited growth in the actual amount of services sold over the last 5 years. While Supplies and now Food were showing deflation – usually a sign of commoditization and not a healthy situation for any segment.

December brought a surprise price increase in both Food and Supplies. Let’s take a look at what has happened since.

PetflationMar-15-1

 SPECIFICS ON CPI CHANGES

Veterinary Services

  • January – Up ↑0.69%; February – Up ↑0.49%; March – Up ↑ 0.39%
  • Year To Date: Up ↑1.58%

NonVet Services

  • January – Up ↑0.30%; February – Up ↑0.35%; March – Down ↓ -0.06%
  • Year To Date: Up ↑0.59%

Pet Food

  • January – Down ↓-1.14%; February – Down↓-0.06%; March- Up↑0.55%
  • Year To Date: Down ↓-0.66%

Pets & Pet Supplies

  • January- Down ↓-0.60%; February – Down ↓-0.15%; March- Up ↑0.08%
  • Year To Date: Down ↓-0.68%

Total Pet

  • January- Down↓-0.27%; February- Up ↑0.17%; March- Up 0.26%
  • Year To Date: Up ↑0.16%

OBSERVATIONS

  • The “normal” December drop in Food and Supplies got pushed to January this year.
  • The January drop of 1.1% in Food was the largest monthly price drop in this segment in 17 years and the second biggest drop in history.
  • Supplies continue to deflate.
  • Veterinary prices accelerate their increase.
  • The NonVet Service segment continues to increase in price but with some moderation.
  • The Total Pet Market Prices went positive in March due largely to increases in Food and Veterinary Services.

Let’s take a look at the monthly history over the last 18 months to get a better feel for the rollercoaster ride in Food and Supplies.  March of 2015 and March of 2014 are outlined so you can see the journey over the last 12 months.

PetflationMar-15-2Rev


 COMMENTS

March of 2014 was the pricing “low point” for the industry in 2014. We are about 1.6% above that level this March. All segments are above the pricing of a year ago. There is also a little encouragement in the Food and Supplies segments. While the monthly pattern doesn’t exactly match a year ago and some monthly drops have been precipitous, the duration of the declines appears to be shorter.

Veterinary Services – One has to wonder when this segment will at least slow down in price increases. 2011 and 2012 showed actual decreases in the amount of Veterinary Services sold and the annual adjusted growth rate since 2010 has slowed to 0.9%. Yet the price increase from December to March this year actually exceeded last year. The continuing high prices increases in the Veterinary segment does seem to be having a positive impact – building the OTC Meds/Supplements category in the Supply segment.

NonVet Services – The price increases in this segment have been more moderate – in the range of 2-2.5% annually. So far this has not negatively impacted consumer purchases as the segment continues strong growth. In fact, it has become a big plus for the Pet Store Retail Channel.

Pets and Pet Supplies – Prices are actually above the same period a year ago. However, before we celebrate too much, we should remember that they are still 3.9% below what they were in March 2009 – 6 years ago. The deflation in this segment is an ongoing issue, with no easy fix. It has not been a precipitous drop like what occurred in the Human Toy market years ago. However, with more and more categories becoming commoditized the decline is very real. Since the recession, U.S. consumers have become more value driven than ever before. We need to “make it better” if we expect them to pay more – Innovation!

Pet Food – This largest segment is perhaps the biggest concern. The huge price drop in January – the largest in 17 years – is a pretty good wakeup call. However, retail pet food prices in the last 18 months have largely been below the level of September 2013. Remember, the CPI numbers from the U.S. Government include both food and treats so deflation caused by commoditization is a bit more complex than if it were food alone.

Total Pet Market – Services Way Up – Food & Supplies Down. As we have said, put these 2 negative situations together and they give a somewhat “false positive” read for the overall market. We need moderation in the increases and innovation in the deflationary segments to turn them around. It’s a little early to guess the overall Petflation rate for 2015. However, if the current situation continues, it could very well be similar to 2014 at about 0.64%.

Finally, here’s a chart that compares our March numbers to recent history:

PetflationMar-15-3

As you can see 2014 was a tough year in the industry from a pricing perspective. We’ll see what the balance of 2015 brings!

Pet Industry $ALES in 2014 – Taking a Closer Look

2014 brought a 4.16% increase in the total U.S. Pet Industry. This was not quite the projected 5% increase, but even factoring in “Petflation” the increase in the amount of goods and services sold was 3.46%. This means that overall an outstanding 83.1% of the growth was “real”.

In this post we’ll take a closer look at the performance of the total market and its individual segments in terms of Retail Growth and Adjusted Growth, which factors in inflation (The CPI). We will cover 2014 and also put it into perspective for the period from 2009 to 2015.

Here are the details for 2014. Some key data is highlighted:

2014Sales1

Key Observations

  • Deflation in BOTH Food (-0.3%) and Supplies (-1.06%)
    • The Good News is that the amount of goods sold is actually greater than indicated by retail $
    • The Bad News is that deflation intensifies the competitive pressure on manufacturers and retailers. Long term it is not a healthy situation.
  • Inflation in the service segments – NonVet (2.88%) and Vet (3.53%)
    • Good News – Consumer purchases in NonVet services seem to be unaffected – 68.5% of growth is real!
    • Bad News – The Vet Segment didn’t make the projected number but more importantly…76.6% of the growth was from Price Increases!!
  • This means that total Market performance – a 4.2% increase…with 83% of this being “real” due to the second lowest inflation rate in history…was actually produced by a combination of unhealthy inflation & deflation in 3 segments.

The Bar Chart below may make it easier to visualize the situation…especially in the Vet Segment.

2014Sales2

Now let’s take a look at the performance of the individual segments from 2009 to 2015 starting with Food.

2014Sales3

OBSERVATIONS

  • When you look at the cumulative, it looks pretty good.
    • 63% Annual Growth
    • Low average inflation – 1.02%
    • 75% “real” Growth
  • However there have only been basically 2 types of years for Food since 2009
    • half are deflation (-0.4%);
    • half are inflation (2.5%)

The deflation years are the most concerning. 2014 was only the third year with a CPI decrease in Pet Food – 2000 and 2010 were the other two. I don’t know the situation in 2000 but the 2010 deflation came after a combined 20% Food CPI increase from 2007 to 2009 – in the heart of the recession. Real growth ceased. The decrease in 2010 brought a positive response from the consumer – adjusted growth exceeded retail sales.

The years from 2011 to 2013 brought CPI increases in the 2+% range. Interestingly enough it looks like the consumer accepted the initial year of the increases but a 2.8% increase in 2012 and the cumulative effect of the increases dropped the percentage of real increase below 50%.

Here’s what it looks like on a graph:

2014Sales4

2015 Retail Food sales are projected to increase 3.5% to $23.04B. My initial “petflation” projection for 2015 is (-0.5%). No one, including me likes this. However the Pet Food CPI has only dropped in January 3 times since 1997 (including lastYear) and in both January and February only twice. It has done both in 2015 and the January drop was over 1.1% -twice  as much as either of the other 2 years. Things can change but right now it looks similar or even more extreme than 2014.

Let’s turn next to Pets & Supplies.

2014Sales5

OBSERVATIONS

  • DEFLATION
    • Prices are 5.7% below 2009
    • Falling at an annual rate of -0.8%
  • Consumer is still buying more
    • Retail Sales annual growth rate is 4.72%
    • Price Adjusted annual growth rate is 5.76% – 22% higher than the retail rate

Like the Food Segment, the first deflationary year was 2010. However, the story is a little different. From 1997 to 2004 Pet Supplies increased in prices at an annual rate of under 0.5%. Starting in 2005 and continuing through 2009, the CPI increased an average of 2.75% per year. This doesn’t sound like much but remember it was 5 times the rate of the previous 7 years and 2 of the biggest increases (+3.0%) came in 2008 and 2009, the heart of the recession. The consumer reacted – and bought less.

Prices fell almost 2% in 2010 and the consumer bought more. However, unlike Food, the prices briefly stabilized then generally began moving consistently downward.

Here’s the graph:

2014Sales6

Please note that the price adjusted numbers are always above actual Retail. In terms of 2015, Pet Supplies are projected to increase 4.3% to $16.58 B. At the end of 2014 there was some indication that this segment might be pulling out of the deflationary spiral. However, 2015 has drops in both January and February CPIs. The decrease was a little less than in 2014 so I mitigated my projection to -0.8%.

Now onto the Service Segments – First NonVet Services.

2014Sales7

OBSERVATIONS

  • Growth
    • Annual Growth rate 7.69%
    • Inflation – a little high, but doesn’t seem to be slowing consumer purchasing
    • 66% “real” growth
  • If price increases continue or accelerate, eventually the consumer will “push back”, but it hasn’t happened yet.

There are no real negatives regarding this segment. It is growing strongly and consistently, especially since 2011. However, it is a small segment, only accounting for 8.6% of the total market.

Here’s how the sales look on a graph:

2014Sales8

2015 sales are projected to be $5.24 B, an 8.3% increase. This seems eminently attainable. In regard to inflation rate, the average annual rate of 2.5% seems like a reasonable estimate for 2015.

The final individual segment is Veterinary Services. This segment accounts for over 25% of the Pet Market and has had strong retail growth but there is one overriding issue.

Let’s take a closer look at the Veterinary Service Segment.

2014Sales9

OBSERVATIONS

  • Retail Growth
    • Up 30.6% since 2009
    • Annual growth rate 4.55%
  • Inflation is the problem
    • Annual average CPI increase 3.45%
  • Price increases account for 75.8% of Retail growth!
  • “Real Sales”
    • Consumers actually bought less in vet services in 2011 and 2012…they just paid more.
    • Sales have been stagnant since 2009 – average annual growth rate 1.07%
    • Even worse since 2010 – average annual growth rate 0.45%

We certainly think of regular veterinary visits as a “need” not a “want”. The extreme inflation over the years finally generated a consumer response in 2011…they cut back on veterinary services, turned to OTC medicines, supplements, treatments and home testing. Pet Health Insurance is growing and there may be fundamental changes in Veterinary Clinics – more chains and groups. Major medical procedures and emergency care will always be needed but steps should be taken within the industry to make regular veterinary care more affordable.

Here’s the graph of sales since 2009:

2014Sales10

Veterinary Services are expected to hit $15.73 B in 2015, a 4.7% increase. Price increases should continue to be the major share of growth. I projected a CPI increase of 3.0%, slightly less than 2014. However, this may be wishful thinking, as prices in February 2015 were already up 1.2% since December 2014.

Now in our final section we’ll go back to the total pet industry.

2014Sales11

OBSERVATIONS

  • Retail Growth expected to reach $60.59B in 2015
    • ↑33.1% since 2009; Annual growth rate 4.88%
  • Inflation: Only 8.6% since 2009; 1.38% annual increase.
  • “Real” Sales are 67% of Total increase

These are the kind of great numbers which attract so many people to the Pet Industry. The retail numbers are also consistently good across the segments. However, when you look a little deeper into “petflation” and the actual amount of goods and services sold, you find that the total industry numbers are generated by two undesirable situations that tend to counteract each other when the numbers are combined. Specifically:

  • Deflation in the Supplies Segment continues. Commoditization, channel migration, consumer value shopping and lack of innovation have created extreme competitive pressure. Consumers are buying more; paying less.
  • Deflation is also now a concern in the Food segment which looks to be on track to have a second consecutive year of falling prices.
  • The Veterinary segment has the exact opposite problem. Years of inflation finally caught up as consumers actually bought less in 2011 & 2012. Overall actual sales have been essentially flat for 5 years and 75% of the increase in Full Retail Sales is due to Price Increases.

2014Sales12

In 2015 the Total Industry is expected to increase 4.2% to $60.59B. It appears that deflation may be even stronger in 2015, possibly producing the lowest CPI increase in history. We need both the deflating and inflating segments to start moving to the middle…..

Finally, to me, the researching and writing of this post certainly reinforced the need for everyone to look below the surface in their business…to understand where the business is coming from and where it may be going.

Pet Stores in the U.S. – A 25 year $ales history – 1987 to 2012

Pet Food and Supplies are sold seemingly everywhere today – 150,000 outlets of all kinds – clothing stores, supermarkets, even gas stations. However, when you look at the beginning of this colossal industry, you must think of the independent pet store as the foundation on which the massive “Pet Skyscraper” was built. We will take a look back to 1987 to see where this channel was and how it has evolved through the years.

The data in this report is courtesy of the U.S. Census Bureau – their Economic Census. The early years have only basic information but since 2002, more detailed information is readily available.

Let’s take a look at some data:

PetStores1
This little chart has a wealth of information but let’s make it a little easier. First with Total $ales:

PetStores2

  • Total Growth: $13.36B (+982.3%); Average annual growth rate = +10.0%
  • Real Growth: $6.83B (+502,2%): Average annual growth rate = +7.4%

Pet Food and Supply prices went up 79.8% from 1987 to 2012. This is an annual inflation rate of 2.4% which is lower than the overall U.S. inflation rate of 2.9%. However, this doesn’t tell the whole story. From 2007 to 2009 Pet Food and Supply prices increased an incredible 17.0%. (8.2% per year). Coming at the onset of the recession, this drove consumers to look for value. The result was that many consumers moved to other channels, resulting in a 15% drop in market share. Food and Supply prices have fallen or at least flattened out since 2009, but the rate of “real” sales growth in Pet Stores has slowed significantly.

No matter how you look at it, the overall sales growth since 1987 has been amazing! Let’s look at some key contributing factors to the retail $ales growth in Pet Stores.

PetStores3

  • 1987 to 1992 – The Number of Pet Stores grows significantly – from 5475 to 7150 (30.8%). The number of employees per store is about the same. Superstores were just getting started so these were mostly traditional stores. The amount of sales per store increases 50% as American’s love for pets truly begins to show. The result – sales basically double in 5 years – to $2.7B.
  • 1992 to 1997 – The initial rise of Superstores. Note the 37.1% increase in employees per store. They are being built and they generate significantly more volume per store – 76.6%. The result – sales more than double in 5 years and now total $5.5B.
  • 1997 to 2002 – Superstores continue to rise but at a cost to the independents. The net result is 692 fewer outlets (-8.3%). The Sales per store increases 50.8% which reflects the higher percentage of superstores. The total channel sales growth slows markedly from the spectacular rate of the previous the 10 years. The result – sales reach $7.6B – an increase of 38.2%.
  • 2002 to 2007 – The channel adds 1156 stores – a 15.2% increase – and reaches a record high number. Most of the new outlets are superstores. The per store sales volume goes up 30.5%, reflecting this change. The result – sales grow 50.3% to $11.4B.
  • 2007 to 2012 – Huge price increases…plus a major recession in this time period. There is no growth in the number of stores, but an even higher percentage are superstores. Sales reach $14.7B. The increase is 29.9%. This is the smallest in 25 years and exactly mirrors the per store sales volume growth. Also consider:
    • The overall pet food and supplies category (in all channels) grew 50% from 2007 to 2012
    • Actual Pet Store Sales from 2007-2012 was only up 7.7% – (Factoring in the huge price increases)
    • The result – Pet Store Sales grew but the channel had a rather a big loss (-15%) in market share.

Now that we have a good overall picture of the growth in the Pet Stores Segment, let’s open the door and go inside. We’ll look at the sales of some major product categories – number of stores, $ales, share of the stores’ total revenue. We’ll see if there is any “internal migration”. Detailed information is available since 1997 so that will be our major focus.

PET STORES: NAICS CATEGORY 45391

PetStores4

Let’s review each of these 6 product categories to see how they have fared from 1997 to 2012. To enhance the visual aspects of the analysis, we will divide them into 2 segments based upon sales volume – major and minor. Pet Foods and Supplies have always generated at least 80% of the receipts in Pet Stores. Here’s what their sales look like since 1997.

PetStores5

Pet Food became the largest category in 2007 and increased its lead in 2012.

  • Sales in 2012 were $6.72B; $4.66B (226.2%) since 1997.

During the same timeframe, overall Pet Store sales were up 167.3% so Pet Food Sales was a major factor in the channel’s growth. The introduction of numerous premium foods probably helped this category take over and hold the number 1 position. Sales of the premium foods were also less likely to be poached by other retail channels.

Pet Supplies was the biggest dollar producing category until Food took over in 2007.

  • Sales in 2012 were $5.16B; $3.1B (150.5%) since 1997.

The rate of growth for Pet Supplies is slightly below the overall channel rate, which is being pushed up by food sales. Growth is slowing in this product category because of the increased retail distribution in competitive channels – especially since the recession. Pet Supplies pricing has actually fallen since 2009, which indicates just how strong the competition is.

Next we’ll look at the “minor” volume product categories including Pets; Fish & Aquarium Products; Pet Care Services; All other NonPet Products. Book sales are bundled in with NonPet sales. Changing technology has depressed all Book Sales. Pet Book revenue in 2012 has actually fallen below 1992’s sales. In this section, changes in the number of outlets offering a product category may become significant.

PetStores6

Pet Sales – This “product” category is what the Pet Industry is all about. Although it should be noted that Dogs and Cats are by far the most popular companion animals and most are not acquired in Pet Stores.

  • Sales in 2012 were $0.36B; Essentially equal to 1997.

If you consider the increase in prices since 1997 (39.8%), the amount of pets being sold is actually down 27.0%. The number of outlets selling live pets has fluctuated up and down but is only down 5% from 1997. The only conclusion is that acquiring pets in pet stores is losing its popularity.

Fish & Aquarium Products – This too was a signature category. Aquariums have always been a mainstay of pet stores.

  • Sales in 2012 were $1.15B; $0.37B (47.4%) since 1997.

Sales dropped sharply in 2002 primarily due to the radical drop in store count. This was a strong growth period for super stores and a lot of independents carrying fish went out of business. Store count and sales bounced back in 2007 but have virtually zero growth since then. Flat sales in a growing market indicate this category has turned downward.

NonPet Products – This category can encompass a lot of ground – clothes, gift cards, hardware…almost always with a pet theme or in some way relating to Pets.

  • Sales in 2012 were $0.2B; $0.05B (33.3%) since 1997.

This is a very minor segment. Considering price increases, it has actually declined since 1997.

Pet Care Services – This puts a retail “face” on services, a fast growing segment of the total Pet Industry.

  • Sales in 2012 were $1.13B; $1.02B (927%) since 1997.

Making pet care services available in Pet Stores makes “total sense” and obviously the consumers have responded. This category contributed 10.8% of Pet Stores’ total increase in sales from 1997 to 2012. Services in Pet Stores grew 54.7% between 2007 and 2012. This was greater than every other category including food and actually greater than the overall Pet Products growth in the entire retail market. Pet Stores lost 5.9 points of market share between 2007 and 2012. Without the strong appeal of in store pet services, the loss may have been greater.

Now let’s try to get a visual of all the movement. The best way to compare these different categories is by looking at their relative share of the total. The following graph shows the market share attained by year for each of the Pet Product categories that we have reviewed. Let’s take a look. Then recap our Pet Store observations.

PetStores7


Here’s where the categories are in 2012 and their change in market share since 1997:

  • Pet Food – 45.7% 8.6 pts
  • Pet Supplies – 35.0% 2.5 pts
  • Aquarium Fish/Products – 7.8% 6.5 pts
  • Pet Services – 7.7% 5.6 pts
  • Pets – 2.4% 4.0 pts
  • NonPet Products – 1.3% 0.8 pts

Summary – 1987 to 2012

The Pet Store Channel has grown spectacularly since 1987, becoming the #1 channel for Pet Products in 1997 and holding that position for over 10 years. Then the recession pushed many consumers to more value conscious channels. Some of the major events in this journey were:

  • Creation and proliferation of Super Stores (provided the broad product selection the consumer demanded)
  • Development of Premium Pet Foods (often limited distribution, helped Pet Stores gain & retain market share)
  • Growth of “in store” Pet Care Services (another “plus” in sales which helps attract consumers to pet stores)
  • Stagnated sales in the Aquarium Fish hobby (still a large category, but the growth seems to have stopped)
  • Decline in the purchases of live pets (Not the largest source of Dogs and Cats, but birds, reptiles and small animals)
  • Growth of the internet (provides an even better selection of pet items than stores…and at a better price)
  • Major Recession in 2008 – 2009. (which brought to the forefront the retail pricing in the channel)
  • Radically Increased Competition as Pet Products are available in Outlets doing 47% of total U.S. retail.

Pet Stores, with 33.8% of the market currently hold the #2 position behind the total of All General Merchandise Stores. However, they are still the single biggest individual retail channel segment, with a substantial lead over SuperCenter/Clubs at 24.1%.

What does the future look like for Pet Stores? They are not significantly adding outlets and they are being attacked on all sides by SuperCenters/Clubs, The Internet, Supermarkets and even $ Value stores, who provide varying benefits of value, convenience and in the case of the internet, even wider selection.

The key for Pet Stores is the “personal” nature of pets. People are called “pet parents” for a reason. Pet Stores can and should provide the most personal experience for their customers. How many other outlets allow you to bring your pet into the store…actually try on a harness…sample a treat? Where else can you find a knowledgeable person to talk to about any issues that you’re having? However, they must also respond to the competition…a website, with online ordering (and in store pickup option); take a hard look at margins; run strong, well timed promotions – bundled and/or cross segment; use displays; develop or maximize a loyalty program with consumer specific deals and other  technological advances; conduct regular category management reviews to identify trends and maximize productivity; actively search for and add new products that give a “real” enhancement to the lives of Pets and their “parents”. It’s a battle for the consumer’s hearts and minds…and their Pet $. You must constantly fight hard to get and keep your share.

Pet Product Sales In U.S. Retail Channels – The “migration of pet parents”

Pets, Pet Food and Supplies sales have shown tremendous retail growth since 1992. According the Economic Census just published by the U.S. Census Bureau, retail sales totaled $40.47 Billion in 2012 – up from $8.2 Billion in 1992. The spectacular growth was fueled by Americans’ growing love and commitment to their pets. Over 60% of U.S. Households have a pet – twice as many as have a child under 18.
While the love was growing in our hearts, the sales of pet products were growing at retail. It was not a simple journey –straight to the top. It involved expansion to a variety of different outlets and consumer migration between channels driven by their search for value, convenience and selection.
In this report we will use detailed data from the Economic Census which is published in 5 year increments.
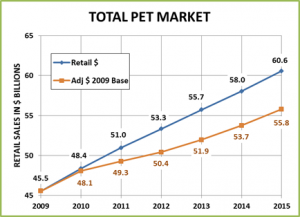
Here is a visual look at the growth since 1992. I have also included a line on the graph which is adjusted for “petflation” and gives us a better indication of the actual increase in the amount of product sold.

PetMigration-2-1

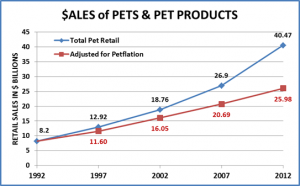
  1. Total Growth 1992 to 2012
    • Up $32.27 Billion (+394.8%)
    • Average Annual Growth Rate = 8.3%
  2. Real Growth 1992 to 2012 (Adjusted for price changes – Pet Food & Supplies CPI)
    • Up $17.78 Billion (+216.8%)
    • Average Annual Growth Rate = 5.9%

NOTE: Most of the growth (71.1%) in Pets, Pet Food and Supplies has been real growth. Pet Products Prices increased 55.8% in 20 years compared to an increase of 64.7% in the Total U.S. CPI and a 62.4% increase in Total Pet Pricing in JUST the last 15 years.

Increased Pricing in Pet Products was an issue from 2007 to 2009 when prices jumped 17% in just two years, in the heart of the recession. In the overall Retail Market, consumers bought less and started searching strongly for value. This was a key waypoint in the migration of Pet Product consumers.

We’ll stay with the total market and look at some key factors that have affected the overall growth since 1992

PetMigration-2-2 
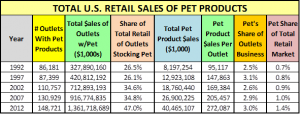
Here’s how each factor changed during the 4 – five year measurements since 1992.

PetMigration-2-3

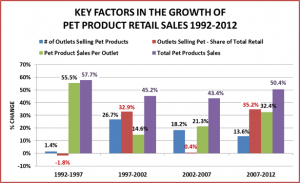
1992 to 1997 – No growth in outlets or in retailers’ share of overall market. The big growth was increased store volume due to increased consumer product demand – which was filled by expanded departments and bigger pet stores.

1997 to 2002 – A 27% increase in number of outlets and a 15% increase in per store volume push sales up 45%. A huge increase in the representation of Pet in the overall market as it now is available in stores doing over 35% of total retail.

2002 to 2007 – Store count continues to grow – up 18% and the per/store volume goes up even faster – +21%. Sales are up 43%. The overall Retail Market Share of outlets selling products remains stable at 35%.

2007 to 2012 – Another 18,000 stores (+14%) and a huge increase in per store volume (+32.4%). Consumers have started shopping intensely for value since the recession…and they found it as sales increased 50%. It was also easier to find products in a store, as outlets doing 47% of the total U.S. Retail market stocked pet supplies in 2012.

1992 to 2012 – Sales Now $40 B; Up $32B (+394%)

  • 148,000 “pet” outlets; Up 60,000 (+72.6%)
  • Outlets stocking “pet” do 47% of U.S. Retail
  • Pet Products do 3% of an outlet’s total sales
  • Pet Products now 1.4% of total Retail; 0.7% in 1992

These facts sound like a fairy tale. There is obviously a lot of success to go around. Let’s see how the consumers decided to divide it up. We’ll take a look at the share of pet products sales by retail channel.

PET PRODUCTS SALES AND MARKET SHARE BY RETAIL CHANNEL

The following chart shows the shows in detail the number of outlets, total pet product sales and market share of the retail channels and segments stocking pet products from 1992 to 2012. Use it as a reference point. Additional graphs and observations will follow.

PetMigration-2-4

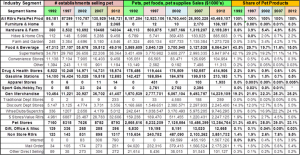
99.1% of Pet Products Sales are done by 6 major Retail Channels. Let’s look at their market share from 1992 to 2012.

PetMigration-2-5

Observations

Drug and Health Stores – This is the smallest of the 6 channels – in Pet Product sales. In overall retail sales, the drug channel has consistently grown in market share. As far as pet products are concerned, their market share dropped steadily from 1992 to 2007. They made a bit of a comeback in 2012, more than doubling their sales and almost doubling their market share. The result – their 2012 market share is still less than half of 1992. In terms of Pet Products, the sales are basically impulse or convenience purchases.

Hardware and Farm – Early growth came from the Farm Store segment. Hardware jumped on board in 2002 and pushed the market share up to 5.4%, capturing 40% of this channel’s pet business. Between Hardware and Farm, there have been some ups and downs, but overall the market share has been basically flat since 2002.

Food and Beverage – Supermarkets account for 98% of the business in this channel. In 1992 Supermarkets were the #1 Pet channel, with 42.1% of the business. They increased their business 9.5% in 1997. Unfortunately for them, overall “Pet” sales took off – up 55%. Their market share fell 30%. Sales stagnated in 2002 and actually dropped in 2007. Needless to say their market share continued to plummet – down 73% from the 1992 high. Where did the business go? – just about everywhere else, but primarily to General Merchandise Stores and Pet Stores. Then from 2007 to 2012 they executed a remarkable turnaround.  The number of Supermarkets carrying pet products increased by over 70%. They more than doubled their pet sales and gained back 3.6 points in market share.

Nonstore Retailers – This channel includes both mail order and the internet. Their share of pet sales in this channel almost exactly mirrors their share of total retail market sales. However, the increases in pet have been truly astronomical. Sales in 2012 are 40 times what they were in 1992. Market share is up 745%. Since 2007 most of the growth is being fueled by the internet – sales have tripled. There seems to be no direction but up.

Pet Stores – In 1992 Pet Stores were the second largest retail channel selling pet products. The category caught fire. Big Box Pet Super Stores were developed and built to offer the consumer the wider selection that they sought. In 1997 Pet Stores moved into the #1 position with a 40.5% share of the business. The proliferation of Super Stores resulted in the closing of a number of smaller Independents so the number of stores and market share dipped slightly to 38.0% in 2002. They were still #1 but now they were being strongly pursued by General Merchandise Stores – not Supermarkets.  More Super Stores, along with a continued high consumer demand, brought their market share back up to 39.0% in 2007. They had maintained the #1 status with a market share of 38 – 40% for over 10 years. Then…the recession happened and consumers became focused on value. Their store count was the same and sales grew but their market share fell 5.9 points (-15.1%). On the surface, it appears that the bulk of the business went to Grocery and Internet/Mail-order but almost every major channel and a few minor players got a piece of their lost share.

Minor Players – Although their combined market share is under 1%, the widespread appeal of Pets has brought in retailers from a variety of other “Specialty” channels – Home Goods (Furniture), Value Clothing Stores, Toys, Sporting Goods, Gift…to name a few. Although their selection is generally limited, they do broaden the consumer availability of certain pet product categories in the overall U.S. Retail Market. The success or failure of their venture into the Pet Products world is usually dependent upon the overall success of the individual retailer. If they are attracting consumers and their business is growing, then they may have some success with Pet. After all it appeals to 60+% of U.S. households.

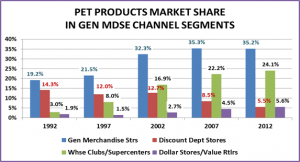
General Merchandise Stores – Currently the #1 Channel in Pet Products sales. It enjoyed strong to spectacular growth from 1992 to 2007. The number of outlets grew from 10K to 37K (+250%); sales grew $8B to $9.5B (+533%); market share grew from 19.1% to 35.3% (+83.9%). From 2007 to 2012, the number of outlets continued to grow and sales increased to $14.2B (+49.5%) but their market share actually fell 0.1%…Yet, they still took over the #1 position in Pet…by just matching the overall market increase. This is a large and complex channel and deserves a closer look.

PetMigration-2-6

Traditional Department Stores – Although they do 10% of this channel’s overall business, they are basically a nonentity in Pet Products. These stores have consistently loss market share as they have done little to meet the consumer’s changing “needs” – including failing to recognize and embrace the Pet Phenomenon in the U.S.

Discount Department Stores – This segment is the one that started the decline in traditional Department Stores. In terms of Pet Market Share, these stores were at their peak in 1992. The commitment to SuperCenters and the rise of Club Stores started their decline. Sales continued to increase until 2002 and there was even a little uptick in market share between 2002 and 2007. Since then, retail sales have basically been flat and the number of outlets has fallen. In 2012 they were surpassed by the Dollar/Value stores in Pet Products’ market share.

SuperCenters & Warehouse Club Stores – This segment has shown consistent, even spectacular growth and in every measuring period has surpassed even the impressive growth of the overall Pet Products market. They rank#2 behind Pet Stores in sales. While their overall Retail Market Share has flattened out, their Pet business has continued to go up.

$ Stores/Value Retailers – This channel was originally occupied by 5&10¢ Stores. They faded and were replaced by these Value Retailers. Since 1997, the store count and Pet Product sales have gone up dramatically. Their appeal and their share of the total market has grown markedly since the recession. In Pet, their store count is second only to Supermarkets and their sales and market share just passed Discount Department stores. Expect continued growth.

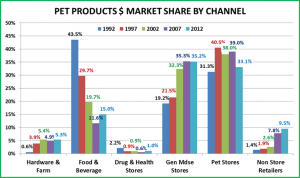
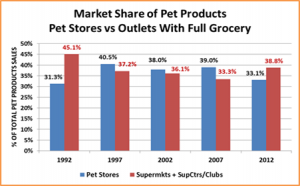
One Last Chart before the recap – Take a look at the chart below and think about this. In 1992 the largest share of Pet Products was bought by consumers where they shopped for groceries. In 2012, have we come full circle?

PetMigration-2-7

   Summary

In the case of Pet Products consumers, “migration” is not truly the best description. Pets improve the health and quality of life of their “parents”. They bring hours of enjoyment. The love of Pets in America and in fact, worldwide is “contagious”. It has reached “epidemic” proportions with pets residing in over 60% of U.S. Households.

Why should the retail trade be immune? They too caught the “pet fever” early and it has spread – rapidly. In 1992, Pet Products were carried in 80,000 outlets doing 26% of the total U.S. Business. In 2012…it was 150,000…and 47%. Not only are Pet Products more widely available, but their importance has grown. In 1992 Pet Products represented 0.7% of Total U.S. Retail sales. In 2012 it was double…1.4%.

In terms of “big” migrations between channels over the period, there are really only two.

  1. The big move from Supermarkets to General Merchandise and Pet Stores which occurred from 1992 to 2007. (Note: Supermarkets bounced back in 2012, recapturing some of their lost share)
  2. The meteoric rise of internet/mail-order –recently driven primarily by the internet

Here’s the 2012 market share by Channel: (Arrows show if they are up , down and by how much in share from 2007)

  • GM Strs – 35.2% ↓0.1
  • Pet Stores – 33.1% ↓5.9
  • Food & Bev (Groc) – 15% ↑3.4
  • Internet/Mailorder – 9.5% ↑1.7
  • Hdwe & Farm – 5.3% ↑0.4
  • A/O Incl. Drug – 1.9% ↑0.5

From 2007-12, the only real loser was Pet Stores and their share was picked up primarily by Grocery and the Internet.

Now let’s look at the individual segments in terms of 2012: (Same rules as above)

  • Pet Stores – 33.1% ↓5.9
  • SuperCtrs/Club – 24.1% ↑1.9
  • Supermkts – 14.7% ↑3.6
  • $ Value Strs – 5.6% ↑1.1
  • Disc Dept Strs – 5.5% ↓3.0
  • Mail-order – 5.4% ↓0.4
  • Internet – 3.9% ↑2.1
  • Farm – 3.1% ↓1.1
  • Hardware – 2.2% ↑1.5
  • Drug – 1.0% ↑0.4
  • Gas/Convenience – 0.8% ↓0.3
  • Furniture/Home – 0.3% ↑0.3

As you can see, the story is a bit more complex. There are ups and downs within major channels. The big losers are Pet Stores and Discount Department stores. Their market share is being picked up by Supermarkets, the Internet, SuperCenters/Clubs and the $ Value Stores. The loss in Farm was picked up by Hardware, in the same Channel.

Value, Convenience and Selection – Sorry for the redundancy, but these are the drivers of the U.S. consumer…and since the recession, Value has moved strongly to the forefront.

Pet Super Stores grew rapidly because they offered an unparalleled, broad selection of products in a category that was exploding. They had sales and frequent buyer clubs, but quite frankly some of the highest gross margins in U.S. retail. When the recession hit, price became a big issue and many consumers looked elsewhere.

Where did they go? What commodity does the consumer shop for most often and as regular as clockwork – groceries. They went to the Super Centers and Supermarkets. Both of these channels are very competitive for value, have expanded their pet section and offer the convenience of getting your pet needs while doing your regular grocery shopping. Note: Club Stores don’t have the selection but they do have great everyday pricing and a full grocery section.

Want a bigger selection…. Go on line. No one can build a store big enough to stock the selection of products available on line…and with no brick and mortar overhead…you can get great value. Plus, you can shop for the best price and get what you want without ever leaving your easy chair…talk about convenient. The only downside is immediate need. However, they are working deals on same day and next day delivery, possibly even delivery by drones. This segment will grow.

Want your product now at a great price but don’t feel like fighting the crowds, $/Value Stores are the answer. Great everyday prices plus brand name “close outs” in a small footprint store that is easy to navigate. This segment has “caught on” with the U.S. consumer and is gaining market share in pet and in the overall retail market.

At this point, Pet Products have spread across the U.S. retail landscape. There is no wholesale mass migration. However, there is definite movement between channels and segments. Moreover, there are individual retail winners and losers in every segment. It is totally dependent upon how well they are filling the consumers’ needs, which we all know are….

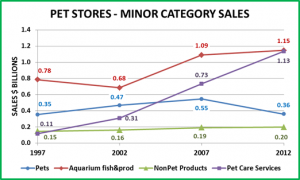
In our final post in this series: we’ll look at sales in Pet Stores from 1987 to 2012.

Retail Channel Migration in the U.S. – Consumers are on the move!

We are all familiar with the reality of migration in the world around us. Massive flocks of birds fly south for the winter. Huge herds of herbivores migrate across the plains of Africa. Much of the population of North America came as a result of migration from other parts of the world. Why? The reason is ultimately the same – both people and animals were seeking survival, opportunity…a better way.

On a smaller stage, consumers exercise the same behavior in the “Retail World”. They “migrate” between retail channels to find a better answer for their “consumer needs”. Thankfully, it is generally not a matter of survival but rather:

  1. Value = Quality + Price (*Note: In some cases value can be filling an emotional need. This could even be a matter of “prestige” or fad and is often short-lived)
  2. Convenience – In today’s hectic world any product or type of outlet that makes life or shopping easier has a strong appeal.
  3. Selection. – Regardless of product category, Americans want choices.

The change can also be the result of technological advances. There is no doubt that computers, the internet and ultimately smart phones have literally changed the environment that we live in and have radically affected consumer behavior.

As I researched this article, I was stunned by the changes in my lifetime.

  • Department stores were “it” when I was young. Sears, Macy’s, J.C. Penny’s and regional chains like Marshall Fields – This is where America shopped. In 1977 Department stores accounted for 10.7% of all retail sales in the U.S. – including Auto, restaurants and gas stations – everything. They had the highest per store volume – $8.7M – of any retail activity. In 2013, their share of retail was less than the $ Stores – incredible.
  • Speaking of $ stores, 50 years ago there were 5 and 10¢ Stores. Ben Franklin, W.T. Grant, Woolworths – this is where I bought comic books and greeting cards. Remember Walmart started out as a Ben Franklin store and morphed into…
  • I also remember in the 1970’s there were over 60,000 independent drug stores. Then came the rise of regional chains which became consolidated into a few national chains. In between, someone got the idea of putting a pharmacy in supermarkets…and clubs…and SuperCenters (another brilliant idea). The result is that there are about 3 national drug chains and still 20,000 independent stores. However, the indies are all in markets with a population of under 20,000.

You get the idea. We’ll take a look at the migration of the U.S. consumer between channels. We won’t go back 50 years – just to 1992. The data is courtesy of the U.S. Census Bureau.

First, let’s look at the whole retail pie, before we see how it is sliced up! The Total U.S. Retail market in 2013 was over $5 Trillion. For this study, I have cut out certain segments which don’t relate to most consumer products, especially Pet Food and Supplies. I have removed Auto Vehicle Dealers and Parts stores, Restaurants and Gas Stations. The result is still huge – $3 Trillion in 2013 and is conducive to more valid comparisons. I also put in a line which is adjusted for price changes – up 64.7% since 1992.

Migrate-1

  1. Total Growth 1992 to 2013
    • Up $1.76 Trillion (+141.9%)
    • Average Annual growth rate = +4.3%
  2. Real Growth 1992 to 2013 (Adjusted for price changes – CPI)
    • Up $.57 Trillion (+46.0%)
    • Average Annual growth rate = +1.8%

You can see that more than half of the growth comes from increased prices. The buying power of the 2013 Dollar was 60.7% of the 1992 Dollar.

The Adjusted “line” gives a “behind the scenes” picture, especially regarding the major recession. Total Retail sales didn’t drop until 2009. However, you can see that the problem started 2 years earlier when the amount purchased in 2007 was just equal to 2006. Consumers actually started buying less in 2008, not 2009.

In terms of recovery, the “real” recovery didn’t occur until 2013, when we finally got back to the level of purchases made in 2006 and 2007. This took 6 years…not 2 years, which is the time frame for full retail $.

We also had a flat spot in 2001, when price adjusted sales just matched 2000. Thankfully, sales started a slow rise again in 2002.

Now that we have the overall picture, let’s take a look at the individual channels.

The chart below shows 10 key channels and their share of the U.S. Retail Market in 1992, 2002 and 2013. The data is available annually but we have pared it down to make it a little more digestible and still show any migrating trends.

Note: Channels can actually increase sales but lose market share because they are not keeping up with the overall marketplace. Share seems to be the best way to look at the competition for the U.S. Retail $.

Migrate-2

There will be observations about each of the channels in the chart. However, consider the top 3…

  • In 1992 – Grocery, Gen Merchandise, Hdwe & Farm
  • In 2002 – Grocery, Gen Merchandise, Hdwe & Farm – The same order, but a battle for #1.
  • In 2012 – Gen Merchandise, Grocery, Internet/Mail-order- GM edges out Groc for #1; Internet/Mail comes out of nowhere and knocks out Hdwe & Farm to win the “bronze”.

Now let’s look at the trends in the individual channels.

TRENDS IN KEY U.S. RETAIL CHANNELS 1992 > 2013

  • Clothing and Accessory Stores – They have lost 14% in market share in a slow decline since 1992. This has flattened out and they have actually gained some traction since the recession. This is being driven by the Value Clothing Stores like T.J. Maxx, Marshall’s and Ross. They actually have dipped their toes into Pet on a limited basis.
  • Electronic and Appliance Stores – This channel reached its peak in the years surrounding the Millennium. Many of their products are now being poached by different channels. The recent bankruptcy of Radio Shack does not bode well for this segment.
  • Furniture & Home Furnishings – After 10 years of market share gains, this channel lost momentum and sales turned sharply downward during the recession. Current market share is being maintained due to home products stores like Home Goods, Bed Bath & Beyond, etc.
  • Sporting Goods, Hobby, Book & Toy – Overall, this channel is headed down. Technological changes have seriously hurt books stores. Toys retailers have seen their products commoditized and deflating prices have caused consumers to migrate to other channels – SuperCenters, Discount/Value Stores and the internet. Sporting Goods stores are the only bright spot. They account for 83% of the sales in this channel and have actually increased their small market share by 16% since 1992.
  • Miscellaneous Stores – This is a mixed bag which includes gift, office supply and Pet Stores. Pet represents about 20% of the total outlets. This Channel actually reached its peak market share in 1997 and has been falling ever since. Sales and share both turned sharply down since the recession. We take a closer look at Pet Stores in a separate report on the specific migration of Pet Products.
  • Hardware & Farm Stores – This Channel had steady growth until 2005 when sales flattened out, then turned down during the recession. The Farm segment has shown recent strength and has stopped the downward slide of the whole channel.
  • Drug and Health – This channel had steady growth until it reached its peak in 2009, at the depth of the recession. It then fell slightly and has essentially flattened out. About 60% of this channel’s sales come from Rx sales so it is much more dependent on 1 commodity than other channels.
  • Internet & Mail-order – A true success story. Steady growth in sales and share, year after year. Driven by the internet, this channel has taken market share from most segments with its combination of value and selection. Grocery is probably the least affected as food is not a major category…yet. It has been especially hard on “specialty” retailers in a myriad of product categories.
  • Food & Beverage – This channel is almost all grocery with Supermarkets the vast majority of the business. This channel has been #1 since they began these surveys…until 2013, when it was edged out by General Merchandise stores. The drop since 1992 has been precipitous – 31.3%. Where did all these consumers go? The only other channel which gained that much was the internet…and they didn’t go there. The answer is they went to other Supermarkets – SuperCenter/Club stores are general merchandise stores which include a full service Supermarket.
  • General Merchandise – This segment is now the largest channel in the U.S. Retail Market…yet is remarkably steady – flat in share since 2002 – up only 8.5% since 1992. This is a more complicated situation and requires a closer look.

Let’s take a look “inside” the General Merchandise Channel to specifically see what’s happening.

Migrate-3

  • Traditional Department Stores – This channel has consistently lost market share every year, 71% since 1992…and an astounding 88% since 1977. In 2013, their share dropped below the $/Value Stores. This would have been beyond comprehension back in 1977.
  • Value Dollar Stores – This segment began as the 5 & 10¢ Stores then a few years ago morphed into the current Value Store Concepts. They have a small market share – about 2%, but it has started to grow, up 17% since 2007. Most of this gain has occurred since the recession as consumers look for value in a store with a convenient “footprint”.
  • Discount Department Stores – This is the channel that started the Department Stores on their decades long fall. They actually reached their peak in 1995 and have been dropping ever since. Their market share has dropped more than 50% since 1997.
  • SuperCenters/Clubs – Both of these stores combine a Supermarket with a Discount Store. They offer Value and in the case of SuperCenters, a large selection. Consumers must shop for groceries and bundling this with a wide array of general merchandise items has resulted in a 337% increase in market share. Where did the Supermarket business go – right here. Of note, these stores peaked in market share in 2009 and have remained flat or down slightly – about 0.1%, for 4 years.

Overall – This channel has only 1 success story. SuperCenter/Clubs gained 10.8 points in market share since 1992. The other segments are down 9.1 pts. The Value/Dollar Stores have turned upward since 2007…but overall the net gain in the channel is only 1.7 pts in market share.

Summary

Like the natural world, the U.S. Retail market is a complex environment with every retailer competing for the same nourishment – the consumer $. Here is a brief summary of our analysis of the migration of the consumer within the U.S. retail market over the past 20+ years and the current situation.

The biggest channels are:

  • General Merchandise
  • Grocery
  • Internet/Mail-order

The ranking may change but these should remain the top 3 for the foreseeable future.

In terms of retail segments, the big consumer winners since 1992 are:

  • The Internet/mail-order – Still moving up – driven by internet – no signs of the growth slowing.
  • SuperCenters/Clubs – Big but has stopped gaining ground since 2009.

The “small” winners, at least in the current market, are listed below. With the exception of Drug Stores, the others are usually the only positive segment in channels which are trending down.

  • Drug Stores – have gained through the years but have limited range in product mix.
  • Farm Stores – have shown recent strength and is the largest of these small segments.
  • Value/$ stores – the only Gen Mdse store segment actually gaining market share.
  • Sporting Goods stores – small market share but gaining…slowly.
  • Home Goods stores – the only + in the Furniture/Home channel
  • Value Clothing stores – a positive in the sixth largest channel.

Up and then down – Hot product categories generated a “wealth” of “big box” specialty stores in Electronics, Media, Books, Office, Toys, Home, Pet… Technological changes and the allure of Super Centers and the internet have lessened their consumer appeal and in some cases virtually killed these outlets. Big Box Retailers require high levels of consumer store traffic to prosper…or even to survive.

Admittedly, this is a somewhat oversimplified view. There are still individual losers in winning segments and winning retailers in fading segments. We can identify the trends but it comes down to how well the retailer fulfills the consumers’ needs – Value, Convenience and Selection. The great recession has caused Value to come to the forefront. At the same time, technological changes – the internet and smart phones – have made the consumers more knowledgeable and given them a new shopping option.

Sometimes the consumer migration between channels has an even larger impact on society. Consider:

  • Indoor shopping malls had become a major gathering place. They were invariably “anchored” by department stores. With department stores fading, whole malls are shutting down.
  • Perhaps the single smartest “recent” decision in U.S. Retail was the commitment to build Super Centers. However, grocery items have incredibly low margins. Expanding discount stores to accommodate a huge amount of low margin items required the retailers to push the general merchandise suppliers for radical price reductions. These reductions were often not possible with U.S. manufacturing costs so they looked first to Mexico and ultimately to the Far East in order to stay on the shelf – a big impact on the whole world.

Consumer migration is ongoing and always evolving. Retailers must recognize the “drivers” and be prepared to adapt to better meet consumer needs.

In our next post: we’ll look at the retail migration of U.S. Pet Parents.


Attending Global Pet Expo 2015? – What’s your plan?

There are over 1070 exhibitors at Global Pet Expo 2015 and the show is “open” for 26 hours. Let’s “Do the Math!” If you don’t stop to chat with anyone in the aisles or for food, a drink or to go to the bathroom, don’t attend any classes…and allow no time for walking, you can spend about 1 and half minutes with each exhibitor…Perhaps you need a plan…??

For many of us, Orlando is a nice escape from the winter weather. However the primary purpose for attending GPE or any industry event must be to improve your business.

[box]With 1070+ Exhibitors you have 1½  minutes for each, if you don’t eat, drink, go to a class, go to the restroom or allow time for walking….You may need a plan!

[/box]

Of course, you should take the time to visit the new product area, sign up for helpful classes, network with other industry professionals and walk the whole show. When you walk the show, the strength and enormity of our growing industry will be readily apparent.

Every business can improve in terms of products. If you are a retailer, what sections of your store are not doing as well as you hoped and need a “facelift” or conversely, what areas are growing and need products to fill additional space? Category managers are only interested in visiting exhibitors relevant to their “categories”. Representatives also may be looking for new manufacturers…in specific product categories. Manufacturers could be looking to find distributors to handle their products or just looking to “check out” the competition. In regard to products, there is always something…for everyone!

The Pet Industry is widespread across Retail America with over 150,000 outlets selling Pet Products – including 72 of the largest 100 retail chains in the U.S. This huge base generates a huge variety of needs…both immediate and long term.

Last year I designed a tool in Excel, the Super Search Exhibitor Visit Planner to make “working SuperZoo” easier and more productive for ALL attendees – retailers, distributors, reps, groomers, vets…even exhibitors. I have updated all the data and made a “tool” specifically designed for GPE 2015.

  • From the simplest…”just give me a list that I can look at on my phone or tablet quickly in either Booth # order or alphabetically”
  • To the most complex…”can do a simultaneous search for multiple specific product categories, allowing me to personally narrow down the initial results and see the “final” alphabetically or in booth number order”.

The GPE Super Search Exhibitor Visit Planner does both…and more…and does it quickly!

There is a download link below for the GPE Super Search tool as well as one for the instructions. The instructions are fundamentally unchanged from last year. However, I recommend that you read them and print them out for reference during your initial search. They are 4 pages long. Before you get “turned off” about the length of the instructions, take a look at some of the instructions you have around the house. My vacuum cleaner – 11 pages; coffee maker – 21 pages; garage door opener – a novel. Instructions are by necessity long, even when the actions are pretty simple

If you are going to GPE 2015 – Plan your Work! Work your Plan! It will pay big dividends to your business!…and the GPE Super Search can help!

Download the files and get “planning” right now!

5cat_using_computer

[button link=”https://pmud8a.a2cdn1.secureserver.net/wp-content/uploads/2015/02/GPESuperSearch2015EXHIBITOR-VISIT-PLANNER-Instructions.pdf” type=”icon” newwindow=”yes”] Download Instructions (PDF)[/button]

(To save the PDF to your computer Right Click the download link and select “Save Link As…”)

imgDL_01

[button link=”https://pmud8a.a2cdn1.secureserver.net/wp-content/uploads/2015/03/GPE-2015-SuperSearch-3-01-15.xlsm” type=”icon” newwindow=”no”] Download SuperSearch (Excel)[/button]


[box type=”shadow”] In my next post, we’ll start to look at the “migration” of the U.S. consumer between retail channels. [/box]