
Retail Channel $ Update – March Monthly & April Advance
In April, YOY Commodities’ inflation rose to 4.6% from 3.4%. Growing current inflation rates or just high cumulative inflation vs 21 can both impact consumer spending and slow $ales growth. We saw evidence of this in April. Total Retail $ were +4.6% vs 25, 1.7% below the average 92>25 lift. However, Relevant Retail was +5.0%, 7.3% above the April avg. The situation is definitely complex and there is still a long road to full recovery. We’ll continue to track the retail market with data from 2 reports provided by the Census Bureau and factor in a targeted CPI.
The Census Bureau Reports are the Monthly and the Advance Retail Sales Reports. Both are derived from sales data gathered from retailers across the U.S. and are published monthly at the same time. The Advance Report has a smaller sample size so it can be published quickly – normally, 2 weeks after month end. The Monthly Report includes data from all respondents, so it takes longer to compile the data – about 6 weeks. Although the sample size for the Advance report is smaller, the results over the years have proven it to be statistically accurate with the Monthly reports. The biggest difference is that the full sample in the Monthly report allows us to “drill” a little deeper into the retail channels.
We will begin with the March Monthly Report and then go to the April Advance Report. Our focus is comparing to last year but also 21 & 19. We’ll show both actual and the “real” change in sales as we factor inflation into the data.
Both reports include the following:
- Total Retail, Restaurants, Auto, Gas Stations and Relevant Retail (removing Restaurants, Auto and Gas)
- Individual Channel Data – This is more detailed in the Monthly reports, and we’ll focus on Pet Relevant Channels.
The data will be presented in detailed charts to facilitate visual comparison between groups/channels. The charts will show 11 separate measurements. To save space they will be displayed in a stacked bar format for the channel charts.
- Current Month change – % & $ vs previous month
- Current Month change – % & $ vs same month last year and vs 2021.
- Current Month Real change vs last year and vs 2021 – % factoring in inflation
- Current Ytd change – % & $ for this year vs last year, 2021 & 2019.
- Current Ytd Real change % for this year vs last year and vs 2021 and 2019
- Monthly & Ytd $ & CPIs for this year vs last year and vs 2021 which are targeted by channel will also be shown. (CPI Details are at the end of the report)
First, the March Monthly. All were up from February and there was only 1 actual sales drop – monthly vs 25 in Auto. We should note: Gas Stations are selling a little less product than in 2019. Also, Relevant Retail is all positive again. They’ve been all positive in 22 of the last 24 months. ($ are Not Seasonally Adjusted)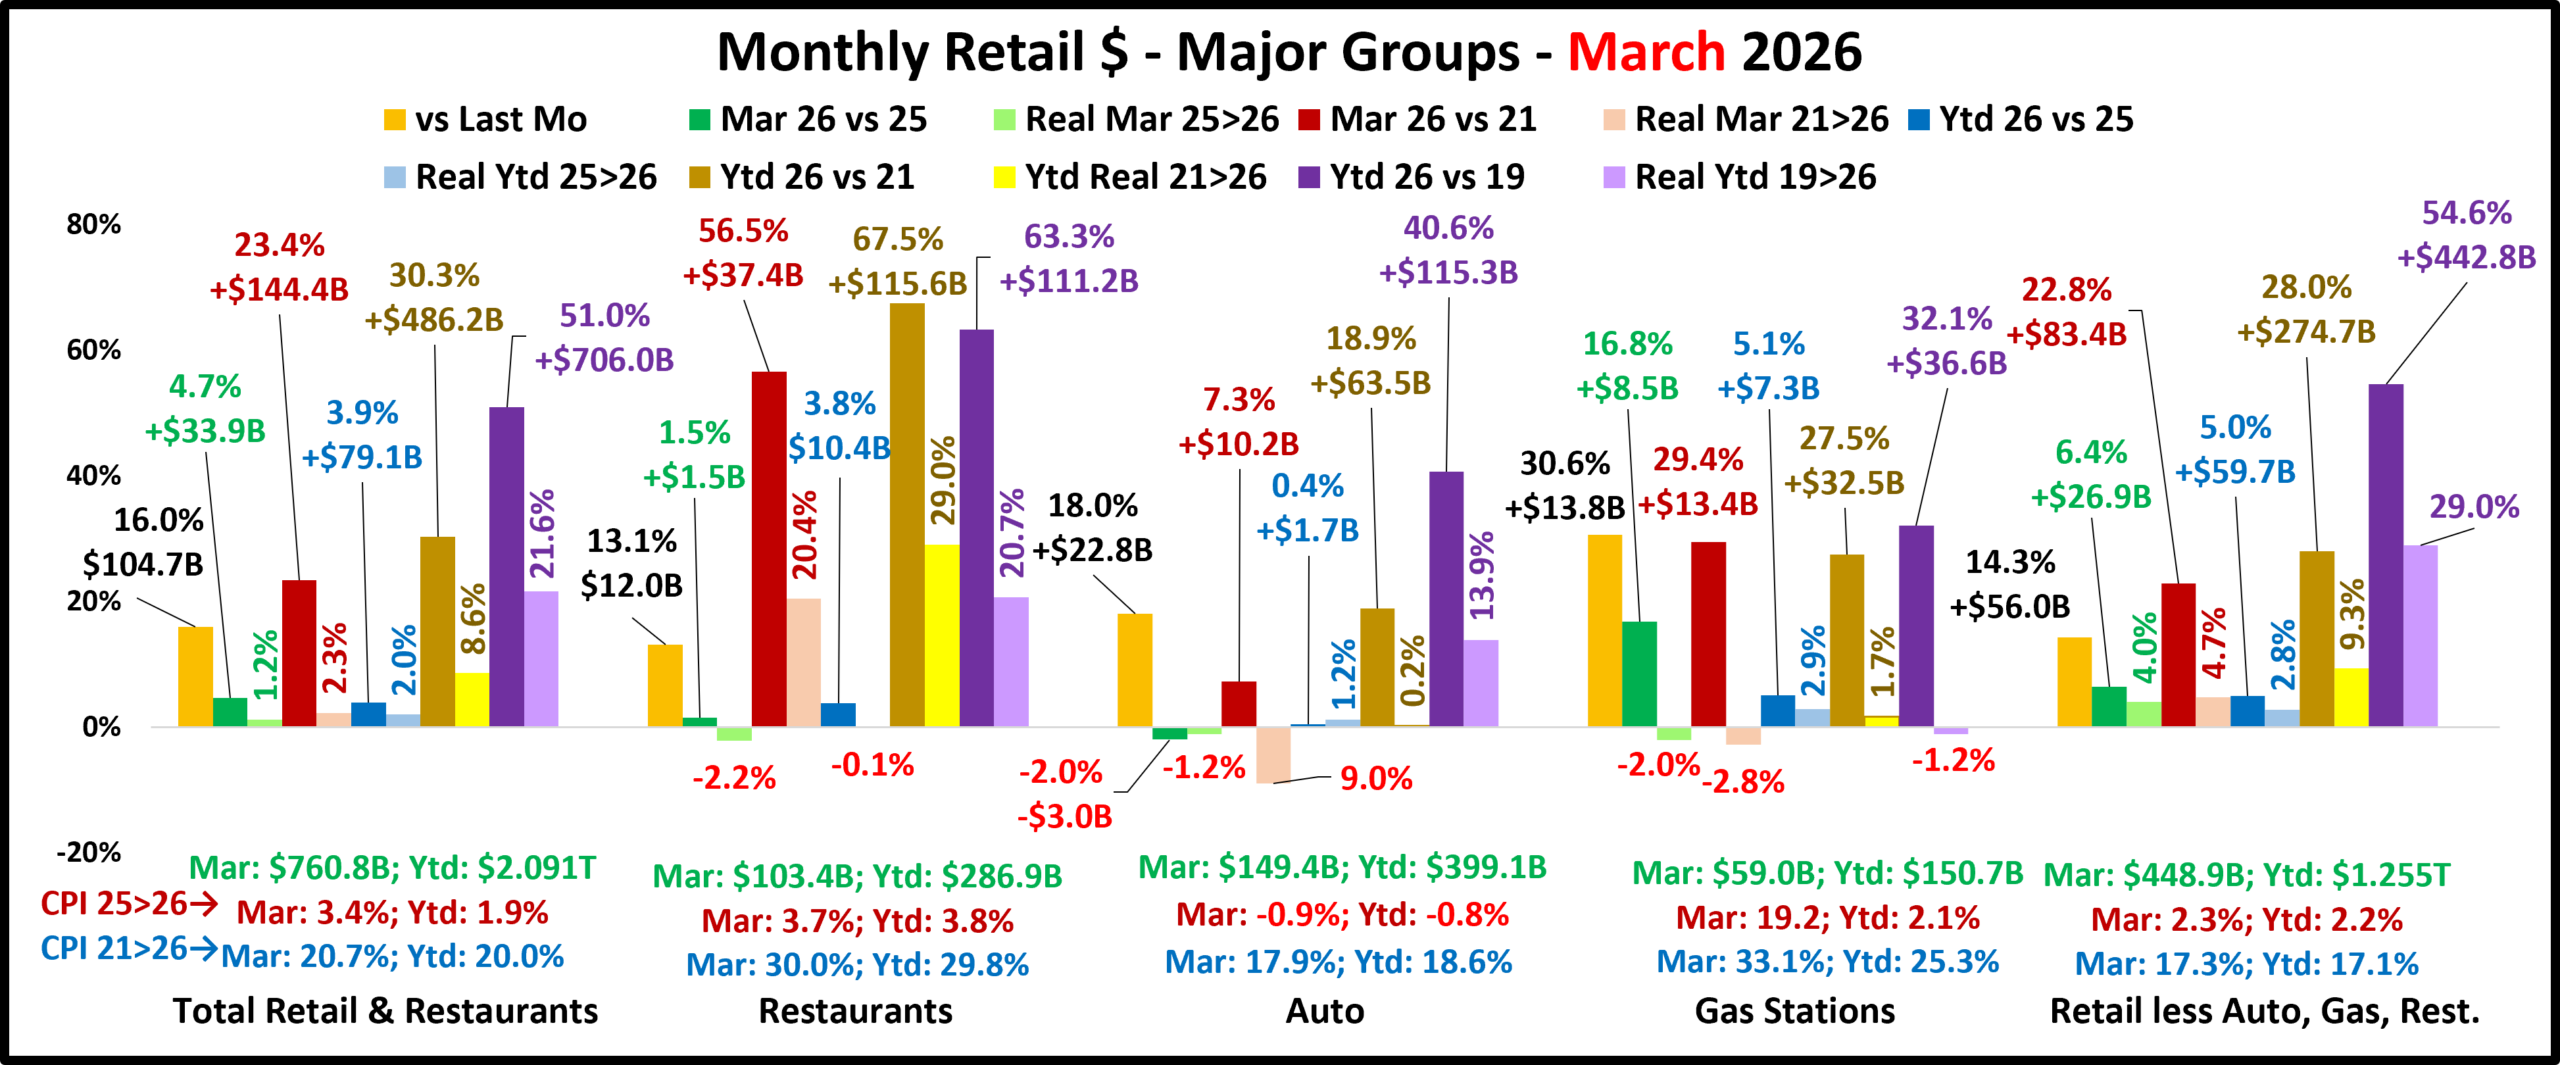
The March Monthly is $1.2B more than the Advance report. Restaurants: -$0.1B; Auto: +$0.5B; Gas Stations: -$0.8B; Relevant Retail: +$1.5B. Every group had a double digit % increase in the $ales lift vs February. A Feb>Mar increase in Total Retail has happened in every year but 2020 since 1992. Plus, the 16.0% lift was 16.6% more than the 13.7% avg. There was 1 drop in actual sales – Monthly vs 25 for Auto. There were 7 “real” sales drops. In Dec>Feb there were none. Only 2 groups were all positive, down from 4 in Feb. Restaurants still have the biggest increases vs 21 & 19 but Relevant Retail stayed at the top of “real” performance vs 2019. However, only 53.1% of their growth is real.
Now, let’s see how some Key Pet Relevant channels did in March in the Stacked Bar Graph Format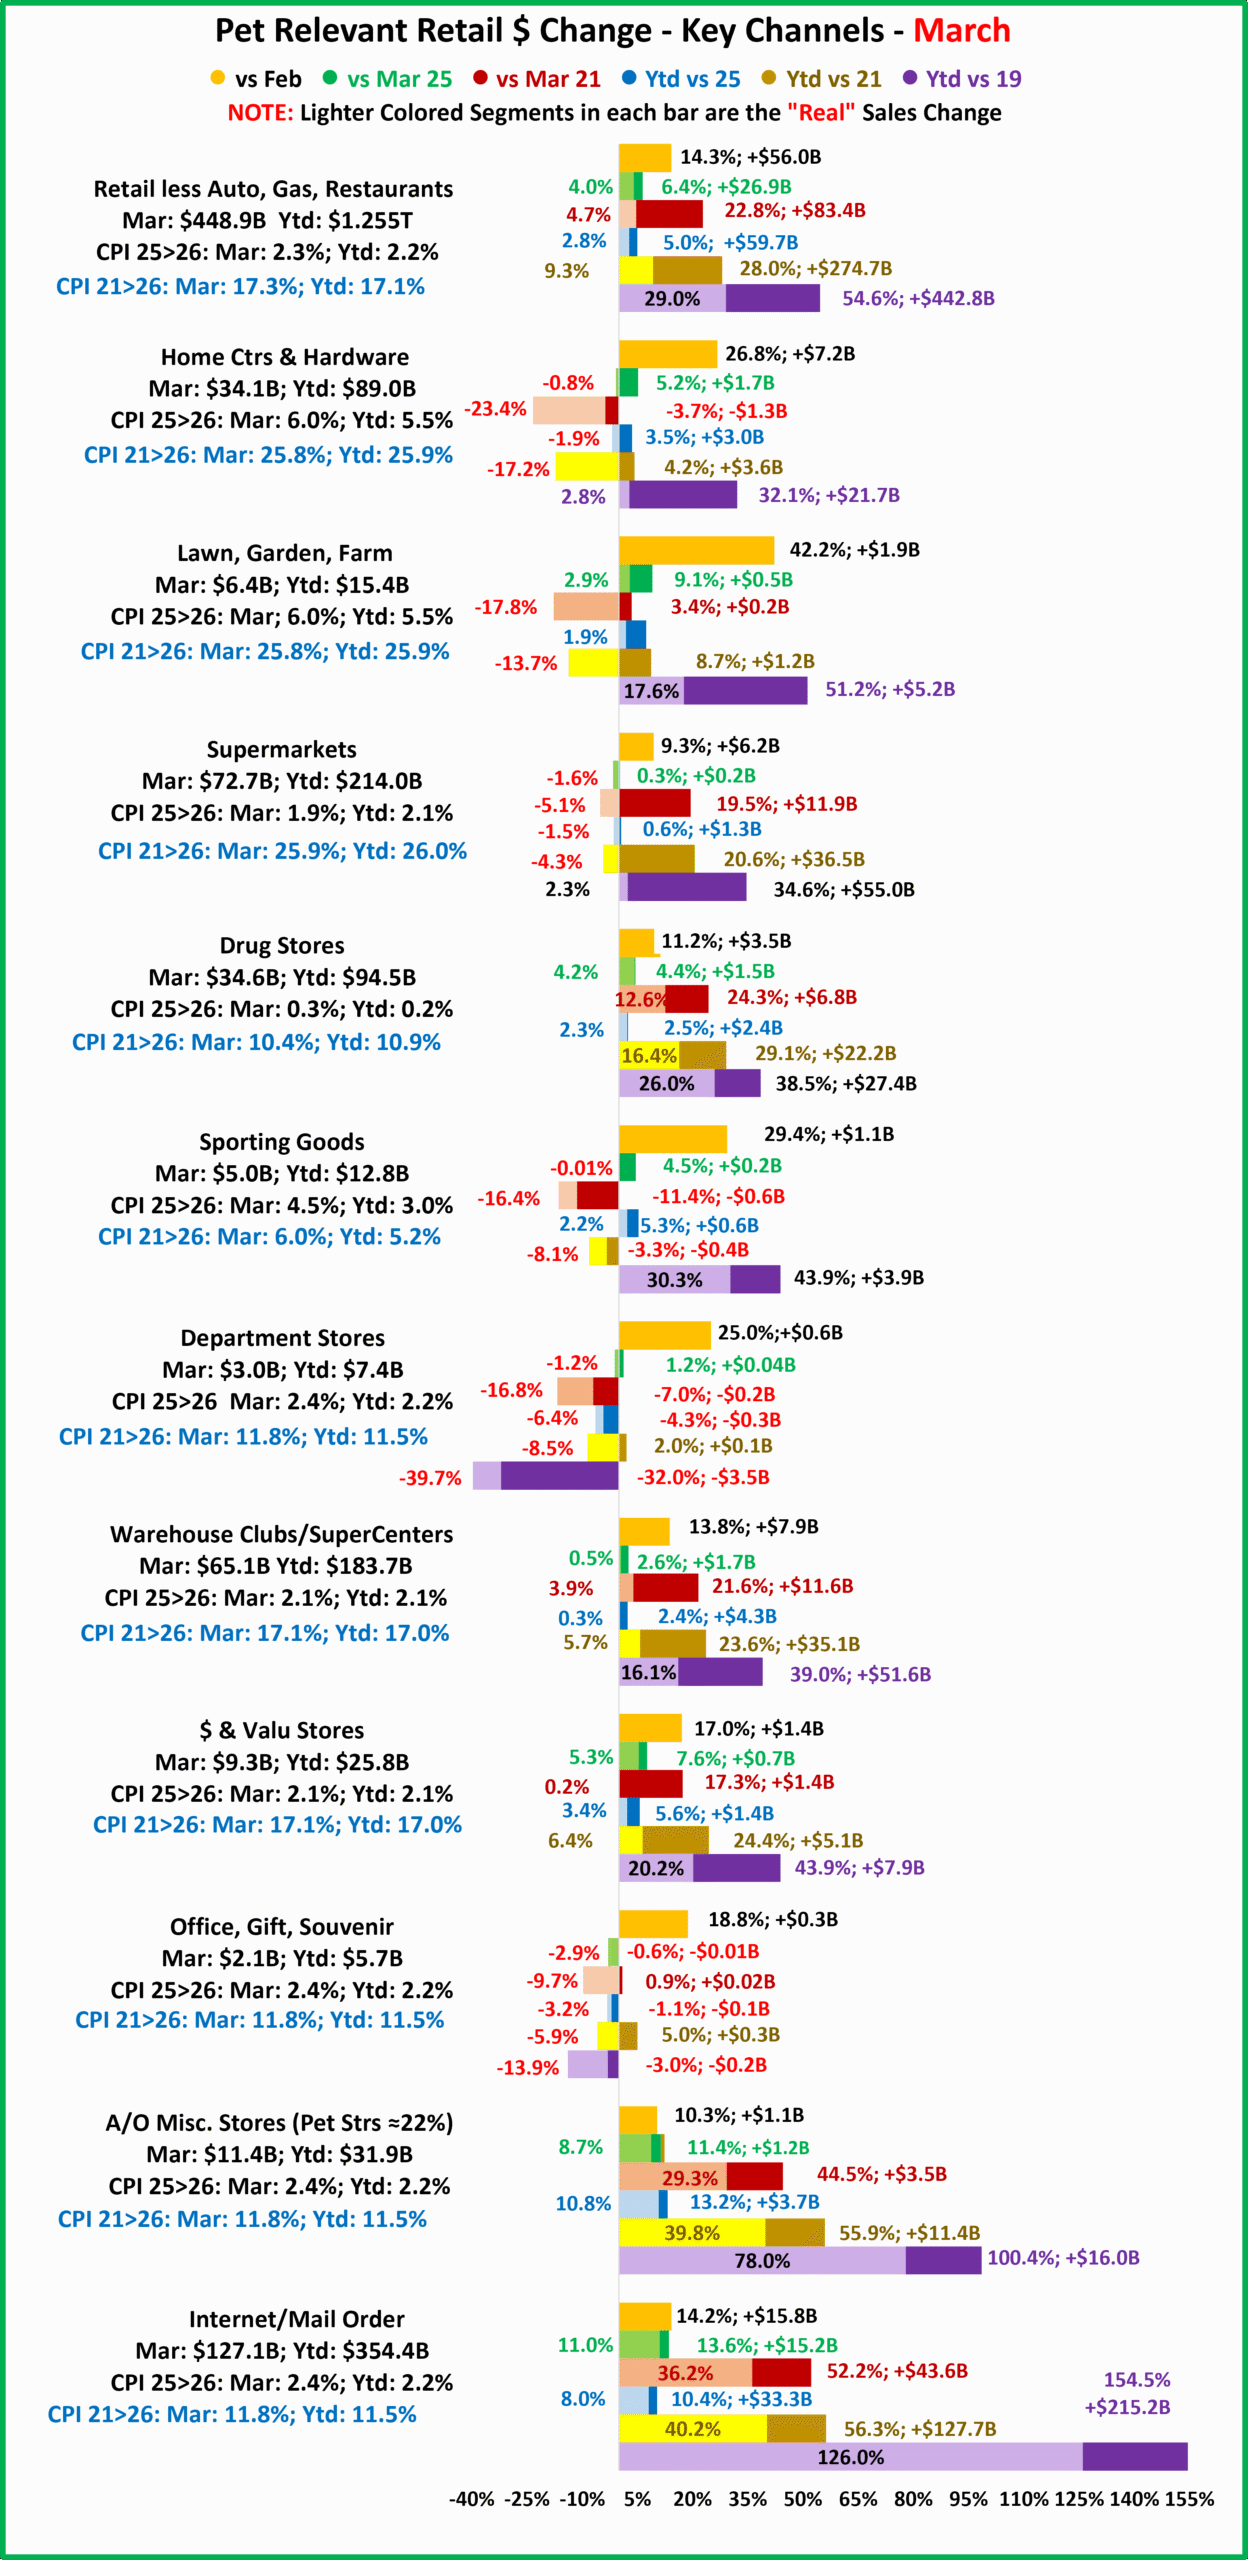
Overall– All 11 were up from Feb. Vs Mar 25, 10 were actually and 6 “really” up. Vs Mar 21, 8 were up but only 5 were real lifts. Vs 2019, Only Dept Strs & Off/Gift/Souv were actually & really down.
- Building Material Stores – The pandemic focus on home has produced $ growth of 35.2% since 2019. Prices for the group are +25.8% from 21 and +29.1% from 2019, which is impactful. With a Spring lift, HomCtr/Hdwe Sales vs Feb were +26.8% and +42.2% for Farm. Vs other years, HomCtr/Hdwe are actually up & really down for all but 2019 & vs Mar 21. Farm stores are actually up for all, but their Real $ were down vs 21. Bldg Mat’s 19>26 real growth was 5.1%. avg: 0.7%. HomeCtr/Hdwe: Ytd: 3.5%; Avg 19>26 Growth: 4.1%, Real: 0.4%; Farm: Ytd: +7.4%; Avg: 6.1%, Real: 1.9%.
- Food & Drug – Both are essential. Except for the COVID food binge, they tend to have smaller changes in $. Vs Feb: Supermarkets: +9.3%; Drug: +11.2%. In terms of inflation, the Groceries rate is 6.3 times higher than Drug/Med products. Drug Stores are positive in all measurements and 67.5% of their 2019>26 growth is real. Supermarkets’ actual $ are up in all comparisons, but they are only “really” up vs 2019. Plus, only 6.6% of their 19>26 increase is real growth. Supermarkets: Ytd: +0.6%; Avg 19>26: +4.3%, Real: +0.3%; Drug Stores: Ytd: +2.5%; Avg: +4.8%, Real: +3.4%.
- Sporting Goods Stores – They also benefited from the pandemic in that consumers turned to self-entertainment, especially sports & outdoor activities. Sales are +29.4% from Feb, but they are actually & really negative vs 21 and real vs Mar 25. Prices stopped deflating vs last year. Deflation started in April 23 and was a big change from +1.1% in 22>23 & +7.9% in 21>22. This caused 69% of their 44% lift since 2019 to be real. Ytd: 5.3%; Avg 19>26: +5.3%; Real: +3.8%
- Gen Mdse Stores – $ vs Feb: SupCtr/Club; +13.8; $ Strs: +17.0%; Dept Strs: +25.0%. All YOY comparisons were up for $ Strs & SupCtr/Club. Dept Stores are negative for all but actual vs Mar 25 & Ytd vs 21. Their Actual sales are even -32.0% from 19 (real:-39.7%). The other channels have an average of 41.9% in real growth. SupCtr/Club: Ytd: +2.4%; Avg 19>26: 4.8%, Real: 2.2%; $/Value Strs: Ytd: +5.6%; Avg: +5.3%, Real: +2.7%; Dept. Strs: Ytd: -4.3%; Avg: -5.4%, Real: -7.0%.
- Office, Gift & Souvenir Stores– Sales are +18.8% from Feb. They are actually up Mar/Ytd vs 21. All others are down. Their recovery started late. It was slowly restarting in Jun/Jul, but their progress had slowed. It took off in Oct, slowed in Nov, grew in Dec, then slowed in Jan>Mar. Recovery takes some time. Ytd: -1.1%; Avg Growth Rate: -0.4%, Real: -2.1%
- Internet/Mail Order – Sales are +14.2% from Feb to $127.1B, a Mar record. All YOY measurements are positive, but their YOY growth, +10.4%, is only 72.7% of their average since 2019. However, 81.6% of their 154.5% growth since 2019 is real. Ytd: +10.4%; Avg Growth: +14.3%, Real: +12.4%. As expected, they are by far the growth leader since 2019.
- A/O Miscellaneous – Pet Stores are 22>24% of total $. In May 2020 they began recovery which reached $100B for the 1st time in 21. In 22 their $ dipped in Jan, Jul, Sep>Nov, rose Dec, fell Jan>Feb 23, grew Mar>May, fell Jun>Aug, rose Sep>Nov, fell Dec>Jan 24, grew Feb>May, fell Jun>Sep, grew Oct, fell Nov, rose Dec, fell Jan>Feb, grew Mar>May, fell Jun>Sep, rose Oct, fell Nov, rose Dec, fell Jan, rose Feb/Mar. All comparisons are positive, and they are #2 in the increase vs 2019 & vs 2021. Also, 78% of their 100% growth since 2019 is real. Ytd: +13.2%; Avg 19>26: 10.4%, Real: +8.6%
Mar had its usual lift vs Feb, but the Rel Retl lift was 14.8% above avg. All 11 small channels were up. The YOY lift vs 25 was 3% below avg for Total, but 35% above avg for Relevant Retl. 4 big groups & 10 smaller channels had lifts. Also, prices are only deflating in Auto, but cumulative inflation has an impact, as only 5 of 11 channels were really up vs Mar 21. The Recovery is slow. In Apr, the commodities CPI rose from 3.4% in Mar to 4.6%. Let’s see if it impacts Retail.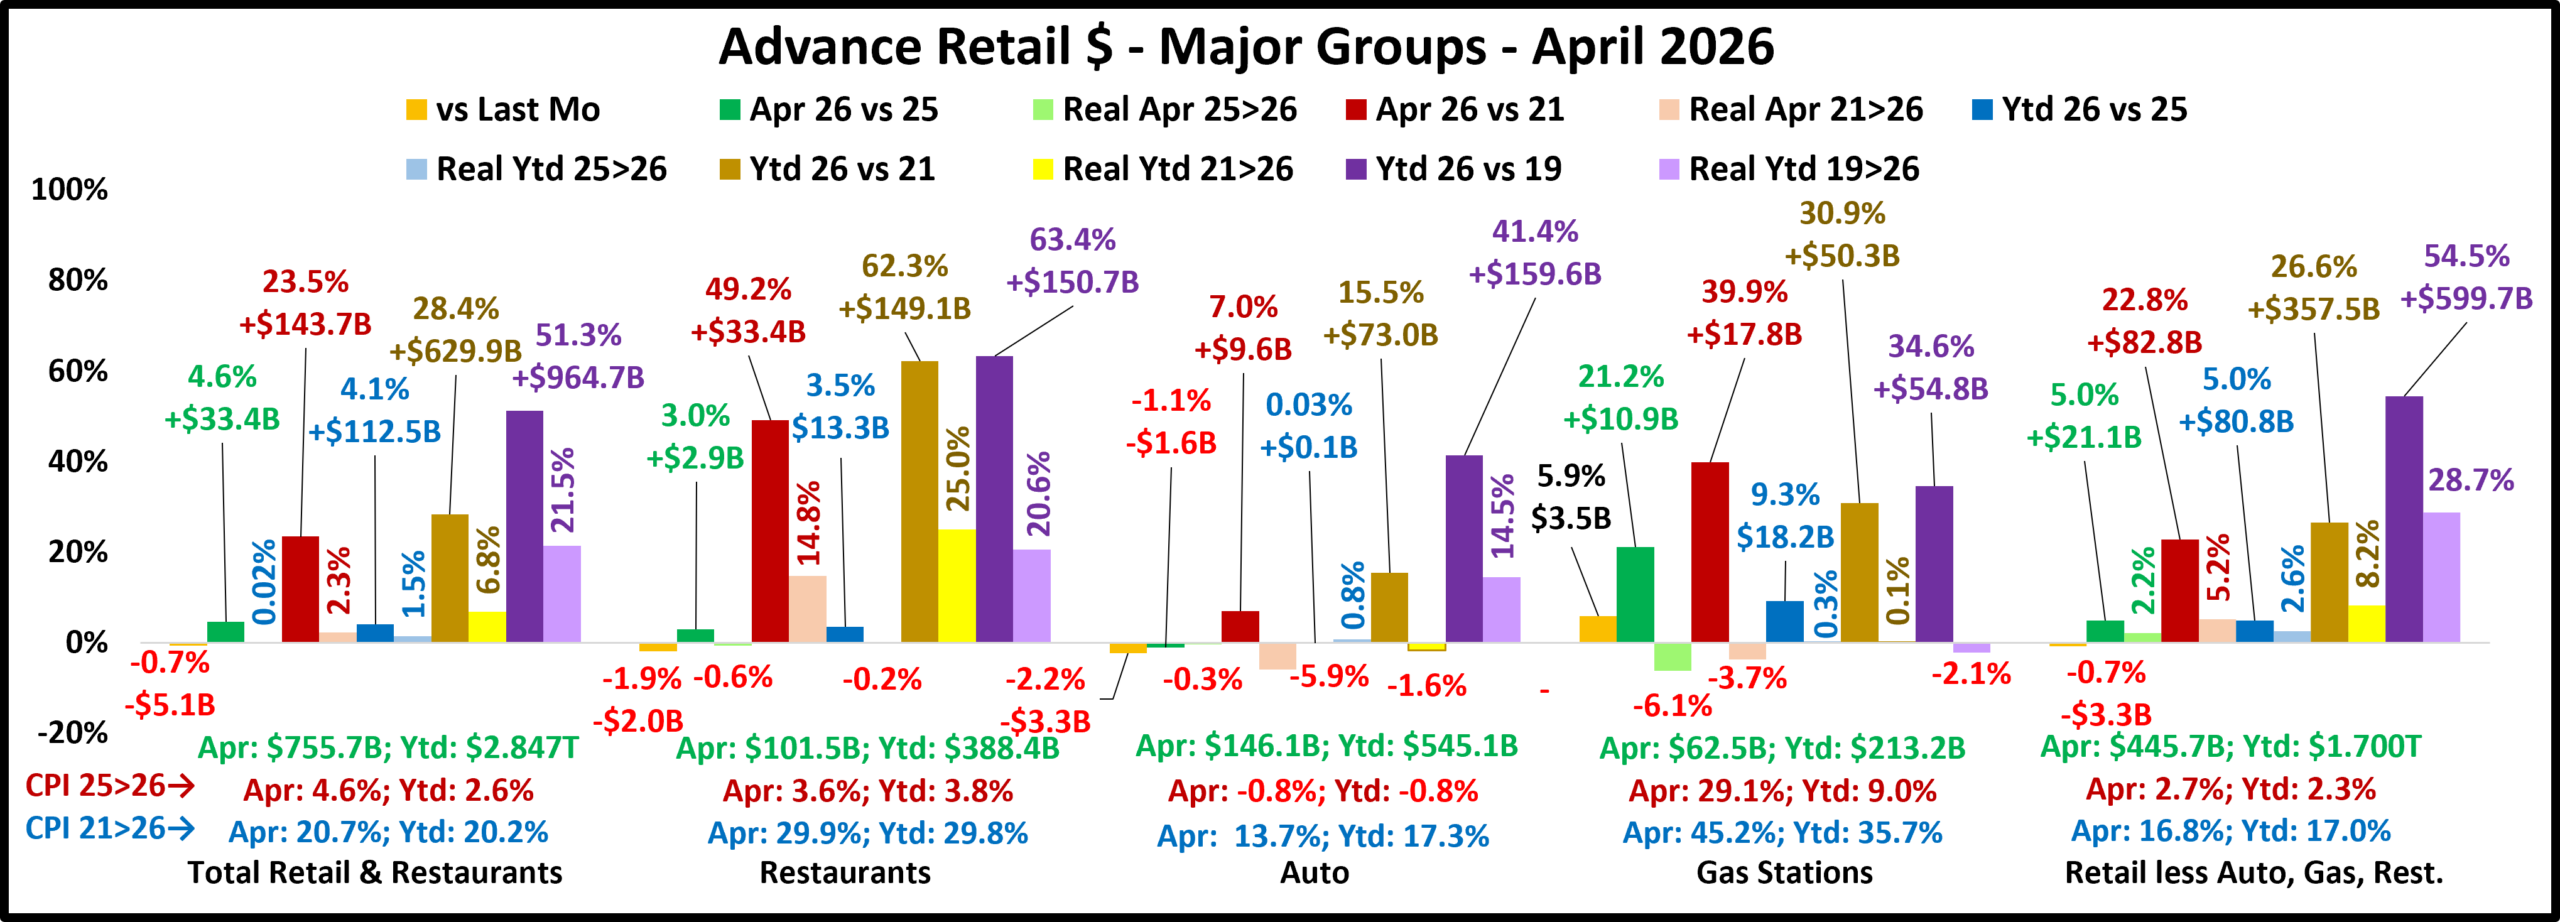
Only Gas Stations had a Mar>Apr lift. A Mar>Apr Total Retail drop has happened in 85% of the years since 1992. The -0.7% drop is 63% less than the -1.8% avg. There was only 1 YOY $ drop, the same as Mar. 4 Big Groups were up vs 25 but the Total Retail lift of 4.6% vs Mar 25 was 1.7% below their +4.7% 92>25 avg. However, the Relevant Retail 5.0% increase vs Mar 25 was 7.3% above their +4.6% avg. Inflation is still a factor. The CPI for all commodities rose to 4.6% from 3.4% in Mar and it is still +20.7% vs 21. There is some bad “real” news. In Jan/Feb, no “real” measurement was down. In Mar there were 7 & in Apr, 8. Plus, Gas Stations are still selling less Gas than in 2019. Also, again only 2 Big Groups are all positive. In Dec>Feb there were 4. Positive Note: Relevant Retail has now been all positive in 23 of the last 25 months.
Overall Inflation Reality– The Total Retail CPI rose to 4.6% and the $ lift vs 25 was 1.7% below avg. The Restaurant CPI slowed to +3.6% but their $ lift was 47.6% below avg. The Gas CPI rose from 18.9% to +29.1%. They are still in turmoil. Auto inflation is -0.8% vs 25 but +13.7% vs 21. Sales were -1.1% vs 25. Their avg change is +4.5%. Inflation rose to 2.7% for Relevant Retail but their lift was 7.3% above avg and they are again all positive. Big Group progress is slow in 2026.
Total Retail – Since Jun 20, every month but Apr 23, Jun 24 & Feb 25 has set a monthly $ record. In 23>26, Sales got on a roller coaster. Up Oct>Dec, down Jan 24, up Feb>Mar, down Apr, up May, down Jun, up Jul>Aug, down Sep, up Oct>Dec, down Jan>Feb 25, up Mar, down Apr, up May, down Jun, up Jul>Aug, down Sep, up Oct, down Nov, up Dec, down Jan & Feb, up Mar, down Apr. Prices are 4.6% and YOY $ are +4.6%, 1.7% below avg. 42% of 19>26 growth is real. CPIs rose, but cumulative inflation may have the biggest impact on sales. Growth: 25>26: 4.1%; Avg 19>26: +6.1%, Real: +2.8%
Restaurants – They were hit hard by the pandemic and didn’t begin recovery until March 2021. However, they have had strong growth since then, exceeding $1T for the 1st time in 2023. Apr $ are up vs 25 and they have the biggest lifts vs 21 & 19. Inflation slowed to 3.6% vs last year, but it is +29.9% vs 21 and +35.5% vs 19. Their 3.0% YOY lift is 47.6% below their +5.6% 92>25 avg. In Mar/Apr they stopped being all positive and in Apr just 32.5% of their 63.4% growth since 2019 is real. They stayed 4th in performance. Recovery started late but inflation started early. Growth: 3.5%; Avg 19>26: +7.3%, Real: +2.7%. They just account for 13.6% of Total Retail $, but their strong growth has helped Total Retail.
Auto (Motor Vehicle/Parts Dealers) – They overcame the stay-at-home attitude with deals & advertising. They finished 2020 up 1% vs 2019 and hit a record $1.48T in 2021 but much was due to high prices. In 22, sales got on a rollercoaster. Inflation started to drop mid-year, but it caused 4 down months in $. Their YE real 22 sales numbers were even worse, -8.2% vs 21 and -8.9% vs 19. 23 started a sales rollercoaster but the $ hit a record, $1.595T. $ fell in Jan 24, grew Feb & Mar, fell Apr, grew May, fell June, grew Jul>Aug, fell Sep, grew Oct, fell Nov, grew Dec, fell Jan>Feb 25, grew Mar, fell Apr>Jun, rose Jul>Aug, fell Sep, rose Oct, fell Nov, rose Dec, fell Jan, rose Feb, fell Mar/Apr. Apr $ were -1.1% vs 25. Avg: 4.5%. Like Mar, Apr is not all positive and just 35% of 19>26 growth is real. Growth: 0.03%; Avg 19>26: +5.1%, Real:+2.0%
Gas Stations – Gas Stations were hit hard by “stay at home”. They started recovery in Mar 21, and inflation began. Sales got on a rollercoaster in 22 but set a record, $583B. Inflation started to slow in Aug and prices slightly deflated in Dec & Feb 23, then strongly fell in Mar>Jul to -20.2%. In Sep they were +2.7% but began deflating to -4.2% in Feb 24. In Mar>May $ grew, fell Jun, rose July, fell Aug/Sep, rose Oct, fell Nov>Feb 25, rose Mar>May, fell Jun, rose Jul, fell Aug>Oct, up Nov, fell Dec/Jan, rose Feb>Apr. Apr $ vs 25: +21.2% (4.4% avg). No $ downs. All real $, but Ytd vs 25 & 21 are down. Growth: +9.3%; Avg 19>26:+4.3%, Real: -0.3%. They show the impact of inflation can be “really” negative.
Relevant Retail – Less Auto, Gas and Restaurants– They account for ≈60% of Total Retail $ in a variety of channels. Their only down month until Feb 25 was Apr 20, and they led the way in Retail’s recovery. Sales got on a roller coaster in 22, but all months set new records with Dec reaching a new all-time high, $481B, and an annual record of $4.81T. In 23, the roller coaster continued. A Dec lift set a new monthly record of $494.7B & an annual record of $4.997T. The roller coaster restarted in 24. The ride continued as $ rose Oct>Jan 25, fell Feb, rose Mar>May, fell Jun, rose Jul, fell Aug & Sep, rose Oct>Dec, fell Jan>Feb 26, rose Mar, fell Apr. The Apr 5% YOY lift is 7.3% above their 92>25 avg of +4.7%. They are all positive again and 53% of their 54.5% 19>26 growth is real, again #1 in performance. Growth: 5.0%; Avg 19>26: +6.4%, Real: +3.7%. In 2024 their inflation rate fell from 3.2% to 0.1%. It rose in 25 to 1.8% in Sep, slowed to 1.5% in Oct>Nov, rose to 2.0% in Dec>Jan, 2.3% in Mar & 2.7% in Apr. YOY Inflation is low, but its cumulative impact can slow growth.
As expected, Apr sales fell vs Mar. Total Retl was -0.7%, 63% below avg; Relevant Retl was -0.7%, 35% below avg. In Apr, 1 actual YOY $ comparison was negative, the same as Mar but 1 less than Dec>Feb. There were 0 real drops in Dec>Feb. In Mar, there were 7. Apr had 8. In Dec, all were up vs last year but only Rel. Retl’s lift was above avg. In Jan, 3 lifts, all below avg. In Feb, 4 lifts, all below avg. In Mar/Apr, 4 lifts, 2 above avg. In Dec>Feb, 4 big groups were all positive. In Mar/Apr, there were only 2. Relevant Retail has now been all positive in 23 of 25 months. YOY inflation is growing, but still relatively low. However, cumulative & impending lifts can also affect sales. Progress is slow.
Here’s a more detailed look at April by Key Channels in the Stacked Bar Graph Format
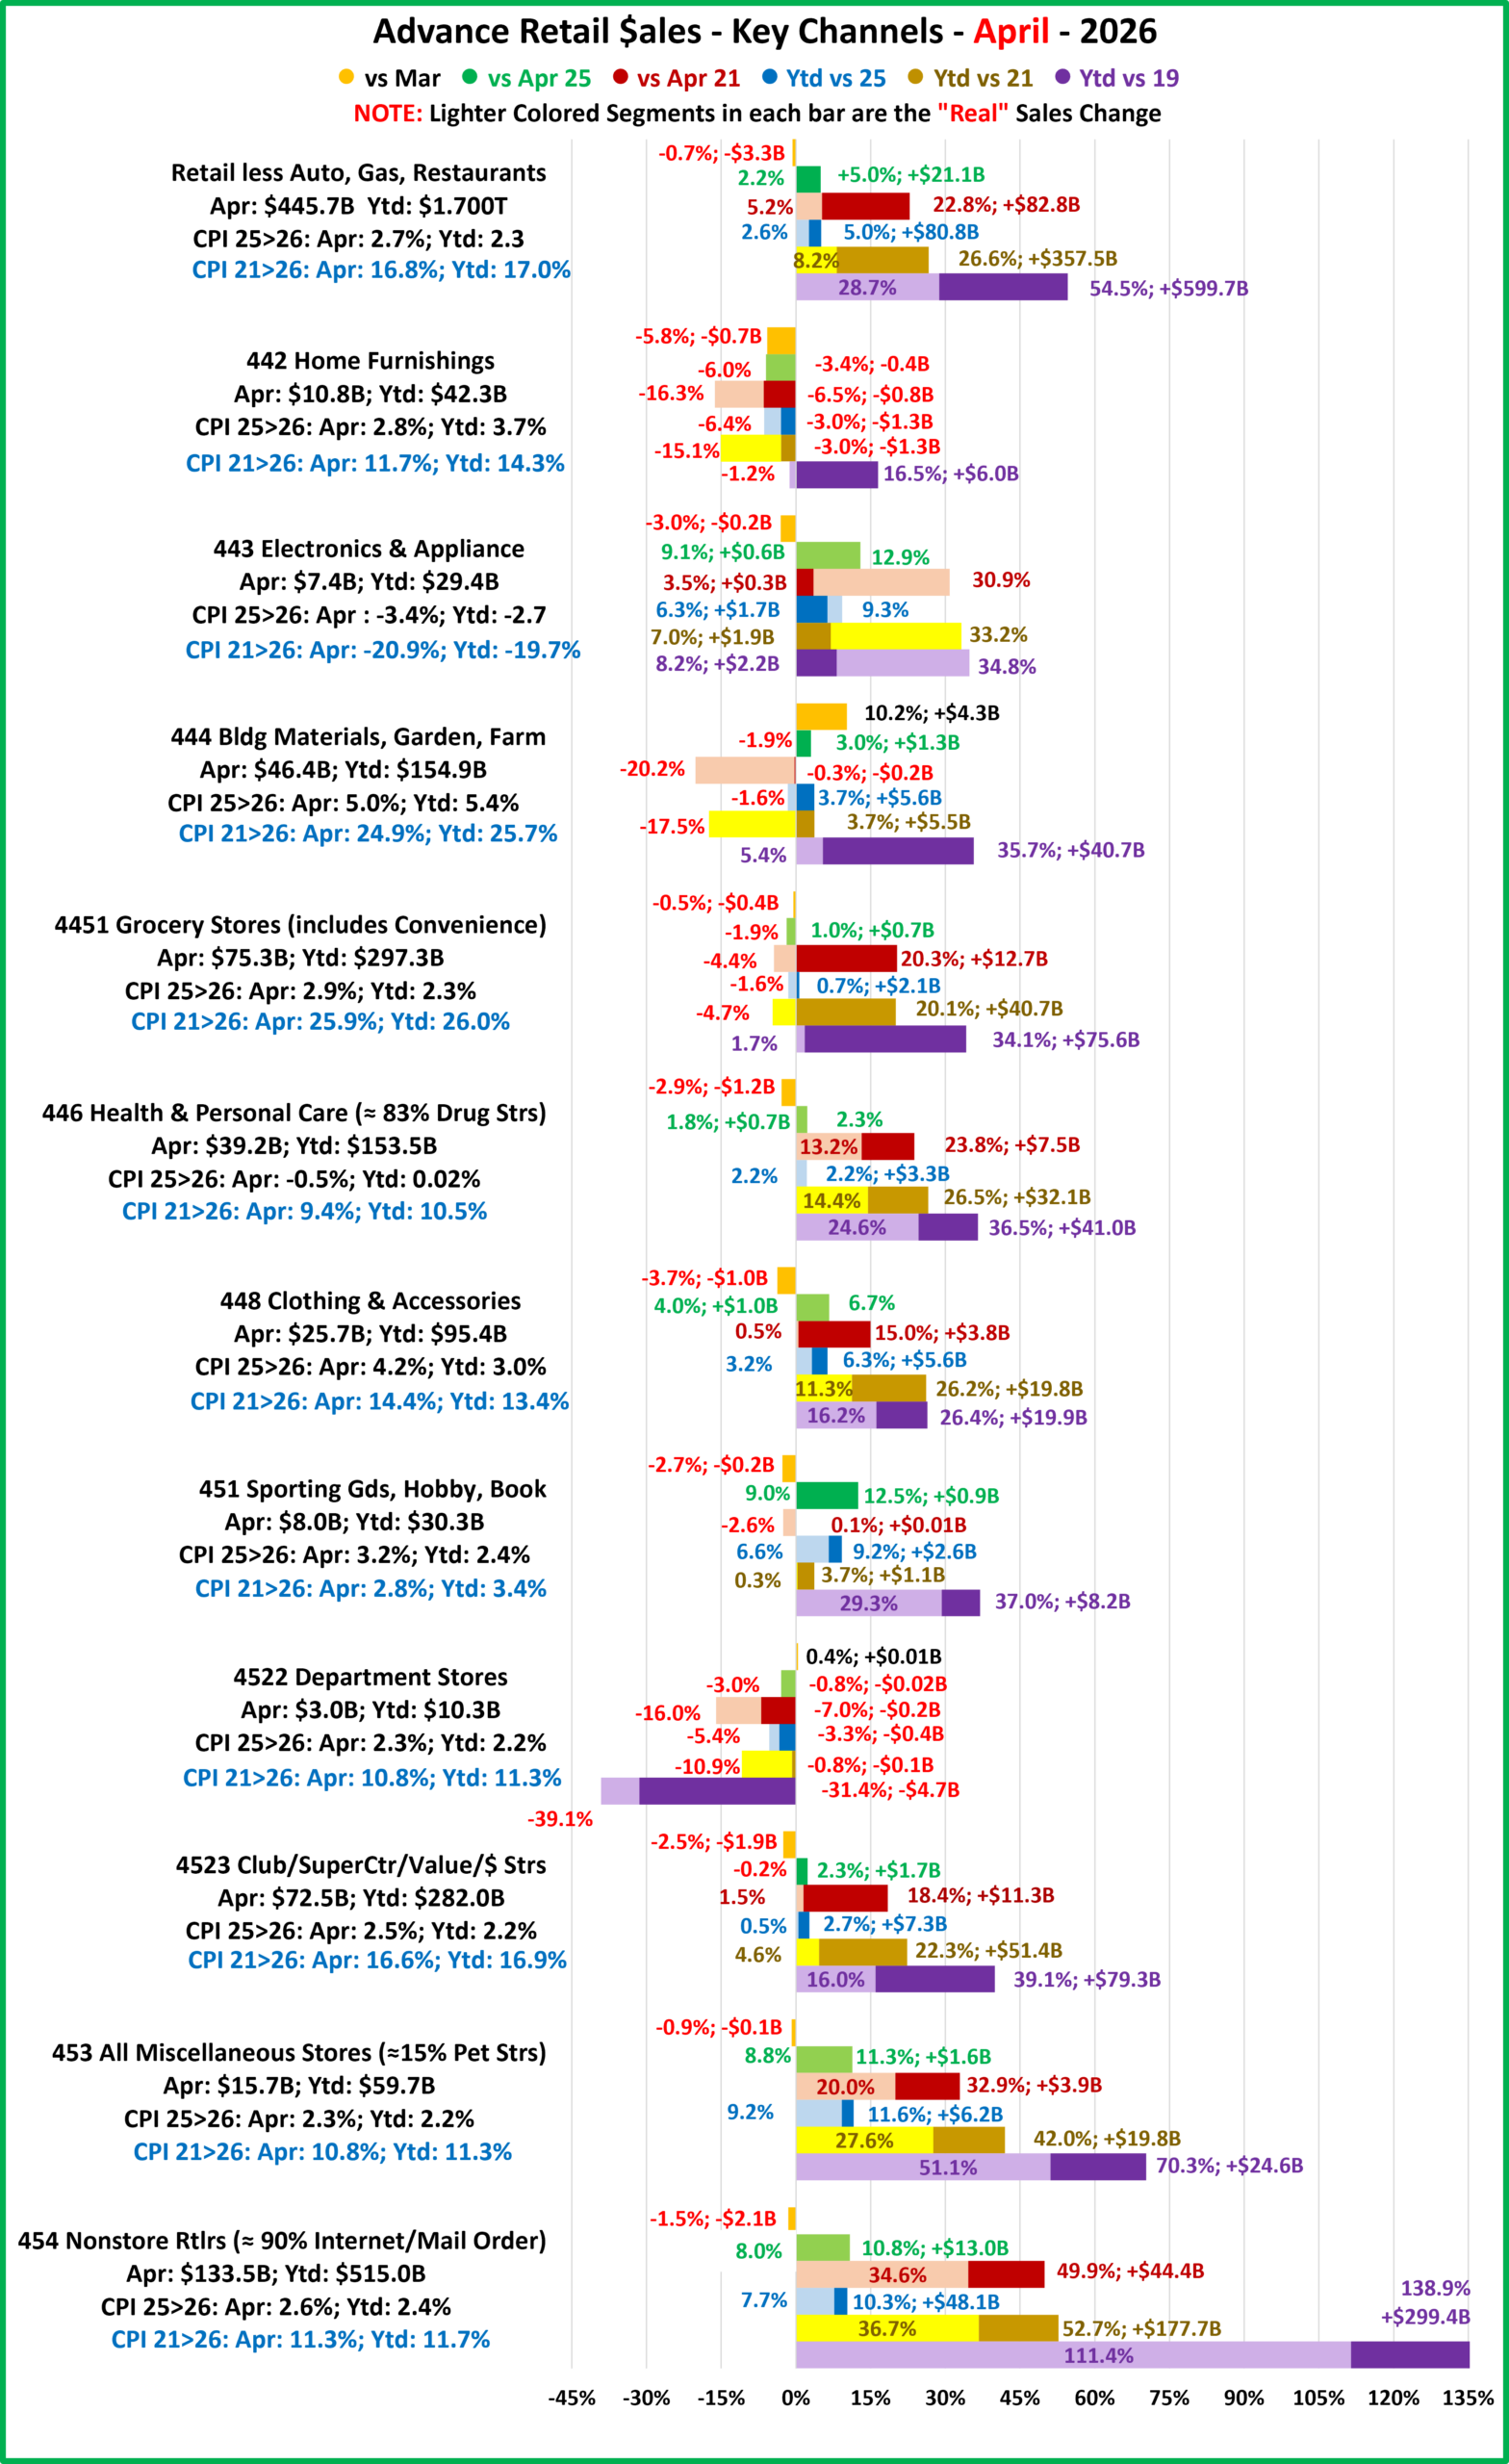 Relevant Retail: Ytd Growth: +5.0%; Avg 19>26: +6.4%; Real: 3.7%. % Real Growth: 52.7%. Only 2 were up from Mar. Vs Apr 25: 9 were up, 6 Real. Vs Apr 21: 8 were up; 6 Real. Vs 19: Dept Stores were down & “real” Furniture Stores.
- All Department Stores – This group was struggling before the pandemic hit them hard. They began recovery in March 21. Sales are +0.4% from Mar, but all YOY measurements, actual and real are negative. Their -0.8% Apr YOY drop is much better than their -4.4% avg. Ytd Growth: -3.3%; Avg 19>26: -5.2%; Real: -6.8%. % Real growth: None
- Club/SuprCtr/$- They fueled a big part of the recovery because they focus on value which has broad consumer appeal. $ales are -2.5% from Mar, but they are up in all comparisons but real vs Apr 25. Their 2.3% YOY Apr lift is -71% below their 92>25 avg of +8.2%. Ytd Growth: 2.7%; Avg 19>26: +4.8%; Real: 2.1%. % Real Growth: 40.9%
- Grocery- They depend on frequent purchases, so their changes are usually less radical. $ales are -0.5% from Mar. They are actually up for all but really down for all but vs 2019. Cumulative inflation has hit them hard. Their +1.0% YOY Apr lift is 69% below their +3.1% avg. Ytd Growth: 0.7%; Avg 19>26: +4.3%; Real: 0.2%. % Real Growth: 5.0%
- Health/Drug Stores – Many stores are essential, but consumers visit less frequently than Grocery stores. $ are -2.9% from Mar, but positive in all YOY comparisons. Inflation has been relatively low, so it is surprising that their +1.8% YOY lift vs Apr 25 is 65.1% below avg. Ytd Growth: 2.2%; Avg 19>26: +4.5%; Real: 3.1%. % Real Growth: 67.4%
- Clothing and Accessories – Clothes mattered less if you stayed home. That changed in March 2021 with strong growth through 2022. Sales are -3.7% from Mar, but positive in all YOY measurements. $ales are +4.0% vs Apr 25, 32.1% more than their 3.1% avg. Ytd Growth: 6.3%; Avg 19>26: +3.5%; Real: 2.3%. % Real Growth: 61.4%.
- Home Furnishings – In mid-2020 consumers’ focus turned to their homes and furniture became a priority. Inflation is down to 2.8% in Apr. $ are -5.8% from Mar and they are only actually up vs 2019. All real sales are down. YOY vs Apr 25, they are -3.4%, far below their 3.2% avg lift. Ytd Growth: -3.0%; Avg 19>26:+2.2%; Real: -0.2%. % Real Growth: None.
- Electronic/Appliances – They have had many issues. $ fell in Apr>May of 2020 and didn’t reach 2019 levels until March 21. $ are -3.0% from Mar, but they are up in all comparisons. Strong deflation made real sales very high. Sales are +9.1% vs Apr 25, 4.3 times above the 2.1% avg. Ytd Growth: 6.3%; Avg 19>26: 1.1%; Real: 4.4%. % Real Growth: 100+%
- Bldg Matl, Farm, Garden, Hdwe – They benefited from the consumers’ focus on home. In 22 the lift slowed as inflation grew to double digits. Prices rose again in Apr>Sep 25, dropped Oct/Nov, rose Dec/Jan to 5.6%, fell Feb to 4.8%, rose Mar to 6.0%, fell Apr to 5.0%. Sales are +10.2% from Mar and are only actually down vs Apr 21 & really up vs 2019. $ vs Apr 25 were +3.0%, 29% below their 4.2% Avg. Ytd Growth: 3.7%; Avg 19>26: 4.5%; Real: 0.8%. % Real Growth: 15.1%
- Sporting Goods, Hobby and Book Stores – Consumers turned their attention to recreation and Sporting Goods stores sales took off. Book & Hobby Stores recovered more slowly. They have been on a sales roller coaster since June 24 and $ are -2.7% from Mar. All YOY comparisons, but real vs Apr 21 are positive. YOY Sales vs Apr 25 are +12.5%, 4.3 times more than their 2.9% avg. Ytd Growth: +9.2%; Avg 19>26: +4.6%; Real: 3.8%. % Real Growth: 79.2%.
- All Miscellaneous Stores – Pet Stores have been a key part of the strong and growing recovery of this group. They finished 2020 at +0.9% but sales took off in March 21 and have continued to grow. Sales are -0.9% vs Mar, but positive in all comparisons. They are 2nd in the % increase vs 19 & vs 21. Plus, their 11.3% YOY Apr lift is 2.6 times more than their 92>25 avg of +4.3%. Ytd Growth: +11.6%; Avg 19>26: +8.1%; Real: 6.3%. % Real Growth: 72.7%.
- NonStore Retailers – 90% of their $ comes from Internet/Mail Order/TV. The pandemic accelerated online spending. They ended 2020 +21.4%. The growth continued in 2021 as sales exceeded $100B for the 1st time and they broke the $1 Trillion barrier. $ are -1.5% from Mar, but their YOY lift of 10.8% is 7.1% above the 10.1% avg. Plus, they are positive in all comparisons. Ytd Growth: 10.3%; Avg 19>26: +13.2%; Real: 11.3%. % Real Growth: 80.2%.
Recap – Driven by Relevant Retail, the Pandemic recovery was widespread by Y/E 21. In 22 we were hit with the strongest inflation in 40 years. Inflation has slowed considerably from its Jun 22 peak, but only 2 smaller channels are now deflating. Deflation helps, but cumulative inflation can still have a negative impact – slowed YOY growth and even sales drops. As expected, $ fell from Mar for 9 small channels. 6 of the 9 drops were smaller than avg – Good! The biggest concern is still YOY drops and smaller lifts. Relevant Retail’s 5.0% lift vs Apr 25 was 7.3% above avg. 9 channels had a YOY lift vs last year, 1 less than Mar. 5 of the 9 lifts were above avg, 2 less than Mar. There are multiple factors slowing growth, but the major one is high prices from current & cumulative inflation. Feb is usually the worst retail month. April is the 3rd worst & the Mar>Apr drop is the 4th biggest. Both Total & Relevant Retail had record monthly sales for Dec>Apr 26. The Apr Yoy lift was -1.7% below avg for Total but 7.3% above for Relevant. The situation is definitely worse than Mar as 6 of 11 channels (only 4 in Mar) had a below avg lift or a drop vs 25. We’ll see what happens in May.
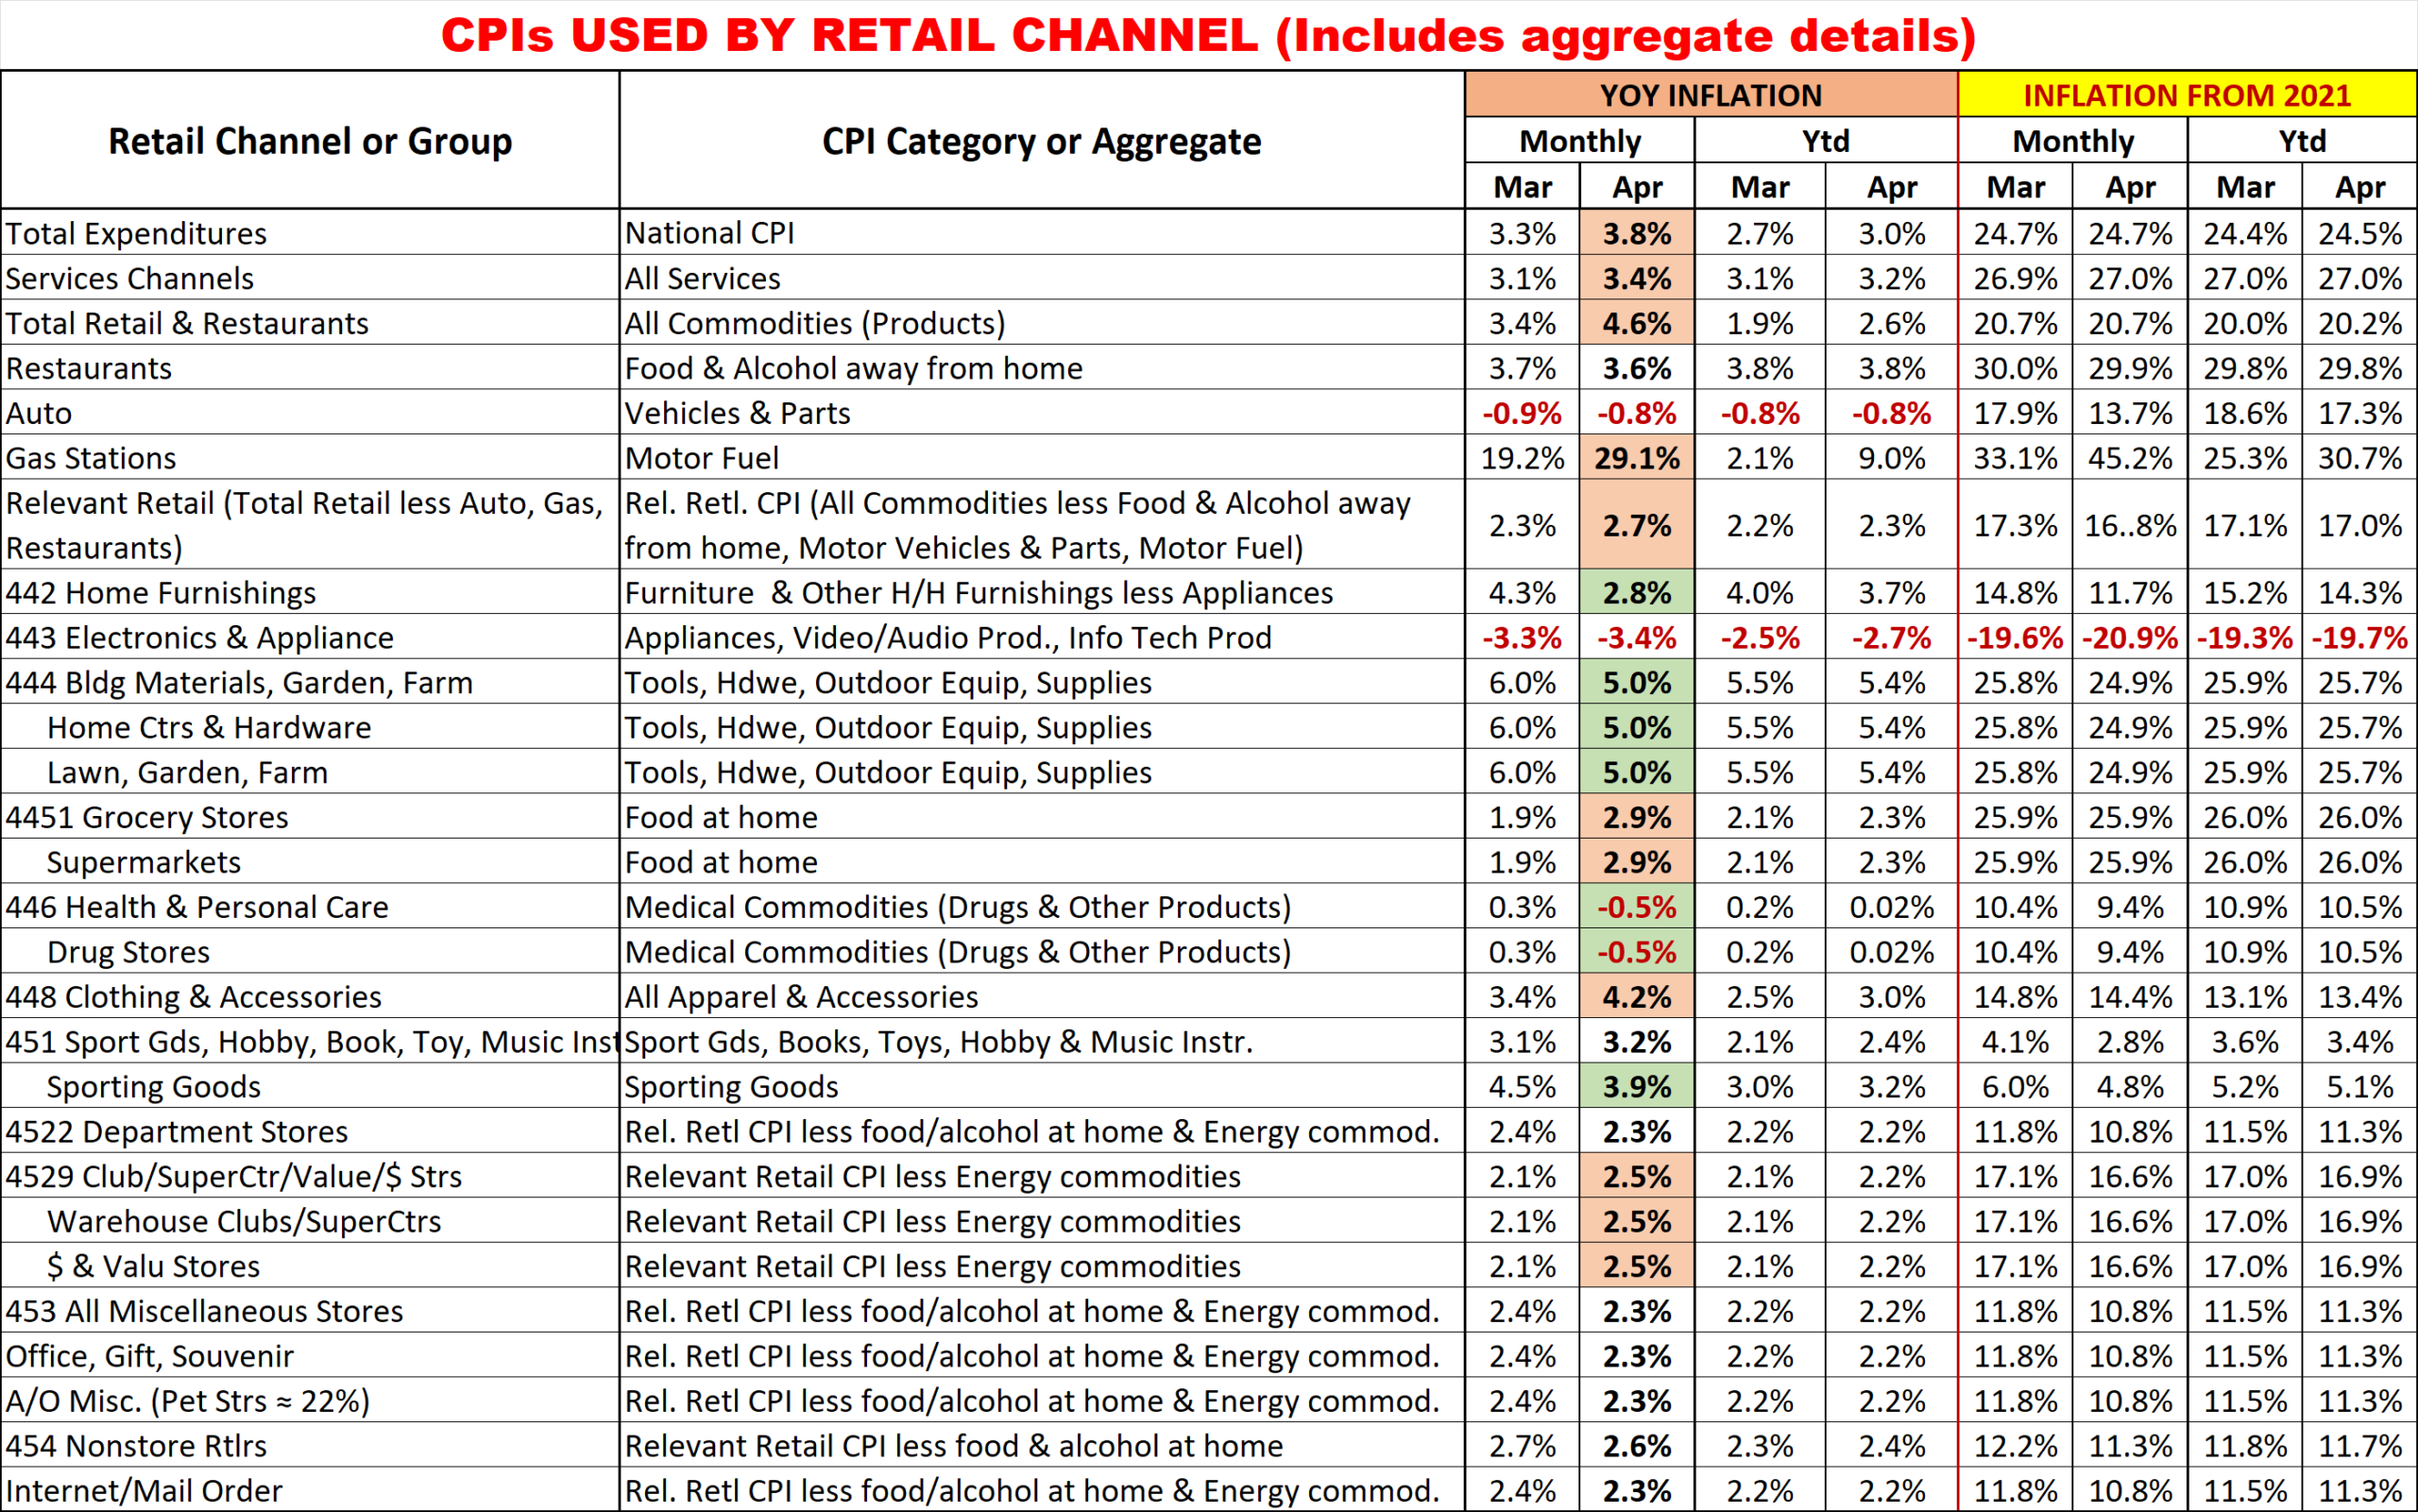
Here are the Mar/Apr inflation rates for the CPIs used to calculate the impact of inflation on retail groups and channels. This includes special aggregate CPIs created with the instruction and guidance of the US BLS. I also researched data from the last Economic Census to review the share of sales by product category for the various channels to help in selecting what expenditures to include in specific aggregates. Of course, none of these specially created aggregates are 100% accurate but they are much closer than the overall CPI or available aggregates. The data includes the CPI changes vs 21 to show cumulative inflation.
- Monthly YOY CPI changes of 0.2% or more are highlighted. (Green = lower; Pink = higher)
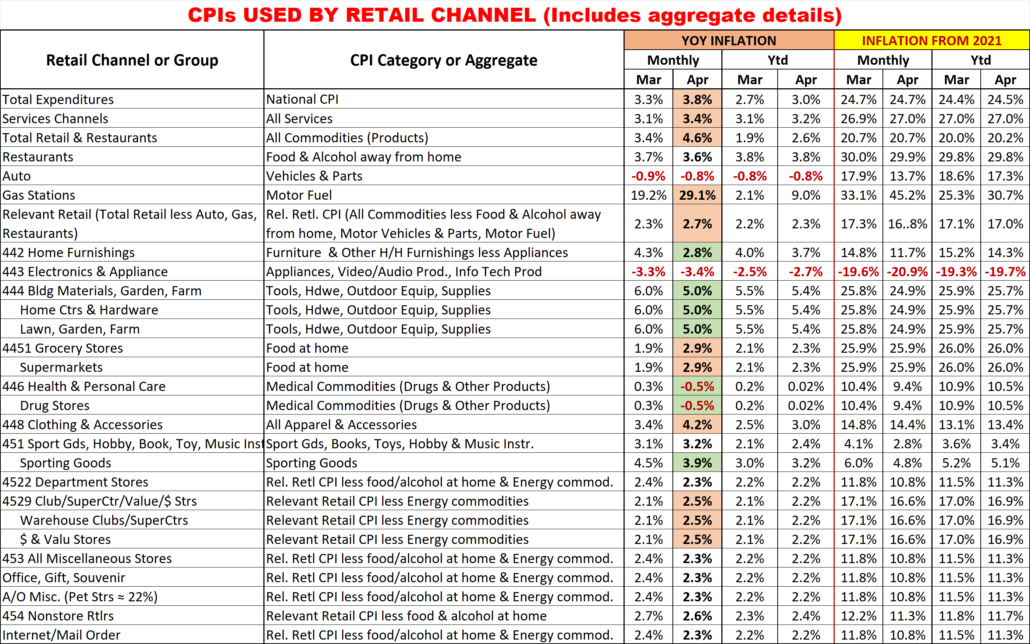 Here are some answers to some obvious questions. Note: Gasoline & Groceries are big drivers in the National CPI lift.
- Why is the group for Nonstore different from the Internet?
- Non-store is not all internet. It also includes Fuel Oil Dealers, the non-motor fuel Energy Commodity.
- Why is there no Food at home included in Nonstore or Internet?
- Online Grocery purchasing is becoming popular, but almost all is from companies whose major business is brick ‘n mortar. These online sales are recorded under their primary channel
- 5 Channels have the same CPI aggregate but represent a variety of business types.
- They also have a wide range of product types. Rather than try to build aggregates of a multitude of small expenditure categories, it seemed better to eliminate the biggest, influential groups that they don’t sell. This method is not perfect, but it is certainly closer than any existing aggregate.
- Why are Grocery and Supermarkets only tied to the Grocery CPI?
- According to the Economic Census, 76% of their sales comes from Grocery products. Grocery Products are the driver. The balance of their sales comes from a collection of a multitude of categories.
- What about Drug/Health Stores only being tied to Medical Commodities.
- An answer similar to the one for Grocery/Supermarkets. However, in this case Medical Commodities account for over 80% of these stores’ total sales.
- Why do SuperCtrs/Clubs and $ Stores have the same CPI?
- While the Big Stores sell much more fresh groceries, Groceries account for ¼ of $ Store sales. Both Channels generally offer most of the same product categories, but the actual product mix is different.

