
Petflation 2026; August Update: Driven By Veterinary, Inflation Rose
It’s time to continue with 2026 Inflation. The Consumer Price Index peaked back in June 2022 at 9.1% then began to slow until it turned up in Jul/Aug 2023. Prices fell Oct>Dec 23, then turned up Jan>Oct 24 but fell in Nov. However, they rose 10 straight months to a record high in Sep 25, fell Oct>Dec, rose Jan>May (Record), fell Jun/Jul, rose Aug. The CPI vs last year was stable at 3.4%. Grocery prices were down -0.04% from July, and their YOY inflation fell to 2.2% from 2.7%. BTW, Gas prices are still up 36.6% from Feb. Even minor price changes can affect consumer pet spending, especially in the discretionary pet segments, so we will continue to publish monthly reports to track petflation as it evolves.
Petflation was +4.1% in Dec 21 while the overall CPI was +7.0%. The gap narrowed as Petflation accelerated. It was 96.7% of the national rate in June 22. National inflation has slowed considerably, but Petflation generally increased until June 23. It passed the CPI in July 22, fell below Apr>Jul 24. It passed the CPI in Aug, fell below Sep>Oct, rose above in Nov, fell below Dec>Aug 25, passed it Sep>Oct & Dec>Mar 26, equal in Apr, below in May>Aug. All reports include:
- A rolling 24-month tracking of the CPI for all pet segments and the national CPI. The base number will be pre-pandemic December 2019 in this and future reports, which will facilitate comparisons.
- Monthly comparisons of 26 vs 25 which will include Pet Segments and relevant Human spending categories. Plus
- CPI change from the previous month.
- Inflation changes for recent years (25>26, 24>25, 23>24, 22>23, 21>22, 20>21, 19>20, 18>19)
- Total Inflation for the current month in 2026 vs 2019 and vs 2021 to see the full inflation surge.
- Average annual Year Over Year inflation rate from 2019 to 2026
- YTD comparisons
- YTD numbers for the monthly comparisons #2>4 above
In our first graph we will track the monthly change in prices for the 24 months from Aug 24 to Aug 26. We will use December 2019 as a base number so we can track the progress from pre-pandemic times through an eventual recovery. This chart is designed to give you a visual image of the flow of pricing. You can see the similarities and differences in segment patterns and compare them to the overall U.S. CPI. The year-end numbers & those from 12 and 24 months earlier are included. We also included and highlighted (pink) the cumulative price peak for each segment. In August, Pet prices were +0.05% from July. Food: -0.1%, Supplies: -0.4%, Services: -0.4%, Vet: +1.1%. Veterinary drove Pet Prices up.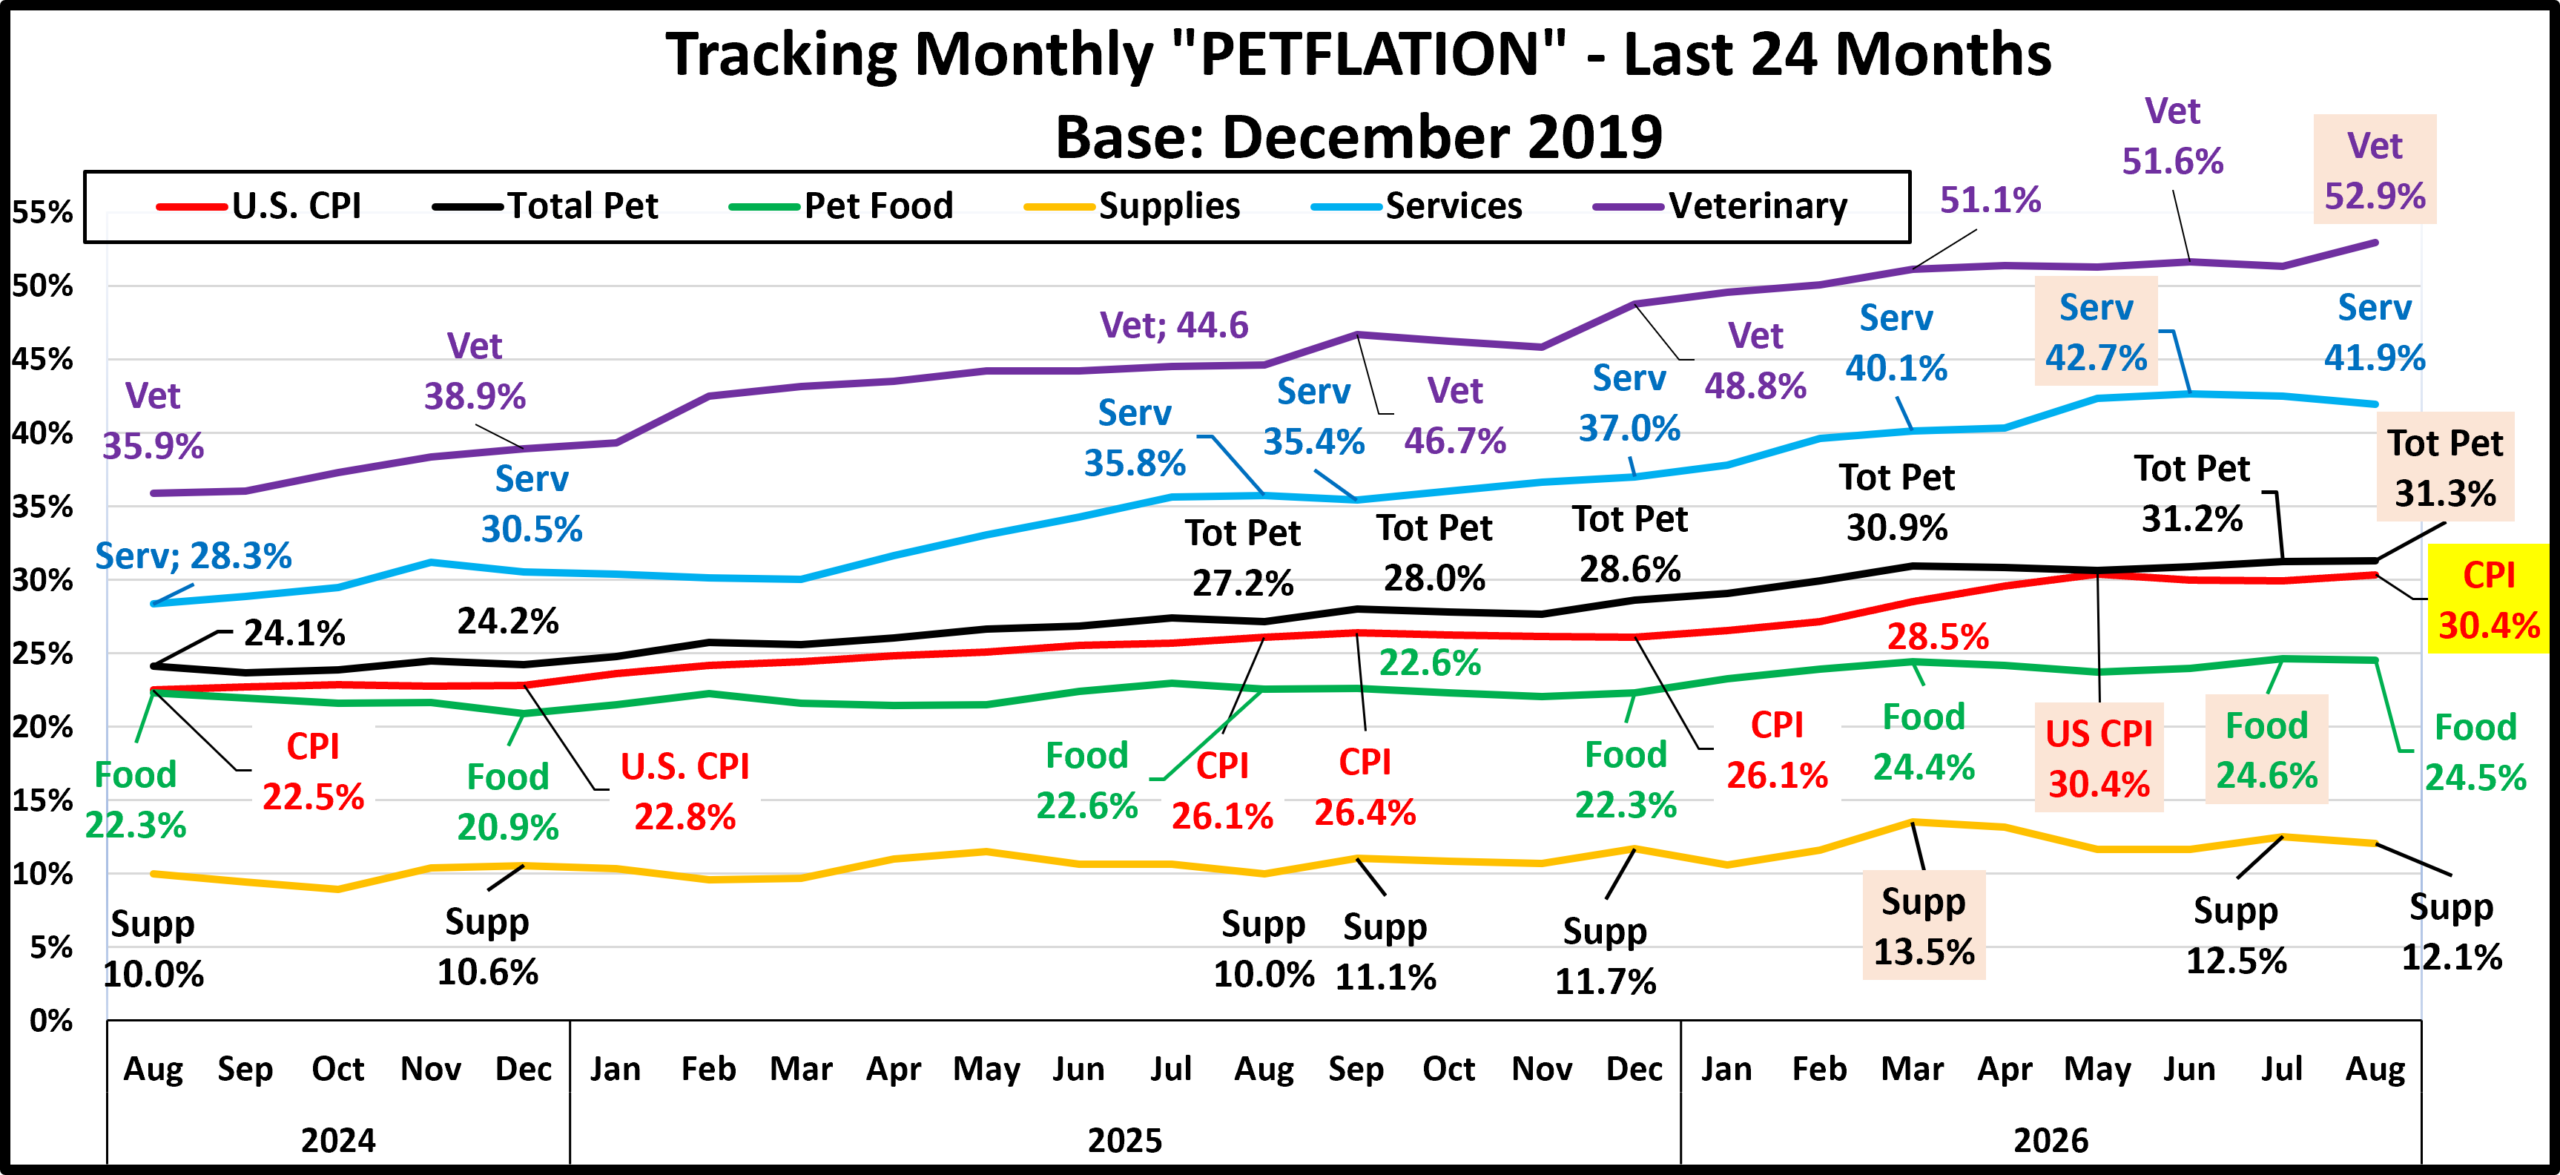
In Aug 24, the CPI was +22.5% and Pet was +24.1%. The Services segments inflated after mid-20, while Product inflation stayed low until late 21. In 22, Food prices grew but others had mixed patterns until July 22, when all rose. In Aug>Oct Petflation took off. In Nov>Dec, Services & Food inflated while Vet & Supplies prices stabilized. In Jan>Apr 23, prices grew every month for all except for 1 Supplies dip. In May Products prices grew while Services slowed. In Jun/Jul this reversed. In Aug all but Services fell. In Sep/Oct this flipped. In Nov, all but Food & Vet fell. In Dec, Supp. & Vet drove a lift. In Jan>Mar 24 Pet prices grew. In April, prices in all but Vet fell. In May, all but Food grew. In June, Products drove a lift. In July, all but Services fell. In Aug, Food drove a drop. In Sep, Products fueled a drop. In Nov all were up. Prices dropped in Mar & Oct>Nov 25, rose Dec>Mar 26, fell Apr/May, rose Jun/Jul. All but Vet, Total Pet & the CPI fell in Aug. All segments were at/near a record Mar>Aug 26.
- U.S. CPI – Inflation was below 2% through 2020. It turned up in January 21 and grew until flattening in Jul>Dec 22. Prices rose Jan>Sep 23, fell Oct>Dec, rose Jan>Oct 24, fell Nov, rose Dec>Sep 25, fell Nov>Dec, hit record highs Jan>May 26, slowed Jun/Jul, rose Aug. 22.4% of the lift since 2019 happened Jan>Jun 22, 7.5% of the time.
- Pet Food Prices were at the Dec 19 level Apr 20>Sep 21. They grew & peaked May 23, then got on a roller coaster Jun/Jul 25↑, Aug↓, Sep↔, Oct/Nov↓, Dec>Mar↑, Apr/May↓, Jun/Jul↑, Aug↓. 87.3% of the lift was in 22/23.
- Pet Supplies – Supplies prices were high in Dec 19 due to tariffs. They had a deflated roller coaster ride until mid-21 when they returned to Dec 19 prices & stayed there until 22. They turned up in Jan (record). They plateaued Feb>May, grew in June, flattened in July, then turned up in Aug>Oct to a record. Prices stabilized Nov>Dec, grew Jan>Feb 23. fell in Mar, but the roller coaster hasn’t stopped. Jan>Feb 25↓, Mar>May↑, Jun↓, Jul↑, Aug↓, Sep↑, Oct>Nov↓, Dec↑, Jan 26↓, Feb>Mar↑(record), Apr>Jun↓, Jul↑, Aug↓. Prices are now 1.3% below the March record.
- Pet Services– Inflation is usually 2+%. Due to closures, prices increased at a lower rate in 2020. In 2021 consumer demand increased but with fewer outlets. Inflation grew in 21 with the biggest lift in Jan>Apr. Inflation was strong in 22, but prices got on a roller coaster. They rose Jul>Apr 23, fell May. Jun>Aug↑, Sep>Dec↓, Jan>Mar 24↑, Apr↓, May↑, Jun↓, Jul>Nov↑, Dec>Mar 25↓, Apr>Aug↑, Sep↓, Oct>Jun 26↑(record), Jul/Aug↓.
- Veterinary – Inflation has been consistent. Prices turned up in Mar 20 & grew through 21. They surged in Dec 21 which put them above the US CPI. In May/Jun 22 prices fell below the CPI. However, they rose again & have been above the CPI since July 22. In 23>25 prices grew Jan>May, leveled Jun/Jul, fell Aug, grew Sep>Dec, fell Jan, grew Feb>May, fell Jun/Jul, grew Aug 24>Sep 25, fell Oct/Nov, grew Dec>Apr 26, fell May, grew Jun, fell Jul, rose Aug.
- Total Pet – Petflation is a sum of the segments. In Dec 21 the price surge began. In Mar>Jun 22 the segments had ups & downs. Petflation grew Jul>Nov, slowed Dec, grew Jan>May 23, fell Jun>Aug, grew Sep/Oct, fell Nov, then grew Dec>Mar 24 to a record. Prices fell in April, rose May>Jun, fell Jul>Sep, rose Oct>Nov, fell Dec, rose Jan>Feb 25, fell Mar, grew Apr>Jul, fell Aug, rose Sep, fell Oct>Nov, rose Dec>Mar 26, fell Apr>May, rose Jun>Aug (Record)
Next, we’ll turn our attention to the YOY inflation rate change for August and compare it to last month, last year and to previous years. We will also show total inflation from 21>26 & 19>26. Petflation rose from 2.5% to 3.5% in Sep 25, fell to 2.6% in Nov, rose to 3.5% in Dec & 4.3% in Mar. In Apr it fell to 3.8%, 3.2% in May/Jun, 3.0% in Jul. It rose to 3.2% in Aug. The chart allows you to compare the inflation of 25>26 to 24>25 & other years but also see how much of the inflation since 2019 came from the current surge. We’ve included some human categories to put the Pet data into perspective.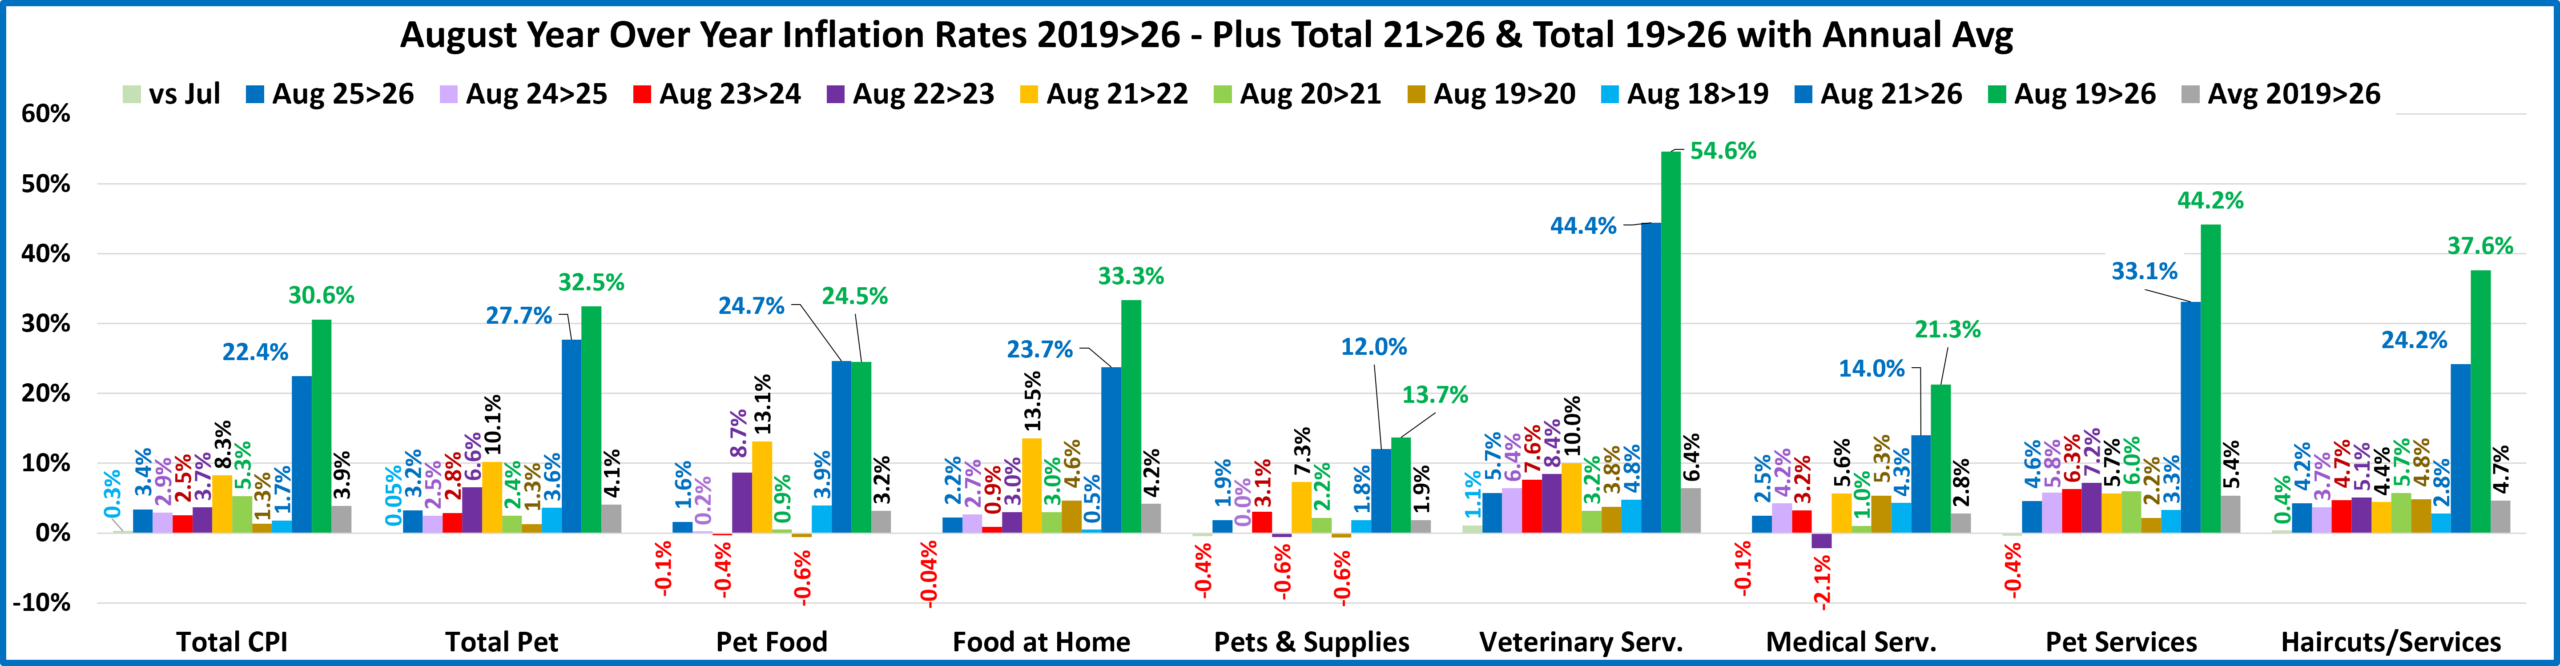
Overall, prices were +0.3% from Jul but were stable at +3.4% vs Aug 25. Grocery prices dropped -0.04% and YOY inflation slowed from 2.7% to 2.2%. There were 4 price drops from last month, 1 more than Jul. In Feb, there were no drops. In Dec & Jan there was 1. In Nov there were 6 drops. The national YOY monthly CPI rate of 3.4% is up 17% from 24>25 but it’s 59% less than 21>22. The 25>26 rate is above 24>25 for all but Groceries, Medical Serv. Pet Serv. & Vet. In our 2021>2026 measurement you also can see that over 71% of the cumulative inflation since 2019 has occurred in all but 2 segments – Haircuts and Medical Services. Service Segments have generally had higher inflation rates so there was a smaller pricing lift in the recent strong increase. Pet Products have a very different pattern. The 21>26 inflation surge provided 97.0% of their overall inflation since 2019. This happened because Pet Products prices in 2021 were still recovering from a deflationary period. Services expenditures account for 63.5% of the National CPI, so they are very influential. Their current CPI is 3.1%, the same as July. The CPI for Commodities rose from 3.9% to 4.0%. Services again are the inflation driver, even in stability. The situation in Pet is more balanced. Petflation: 3.2%, up from 3.0%. The CPI for the Service Segments is 4.8%, up from 4.5%. The Pet Products CPI is 1.9%, up from 1.7%. Both contributed to the lift.
- U.S. CPI– Prices are +0.3% from Jul. The YOY rate is 3.4%, the same as Jul. It peaked at +9.1% back in June 2022. The targeted inflation rate is <2% so we are still 70+% higher than the target. The stability follows a Jun/Jul drop, Mar>May lifts, Feb stability, a Jan lift, Dec stability and drops in Oct & Nov. The current rate is 17% above 24>25 and the 21>26 rate is +22.4%, 73.2% of the total inflation since 2019. The Inflation surge was growing in Aug 2021, +5.3%
- Pet Food– Prices are -0.1% vs Jul, but +1.6% vs Aug 25, up from 1.3%. They are still 27% below the Food at Home inflation rate of +2.2%. Remember that the YOY Pet Food CPI has deflated in 17 of the last 30 months. The 2021>2026 inflation surge has generated 101% of the 24.5% inflation since 2019. Inflation began for Pet Food in June 2021, +0.9%, after 12 straight deflationary months. Pet Food prices reached a new record high in July 26.
- Food at Home – Prices are -0.04% from Jul and the YOY CPI fell from 2.7% to 2.2%. This is radically lower than Jul>Sep 2022 when it exceeded 13%. The 33.3% Inflation for this category since 2019 is 8.8% more than the national CPI but is only in 4th place behind 3 Services expenditures. 71.2% of the inflation since 2019 occurred from 2021>26. This is slightly less than the CPI, but we should note that Grocery prices began inflating in 2020>21 then the rate accelerated. It appears that the pandemic supply chain issues in Food which contributed to higher prices started early and foreshadowed problems in other categories and the overall CPI tsunami.
- Pets & Supplies– Prices were -0.4% from Jul, but YOY inflation rose to 1.9% from 1.7%. They still have the lowest rate vs 2019. Prices deflated for much of 20>21. As a result, the 2021>26 surge accounted for 87.6% of the total inflation since 2019. Prices set a record in Oct 22 then deflated. 3 lifts pushed them to a record high in Feb 23. Prices fell in Mar & the roller coaster continued into 25. They fell Jan/Feb 25, rose Mar>May, fell Jun, rose Jul, fell Aug, rose Sep, fell Oct>Nov, rose Dec (record), fell in Jan, rose Feb>Mar – a new record, fell Apr>Jun, rose Jul, then fell in Aug.
- Veterinary Services– Prices are +1.1% from Jul and +5.7% from 2025, up from 4.7%. They are #2 in inflation vs last year, behind Pet Services, but still #1 in the increase since 2019, +54.6% and 21, +44.4%. For Veterinary, high annual inflation is the norm. However, the rate has increased during the current surge, especially since 23. They have the highest August avg rate in 26 (+6.4%) and 81.3% of the cumulative inflation since 2019 occurred from 2021>26.
- Medical Services – Prices turned sharply up at the start of the pandemic but then inflation slowed and fell to a low rate in 20>21. Prices fell -0.1% from Jul and inflation vs last year decreased to +2.5% from +2.7%. Medical Services are not a big part of the current surge as only 65.7% of the 21.3%, 2019>26 increase happened from 21>26.
- Pet Services – Inflation slowed in 20 but grew in 21. In 24 prices surged in Jul>Nov, then fell to 3.9% in Dec>Mar 25. Apr grew, May fell, June rose, Jul rose to 6.3%, Aug fell to 5.8% & Nov to 4.2%. In Dec>Mar 26 it rose: 7.8%, Apr fell: 6.6%, May rose: 7.0%, Jun>Aug fell: 6.3% to 4.2%. They are #1 vs 25 & #2 vs 21 & 19. 75% of their inflation is from 21>26.
- Haircuts/Other Personal Services – Prices are +0.4% from Jul and +4.2% from Aug 25. 23 of the last 32 months have been 4.0+%. Inflation has been pretty consistent. Just 64.4% of the 19>26 inflation happened 21>26.
- Total Pet– Petflation rose to 3.2% from 3.0%. Only Services had a rate decrease. Total Petflation is 28% above the 24>25 rate but 5.9% below the current U.S. CPI. However, It is now above the 3.1% avg Aug rate since 1997. August prices rose 0.05% from Jul, driven by Veterinary. The Jul>Aug 0.05% increase was below the 0.2% 97>25 average change, but the 1st Jul>Aug lift since 2022. A key factor in the current YOY CPI lift was that prices fell -0.2% in 25. Aug Pet prices hit a new record high. Inflation is complex and recovery is definitely slow. Now, we’ll look at YTD data.
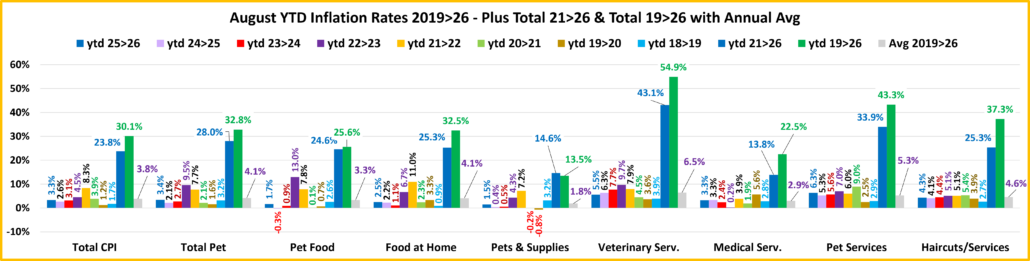
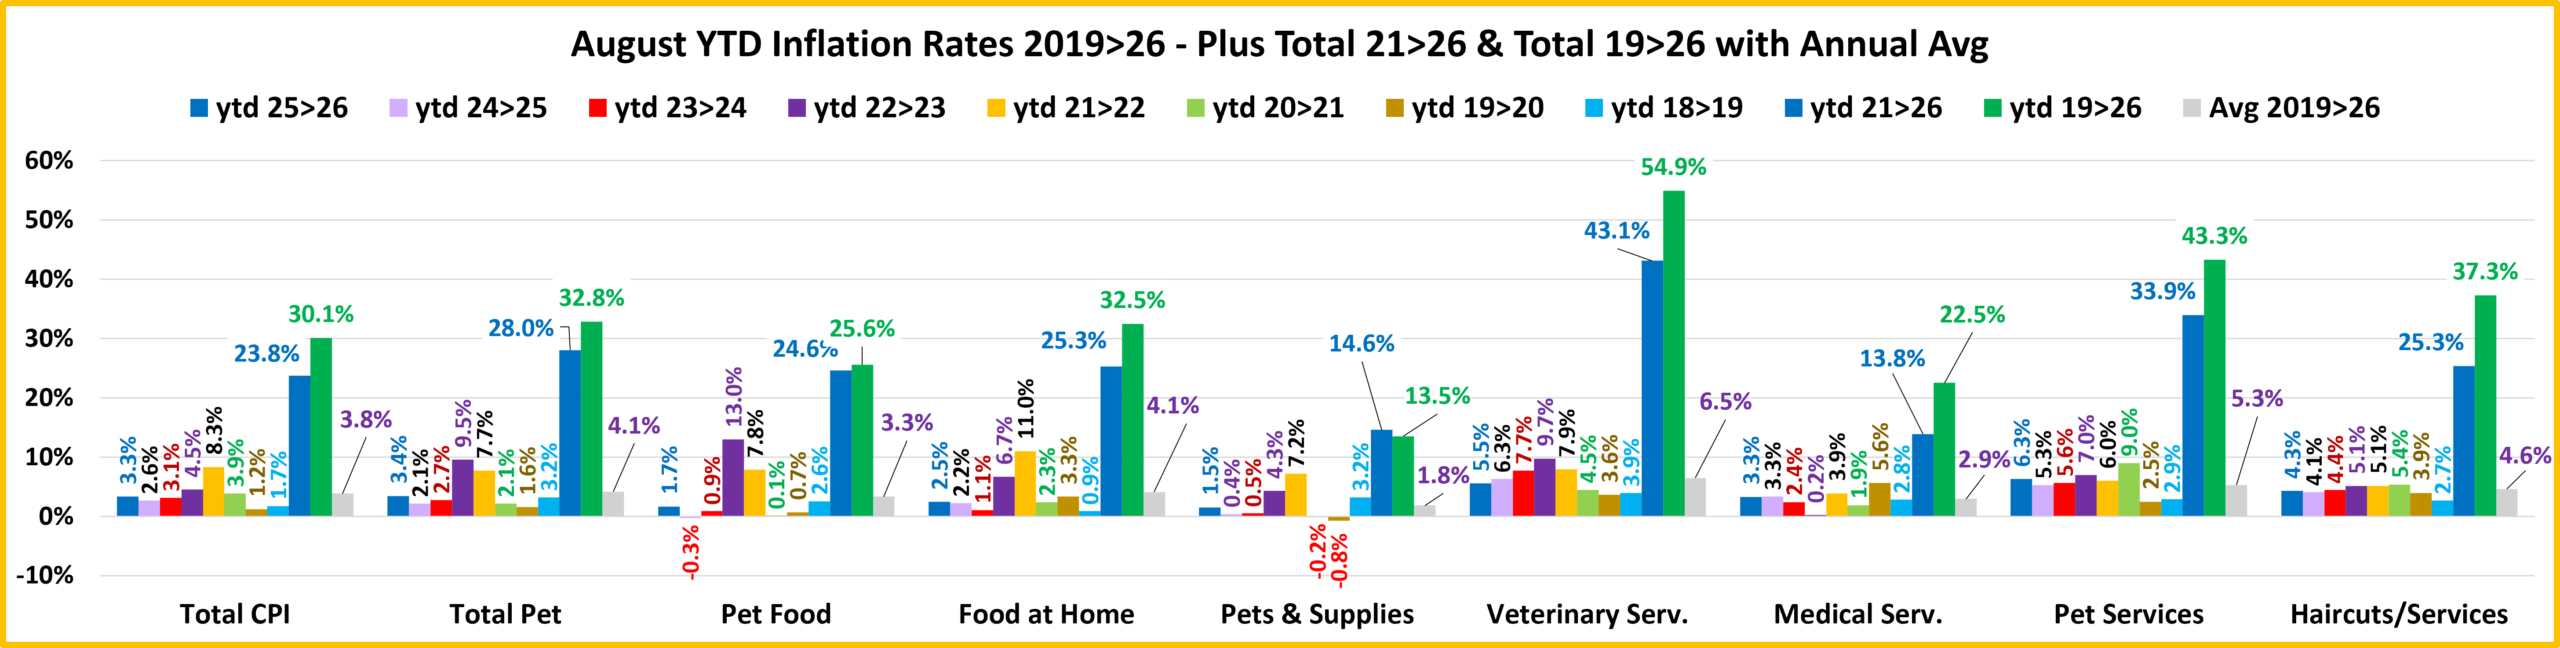
The 25>26 rate is higher than 24>25 for all, but Vet & Med. The 22>23 inflation rate was the highest for Tot Pet, Pet Food, Veterinary & Pet Services. 21>22 has the highest rate for Groceries, Pet Supplies & the Natl CPI; 20>21: Haircuts; 19>20: Medical Services. The average national inflation rate in the 7 years since 2019 is 3.8%. Only 3 of the categories are below that rate – Medical Services (2.9%), Pet Supplies (1.8%) and Pet Food (3.3%). It is no surprise that Veterinary Services has the highest average rate (6.5%), but all 4 other categories are +4.1% or higher.
- U.S. CPI – The 25>26 rate is 3.3%, up 27% from 24>25 and 6.5% from 23>24. However, it is 60% less than 21>22 and 13% below the average increase from 2019>2026, but still 45% more than the average increase from 2018>21. 79% of the 30.1% inflation since 2019 occurred from 2021>26. Inflation is a problem that started recently.
- Pet Food – Ytd prices are still inflating, 1.7%, the same as Jun/Jul, but down from 1.8% in May. That’s a big increase from -0.3% in 24>25. It is above 0.9% in 23>24 but equal to the 18>20 average. Pet Food has the highest 22>23 rate but is only #6 in the 21>26 rates and #7 in 19>26. Deflation in the 1st half of 2021 kept YTD prices low then they surged in 22 and especially in 23. 96% of the inflation since 2019 occurred from 2021>26.
- Food at Home – The 25>26 inflation rate is 13.6% above 24>25, but it is down 63% from 22>23 and 77% from 21>22. However, it’s 9% higher than 20>21 and 19% above the average rate from 2018>20. It is only in 5th place for the highest inflation since 2019 but still beat the U.S. CPI by 8.0%. You can see the impact of supply chain issues on the Grocery category as 78% of the inflation since 2019 occurred from 2021>26.
- Pets & Pet Supplies – A roller coaster, prices rose Jan>Feb 24, fell Mar>Apr, rose May>Jun, fell July, rose Aug, fell Sep>Oct, rose Nov>Dec, fell Jan>Feb 25, rose Mar>May, deflated vs 24 in June, rose July: +0.7%, fell to 0.0% in Aug, rose Sep>Dec, fell Jan 26, rose Feb>Mar, fell Apr>Jun, rose Jul, fell Aug. Supplies still have the lowest inflation since 2019. Their biggest YOY lifts since 2019 were in 22 & 23. The 2021 deflation created an unusual situation. Prices are up 13.5% from 2019 but 108.1% of this lift happened from 21>25. Prices are up 14.6% from their 2021 “bottom”.
- Veterinary Services – Inflation was high in 2019 and steadily grew until it took off in late 2022. The rate may have peaked in 2023, but it is still going strong in 2026, +5.5%, the 2nd highest on the chart. However, they are still #1 in inflation since 2019 and since 2021. At +6.5%, they have the highest average inflation rate since 2019. It is 71% higher than the National Average but 2.2 times higher than the Inflation average for Medical Services. Strong Inflation is the norm in Veterinary Services.
- Medical Services – Prices went up significantly at the beginning of the pandemic, but inflation slowed in 2021. In August 2026 it is 3.3%, 14% above the 2.9% 2019>26 average rate. We should also note that 3.3% is 16.5 times higher than the 0.2% low point in 22>23.
- Pet Services – After falling in late 2023, prices surged in 2024, then fell in 2025 until an Apr>Aug lift followed by a Sep>Nov dip, a Dec>Jun 26 lift & a Jul/Aug drop. The 25>26 6.3% CPI is #1 on the chart, passing Veterinary. It is 19% above their 19>26 avg and 2.3 times their 2018>20 avg. Pet Services is also 2nd in both 19>26 and 21>26 inflation.
- Haircuts & Personal Services – The services segments, essential & non-essential, were hit hardest by the pandemic. The industry responded by raising prices. 2026 inflation is 4.3%, 20.4% below its 20/21 peak, but 30.3% above the 18>20 average. Consumers are paying over 35% more than in 2019, which usually reduces the purchase frequency.
- Total Pet – Petflation is 3.4%, up 62% from 24>25, but 64% less than their 22>23 peak. However, It’s 48% more than their 18>21 avg and 3.0% above the US CPI. Pet prices are at a record high. Except for Mar/Aug/Oct/Nov, Pet prices rose in 25, which continued in Jan>Mar 26, paused in Apr>May, then rose in Jun>Aug. The overall gain is primarily being driven by a flip from deflation to inflation in Pet Products and continued strong inflation in Services.
The Petflation recovery paused in Aug 24, came back Sep>Oct, paused in Nov, resumed in Dec>Jan 25, paused in Feb, restarted in Mar and paused Apr>Sep. It improved Oct/Nov, paused in Dec>Mar 26, improved Apr/May, paused Jun/Jul, rose Aug. We tend to focus on the monthly YOY inflation in the current year and ignore the fact that inflation is cumulative. Pet prices are 27.7% above 2021 and 32.5% higher than 2019. Those are big lifts. In fact, Mar prices for the National CPI, Total Pet and all pet segments reached new record highs. By Aug, prices either set a new record or are within 1.3% of Mar. Only Supplies prices (+13.7%) are less than 24.5% higher than 2019. Since price/value is the biggest driver in consumer spending, inflation will affect the Pet Industry. Services will be the least impacted as it is the most driven by high income CUs. Veterinary will continue to see a reduction in visit frequency. Pet Parents will just pay more. The product segments will see a more complex reaction. Supplies are more discretionary so we will likely see a reduction in purchase frequency. In Pet Food, the most needed segment, some Pet Parents may choose to downgrade their Pet Food. However, the biggest impact in both product segments will be a strong movement to online purchasing and private label. We saw proof of this at both GPE 25/26 & SZ 25/26 as a huge # of exhibitors offered OEM services. Strong, cumulative inflation has a widespread impact. We’ll continue to monitor the situation.

