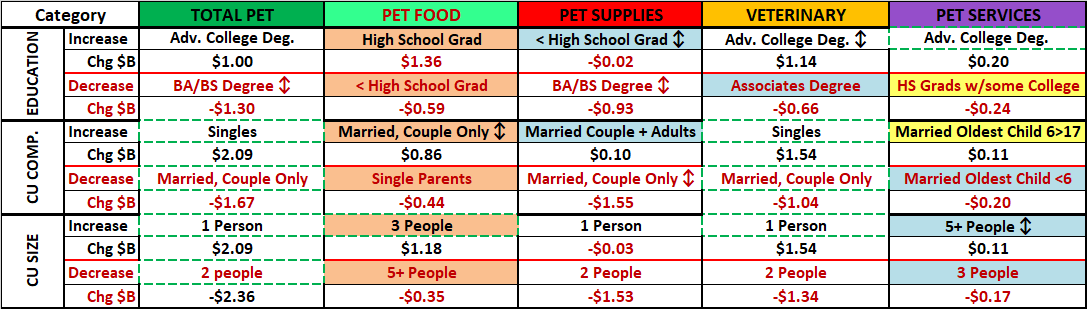
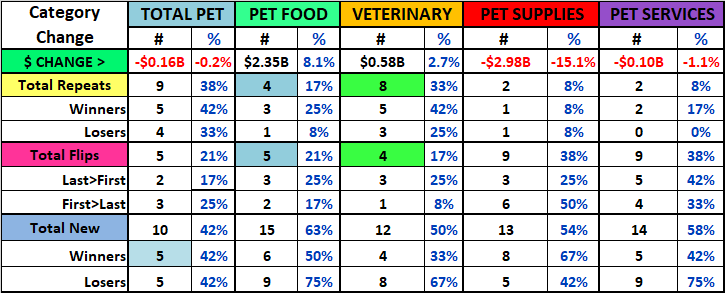
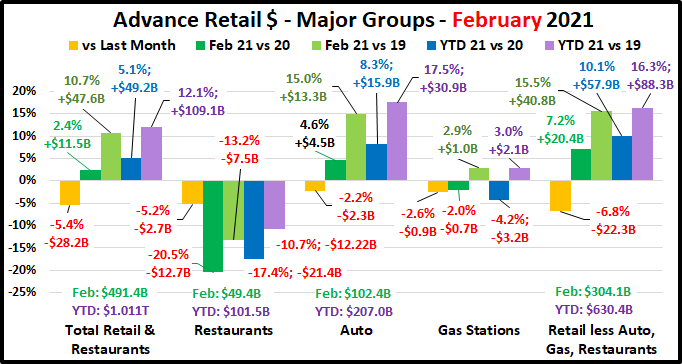
PET PRODUCT $ALES ACROSS U.S. RETAIL CHANNELS The Migration of “Pet Parents” – 1992 to 2017

Pets, Pet Food and Supplies sales have shown tremendous retail growth since 1992. According to the Economic Census, which is conducted every 5 years by the U.S. Census Bureau, retail sales totaled $51.32 Billion in 2017 – up from $8.2 Billion in 1992. The spectacular growth was fueled by Americans’ growing love and commitment to their pets. 67% of U.S. Households have a pet – twice as many as have a child under 18.

While the love was growing in our hearts, the sales of pet products were growing at retail. It was not a simple journey –straight to the top. It involved expansion to a variety of different outlets and consumer migration between channels driven by their search for value, convenience and selection.

In this report we will use detailed data from the Economic Census to update our ongoing analysis through 2017.

Here is a visual look at the growth since 1992. I have also included a line on the graph which is adjusted for “petflation” and gives us a better indication of the actual increase in the amount of product sold.

Retail Growth 1992 to 2017

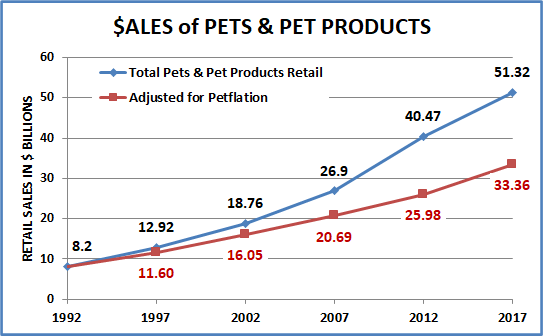
  • 1992 > 2017: Up $43.12B (+525.9%); Avg Growth = 7.6%
    • 1992 > 2012: Up $32.27B (+394.8%); Avg Growth = 8.3%
    • 2012 > 2017: Up $10.85B (+26.8%); Avg Growth = 4.9%

Real Growth 1992 to 2017 (Adjusted for petflation – Pet Food & Supplies CPI)

  • 1992 > 2017: Up $25.16B (+306.8%); Avg Growth = 5.8%
    • 1992 > 2012: Up $17.78B (+216.8%); Avg Growth = 5.9%
    • 2012 > 2017: Up $7.38B (+28.4%); Avg Growth = 5.1%

Note: Most of the growth (76.3%) in Pets, Pet Food and Supplies has been real growth. Pet Products Prices increased 53.8% in the 25 years from 1992 to 2017 compared to an increase of 74.6% in the Total U.S. CPI and a 138.6% increase in Pet Services Prices (Vet & Non-Vet combined) in just the 20 years from 1997 to 2017.

Pricing in Pet Products was an issue from 2007 to 2009 when prices jumped 17% in just two years, in the heart of the recession. Consumers started searching for value. This was a key point in Pet Products channel migration. On the flip side, from 2012 > 2017 Pet Products prices fell -1.25%. Although the growth rate during this period was down from the long term average, the increase in the amount of Pet Products purchased was actually greater than the $ increase.

We’ll stay with the total market and look at some key factors that have affected the overall growth since 1992.

Here’s how each factor changed during each of the five year measurements since 1992.

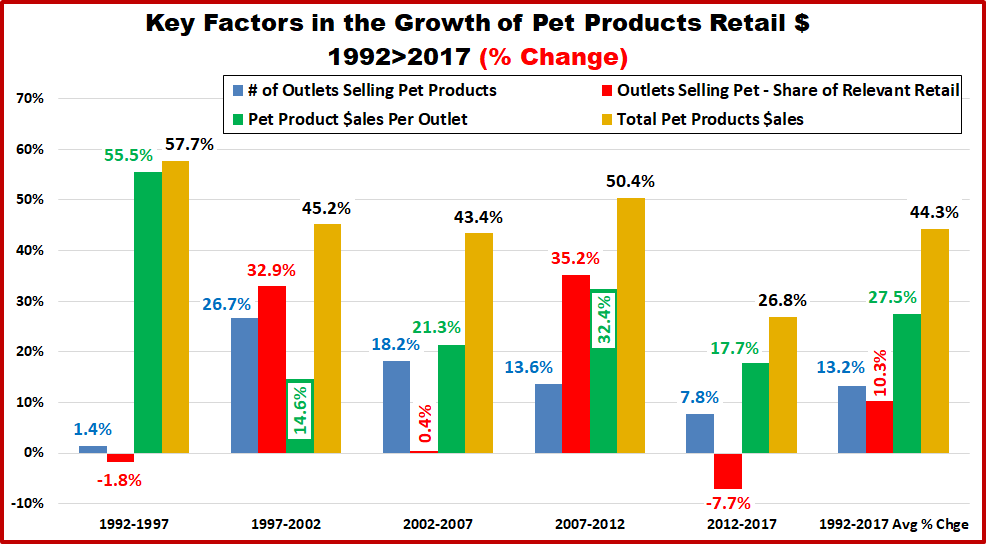
1992 to 1997 – No growth in outlets or in retailers’ share of overall market. The big growth was increased store volume due to increased consumer product demand – which was filled by expanded departments and bigger pet stores.

1997 to 2002– A 27% increase in number of outlets and a 15% increase in per store volume pushed sales up 45%. A huge increase in the representation of Pet in the overall market as it became available in stores doing over 35% of total retail.

2002 to 2007 – Store count continues to grow – up 18% and the per/store volume goes up even faster – +21%. Sales are up 43%. The overall Retail Market Share of outlets selling products remains stable at 35%.

2007 to 2012 – Another 18,000 stores (+14%) and a huge increase in per store volume (+32.4%). Consumers have started shopping intensely for value since the recession…and they found it as sales increased 50%. It was also easier to find products in a store, as outlets doing 47% of the total U.S. Retail market stocked pet supplies in 2012.

2012 to 2017 – Sales Growth slowed markedly to 26.8%. There were 12.600 more stores but +7.8% was much less than in the past. Pet Products stocking stores also loss share of the overall market but are still over 43%. It looks like this drop occurs regularly every 10 years. The $ lift was primarily due to a 17.7% increase in $ales per store – still relatively strong.

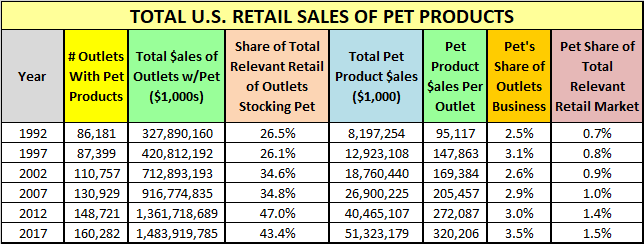
1992 to 2017 – Sales Now $51.3B; Up $43.1B (+525.9%)

  • 160,282 “pet” outlets; Up 74,101 (+86.0%)
  • Outlets stocking “pet” do 43.4% of U.S. Retail.
  • Pet Products do 3.5% of an outlet’s total sales.
  • Pet Products = 1.5% of Relevant Retail; 0.7% in 1992

Now, let’s see how the consumers decided to divide up their Pet Products $.

PET PRODUCTS SALES AND MARKET SHARE BY RETAIL CHANNEL

This chart shows the shows in detail the # of outlets, total pet product $ and market share of the retail channels and segments stocking pet products from 1992 to 2017. Use it as a reference point. Additional charts will follow.

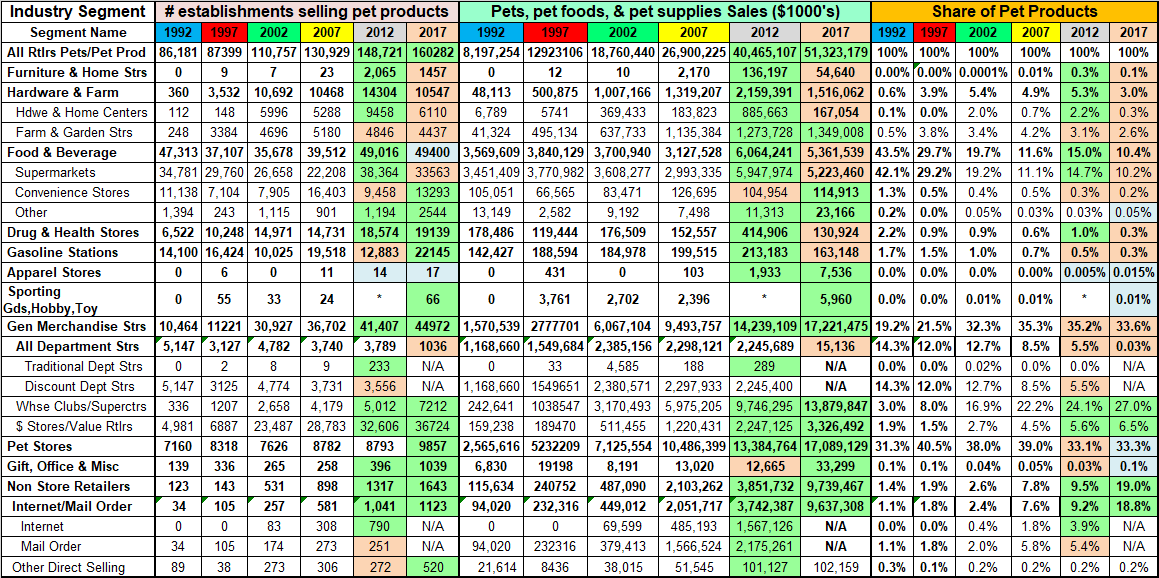
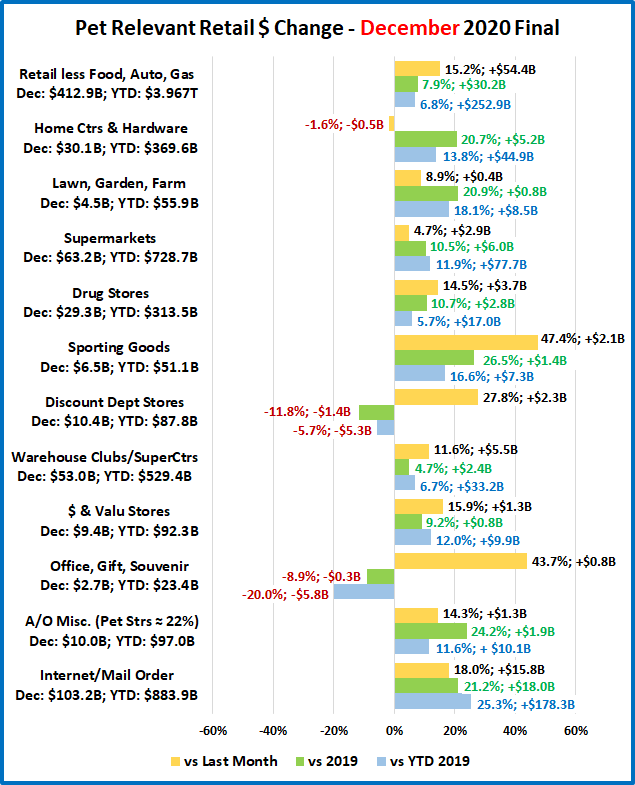
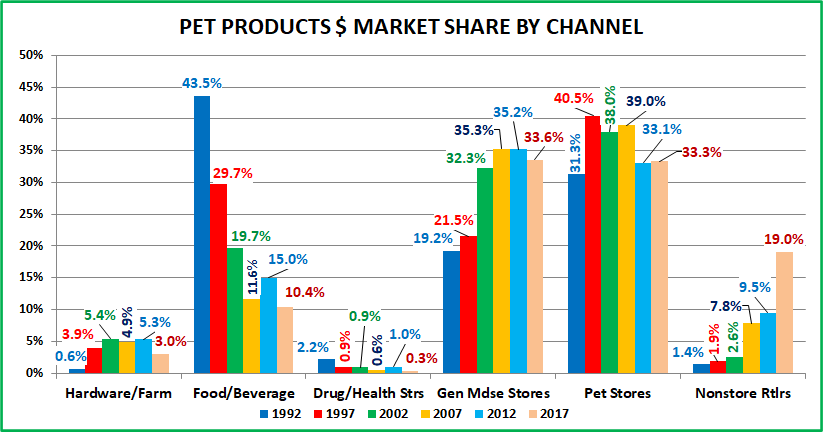
99.3% of Pet Products Sales are done by 5 major Retail Channels. Let’s look at their market share from 1992 to 2017.

Drug Stores were included for historical reference. In 1992, they had a bigger share than Nonstore and Hdwe/Farm combined. Now their $ and share are below Gas Stations. 5 Major channels account for 99.3% of Pet Products $.

Observations

Drug and Health Stores – They were once a small, but notable force in Pet Products sales. However, except for an uptick in 2012, their share of Pet Products $ has generally declined. Their Pet Products Sales are now basically impulse or convenience purchases, a pattern similar to that for Gas Stations and Convenience Stores.

Hardware and Farm – Early growth came from the Farm Store segment. Hardware jumped on board in 2002 and pushed the market share up to 5.4%, capturing 40% of this channel’s pet business. The overall share stayed fairly stable from 2002 to 2012 then plunged in 2017 due to huge drop in Hdwe/Home Centers Pet Products $. While Farm Stores $ have consistently grown since 1992, Hdwe/Home Ctrs have been on a true roller coaster ride since 2002.

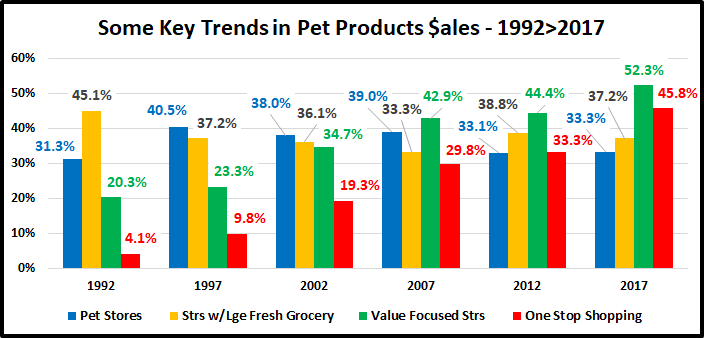
Food and Beverage – Supermarkets account for 98% of the business in this channel. In 1992 Supermarkets were the #1 Pet channel, with 42.1% of the business. They increased their business 9.5% in 1997. Unfortunately, overall “Pet” sales took off – up 55%, so their market share fell 30%. Sales stagnated in 2002 and actually dropped in 2007. Needless to say, their market share continued to plummet – down 73% from the 1992 high. Where did the business go? – just about everywhere else, but primarily to General Merchandise Stores and Pet Stores. Then from 2007 to 2012 they executed a remarkable turnaround.  The number of Supermarkets carrying pet products increased by over 70%. They more than doubled their pet sales and gained back 3.6 points in market share. However, 2012 to 2017 brought another turnaround – a negative one. The number of Supermarkets carrying Pet Products fell -12.5% and their Pet Products $ dropped -$725M (-12.2%). Their market share is at an all-time low of 10.2%, which is 76% below 1992. Some of the business may have been lost to SuperCtrs/Clubs or even Pet Stores, but most probably migrated to the Internet.

Nonstore Retailers – This channel includes both mail order and the internet. The increases in pet products $ have been truly astronomical. Sales in 2017 are 100 times what they were in 1992 and their Market share is up over 1500%. Since 2007 and especially since 2012 the growth has been fueled by the internet. In the years up to and including 2012 the internet/mail order share of Pet Products $ mirrored their share of Total Retail $. However, they have stepped up in Pet Products since then. Internet/Mail order now sells 18.8% of Pet Products $, compared to 16.1% of total relevant retail $.

Pet Stores – In 1992 Pet Stores were the second largest retail channel selling pet products. The category caught fire. Big Box Pet Super Stores were developed and built to offer the consumer the wider selection that they sought. In 1997, due to the growth of chains, Pet Stores moved into the #1 position with a 40.5% share of the business. The proliferation of Super Stores resulted in the closing of a number of smaller Independents, so the number of stores and market share dipped slightly to 38.0% in 2002. They were still #1 but now they were being strongly pursued by General Merchandise Stores – not Supermarkets.  More Super Stores, along with a continued high consumer demand, brought their market share back up to 39.0% in 2007. They had maintained the #1 status with a market share of 38 – 40% for over 10 years. Then…the recession happened, and consumers became focused on value. Their store count was the same and sales grew but their market share fell 5.9 points (-15.1%). On the surface, it appears that the bulk of the business went to Grocery and Internet/Mail-order but almost every major channel and a few minor players got a piece of their lost share. Things certainly changed in the period from 2012 to 2017 as the world, including retail began to move increasingly online. Pet Stores not only held their ground, but they also actually had a slight gain in share. They capitalized on Pet Parents desire for personal interaction in pet products purchases along with their desire for the convenience of one stop shopping. More Pet Stores began offering grooming services and some even added Veterinary services. They will never beat Internet product prices, but you can’t get your dog groomed online!

Minor Players – Although their combined market share is under 1%, the widespread appeal of Pets has brought in retailers from a variety of other “Specialty” channels – Home Goods (Furniture), Value Clothing Stores, Sporting Goods, Gift…to name a few. Although their selection is generally limited, they do broaden the consumer availability of certain pet product categories in the overall U.S. Retail Market. The success or failure of their venture into the Pet Products world is usually dependent upon the overall success of the individual retailer. If they are attracting consumers and their business is growing, then they may have some success with Pet. After all it appeals to 67% of U.S. households.

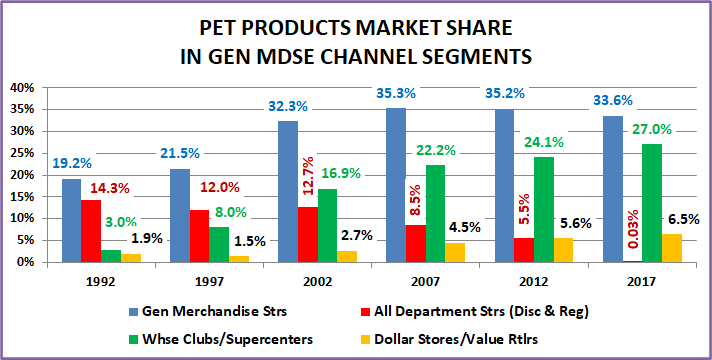
General Merchandise Stores – Currently they are hanging on as the #1 major channel in Pet Products sales. This group enjoyed strong to spectacular growth from 1992 to 2007. The number of outlets grew from 10K to 37K (+250%); sales grew $8B to $9.5B (+533%); market share grew from 19.1% to 35.3% (+83.9%). From 2007 to 2012, the number of outlets continued to grow, and sales increased to $14.2B (+49.5%) but their market share actually fell 0.1%…Yet, they still took over the #1 position in Pet…by just matching the overall market increase. From 2012 to 2017, their number of outlets and sales grew but couldn’t keep up with the internet, so their share fell. There were also some changes within the segments in terms of product mix and classification. This is a large and complex channel and deserves a closer look.

All Department Stores – Stores have been classified as either Traditional Department Stores, like Macy’s or J.C. Penney or Discount Department Stores, like Wal-Mart or Target. For the Economic Census that has changed.

Traditional Department Stores Although they do 8% of this channel’s overall business, they are basically a nonentity in Pet Products. These stores have consistently loss market share as they have done little to meet the consumer’s changing “needs” – including failing to recognize and embrace the Pet Phenomenon in the U.S.

Discount Department Stores – This segment is the one that started the decline in traditional Department Stores. In terms of Pet Market Share, these stores were at their peak in 1992. The commitment to SuperCenters and the rise of Club Stores started their decline. Sales continued to increase until 2002 and there was even a little uptick in market share between 2002 and 2007. From 2007 to 2012 sales flattened out and the number of outlets fell. In 2012 they were surpassed by the Dollar/Value stores in Pet Products’ market share. Between 2012 and 2017 the corporate owners decided to revise the product mix in many of these outlets. The continued growth in sales by Super Centers convinced them to add increasing quantities of fresh groceries to the product mix. Although the fresh offering is not as extensive as Super Centers it became significant. For the Economic Census, it was decided to eliminate the Discount Department Store Classification. Most of the existing outlets were classified as Super Centers. Those with an insignificant fresh grocery segment were lumped in with All Department Stores which included the traditional stores. The result was that Pet Product sales in the all department stores segment now mirrored that of the traditional stores – essentially zero.

SuperCenters & Warehouse Club Stores – This segment has been a retail winner since it came into play in the 90’s. It has shown consistent, even spectacular growth and in every measuring period its % increase in Pet Products $ has surpassed even the impressive growth rate of the overall Pet Products market. In 2007 they moved up in rank to #2, behind only Pet Stores in sales. Their pet products sales and share growth slowed from 2012>2017 and much of the growth from 2012 to 2017 must be attributed to the reclassification of many Discount Department stores. In fact, in 2012 the combined Pet Products $ share of SuperCtr/Clubs and Discount Dept Stores was 29.6%. In 2017, the share of all stores classified as SuperCtr/Club outlets was 27.0%. Like almost everyone else, this group lost $ to the internet.

$ Stores/Value Retailers – This channel was originally occupied by 5&10¢ Stores. They faded and were replaced by these Value Retailers. Since 1997, the store count and Pet Product sales have gone up dramatically. Their appeal and their share of the total market has grown markedly since the recession. In terms of number of outlets selling Pet Products, in 2017 they passed Supermarkets to take over the top spot. Their sales and market share also grew so they now rank #5 in Pet Products sales. Unlike most channels, they gained ground, in the internet wave.

Speaking of the internet wave, let’s take a closer look at the specifics for 2012>2017. First, the major channels Here’s the 2017 market share by Channel: (Arrows show if they are up , down and by how much in share from 2012)

  • GM Strs: 33.6% ↓1.6
  • Pet Stores: 33.3% ↑0.2
  • Nonstore Retailers: 19.0% ↑9.5
  • Food & Bev (Groc): 10.4% ↓4.6
  • Hdwe & Farm: 3.0% ↓2.3
  • All Other: 0.7% ↓1.2

Only Pet Stores held their ground and even gained a little in the Internet tsunami.

Now let’s look at the individual segments in terms of 2017: (Same rules as above)

  • Pet Stores: 33.3% ↑0.2
  • SuperCtrs/Club: 27.0% ↑2.9
  • Internet/MailOrder: 18.8% ↑9.6
  • Supermarkets: 10.2% ↓4.5
  • $ Value Strs: 6.5% ↑0.9
  • Farm Stores: 2.6% ↓0.5
  • Gas/Convenience: 0.5% ↓0.3
  • Hardware: 0.3% ↓1.9
  • Drug Stores: 0.3% ↓0.7
  • Other Nonstore: 0.2% ↔0.0
  • Furniture/Home: 0.1% ↓0.2
  • All Dept Strs: 0.03% ↓5.47

 The story is a bit more complex, and the specifics can be a little bit misleading. The gain by SuperCtrs/Clubs was largely due to the assimilation of many Discount Department Stores into this channel. The combined share of these two channels was 27.0% in 2017. That’s down -2.6% from 29.6% in 2012. There was also another winner – $ Value Stores. Consumers love the value and convenience of these outlets and they continue a rapid expansion in numbers.

The move to the internet is definitely a trend. Let’s look at some major trends that have impacted and continue to affect Pet Product Sales over the 25 years from 1992 to 2017.

There are 3 driving forces in consumer spending behavior:

  • Value (quality + price) – Looking for a deal.
  • Convenience – Make shopping easy.
  • Selection – They want choices. 

With that in mind, let’s look at the trends indicated by our analysis:

  1. The biggest trend is Value. It has shown consistent growth in importance and has been the single biggest factor since 2007. The channels that focus on Value are SuperCtr/Clubs, $ Stores and Internet/Mail order. They are definitely winning.
  2. One Stop Shopping is all about convenience. This is the second biggest driver and explains the ongoing success of SuperCtr/Clubs and the Internet. Supermarkets began this trend in the late 1970s by radically expanding their Gen Mdse sections in an effort to fulfill this consumer need.
  3. Groceries in the store. In 1992 consumers bought most pet products where they shopped for groceries – Supermarkets. In 1997 Supermarkets lost the top spot to Pet Stores. The GM Channel was also growing at this time and SuperCtr/Clubs also offered full grocery sections. Since 2012, consumers have come full circle and once again buy most Pet Products where they shop for groceries.
  4. The rise of Pet Super Stores and chains took off in the 90s. Their huge selection of Pet Products had a great appeal to the new generation of Pet Owners – Now Pet Parents. Pet Stores became the single biggest channel for Pet Products sales in 1997. Their success caused other channels to expand their Pet Sections. Pet Stores lost some ground in 2012 but they held onto the top spot and even gained share in 2017 by offering more Pet Services in store. They appealed to the consumer with 1 stop pet shopping.
  5. Internet – Their success should be no surprise. The game plan for online retailers exactly fits the consumers “wish list”. Great Prices! Shop without leaving home. Plus, a nearly unlimited selection

Summary

The underlying cause behind migration is evolution. In the migration of Pet Products there are two key evolutions taking place. The first is the evolution of Pet Owners to Pet Parents. Pet Parents are much more concerned about fulfilling the wants and needs of their Pet Children. This transformation took hold in the 90’s and accelerated during the early 2000’s when Pet Parents increasingly personified their pets. They began reading labels, became increasingly concerned about nutrition and now generally transfer human needs to their pet children. This movement continues to grow stronger.

The other evolution occurred in the retail marketplace and with all consumers. Consumers became less brand driven in their purchasing behavior and more concerned about value, convenience and selection. The great recession further cemented Value at the top. Online shopping was growing far before the pandemic moved it to the retail forefront.

We see the migratory results of the ongoing evolutions in our analysis.  In the 90s Pet Super Stores grew rapidly because they offered an unparalleled, broad selection of products to the ever increasing number of Pet Parents who were ready, willing and able to buy. Their success caught the attention of other retailers who expanded their Pet Products offerings. SuperCenters and Clubs were also growing strong at this time because these huge stores offered great Value and 1 stop shopping for groceries and a wide selection of GM categories, including Pet.

Everyone wants value but sometimes you don’t want to fight the crowds  – $/Value Stores are the answer. Great everyday prices plus brand name “close outs” in a small footprint store that is easy to navigate. Plus, they carry Pet Products. They continue to add stores and currently have more outlets stocking pet items than any other channel.

That brings us to the Internet, our most recent and largest migration, +9.6% gain in share. Want a bigger selection…. Go online. No one can build a store big enough to stock the selection of products available online…and with no brick and mortar overhead…you can get great value. Plus, you can shop for the best price and get what you want without ever leaving your easy chair…talk about convenient.

At this point, Pet Products have grown in importance and spread across the U.S. retail landscape. Consumer $ales are $51.3B, +525% from 1992. They are available in 160K outlets, up from 86K in 1992. They also account for 1.5% of Total Relevant Retail $, compared to 0.7% in 1992. The migration will continue. Brick ‘n Mortar Businesses need to adapt in the current internet surge. They must have an online presence and offer delivery and same day pickup in store/curbside if possible. Pet Stores have a unique advantage as they can offer pet services and personal interaction with Pet Parents and their pets – which can’t happen online. We’ll see how everyone adapts and what changes the next chapter brings.

Retail Channel Monthly $ Update – March Final & April Advance

It has been a full year since the Retail market bottomed out in April 2020, so this month’s retail update is particularly significant. Consumer spending behavior continues to evolve. In this report we will track the changes, migration between channels and the retail recovery with data from two reports provided by the U.S. Census Bureau.

The Reports are the Monthly Retail Sales Report and the Advance Retail Sales Report. Both are derived from sales data gathered from retailers across the U.S. and are published monthly at the same time. The Advance Report has a smaller sample size so it can be published quickly – about 2 weeks after month end. The Monthly Final Report includes data from all respondents, so it takes longer to compile the data – about 6 weeks. Although the sample size for the Advance report is smaller, the results over the years have proven it to be statistically accurate with the final monthly reports. The biggest difference is that the full sample in the Final report allows us to “drill” a little deeper into the retail channels.

We will begin with the Final Retail Report for March and then move to the Advance Retail Report for April. Remember, the maximum retail impact of the pandemic occurred in April 2020, but it began in March. We will compare 2021 to both 2020 and 2019 to document the progress that the retail market has made towards a full recovery.

Both reports include the following:

  • Total Retail, Restaurants, Auto, Gas Stations and Relevant Retail (removing Restaurants, Auto and Gas)
  • Individual Channel Data – This will be more detailed in the “Final” reports and we fill focus on Pet Relevant Channels

The information will be presented in detailed charts to facilitate visual comparison between groups/channels of:

  • Current Month change – % & $ vs previous month
  • Current Month change – % & $ vs same month in 2020 and 2019
  • Current YTD change – % & $ vs 2020 and 2019
  • Monthly and Year To Date $ will also be shown for each group/channel

First, the March Final. Retail hit bottom in April but began recovery, hitting record $ in December. In January & February $ fell but were still records for those months. Sales skyrocketed in March, beating December for a new all time $ record. Here are the major retail groups. (All Data is Actual, Not Seasonally Adjusted)

The final total is $2.0B more than the Advance report projected a month ago. All Groups but Relevant Retail were up. The specifics were: Auto: +$1.7B; Restaurants: +$0.9B; Gas Stations: +$0.8B; Relevant Retail: -$1.2B. All groups were up vs February and Total Retail set a new monthly record of $629.9B. Total $ales broke $600B for the first time in December and set individual monthly records in both January and February thanks to strong performances by Relevant Retail and Auto. In March, all groups contributed to the new monthly record and all, but Restaurants were positive in all measurements. Restaurants are still slightly negative vs 2019 and YTD but overall, Retail is strongly recovering.

Now, let’s see how some Key Pet Relevant channels were doing in March.

  • Overall– All 11 channels were up vs February and 10 of 11 were up vs March 2020 and March 2019. In YTD $, 10 were up vs 2020 and 9 vs 2019. March was a strong month, both overall and in the details.
  • Building Material Stores – Their amazing lift continues. The ongoing surge came as a result of pandemic spending patterns developed in 2020. Consumers began focusing on their homes. They’re still showing 20+% increases, with Farm Stores leading the way with 30+% increases in all measurements. Sporting Goods stores are not in this group but have a similar spending pattern. Sales took off in May, hit a record peak in December and continued strong into 2021, spiking in March. Compared to 2019, they are +67.6% vs March and +51.6% YTD
  • Food & Drug – Supermarkets finished 2020 up +$77.7B. Sales are up vs February but down vs the March 2020 binge. They are up YTD vs 2019 but about even with 2020. Drug Stores ended up +$17B (+5.7%) for 2020. Their $ fell in January and February but March $ set a new record. All measurements are positive and YTD $ are +3.0%.
  • General Merchandise Stores – $ in all channels had been falling from their December peak but sales in March grew 25% from February. Discount Department Store were having problems even before the pandemic, but they led the way in the March lift, +34.9% vs February. Clubs/SuperCtrs and $ Stores remain strong. These channels promote value. Their success in all measurements reinforces its importance in Consumer spending decisions.
  • Office, Gift & Souvenir Stores– March brought a big $ lift…finally. They were hard hit by the pandemic and still have negative numbers vs 2019 – monthly and YTD. Recovery is still a long way off but might be on the horizon.
  • Internet/Mail Order – The pandemic has accelerated this channel’s growth. Last March they were up 12.5% YTD vs 2019. This year they are up 46.6%. The pandemic lift spending pattern basically doubled the rate of increase.
  • A/O Miscellaneous – This is a group of small to midsized specialty retailers – chains and independents. It includes Florists, Art Stores and Pet Stores (22>24% of total $). Pet Stores were usually essential, but most stores were not. Stores began reopening in May and the $ grew. Their 2020 total sales were up +11.6%. March YTD sales are +$4.8B (+23.2%) vs 2020 and +$7.6B (+42.8%) vs 2019. Recovery is here and with continuing growth!

The Relevant Retail Segment began recovery in May, reached a record level in December, then $ fell in January & February. March set a new monthly record and virtually all members of this group are showing growth. Currently the key drivers are the Internet, SuperCtrs/Clubs/$ Stores and Hdwe/Farm. Now, here are the Advance numbers for April.

2020 will always be a memorable year for both its traumas and triumphs. In April & May we experienced the 2 biggest retail spending drops in history, but the problems actually began in March. Sales increased slightly from February but were $34.1B less than March 2019. Retail sales began to recover in June and in October, YTD Total Retail turned positive for the 1st time since February. In December, Total Retail broke the $600B barrier – a historic first. While sales fell from their December peak, monthly sales records were set in both January and February. Then they took off again in March, breaking $600B again while setting a new monthly sales record of $627.9B. April sales were down slightly but were the second highest in history. April Sales from all the major groups were close to March $. YTD Restaurant $ were down slightly from 2019. This is the only negative vs 2020 or 2019 for any group. In April of 2020 Retail sales fell $100B from 2019, the biggest monthly year over year drop in history. In March 2021 sales were up $152B over 2020. In April, the increase over 2020 was $209B. Certain retail segments and other areas of the economy are still suffering, and spending habits have changed but the overall Retail marketplace has recovered and is stronger than ever.

Total Retail – In March, Total Retail set a record for the most spending in any month in any year. In April, $ales dipped by -$13.2B (-2.1%) to $616.7B but were still $209.5B (51.4%) more than April 2020 – a new record increase, double the size of last year’s record drop. If you compare the YTD 2021 spending to 2019, you see an increase of $334.8B (+17.4%). That is an average annual spending increase of 8.4%. If you just looked at these strong topline growth numbers, you would not suspect that a retail spending crisis had ever happened. Always look below the surface.

Restaurants – This is the only big group with any negative measurements. Last February YTD sales were up 8.1% vs 2019. The Pandemic changed that. Restaurants started to close or cease in person dining in March and sales fell -$33.3B (-52.5%) compared to March 2019. Sales bottomed out in April at $30.1, the lowest April sales since 2003. Sales started to slowly increase in May but never reached a level higher than 88% compared to the previous year. 2021 started off slowly. Through February,  YTD sales were down -16.7% from pre-pandemic 2020 and -10.0% from 2019. In March sales took off. They grew slightly in April but were more than double April 2020 and even ahead of 2019. YTD their $ are ahead of 2020 but still $10.8B (-4.4%) behind 2019. They are not “there yet” but their recovery is strengthening.

Auto (Motor Vehicle & Parts Dealers)   – Staying home causes your car to be less of a focus in your life. Sales began to fall in March 2020 and hit bottom in April. Auto Dealers began combating this “stay at home” attitude with fantastic deals and a lot of advertising. It worked. They finished 2020 up 1% vs 2019 and have returned to a strong positive pattern in 2021. The “attitude” grew amazingly positive in March and slowed only slightly in April as sales exceeded $142B in both months, by far the 2 biggest months in history. To show how well consumers responded to their campaign you just need to look at the data. This group has exceeded $110B in monthly sales only 10 times in history. 8 of those occurred after the onset of the pandemic.  YTD Avg Growth Since 2019 = +12.6% – the best performance of any big group.

Gas Stations – Gas Station $ales have been a mixed bag. If you drive less, you visit the gas station less often. Sales turned down in March 2020 and reached their low point in April. They moved up but generally stayed about 15% below 2019 levels for the rest of 2020. In February they were still behind 2020 in monthly and YTD $ but ahead of 2019 in both measurements. In March, sales skyrocketed. They increased only slightly in April but were 77.4% above the April 2020 “bottom”. They have been positive in all measurements vs both 2019 and 2020 since March. Their comeback continues but there is another factor that must be considered – inflation. Gas prices can be pretty volatile. They dipped in the first 2 months of the pandemic but then returned to more normal levels for the balance of 2020. They began strongly inflating in 2021, peaking in April. The April 2021 prices were 49.6% above April 2020. That means that 64% of the 77.4% year over year lift came from just higher prices. Analyzing retail can be complicated. YTD Avg Growth = +2.9%

Relevant Retail – Less Auto, Gas and Restaurants – This is what we consider the “core” of U.S. retail and has traditionally accounted for about 60% of Total Retail Spending. When you look at the individual channels in this group, you see a variety of results due to many factors – non-essential closures, binge buying, online shopping and a consumer focus on “home”. However, overall, April 2020 was the only month in which spending in this group was down vs 2019. Monthly $ales exceeded $400B for the first time ever in December ($407B). They finished 2020 up $260B, +7.1%. Their performance was the only reason that Total Retail was able to finish 2020 with positive numbers, +0.5%. Sales fell in January and February but continued to set monthly records. In March they turned sharply up again but dipped slightly in April. Currently, they are up $80.1B, +28.5% vs April 2020 and  +$195.5B, +16.8% YTD. We should note that March ($371.8B) and April ($361.0B) spending were the third and fourth highest monthly totals of all time, trailing only December 2020 and December 2019. We should also note that the Relevant Retail group has posted positive numbers versus last year and YTD for every month since April 2020 and their average YTD growth rate since 2019 now stands at +9.8%. Through April virtually all channels have now turned positive vs 2020 and 2019. However, the primary drivers throughout the pandemic were and continue to be Nonstore, Grocery, SuperCenters/Clubs/$ Stores plus a never ending “spring lift” from Hardware/Farm and Sporting Goods.

Now let’s look at what is happening in the individual retail channels to see where the $ are coming from. April was not as big as March, but you will see that some of the increases vs 2020 are literally “off the charts”. The groups are less defined than in the Final Monthly reports and we will look across the whole market, not just pet relevant outlets.

Sales in only 2 of 13 channels were up vs record March $ but Only 1 channel was down vs March 2020 $ and 2020 YTD. A different channel was down vs 2019 numbers. (Relevant Retail YTD Avg Annual Growth Rate since 2019 = +9.8%)

After hitting bottom in April 2020, Relevant Retail has now beaten the previous year’s $ for 12 consecutive months. The group set an all-time record of $407B in December and finished  2020 +$260B vs 2019. They started 2021 strong, with record sales in every month including #3 and #4 all time in March & April. Essential channels are still the primary drivers:

  • Nonstore Retailers – The biggest driver. Online shopping continues to grow in # of households and in $.
  • Food & Beverage – Grocery– Restaurant $ are improving but consumers continue to eat & drink more at home.
  • Bldg Materials/Garden/Farm– Their “Spring” lift continues unabated as consumers focus on their home.
  • SuperCtrs/Club/Value/$ Strs – They keep the GM channel positive. Value is still a major consumer priority.

Regarding the Individual Large Channels (Includes YTD Avg Annual Growth Rate since 2019)

General Merchandise Stores – Even though sales dropped in April, all other numbers remain positive. Department Stores $ remain up vs 2020 but down vs 2019. They were having problems before the Pandemic. The growth by Club/SuperCtr/$ stores has slowed to +7.4% in April, down from +14.7% in January but these stores are still the key.

  • YTD Avg Annual Growth: All GM = +5.7%; Dept Stores = -2.9%; Club/SuprCtr/$ = +7.4%

Food and Beverage, plus Health & Personal Care Stores – Sales in Grocery were down in March and April from 2020 – No surprise, as these were 2020 binge months – especially March. The Health, Personal Care group finished 2020 at +1.8%. 2021 has started even better. With a strong March & April, YTD they are +7.8% vs 2020 and +8.5% vs 2019.

  • YTD Avg Annual Growth: Grocery = +6.6%; Health/Drug Stores = +4.2%

Clothing and Accessories; Electronic & Appliances; Home Furnishings – March & April have been spectacular for all these channels. The increases vs April 2020 were literally off the chart for Electronics and Clothing. All of these groups are now positive in all measurements vs 2020 or 2019.

  • YTD Avg Annual Growth: Clothing = +0.6%; Electronic/Appliance = +2.0%; Furniture = +10.4%

Building Material, Farm & Garden & Hardware – Their Spring lift began on time in 2020 and it has never stopped. They have greatly benefited from consumers turning their focus to their home needs. They finished 2020 +53B (+13.8%). Sales took off in March and increased in April. They are +32.9% vs April 2020 and +25.5% YTD. Avg Annual Growth = +15.2%

Sporting Goods, Hobby and Book Stores – Book & Hobby stores are open but Sporting Goods stores have driven the lift in this group. Consumers turned their attention to personal recreation and sales in Sporting Goods outlets took off. The group ended 2020 +5.5% vs 2019. The growth accelerated in 2021. January > April set monthly records and March had the most $ of any non-December month in history. In April they are +59.4% vs 2020. YTD Avg Annual Growth = +17.2%

All Miscellaneous Stores – Pet Stores were deemed essential but most other stores were not, so closures hit this group particularly hard. Sales hit bottom at -$3.8B in April then began to rebound. They finished with a strong December and ended 2020 down $1.0B, -0.7%. In March and April sales took off. April sales were only up 0.6% from March but +87.4% from April 2020. Remember, only 2 channels had a March>April increase. Their YTD sales are now 30.4% above 2020 and 27.0% more than 2019. It appears that their recovery has become very real. YTD Avg Annual Growth = +12.7%

NonStore Retailers – 90% of the volume of this group comes from Internet/Mail Order/TV businesses. The COVID-19 crisis accelerated the movement to online retail. In February 2020 NonStore $ were 8.6% YTD. In December monthly sales exceeded $100B for the 1st time. They ended 2020 at +21.4%, +$162.9B. Their increase was 63% of the total $ increase for Relevant Retail Channels. Their 2020 performance far exceeded their 12.9% increase in 2019 and every month in 2021 has produced record $. April is +14.2% vs 2020 and YTD $ are +20.8%. YTD Avg Annual Growth = +18.7%

Note: Almost without exception, online sales by brick ‘n mortar retailers are recorded with their regular store sales.

Recap – 2020 was quite a year. April & May had the 2 biggest year over year sales decreases in history while December sales broke $600B for the first time. 2021 may become even more memorable. April and March had the 2 biggest year over year monthly sales increases in history. The total increase was +$361B for these 2 months, more than twice the -$175B decrease in the 3 months from March>May 2020. In 2021, March and April also took the top 2 spots for monthly sales. At yearend 2020, Restaurants, Auto and Gas Stations were still struggling but Auto had largely recovered. Relevant retail had segments that also struggled but overall, they led the way for Total Spending to finish the year +0.5% vs 2019. 2021 has started out even more positive. The Auto Segment is setting sales records. Gas Stations $ are now all positive and YTD Restaurant $ are only slightly below 2020 and 2019. As documented in the report, the recovery in Relevant retail has become real for virtually all channels and monthly sales continue to set records. Retail recovery is here…now!

Comparing the Spending Demographics of the Industry Segments – SIDE BY SIDE

The first six reports of our Pet Spending Demographics analysis have been very detailed, data driven and intense. We looked at the industry as a whole and each of the individual Industry segments separately. Recent years have seen some turmoil. 2017 was a year of Value and consumers responded with a $9.8B Pet spending increase. In 2018 we saw the very real impact of outside influence on the industry as the FDA warning on grain free dog food caused an immediate $2.3B drop in spending in the second half. New tariffs also flattened spending in Supplies in the second half. However, there was some good news. Veterinary Spending grew slightly but Services had a record increase. That brought us to 2019. Food had a strong rebound, but the impact of the Tariffs really hit home. Supplies $ fell a record $2.98B. Services had a small decrease but essentially remained stable at their new higher spending level. Veterinary $ also had another small increase but a high inflation rate actually caused the amount of Veterinary Services to fall. The result was a net decrease of 0.2% in Total Pet $. So, the turmoil continued but so did the youth movement. There were some exceptions, but Pet Spending continued to move away from Baby Boomers and towards the younger groups, especially Gen X.

We have often referenced the similarities and differences in spending between Total Pet and the individual industry segments. Total Pet Spending is a sum of the parts and not all parts are equal. In this final report we are going to put the segments side by side to make the parallels, differences and changes from 2018 more readily apparent. We will address:

  • “The big spenders” – those groups which account for the bulk of pet spending.
  • The best and worst performing segments in each of twelve demographic categories
  • The segments with the biggest changes in spending $ – both positive and negative
  • And of course, the “Ultimate Spending CUs”

The emphasis is on “visual” side by side comparisons to allow you to quickly compare the industry segments. We’ll try to minimalize our comments. You can always reference one of the specific reports for more details. We’ll also break the charts up into smaller pieces that are demographically related to make the comparison more focused and easier.

Before we get started, let’s take a look at the current market share of the industry segments. The following 2 charts show the 2019 share of spending for each segment and the evolution over the past 27 years. 1992 was the last year that the Food Segment accounted for 50% of Total Pet Spending. By the way, Total Pet Spending was $16.2B in 1992. We have come a long way – +384%; annual growth rate of 6.01%. This will help put our comparisons into better perspective.

Food: 39.8%; Up from 36.7%

Supplies: 21.4%; Down from 25.2%

Veterinary: 27.8%; Up from 27.0%

Services: 11.0%; Down from 11.1%

The Food segment rebounded to almost 40% of Pet $. Back in 2015 it was 43.5%, the highest level since 1998. At the same time, Pet Supplies fell to 21.4%, the lowest level since 2002. This is at least a short term reversal of the most visible long term industry trend – the decline of Food share as Supplies gained in importance. This began in the 90’s when Pet Owners became Pet Parents. At the same time, Pet Chains and Super Stores came to the forefront and there was a big Pet Product expansion into the Mass Market. In 2019 Veterinary spending had a slight gain, but it has been the most stable through the years. After the big lift in 2018, Services held onto to their new level of importance. Food trends and the impact of petflation on Supplies have put the Product segments on a roller coaster ride in recent years.

Now let’s get started with a look at the “Big Spenders”. The following 2 charts will compare the market share and performance in all Pet Industry segments by the groups responsible for the bulk of the spending in 10 demographic categories. These are the groups that we identified in our Total Pet analysis to generate at least a 60% market share of spending. As you recall, in Pet Services, we had to alter two groups slightly to better target the spending. However, to have a true side by side comparison we need to use the same groups for all. The market share dips below 60% in 2 cases, to a low of 57.0%. This lowest share is related to Veterinary CU Composition and is primarily due to a spectacular year by Singles. The other is in Services and reflects the urban nature of the segment. Even the low point is within 5% of our target and 96% of all measurements meet or exceed the 60% requirement, so the comparison is very valid.

The chart makes it especially easy to compare performance across categories. Remember, performance levels above 120% show a very high level of importance for this category in terms of increased spending. Unfortunately, it also indicates a high spending disparity among the segments within the category. There are 2 charts, each with 5 categories.

  • White, Non-Hispanic – This group has an 84+% market share in every Segment. Minorities account for 31.4% of CUs but only 9 to 15% of spending in any segment. Factors: Lower income for Hispanics and African Americans and lower Pet ownership in Asians and African Americans. They had a slight share gain in Total with larger gains in Services and especially Food. Veterinary was unchanged but the Supplies share plummeted, replacing Food on the bottom.
  • Homeowners – Homeownership is very important in Pet Ownership and subsequently in all Pet Spending. It also increases with age. This group’s share of Total Pet bounced back after falling below 80% for the first time in 2018. Veterinary again held its ground, but Food and Services had share increases of 4%. Supplies lost 3 points in share and is now the only segment under 80%. Homeowners with or w/o a Mtge were up in Food and down in Supplies. Their results were mixed in the Service segments. Renters spent less in all segments but Veterinary.
  • 2+ People in CU2 is the magic number in pet ownership. This year, all segments but Food fell in share and performance because Singles had another good year. This group is still under 120% because spending peaked at 3 person CUs in all segments, but Services (2 person CUs) then went down in 4+ CU’s. In both Service segments the performance of 5+ person CUs is actually worse than singles.
  • Associates Degree or Higher – Higher education often correlates with higher income and we see a similar spending pattern. The group grew in size but fell in share and performance in all segments, but Services. The biggest decrease in share (-2.8%) and performance (-7.7%) came in Veterinary, while Services gained 3.7% in share. Spending became a little more balanced in terms of Education in all but the most discretionary segment – Services.
  • Everyone WorksIncome is important, and the # of Earners became more important in 2019, with one exception – Services. The difference in Services came from a big lift from Single, No Earner. Younger CUs have more earners and pet spending has been skewing towards the younger generations. Note: 2 Segments have reached the 120% level.

  • All Wage & Salary Earners – Incomes vary widely in this group, so performance tends to be lower. However, all segments, but Services gained in share and performance. The biggest gains came in Food and Veterinary. The Food increase was driven by White Collar while the Veterinary lift came from all workers while their “Bosses” spent less.
  • Over $70K Income INCOME MATTERS MOST IN PET SPENDING! As spending becomes more discretionary the importance of income increases. Food still has the lowest share and performance but had the biggest gains. The only segment with decreased share and performance was Veterinary. Veterinary spending became more income balanced while Food went in the opposite direction.
  • 35 to 64 yrs – Includes the 3 highest income segments. This group increased both share and performance In Total Pet due to Food where performance reached 120%. Supplies had a minimal increase but both Services segments fell with Services performance falling below 120%. All ages in the group spent more on Food but the results were mixed for other segment. Overall, the best performance came from the 35>44 yr olds, followed by 55>64.
  • All Suburban – Most Pet $ are spent here and they gained ground in all segments but Supplies. The biggest driver in their performance was the bigger Suburbs, 2500>. The biggest lift was in Services where performance broke 100% for the 1st time. Rural, Central City and Suburbs <2500 all decreased spending in Total Pet and 3 of 4 Segments.
  • Married Couples – Marriage has been important to spending in all segments. In 2019 it became less important in all segments but Food. The biggest drops came in Supplies and Veterinary. In fact, Veterinary share fell below 60% and performance below 120%. Overall, couples only did the worst but also remember that Singles had a strong year.

Now we’ll drill a little deeper to look at the Best and Worst performing segments in each category. Color Highlighted cells are different from Total Pet; * = New Winner/Loser; ↑↓ = 5+% Performance Change from 2018. We will divide the categories into related groups. First, those related to Income.

  • IncomeIncome matters, and its importance is growing in the Product Segments. The disparity between first and last place increased by 30% in Food but doubled in Supplies. The Veterinary winner dialed down from $200k> in 2018 and the disparity decreased by 16%. The gap in Services is still astronomical but down 6% from 2018. The changes in Veterinary helped to decrease Total Pet disparity by 8% but the difference is still huge in this category.
  • # Earners More earners = more income. 2 Earners became the magic number which reflects the importance of Gen X and Millennial CUs. In Supplies, 3 Earners, the highest income group, won. The disparity grew in Food but fell in Veterinary. However, the number of Earners gained in importance in all segments but Services.
  • Occupation Self-Employed and Mgrs & Professionals are #1 and #2 in CU income and expenditures. They again occupy all the top spots. The bottom spots are again occupied by either Retirees or Blue Collar workers. The disparity is growing in Food while decreasing in all other segments and Total Pet. However, this category still clearly reinforces the importance of income in Pet Spending.

Next are demographics of which we have no control – Age, Generation and Racial/Ethnicity

  • Racial/Ethnic – As expected, White Non-Hispanics are the top performer in all segments and now African Americans occupy all the bottom slots. They have the lowest income and only 25% own Pets. The disparity is large and growing in all areas but Supplies. It is not growing in Supplies because Whites spend the most and had the biggest drop.
  • AgeThe highest income 45>54 yr olds are the top performers in all but Veterinary. They took over the leadership in Pet Spending in 2018. Last year the loser in all categories was 75+. They were largely replaced by the youngest group. Once again, the disparity is growing in Food and shrinking in Veterinary.
  • GenerationBoomers still rule Food. All else belongs to Gen X. The only change from 2018 is that Millennials dialed back their Services spending. The vast majority of 35>54 yr-olds are Gen Xers so you can see the ties to the Age data.

  • EducationWinning and losing is closely tied to more and less Education which generally correlates with income. The only difference is in Supplies where the performance became a little more balanced.
  • CU CompositionMarried Couples Only are still on top in 2 categories. The biggest change was the rise of couples with an oldest child 18>. Single Parents had a terrible year and are now at the bottom in all segments.
  • CU Size– 3 is now the top number in Pet but 2>4 are all strong. Performance drops off at both ends, 1 or 5+ CUs.

  • Housing – Homeowners w/Mortgage and Renters are the perennial winner and loser.
  • Area– Suburbs <2500 population perform the best except for the new winner, Suburbs 2500> in Services. In terms of worst performer, it is Central City in Food and Total Pet, but Rural in all other segments.
  • Region – 3 different winners, with the Northeast a surprise in Total. The South is again the overall worst performer.

Here are two summary charts. The first compares the averages.

The big change in Food is immediately apparent. In the past, the performance difference grew as you moved from Food to Supplies to Services and spending became more discretionary. In 2019, the difference between winners and losers in Food increased by 34%. The Supplies difference was down minimally. Services fell 5% and the disparity in Veterinary was down 10%. Spending became more balanced in every segment but Food. The increase in Food was so large that it pushed the Total Pet disparity up 1%.

  • Food – In Food the best and worst are actively moving apart – much less balanced in more demographics.
  • Supplies – Despite a big drop in $, the relative performance in Supplies remained rather stable.
  • Veterinary – The performance of both winners and losers fell significantly, but the gap narrowed about 10%.
  • Services – The performance of the Best and Worst both declined but they still moved a little closer together.

This chart shows the number of new winners/losers.

Total Pet had few changes, especially in losers. Total Pet is a sum of the segments. This can mitigate or even cancel out extreme differences in segments. Always look below the surface.

  • Pet Food had a large increase in spending, a complete reversal from 2018. However, there were only 7 changes, which is the same as last year when spending fell sharply in the second half.
  • Supplies is the most stable. A record drop in $ produced very little change in top or bottom performance.
  • The Veterinary spending increase was minimal but a 46% change in winners/losers is evidence of some turmoil.
  • Services had a decrease in $ and but their performance change was 29%, the same as Food.

Now, let’s look at the Demographic Segments with the Biggest Changes in $. We’ll truly see some differences between the Industry Segments. We have color highlighted differences from Total Pet. Plus:

  • Boxed w/green = Winner/Loser same as 2018
  • ↕ = Flipped from 1st to Last or vice versa

First, the Income related categories.

  • Income – There was no clear pattern with 4 different winners but 3 were under $40K. There were 3 different losers but 4 earned less than $70K. It appears that the biggest changes – up or down, came from lower income segments.
  • # Earners1 Earner, 2+ CUs had another bad year, losing in 4 areas. 2 Earners had the best year, with 3 wins. Singles had an OK year. They had 2 wins – split between 1 and No Earner. Of course, 1 Earner, Singles did lose in Services.
  • Occupation A bad year for the “bosses” in every area but Food. Self-Employed won in Food and Mgrs & Professionals lost in every area but Food. Retirees had 1 win and 1 loss. Most of the winning came from lower level wage earners. All this indicates a move towards more demographically balanced spending.

Now the Age and Racial/Ethnic Categories

  • Racial Ethnic White, non-Hispanics won in all but Supplies, where they were the big loser. They spent the most on discretionary Supplies, so this is no surprise. The other 4 losers were split between Hispanics and African Americans, the lowest income groups. African Americans had the smallest decrease in Supplies because they never spent much.
  • Age There were 4 different winners, with 75+ being a big surprise. 4 losers were evenly split between 35>44 and 45>54 as they dialed back from 2018. The 35>44 group flipped to last in 2 areas. The <25 group did lose in Food.
  • GenerationThe younger groups continue to excel, winning in 4 areas. The oldest generation did have the biggest increase in Services. Boomers lost Total Pet and Veterinary while those born before 1946 came in last in Food. Gen X did finish last in 2 areas including a flip from 1st in Services. However, they are still the biggest Pet Spenders.

Now, here are more Demographic Categories in which the consumers can make choices.

  • EducationA College degree is better, but we had 2 winners without one, including those without a HS Diploma. Also, 3 losers had at least an Associates degree. It appears that spending is becoming a little more balanced.
  • CU Comp. – 2019 was about all adult CUs. Married Couples Only had another bad year but they did flip in Food. Singles won in Veterinary and Total. Married CUs with kids won and lost in Services and Single Parents lost in Food.
  • CU Size It was a good year for 1 person CUs and bad for 2 people. The other wins/losses were split between 3 & 5+.

  • HousingHomeowners w/o Mortgage won twice, flipping from last both times. Homeowners w/Mtge are on top in 2 categories but lost Supplies. Renters won in Supplies but lost 3 times. It was a little more mixed than usual.
  • Area4 of the 5 the winners are over 2500 pop with big Suburbs winning 3. Central City won Supplies with the smallest decrease but lost in 3 areas, including 2 flips. Small Suburbs, <2500 won Food but lost Veterinary. The Suburbs ruled but we should note that Rural was a No Show. In 2018 they lost in 3 areas and in 2017 they won in 2.
  • Region The Northeast won 3, all flips, but lost Services. The Midwest had the opposite story – 3 losses and 1 win with 3 flips. The South flipped to 1st in Food but lost Supplies. What about the West? They were the best performer in Supplies and Services and last year won Food. They were up in 3 areas and down in 2 but the changes were small.

The next chart compares the number of repeats, “flips” and new segments among the 12 winners and 12 losers for each category. The idea is to look for patterns in the data that cross segments. Let’s take a look.

  • Segments were either up or down…by a lot or a little. There seems to be a different pattern in those segments with an overall increase vs those with a decrease, regardless of the size of the change.
  • In terms of repeats, you see more stability in Food/Vet ($ ↑) than in Supplies/Services ($ ↓).
  • There are also twice as many flips in the segments with a decrease in $. Supplies had the biggest decrease in $ and the most flips from 1st to last (50%). Only 12% of segments in Food or Vet flipped to last. Food rebounded from a big drop in 2018 but only 3 segments flipped from last to first so the $ didn’t come from most of last year’s losers.
  • You can see how the combined segments made Total Pet stable – the most repeats, few flips and the least new.

Next, there were so many positive contributors that in each individual report we recognized 6 segments that didn’t win but still performed so well that they deserved Honorable Mention. I reviewed that list again and came up with segments that won Honorable Mention in more than one segment. Here are the “SUPER Honorable Mentions” for 2019…

You can immediately see that it was an unusual year as 3 segments made the list, even with small decreases in Supplies. Another trend is obvious. All received honorable mention in Veterinary spending. This segment became more balanced in multiple categories. All of the segments on the list are generally “low profile” but contributed notably to the industry. One group deserves special notice. The $70>79K segment actually had the biggest increase in Total Pet $ of any income group. They did it with a strong performance in all segments, including a +11.8% increase in Food.

Although the results were mixed, with numerous individual changes, I saw these trends of note:

  1. Youth Movement – The Boomers continue to fade as the Gen Xers step up, with the Millennials close behind.
  2. Sub-Urbanization – Center City flips every year with the $ change. The Suburbs are the key. Suburbs <2500 are the top performers but the Suburbs 2500> spend the most and are the only area that increased $ every year since 2016.
  3. “2” is a less “Magic” number – Singles again had the biggest spending increase, and 3 Person CUs are the best performer in Total Pet and all segments but Services.
  4. Changes in spending balance – The performance gap between the best and worst narrowed in both Services segments. However, the disparity in Pet Food grew by 34%. That’s not good in this truly necessary segment.
  5. Income is still the most important factor – While the gap between best and worst narrowed in Services and Veterinary, it widened in Products, especially Food. The best performer is always $150K+ while the worst is <$30K.

And Finally, What you have all been waiting for…

THE ULTIMATE 2019 PET SPENDING CUs – Side by Side

Color Highlighted cells are different from Total Pet; * = New in 2019

Methodology – The segments are chosen because they have the highest annual CU spending of any segment in the category. They may or may not have the most total dollars. That would depend upon the number of CUs in the group.

Final Comment – These “winners” further reinforce the key factors in increased pet spending:

  • Marriage – A commitment to another person demonstrates that you can make a commitment to your pet “children”.
  • CU Size – The “magic” number has changed from 2 to 3.
  • Homeownership – Owning and controlling your own space has long been a key factor in Pet Parenting.
  • More space – Small suburbs near a big metro area offer the convenience of the city, plus room for more pets.
  • Income Matters Most – High Income, A High Paying Occupation, A College Degree, At Least 2 Earners. These are characteristics present in all of the Ultimate Pet Spending CUs.
  • Generation– The Boomers have officially passed the torch to Gen X. Age Note: All 45>54 and 60% of 35>44 are Gen Xers.

I hope that this Visual Comparison helped you to get a “satellite view” of Pet Industry Spending in 2019. Please refer back to the individual segment reports to get more details.

Retail Channel Monthly $ Update – February Final & March Advance

Time for our monthly update on U.S. retail sales by channel. The current COVID-19 crisis has caused turmoil in the Retail Marketplace. Consumer spending behavior has changed and continues to evolve. In this report we will track the changes and migration between channels. We will do that with data from two reports provided by the U.S. Census Bureau.

The Reports are the Monthly Retail Sales Report and the Advance Retail Sales Report. Both are derived from sales data gathered from retailers across the U.S. and are published monthly at the same time. The Advance Report has a smaller sample size so it can be published quickly – about 2 weeks after month end. The Monthly Final Report includes data from all respondents, so it takes longer to compile the data – about 6 weeks. Although the sample size for the Advance report is smaller, the results over the years have proven it to be statistically accurate with the final monthly reports. The biggest difference is that the full sample in the Final report allows us to “drill” a little deeper into the retail channels.

We will look at the latest release of both reports. We will begin with the Final Retail Report from February and then move to the Advance Retail Report for March. Remember, February 2020 was pre-pandemic, but in March the impact began. We will continue to compare 2021 to both 2020 and 2019 to track the ongoing evolution of the retail market.

Both reports include the following:

  • Total Retail, Restaurants, Auto, Gas Stations and Relevant Retail (removing Restaurants, Auto and Gas)
  • Individual Channel Data – This will be more detailed in the “Final” reports and we fill focus on Pet Relevant Channels

The information will be presented in detailed charts to facilitate visual comparison between groups/channels of:

  • Current Month change – % & $ vs previous month
  • Current Month change – % & $ vs same month in 2020 and 2019
  • Current YTD change – % & $ vs 2020 and 2019
  • Monthly and Year To Date $ will also be shown for each group/channel

First, the February Final. Retail hit bottom in April then began to recover, hitting record $ in December. January & February $ fell but were monthly records. Here are the major retail groups. (All Data is Actual, Not Seasonally Adjusted)

The final total is $1.7B more than the Advance report projected a month ago. All Groups were up slightly but most of the positive change came from Auto: +$1.0B; Restaurants: +$0.5B; Relevant Retail: +$0.1B; Gas Stations: +$0.1B. All groups were down vs January, but Total Retail still set a February record. Total $ales broke $600B for the first time in December and continued to set monthly records in both January and February thanks to strong performances by Relevant Retail and Auto. Restaurants and Gas Stations continue to struggle although Gas Stations are now above both monthly and YTD 2019 $. Throughout the pandemic, Relevant Retail has been the driving force in the recovery.

Now, let’s see how some Key Pet Relevant channels were doing in February.

  • Overall– All 11 channels were down vs January. However, 9 of 11 were up vs February 2020 and 2019 and all but one were up in YTD $ vs 2020 and 2019. 2021 continues its strong start.
  • Building Material Stores – Their strong lift continues. The ongoing surge came as a result of pandemic spending patterns developed in 2020. Consumers began focusing on their homes. They’re still showing double digit % increases. Farm Stores are leading the way, with 20+% increases in all measurements. Sporting Goods stores are not in this group, but they have a similar spending pattern. Sales took off in May, hitting a record peak in December. The lift continued into 2021. They are up 21.0% vs February 2020 and +28.8% YTD.
  • Food & Drug – Supermarkets finished 2020 up +$77.7B. Sales dipped slightly in both January and February but are still +8.4% YTD vs 2020. Drug Stores ended up +$17B (+5.7%) for 2020. Their $ also fell in January and February but are still +4.7% YTD vs 2020.
  • General Merchandise Stores – $ in all channels continue to fall from their December peak. Discount Department Store $ in February were down vs 2020 and 2019. In fact, their YTD $ are now essentially even with 2020. This shows that this channel was having problems even before the Pandemic. The growth slowed in Clubs/SuperCtrs and $ Stores. Combined, they were up 3.0% vs February 2020. However, their YTD sales are still up 8.8%.
  • Office, Gift & Souvenir Stores– Sales dropped again in February. They have negative numbers in all measurements. Recovery is a long way off.
  • Internet/Mail Order – The pandemic has accelerated this channel’s growth. Last February they were up 10.3% YTD vs 2019. This year they are up 29.0%. The pandemic lift spending pattern almost tripled the rate of increase.
  • A/O Miscellaneous – This is a group of small to midsized specialty retailers – chains and independents. It includes Florists, Art Stores and Pet Stores (22>24% of total $). Pet Stores were usually essential, but most stores were not. Stores began reopening in May and the $ grew. Their 2020 total sales were up +11.6%. February YTD sales are +$1.6B (+11.6%) vs 2020. However, that is down from 2020 when they were +$2.5B (+21%) vs 2019.

The Relevant Retail Segment began recovery in May and reached a record level in December. $ plummeted in January & February but still set monthly records. Almost all members of this group are showing growth, but the key drivers are the Internet, Supermarkets, SuperCtrs/Clubs/$ Stores and Hdwe/Farm. Now, here are the Advance numbers for March.

2020 will always be a memorable year for both its traumas and triumphs. In April & May we experienced the 2 biggest retail spending drops in history, but the problems actually began in March. Sales increased slightly from February but were $34.1B less than March 2019. Retail sales began to recover in June and in October, YTD Total Retail turned positive for the 1st time since February. In December, Total Retail broke the $600B barrier – a historic first. While sales fell from their December peak, monthly sales records were set in both January and February. Then they took off again in March, breaking $600B again while setting a new monthly sales record of $627.9B. A March lift in sales from February is pretty normal but this is the first time in records going back to 1992 that March sales have exceeded those from the previous December. All of the major groups increased sales from February and Restaurants were the only group to register any negatives vs 2020 or 2019. As we progressed through 2020 and now into 2021, we have seen real evidence of the strength and resiliency of the U.S. Retail Market.

Total Retail – As we said, the Total Retail $ for March set a record for the most spending in any month in any year. The $627.9B was up $134.8B (+27.3%) from February and $146.4B (30.1%) more than March 2020. If you compare the YTD 2021 spending to 2019, you see an increase of $232.4B (+15.7%). That is an average annual spending increase of 7.6%. If you just looked at these topline numbers, you would not suspect that a spending crisis had ever happened. Always look below the surface.

Restaurants – This is the only big group with any negative measurements. Last February YTD sales were up 8.1% vs 2019. The Pandemic changed that. Restaurants started to close or cease in person dining in March and sales fell -$33.3B (-52.5%) compared to March 2019. Sales bottomed out in April at $30.1, the lowest April sales since 2003. Sales started to slowly increase in May but never reached a level higher than 88% compared to the previous year. 2021 did not start off well. Through February,  YTD sales were down -16.7% from pre-pandemic 2020 and -10.0% from 2019. That brings us to March. Sales took off, up $14.2B, 28.2% from February and 35.2% from March 2020. They reached $64.0B, the highest level since December of 2019. However, the $ were still down vs March 2019 and YTD $ were still below both 2020 and 2019. We’ll see how their recovery progresses in April. YTD Avg Growth Since 2019 = -3.8%

Auto (Motor Vehicle & Parts Dealers)   – Staying home causes your car to be less of a focus in your life. Sales began to fall in March and hit bottom in April. Auto Dealers began combating this “stay at home” attitude with fantastic deals and a lot of advertising. It worked. They finished 2020 up 1% vs 2019 and have returned to a strong positive pattern in 2021. The “attitude” grew amazingly positive in March as sales reached $145.2B. This was by far the biggest month in history. It beat the former leader, July 2020, by $28B. To show how well consumers responded to their campaign you just need to look at the data. This group has exceeded $110B in monthly sales only 9 times in history. 7 of those occurred after the onset of the pandemic.  YTD Avg Growth Since 2019 = +11.1%

Gas Stations – Gas Station $ales are a mixed bag. Obviously, if you drive less, you visit the gas station less often. Sales turned down in March 2020 and reached their low point in April. They moved up but generally stayed about 15% below 2019 levels for the rest of 2020. In February they were still behind 2020 in monthly and YTD $ but ahead of 2019 in both measurements. In March, sales skyrocketed to $45.6B, 28.4% more than February and a 35.7% increase over March 2020. They turned positive in all measurements vs both 2019 and 2020. It looks like they are beginning their comeback. However, there is another factor that must be considered – inflation. Gas prices can be pretty volatile. They dipped in the first 2 months of the pandemic but then returned to more normal levels for the balance of 2020. They began inflating in 2021 and spiked in March. The March 2021 prices were 22.5% above March 2020. That means that 63% of the 35.7% year over year lift came from just higher prices. Analyzing retail can be complicated. YTD Avg Growth = +3.0%

Relevant Retail – Less Auto, Gas and Restaurants – This is what we consider the “core” of U.S. retail and has traditionally accounted for about 60% of Total Retail Spending. When you look at the individual channels in this group, you see a variety of results due to many factors – non-essential closures, binge buying, online shopping and a consumer focus on “home”. However, overall, April 2020 was the only month in which spending in this group was down vs 2019. Monthly $ales exceeded $400B for the first time ever in December ($411B). They finished 2020 up $251B, +6.8%. Their performance was the only reason that Total Retail was able to finish 2020 with positive numbers, +0.6%. Sales fell in January but continued to set monthly records through February. In March they turned sharply up again, +22.6% from February. Currently, they are up $55.1B, +17.3% vs March 2020 and  +$113.1B, +12.7% YTD. The $373B spending in March is the third highest monthly total of all time, trailing only December 2020 and December 2019. We should also note that the Relevant Retail group has posted positive numbers versus last year and YTD for every month since April 2020 and their average YTD growth rate since 2019 now stands at +9.3%. More channels are turning positive, but the primary drivers continue to be Nonstore, Grocery, SuperCenters/Clubs/$ Stores plus a never ending “spring lift” from Hardware/Farm and Sporting Goods. 

Now let’s look at what is happening in the individual retail channels. March was a spectacular month. Let’s see where the $ came from. These groups are less defined than in the Final Monthly reports and we will look across the whole market, not just pet relevant outlets. We will continue to track 2021 monthly and YTD sales vs both 2020 and 2019.

Sales in all 13 channels were up vs February. 11 channels beat March 2020 $ and 12 beat March 2019 $. In YTD $ales, all channels beat 2020 and 10 were ahead of 2019. (Relevant Retail YTD Avg Annual Growth Rate since 2019 = +9.3%)

After hitting bottom in April 2020, Relevant Retail has now beaten the previous year’s $ for 11 consecutive months. The group set an all-time record of $410.9B in December and finished  2020 +$250.9B vs 2019. They have also started 2021 strong, with record sales in every month. Essential channels are still primarily responsible for the continued lift:

  • Nonstore Retailers – The biggest driver. Online shopping continues to grow in # of households and in $.
  • Food & Beverage – Grocery– Restaurant $ are improving but consumers continue to eat & drink more at home.
  • Bldg Materials/Garden/Farm– Their “Spring” lift continues unabated as consumers focus on their home.
  • SuperCtrs/Club/Value/$ Strs – They keep the GM channel positive. Value is still a major consumer priority.

Regarding the Individual Large Channels (Includes YTD Avg Annual Growth Rate since 2019)

General Merchandise Stores – Sales surged up from February producing all positive numbers overall. Department Stores $ were up vs 2020 but down vs 2019. They were having problems before the Pandemic. The growth by Club/SuperCtr/$ stores has slowed to +2.5% in March, down from +9.6% in January but these stores are still the key.

  • YTD Avg Annual Growth: All GM = +5.7%; Dept Stores = -4.3%; Club/SuprCtr/$ = +7.7%

Food and Beverage, plus Health & Personal Care Stores – Sales in Grocery were up 9.8% from February but down 16.6% from 2020 – No surprise, as March 2020 was a binge month. The Health, Personal Care group finished 2020 at +1.7%. 2021 has started even better. With a strong March, YTD they are +4.2% vs 2020 and +8.2% vs 2019.

  • YTD Avg Annual Growth: Grocery = +6.3%; Health/Drug Stores = +4.0%

Clothing and Accessories; Electronic & Appliances; Home Furnishings – March was a spectacular month for all these channels. Home Furnishings is now positive in all measurements. Electronic & Appliance had a strong March but still remains slightly below 2019 in YTD $. Clothing Stores more than doubled their 2020 $ but are still -5.4% YTD vs 2019.

  • YTD Avg Annual Growth: Clothing = -2.7%; Electronic/Appliance = -0.2%; Furniture = +8.5%

Building Material, Farm & Garden & Hardware – Their Spring lift began on time in 2020 and it has essentially never stopped. They have greatly benefited from consumers turning their focus to their home needs. They finished 2020 +53B (+13.8%). In March sales took off, +43.5% from February, +32.4% vs 2020 and +20.9% YTD. Avg Annual Growth = +13.0%

Sporting Goods, Hobby and Book Stores – Book & Hobby stores are open but Sporting Goods stores have driven the lift in this group. Consumers turned their attention to personal recreation and sales in Sporting Goods outlets took off. The group ended 2020 +5.5% vs 2019. The growth accelerated in 2021. January & February set monthly sales records, but March had the most $ of any non-December month in history, +78.2% vs 2020. YTD Avg Annual Growth = +15.1%

All Miscellaneous Stores – Pet Stores were deemed essential but most other stores were not, so closures hit this group particularly hard. Sales hit bottom at -$3.8B in April then began to rebound. They finished with a strong December and ended 2020 down $1.0B, -0.7%. January sales were +6.9% vs 2020 but February sales were down -0.01% vs 2020. In March Sales took off. They were +27.3% from February, +30.3% from March 2020. Their YTD sales are now 13.7% above 2020 and 22.1% more than 2019. It appears that their recovery has gained traction. YTD Avg Annual Growth = +10.5%

NonStore Retailers – 90% of the volume of this group comes from Internet/Mail Order/TV businesses. The COVID-19 crisis accelerated the movement to online retail. In February 2020 NonStore $ were 8.6% YTD. In December monthly sales exceeded $100B for the 1st time. They ended 2020 at +21.9%, +$173.9B. Their increase was 69% of the total $ increase for Relevant Retail Channels. Their 2020 performance far exceeded their 12.9% increase in 2019 and they started off 2021 even better. March is +30.7% vs 2020 and YTD $ are +27.8%. YTD Avg Annual Growth = +19.2%

Note: Almost without exception, online sales by brick ‘n mortar retailers are recorded with their regular store sales.

Recap – 2020 was quite a year. April & May had the 2 biggest year over year sales decreases in history while December sales broke $600B for the first time. Restaurants, Auto and Gas Stations suffered the most. Auto had recovered by yearend but Gas Stations and Restaurants were still struggling. Relevant retails had segments that also struggled but overall, they led the way for Total Spending to finish the year +0.6% vs 2019. 2021 started out even more positive, especially in March when Total Spending of $627.9B broke the record set in December – an unheard feat for March. Auto also set a spending record in March. Gas Stations $ are now all positive and YTD Restaurant $ are only slightly below 2020 and 2019. The recovery in Relevant retail has also become much more widespread and monthly sales continue to set records. We’ll see if the trends continue but the Retail economy has come back strong.


2019 Veterinary Spending was $21.80B – Where did it come from…?

Now we will turn our attention to the final Industry Segment – Veterinary Services. For years, Veterinary Services prices have had high inflation. This has resulted in CU income becoming the most dominant factor in spending behavior and a reduction in visit frequency. Consumers paid more, just used Veterinary Services less often.

Things changed in 2017 as Veterinary pricing had an all-time record low inflation rate.  Consumers responded with a 7.2% increase in visit frequency and spent $2.5B more on Veterinary Services. In 2018 inflation began to return to more normal levels. Visit frequency fell slightly -0.2%, but Consumers spent $0.56B more (+2.7%). However, the inflation rate was 2.6% so virtually all of the lift was from increased prices. In 2019 the situation got worse. Consumers spent $0.58B (+2.7%) more but inflation was 4.14%. This means that there was an actual decrease in the amount of Veterinary Services purchased in 2019. In this report we’ll look deeper into the situation.

We’ll start with the groups who were responsible for the bulk of Veterinary spending in 2019 and the $0.58B increase. The first chart details the biggest pet Veterinary spenders for each of 10 demographic categories. It shows their share of CU’s, share of Veterinary spending and their spending performance (Share of spending/share of CU’s). We immediately note a difference in performance – 6 of 10 groups perform above 120%. This is the same as 2018 and equal to Total Pet. Supplies leads with 7 and Food & Services trail with 5. This means that these big spenders are performing well but it also signals that there is a large disparity between the best and worst performing segments. Income is clearly the biggest factor in Veterinary Spending.  The categories are presented in the order that reflects their share of Total Pet Spending which highlights the differences of the categories.

  1. Race/Ethnic – White, not Hispanic (90.9%) the same as 2018. This group accounts for the vast majority of spending in every segment., but a 91% share is extraordinary. Their 132.6% performance rating now ranks #2 in terms of importance in Veterinary Spending demographics and reflects the spending disparity. Hispanics, African Americans and Asians account for 31% of U.S. CU’s, but they only spend 9% of Vet $. Asians and African Americans have a significantly lower percentage of pet ownership and African Americans have the lowest average CU income.
  2. Housing – Homeowners (83.2%) down from (83.4%) Homeownership is a major factor in pet ownership and spending in all industry segments. In terms of importance to Veterinary spending, their 130.5% performance rating, down from 131.4%, keeps homeownership in 4th place. The slight decrease in share and performance was driven by a small $0.11B decrease in spending by Homeowners w/o Mtge and a lift by renters. We should note that Homeownership is not as important to Veterinary Spending as it once was. In 2015 their share was 88.4% with performance of 141.8%.
  3. # in CU – 2+ people (75.0%) down from (81.6%) This group, which is 70% of U.S. CUs, lost significant share and their performance fell from 115.7% to 107.4%. Their rank in terms of importance in Veterinary Spending fell from 7th to last. Only 1 & 3 person CUs spent more. Much of the big loss in share and performance was driven by  a $1.54B (+39.5%) spending increase by singles.
  4. Education – Associates Degree and Higher (73.5) down from (76.3%) Income generally increases with education. It is also important in understanding the need for regular Veterinary care. Performance also fell from 140.0% to 132.3%. Education became weaker as it fell from 2nd to 3rd in importance in Vet spending. Those with an Advanced College degree spent $1.14B more but couldn’t overcome a -$1.31B decrease from BA/BS and Associates Degrees.
  5. # Earners – “Everyone Works” (70.4%) up from (66.5%) In this group, all adults in the CU are employed. Their Performance also grew to 120.3% up from 115.1% and they joined the 120+% club, ranked #6. The gains come from a $2.13B increase from working singles and 2 Earner CUs. All other segments but No Earner, Singles spent less.
  6. Occupation – All Wage & Salaried (67.3%) up from (66.5%) and their performance only increased from 108.3% to 110.3%. The gains were small because the results were mixed. Inside the group, Managers & Professionals spent $0.59B less, while lower level White Collar and Blue Collar Workers spent $1.22B more. Outside the group, Retirees spent $0.50B more but the Self-Employed spent -$0.57B less.
  7. Income – Over $70K (66.3%) down from (68.2%) The performance of the $70K> group fell significantly from 169.2% to 159.8%. However, higher income is still the most important factor in increased Vet spending. $70K> spent -$0.03B less while <$70K spent $0.60B more. However, the results were mixed. <$30K: up $0.58B; $30>50K: -$0.19B; $50>70K: +$0.21B; $70>100K: +$0.48B; $100>150K: -$0.59B; $150>200K +$0.44B; $200K>: -$0.36B
  8. Age – 35>64 (63.2%) down from (66.1%) Their performance also fell from 124.9% to 120.7% but Age remained 5th in terms of importance. All the turmoil was within the group. 35>44 yr olds spent $1.23B more but the 45>64 yr olds spent $1.48B less. A $0.72B increase by the 65+ group also contributed to the decreases in share and performance.
  9. Area – Suburban (63.6%) up from (63.2%) Suburban CU’s are the biggest spenders in every segment. They gained a little in share and in performance, which was 114.4%, up from 113.9%. The gains were entirely due to a $1.34B increase by the large suburbs. 2019 was about population. <2500 (Urban & Rural): -$1.11B; 2500>: +$1.69B
  10. CU Composition – Married Couples (57.0%) down from (60.6%) Previously, Married Couples had a 60+% market share and 120+% performance in all segments. That ended in 2019 as their performance also fell to 116.7% from 122.2% and they dropped out of the 120+% club. Married Couples Only spent $1.04B less but those with an oldest child over 6 also were down $0.25. This, in combination with a $1.54B increase by Singles, caused the losses.

Although performance fell, Higher income is still by far the biggest single factor in Veterinary spending. We see the impact of this in many groups as it often contributes to the big spending disparity between segments. The most notable change was that Married Couples were replaced by # Earners in the 120+% performance club.

Now, we’ll look at 2019’s best and worst performing Veterinary spending segments in each category.

Almost all of the best and worst performers are those that we would expect. However, there are 11 that are different from 2018. This is much more than the (7) in Food & Services and (5) in Supplies. This suggests some spending turmoil even though there was no big change in $, up or down. The changes from 2018 are “boxed”. We should note:

  • Income – Down from the $200K> group in 2018. 1st and last are also a little closer together, 15%.
  • Earners – New, but not unexpected, winner and loser. However, the gap between the two is 32% lower in 2019.
  • Occupation – 2018: Self -Employed; 2019: Mgrs & Professionals. They are the 2 highest income segments.
  • Education – Back to the usual winner and loser but the gap between the two also narrowed slightly, 8%.
  • Age – In a surprise, the 35>44 year olds took over from the highest income group, 45>54. The loser also flipped from the oldest to the youngest, not a big surprise. By the way, only CUs in the 35>64 age range perform above 100%.
  • CU Composition – It was a good year for Married Couples with an Oldest Child over 18 and Singles. The Married group held their ground in spending but became the top performer and Singles got off the bottom.
  • # in CU – 3 and 1 person CUs were the only groups to increase Veterinary spending. Singles had the biggest lift, but they still have a long way to go. The 5+ CUs finished on the bottom for the second year in a row.
  • Region – Northeast won again – 5 straight years. The South has finished last for 4 years in a row.

It’s time to “Show you the money”. Here are segments with the biggest $ changes in Veterinary Spending.

We saw some turmoil in performance, but not here. There were 8 repeats and only 4 segments flipped from 1st to last or vice versa. Last year they had 2 repeats and 10 flips. Veterinary was the calmest segment in $ change. There were some surprise winners – Tech/Sls/Clerical, <$30K, Millennial/Gen Z and losers – Mgrs/Profess, $100>149K, 45>54. There were also surprising repeats W: 35>44 & Singles; L: Boomers & Married Couple only. Here are the specifics:

  • CU Composition – The winner and loser are both repeats.
    • Winner – Singles – Veterinary: $5.45B; Up $1.54B (+18.6%)                                       2018: Singles
    • Loser – Married, Couple Only – Veterinary: $5.73B; Down $1.04B (-7.8%)             2018: Married, Couple Only
    • Comment – Singles had another strong year while Married, Couple Only CUs had another bad one. In CUs with children, only those with an oldest child under 6 had an increase.
  • # in CU – 1 Person CUs were the repeat winner in this category too.
    • Winner – 1 Person – Veterinary Spending: $5.45B; Up $1.54B (+18.6%)                                 2018: 1 Person
    • Loser – 2 People – Veterinary Spending: $8.23B; Down $1.34B (-8.3%)                                  2018: 3 People
    • Comment: The winning numbers were 1 and 3, with a total increase of $2.04B. CUs of all other sizes spent $1.47B less. Most of the big drop by the 2 person group was driven by Married, Couple Only CUs.
  • Area Type – The winner and loser are new, but both are Suburban.
    • Winner – Suburbs 2500> – Veterinary Spending: $11.21B; Up $1.34B (+13.8%)                   2018: Central City
    • Loser – Suburbs <2500 – Veterinary Spending: $2.66B; Down $0.88B (-32.2%)                  2018: Rural
    • Comment – There was a clear spending break at a population of 2500. Those areas with a population over 2500 spent $1.69B more. Those under 2500 spent $1.11B less.
  • Age – In a bit of a surprise, the 35>44 are repeat winners.
    • Winner – 35>44 yrs – Veterinary Spending: $5.06B; Up $1.23B (+28.3%)                         2018: 35>44 yrs
    • Loser – 45>54 yrs – Veterinary Spending: $4.16B; Down $1.25B (-11.9%)                            2018: 55>64 yrs
    • Comment: The highest income group, 45>54 yr olds, are somewhat of a surprise loser. Last year, Veterinary spending by age group was up and down, a spending rollercoaster. In 2019 it was more defined. The 45>64 yr olds spent $1.48B less. All other age groups, younger and older, spent $2.06B more.
  • # Earners – Both the winner and loser are new, but not surprising.
    • Winner – 2 Earners – Veterinary Spending: $9.75B; Up $1.22B (+27.5%)                          2018: 1 Earner, Single
    • Loser – 1 Earner, 2+ CU – Veterinary Spending: $3.11B; Down $1.05B (-19.4%)              2018: No Earner, 2+ CU
    • Comment – Income is of primary importance to increased Veterinary Spending and in 2019, the number of earners took on added significance. All single CUs spent more but in 2+ person CUs, only those with 2 earners increased Veterinary spending.
  • Education – Those with an Advanced College Degree flipped from last to first.
    • Winner – Adv. College Degree – Veterinary Spending: $6.53B; Up $1.14B (+12.6%)             2018: BA/BS Degree
    • Loser – Associates Degree – Veterinary Spending: $2.10B; Down $0.66B (-8.5%)      2018: Adv. College Degree
    • Comment – Another spending rollercoaster – < HS: Up $0.23B; HS Grad: Down -$0.14B; HS Grad w/some College: Up $0.65B; Associates/BA/BS Degrees: Down -$1.31B; Advanced College Degree: Up $1.14B.
  • Occupation – A new winner and loser with the “Bosses” on the bottom.
    • Winner – Tech/Sales/Clerical – Veterinary Spending: $3.70B; Up $0.87B (+43.5%)         2018: Self-Employed
    • Loser – Mgrs & Professionals – Veterinary Spending: $7.77B; Down $0.59B (-15.0%)      2018: Retired
    • Comment – The highest income groups – Self-Employed and Mgrs & Professionals spent $1.16B less. However, the lower income groups – Retirees, Blue Collar workers and Tech/Sls/Clerical spent $1.71B more.
  • Generation – Millennials/Gen Z edge out Gen X for the win – a payback for last year?
    • Winner – Born after 1980 – Veterinary: $5.18B; Up $0.78B (+15.9%)                                 2018: Gen X
    • Loser – Baby Boomers – Veterinary: $7.48B; Down $0.72B (-17.7%)                                   2018: Baby Boomers
    • Comments – The Boomers held on to the bottom spot. This year the spending was clearly divided. The younger groups, Gen X and Millennials spent more while the older generations spent less.
  • Region – A second consecutive dual flip in this category.
    • Winner – Northeast – Veterinary Spending: $5.08B; Up $0.75B (+19.0%)                      2018: Midwest
    • Loser – Midwest – Veterinary Spending: $4.62B; Down $0.39B (-7.2%)                           2018: Northeast
    • Comment – The South finished second for the 3rd consecutive year. Only the Midwest spent less.
  • Housing – The winner and loser held their positions.
    • Winner – Homeowner w/Mtge – Veterinary: $12.45B; Up $0.55B (+10.5%)        2018: Homeowner w/Mtge
    • Loser – Homeowner w/o Mtge – Veterinary: $5.69B; Down $0.11B (-7.7%)           2018: Homeowner w/o Mtge
    • Comment – Only Homeowners w/o Mtge spent less. This decrease comes when Retirees and the over 65 group spent more. Much of it may have been driven by slightly younger CUs who have paid off their mortgage.
  • Income – In a total surprise the under $30K group flipped from last to first.
    • Winner – <$30K – Veterinary Spending: $2.37B; Up $0.58B (+13.7%)                              2018: $150K>199K
    • Loser – $100>149K – Veterinary Spending: $3.91B; Down $0.59B (-29.9%)                     2018: <$30K
    • Comment – Our final spending rollercoaster – <$30K: Up $0.58B; $30>50K: Down $0.19B; $50>99K: Up $0.69B; $100>149K: Down $0.59B; $150>199K: Up $0.44B; $200K>: Down $0.36B.
  • Race/Ethnic – White, non-Hispanics stayed on top and maintained their overwhelming dominance in this segment.
    • Winner – White, Not Hispanic – Veterinary: $19.83B; Up $0.52B (+3.8%)               2018: White, Not Hispanic
    • Loser – African American – Veterinary: $0.57B; Down $0.26B (-31.1%)                     2018: Asian Americans
    • Comment – Only African Americans spent less but this comes after a 60% increase last year. High inflation has caused a reduction in visit frequency. This has often produced big annual $ swings in low income minorities.

We’ve now seen the winners and losers in terms of increase/decrease in Veterinary Spending $ for 12 Demographic Categories. 2019 saw continued slow growth in Veterinary spending. With 8 segments holding their position from 2018 and only 4 flipping from first to last or vice versa, 2019 was much calmer than 2018. Most of the winners were not unexpected but there were some surprises like <$30K, 35>44 and Singles. The “youth movement” also continued as Gen X and Millennials both spent more.  However, there were also “hidden” segments that didn’t win but made a significant contribution to the 2019 spending increase. These groups don’t win an award, but they certainly deserve….

HONORABLE MENTION

Married CUs with an oldest child <6 were the only CU with kids to spend more. Spending became more balanced in Education & Income which is reflected by the performance of HS Grads w/some College and the $70>99K groups. It wasn’t just the younger groups who spent more. The 75+ yr olds were up $0.39B (+35.2%). All the lower income occupations spent significantly more on Veterinary Services, including Blue Collar Workers, +$0.35B (+12.3%). Hispanics bounced back with a 27% increase after a 19% drop in 2018. 57% of 96 demographic segments spent more, down slightly from 63% last year.

Summary

2016 and 2017 produced a combined increase of $3.6B in Veterinary Spending as inflation moved to record low levels. In 2018 we had the Baby Boomer Spending “Bust” which especially impacted Food and Veterinary. The Boomers spending continued to fall in 2019. Fortunately, Gen X and Millennials stepped up to produce a small. 2.7% increase in both years. Overall, Veterinary Spending became a little more balanced in Income, Age, Education and the size and makeup of CUs.

Veterinary spending did become a little more balanced in terms of Income and Education, but these 2 categories are still of primary importance in terms of increased spending, Both had an up and down rollercoaster spending pattern between segments. Let’s look at the final result. To compare groups, we will look at performance. (Share Vet $/Share CUs)

Income: Performance increases with income and reaches the “break even” point (100%) at $70K+. CU’s over $70K (41.5%) account for 66.3% of Veterinary $. Performance =  159.8%. Performance for <$70K = 57.6%. That’s a difference of 100.2%. Spending may be more balanced but that is still a huge disparity.

Higher Education: Performance increases with Education but doesn’t reach 100% until you have a BA/BS degree. College Grads, 44.4% of CUs, account for 63.9% of Veterinary $. Performance = 144.1%. Performance for <College Grads= 64.8%. The difference is 79.3%. The disparity is not as bad as Income but still huge. Equality in both categories is a long way off.

The performance of other big spending groups is also very important in the Veterinary segment. We identified six demographic categories with high performing large groups. (There were 7 for Supplies, 5 for Services and Food).  Consumers have no control over Race/Ethnicity or Age but in addition to Income and Education, Homeownership and # Earners are also important factors in Veterinary spending. Actually, all 6 of these groups are tied to income and their high performance demonstrates that there are still big spending disparities among segments within these categories.

There were some changes of note. Marriage lost ground as Singles increased their spending and # Earners became significantly more important, which relates to both income and the strong performance by the younger generations.

2019 saw another small spending increase (+2.7%) for Veterinary Services. 57% of all segments increased spending but with a 4.14% inflation rate, the amount of Veterinary Services actually decreased . The lift was again driven by Gen Xers and Millennials which was reflected in the strong performance of segments like Singles, Tech/Sls/Clerical, 2 Earners and 35>44 yr olds. While spending became a little more balanced, the importance of income to spending in this segment was still very apparent. That brings us to 2020. The COVID-19 pandemic has had the greatest negative impact on lower income groups. We’ll see if that works to increase the Income disparity in Veterinary Spending.

Finally – The “Ultimate” Veterinary Services Spending Consumer Unit consists of 3 people – a married couple and their 18 yr old child. They are at the top of the 35 to 44 age range. They are White, but not of Hispanic origin. At least one of them has an Adv. College Degree. Both are Mgrs/Professionals and their total income is $150>$200K. They live in a small suburb, adjacent to a big city in the Northeastern U.S. and are still paying off the mortgage on their home.

Retail Channel Monthly $ Update – January Final & February Advance

Time for our monthly update on U.S. retail sales by channel. The current COVID-19 crisis has caused turmoil in the Retail Marketplace. Consumer spending behavior has changed and continues to evolve. In this report we will track the changes and migration between channels. We will do that with data from two reports provided by the U.S. Census Bureau.

The Reports are the Monthly Retail Sales Report and the Advance Retail Sales Report. Both are derived from sales data gathered from retailers across the U.S. and are published monthly at the same time. The Advance Report has a smaller sample size so it can be published quickly – approximately 2 weeks after month end. The Monthly Final Report includes data from all respondents, so it takes longer to compile the data – about 6 weeks. Although the sample size for the Advance report is smaller, the results over the years have proven it to be statistically accurate with the final monthly reports. The biggest difference is that the full sample in the Final report allows us to “drill” a little deeper into the retail channels.

We will look at the latest release of both reports. We will begin with the Final Retail Report from January and then move to the Advance Retail Report for February. Remember, January and February 2020 were pre-pandemic, but we will continue our detailed comparison of 2021 to both 2020 and 2019 to track the ongoing evolution of the retail market.

Both reports include the following:

  • Total Retail, Restaurants, Auto, Gas Stations and Relevant Retail (removing Restaurants, Auto and Gas)
  • Individual Channel Data – This will be more detailed in the “Final” reports and we fill focus on Pet Relevant Channels

The information will be presented in detailed charts to facilitate visual comparison between groups/channels of:

  • Current Month change – % & $ vs previous month
  • Current Month change – % & $ vs same month in 2020 and 2019
  • Current YTD change – % & $ vs 2020 and 2019
  • Monthly and Year To Date $ will also be shown for each group/channel

First, the January Final. U.S. Retail hit bottom in April then began to recover, hitting record $ in December. January $ fell but still set a monthly record. Here are the major retail groups. (Data in all graphs is Actual, Not Seasonally Adjusted)

The final total is $9.8B more than the Advance report projected a month ago. All Groups were up but most of the positive change came from Relevant Retail: +$6.2B; Restaurants: +$0.9B; Auto: +$1.8B; Gas Stations: +$1.0B. Only Gas Stations and Restaurants were up vs December, but Total Retail still set a January record. Total $ales finished strong in December and had a good start in 2021 thanks to another strong month from Relevant Retail and Auto. Restaurants and Gas Stations continue to struggle. Relevant Retail is still the driving force in the recovery.

Now, let’s see how some Key Pet Relevant channels were doing in January.

  • Overall– All 11 channels were down vs December, but 10 of 11 were up both vs 2020 and 2019. A great start.
  • Building Material Stores – Their lift continued into the new year. We should note that the bulk of the ongoing surge came as a result of pandemic spending patterns developed in 2020. They’re still showing double digit % increases. Sporting Goods stores are not in this group, but they have a similar spending pattern. Sales took off in May, hitting a record peak in December. The lift continued in 2021 – up 36.2% over 2019 and 44.4% over 2020.
  • Food & Drug – Supermarkets finished 2020 up +$77.7B. Sales dipped slightly in January but are still +10.9% vs 2020. Drug Stores ended up +$17B (+5.7%) for 2020. Their $ also fell in January but are still +4.5% vs 2020.
  • General Merchandise Stores – $ in all channels fell a lot from December. However, Clubs/SuperCtrs, $ Stores and even Discount Dept. Stores had a strong January. Last year they were up a combined $1.5B from 2019. This year they are up $7.2B from 2020. Value has become even more important due to the pandemic.
  • Office, Gift & Souvenir Stores– Sales plummeted in January. Their struggles continue. Recovery is a long way off.
  • Internet/Mail Order – The pandemic has accelerated this channel’s growth. In January they were up $22.1B (+42.8%) vs 2019. 78.7% of that growth (+$17.4B) came from the pandemic lift spending pattern set in 2020.
  • A/O Miscellaneous – This is a group of small to midsized specialty retailers – chains and independents. It includes Florists, Art Stores and Pet Stores (22 to 24% of total $). Pet Stores were usually essential, but most stores were not. Stores began reopening in May and the $ grew. Their 2020 total sales were up +11.6%. January sales are +$1.0B (+14.4%) vs 2020. However, that is less than last year when they were +$1.2B (+21%) vs 2019.

The Relevant Retail Segment began recovery in May and reached a record level in December. $ plummeted in January but still set a monthly record. The key drivers in the continued strong growth of this group were and are the Internet, Supermarkets, SuperCtrs/Clubs/$ Stores and Hdwe/Farm. Now, here are the Advance numbers for February.

2020 will always be a memorable year for both its traumas and triumphs. In April & May we experienced the 2 biggest retail spending drops in history. Then sales began to recover and in October YTD Total Retail turned positive for the 1st time since February. In December, Total Retail broke the $600B barrier – a historic first. Monthly sales records continued in January and now February. The primary drivers of this are Relevant Retail and Auto. Restaurants are the only big group still suffering across the board. As we progressed through 2020 and now into 2021, we have seen real evidence of the strength and resiliency of the U.S. Retail Market.

Total Retail – Spending fell in February but still was a record high for the month. $ were up 2.4% vs 2020 but 10.7% vs 2019. Most of the lift came last year. YTD $ are also showing strength but this was mainly due to a spectacular January.

Restaurants – This is the only group in which spending was down in all measurements. Last February sales were up vs January and February 2019. The Pandemic changed that. YTD sales are also down -10.7% from 2019. However, this was primarily due to the -$12.7B drop in February $ from 2020. Recovery is still a long way off.

Automobile & Gas Stations – Staying home causes your car to be less of a focus in your life. Auto Dealers combated this attitude with fantastic deals and a lot of advertising. It worked. They finished 2020 up 1% vs 2019 and have returned to a strong positive pattern in 2021. Gas Station $ales are a mixed bag. They were still behind 2020 in February and YTD but ahead of 2019 sales in both measurements. It looks like they are beginning their comeback.

Relevant Retail – Less Auto, Gas and Restaurants – When you look at the individual channels in this group, you see a variety of results due to many factors – non-essential closures, binge buying, online shopping and a consumer focus on “home”. However, overall, April 2020 was the only month in which spending was down vs 2019. Monthly $ales exceeded $400B for the first time ever in December ($411B). They finished 2020 up $251B, +6.8%. Sales fell in January but have continued to set monthly records through February. They are up $20.4B, +7.2% vs February 2020 and  +$57.9B, +10.1% YTD. Relevant Retail has now posted positive numbers versus last year and YTD for 10 consecutive months and their average YTD growth rate since 2019 now stands at +7.8%. The primary drivers continue to be Nonstore, Grocery, SuperCenters/Clubs/$ Stores plus a never ending “spring lift” from Hardware/Farm and Sporting Goods.

Now let’s look at what is happening in the individual retail channels. Relevant retail was down vs January but continues to set monthly sales records. Let’s see where the $ came from. These groups are less defined than in the Final Monthly reports and we will look across the whole market, not just pet relevant outlets. We will continue to track 2021 monthly and YTD sales vs both 2020 and 2019.

Sales in 12 of 13 channels were down vs January. 8 channels beat February 2020 $ and 10 beat February 2019 $. In YTD $ales, 10 channels beat both 2020 and 2019.

After April’s widespread closures there was a retail surge in May, but things truly opened up in June/July. In Aug/Sept, sales slowed but growth began again in October and peaked with a record December. Relevant Retail finished  +$252.9B vs 2019 and has started 2021 strong, +10.1% YTD. Essential channels are responsible for the continued lift, primarily:

  • Nonstore Retailers – Online shopping continues to grow in households and $.
  • Food & Beverage, especially Grocery– Restaurant $ are still down so consumers continue to eat & drink at home.
  • Bldg Materials/Garden/Farm– Their “Spring” lift continues unabated as consumers focus on their home.
  • SuperCtrs/Club/Value/$ Strs – In 2020 they kept the whole Gen Mdse channel positive. Their growth slowed in February but their continued success clearly shows that value is still a major consumer priority.

Regarding the Individual Large Channels

General Merchandise Stores – Sales dropped so much from January that they were down vs February 2020. This was due to the continued negative performance by Department Stores and slowed growth by Club/SuperCtr/$ stores, +3.6% in February, down from +9.6% in January.

Food and Beverage, plus Health & Personal Care Stores – In February, growth slowed to +6.7% in the Grocery segment, compared to +11.3% in January. Sales in the Health, Personal Care group finished 2020 at +1.7%. They started 2021 even better, +3.3% in January, but that slowed to +2.4% in February. Drug Store $ remains the key to health/personal care.

Clothing and Accessories; Electronic & Appliances; Home Furnishings – Home Furnishings began their recovery in January and are now positive in both monthly and YTD $ vs 2020 and 2019. Electronic & Appliance stores remain negative across the board, but the gap is narrowing. Clothing Stores continue to be hard hit by the pandemic, but they were the only channel to increase sales vs January. There is still hope.

Building Material, Farm & Garden & Hardware – Their Spring lift began on time in 2020 and it has essentially never stopped. They have greatly benefited from consumers turning their focus to their home needs. They finished 2020 +53B (+13.8%). In February they were up 11.1% vs 2020 and +13.1% YTD.

Sporting Goods, Hobby and Book Stores – Book and Hobby stores are open but make no mistake, Sporting Goods stores have driven the lift in this group. Consumers turned their attention to personal recreation and sales in Sporting Goods outlets took off. The group ended 2020 +5.5% vs 2019. Sales fell in February after a record January performance, but they were still +11.0% vs February 2020 and +17.8% YTD.

All Miscellaneous Stores – Pet Stores are in this group and deemed essential but most other stores are not, so closures hit this group particularly hard. Sales hit bottom at -$3.8B in April then began to rebound. They finished with a strong December and ended 2020 down $1.0B, -0.7%. January sales were +6.9% vs 2020 but February sales were actually down -0.01% vs 2020. Their $ are +2.5% YTD so they are recovering but it may not be a fast process.

NonStore Retailers – 90% of the volume of this group comes from Internet/Mail Order/TV businesses. The COVID-19 crisis accelerated the movement to online retail. In February 2020 NonStore $ were 8.6% YTD. In December monthly sales exceeded $100B for the 1st time. They ended 2020 at +21.9%, +$173.9B YTD. Their increase was 69% of the total $ increase for Relevant Retail Channels. Their 2020 performance far exceeded their 12.9% increase in 2019 and they started off 2021 even better. February is +23.5% vs 2020 and YTD $ are +25.4%. Remember, this is their slowest season.

Note: Almost without exception, online sales by brick ‘n mortar retailers are recorded along with their store sales in their regular channel. Whether they are up or down, their online sales are included in the totals.

Recap – 2020 was a year of ups and downs – April and May were the 2 biggest year over year monthly sales declines in history while December saw sales break $600B for the first time. Restaurants, Auto and Gas stations were impacted the most. Auto had recovered by yearend and started 2021 out strong. Gas Stations had a terrible 2020 but are now showing mixed results in 2021. Restaurants continue to show the most negative impact from the pandemic. The Relevant Retail segment has been the only ongoing positive, but for some segments in this group there is still a long way to go. Total Retail Sales ended the year +$37B (+0.6%) vs 2019. Through February Relevant Retail and Auto are both +10% vs 2020, which has pushed Total Retail to +5.1%. For Gas Stations and especially Restaurants the problems continue. As the battle to return to normal goes on, we will continue to provide regular updates. The March data should be especially interesting as we will compare 2021 to 2020 (Pandemic Impact Begins) and to 2019 (Old Normal).

Attending Global Pet Expo 2021? – The Show is “Virtual”, But You Still Need a Plan!

The first Global Pet Expo (APPMA) occurred 63 years ago with 17 exhibitors in 30 booths. The industry and the show have both come a long way since then.  Although the show is virtual this year due to the impact of the COVID-19 pandemic, there is still much for 2021 attendees to see and experience:

  • Over 200 separate exhibitors and the list is still growing – with companies from the U.S. and around the world – still a Global experience!
  • As always, the New Product Showcase will be a major attraction.
  • There will still be thousands of attendees with opportunities for virtual networking.
  • The opportunity to choose from 39 targeted educational seminars – 23 hours of classes.
  • Not 5 miles of aisles but get your fingers ready to do a lot of walking on your keyboard!

The show is open for 26 hours so let’s put this in “virtual” perspective and… “Do the Math!”

If you don’t attend any seminars, visit the New Product Showcase, stop to have a virtual chat with someone or to eat, drink or to go to the bathroom, you can spend about 6 minute and 55 seconds with each exhibitor. That’s a lot more than usual but now you will be competing for appointment times. You still definitely need a plan!

Global Pet Expo still has it all… and more. Attendees will find a broad selection of products while Exhibitors have the opportunity to reach a wide range of buyers across all retail channels.

First and foremost, Global is about Pet Products – Food, treats and a vast array of Supply categories. A regular flow of New Products is always critical to keep businesses and the whole industry strong and growing. Obviously, you must take the time to visit the New Product Showcase. You should also sign up for any relevant classes, network with other industry professionals and…”virtually” walk the whole show.  There are many more new products being “launched” in exhibitor showrooms as there are on display in the New Product Showcase. Plus, even with the lower exhibitor count over 22% of the exhibitors were not at GPE 2020. Global is about gathering information and making decisions to improve your business – whether they are made on the spot or put on your “must do” list.

Every business can improve in terms of products. If you are a retailer, what sections of your store are not doing as well as you hoped and need a “facelift” or conversely, what areas are growing and need products to fill additional space? Category managers for distributors and retail chains may only be interested in targeted visits to exhibitors relevant to their “categories”. Representatives may be looking for new manufacturers…in specific product categories. Manufacturers could be looking to find distributors to handle their products or just looking to “check out” the competition. In regard to products, there is always something to see…for everyone!

And Global is the place to see it. It’s all there! With so much to see and do, time is perhaps the most valuable commodity at the show. How do you make the most of your time on the show platform? Here’s an idea.

In 2014 I first designed a tool in Excel, the Super Search Exhibitor Visit Planner to make “working Global & SuperZoo easier and more productive for ALL attendees – retailers, distributors, reps, groomers, vets…even exhibitors. I have updated the data and produced a tool for every GPE and SuperZoo since then…including GPE 2021.

The “update” is not just exhibitor lists but also to the product category offerings for every exhibitor. I reviewed every available exhibitor profile, but I also visited hundreds of websites and conducted separate internet searches to “validate” the product offerings. It is not 100% accurate, but it is close.

What does the SuperSearch do?… It searches for and produces a list of Exhibitors by product categories.

  • From the simplest – “give me a list that I can look at on my phone or tablet.”
  • To the most complex…”can do a simultaneous search for multiple specific product categories, allowing you to personally narrow down the initial results and see the “final” targeted result.” The GPE Super Search Exhibitor Visit Planner does both…and more…and does it quickly! Take a look at the Quick Start Guide. You will see that it looks complex but is really quite simple.

GPE 2021 Super Search Exhibitor Visit Planner – Quick Start Guide

First: When you download the Excel file, Remember to Enable Editing & Macros!

The GPE Super Search Exhibitor visit planner is designed to make your time on the show platform more efficient and more productive. With the Super Search you can conduct up to 5 separate and distinct product category searches simultaneously with consolidated results produced in alphabetical order to facilitate your “journey”. There are detailed instructions for reference and to help you understand the nuances of the tool. However, it is really very simple so let’s get started. (Note: No Floor Sections or Booth #s in 2021) Here is the Dashboard where you set up your searches.

On the dashboard, the first things to note are the numerous category columns. There are no preassigned sections as yet in 2021 so these columns may be hidden to save some space but there are 11 different Exhibitor or Animal Types and 33 Dog and/or Cat Product categories. You can search exhibitors for any combination of these.

Let’s take a specific example running 3 simultaneous searches for several Dog/Cat categories:

  • Toys
  • Treats
  • Catnip & Litter (Must sell both)

Now referring to the Dashboard, let’s take it by the numbers:

  1. This column is where you activate each search. Type in a “Y” (Cells C3>C7 will auto-capitalize) This search “line” becomes active.(cell turns green) In our example we are running 3 searches, so we have 3 “Y”s.
  2. Now we enter a 1 in the correct column for each search line. Search Line 1: Toys; Search Line 2: Treats.
  3. In Search Line 3 we want exhibitors that sell both Catnip and Litter, so we put a 1 in both of these columns.
  4. Now we just “click” the Execute Search Button. The searches are done simultaneously, and the results combined into a single list in alphabetical order.
  5. There are no Booth #s in this “virtual” year so this button is not relevant.
  6. Your sort should appear in alphabetical order, but you can always click the Alpha Sort Button to be sure.
  7. To Clear all your search categories and start a new search, Click the Clear Criteria Button. Then click Execute (#4) again and you will be back to the full list.

Note: Any Search Line with a Y and no 1’s in any column will always deliver the entire list regardless of what is selected in other lines. Change the Y back to an N in unused search lines. Now a sample of the results:

Company A – Has Toys Only; Company B has Dog Treats Only; Company C is on the list for Treats and also has Catnip, but no Litter. This is not unusual as Catnip is often a Treat; Company D has Treats & Toys. Company E has both Catnip and Litter and in fact, actually has it all!

Note: The Super Search highlights your search categories, so you know “why you are there”. However, it also shows all categories that are available. Some might “pique” your interest while you are visiting the exhibitor showroom.

In 2021, since there are no booth #s you will review the exhibitors alphabetically. The Super Search also allows you to “cut down” the list during your review. (Pg 2; Point #11 – “U Pick ‘em” in Detailed Instructions) But First, I suggest that you “play” with the Super Search to get a “feel” for the tool, and then review the Detailed Instructions. With your “play” experience, the detailed instructions will become a “quick read” and a valuable reference. You will soon be “up to speed” on the full capabilities of Super Search. Good Luck and Good “Hunting” at GPE 2021!

Ready to Start Planning?

Use the links below to download the Super Search Tool (Be Sure to Enable Editing/Macros/Content if asked by your computer), the Quick Start Guide and the Detailed Instructions. Then GET STARTED!

NOW DOWNLOAD THE SEARCH TOOL

(For the Excel file to work on your computer, be sure to enable saving/macros/editing/content if asked.)


NOTE: Each Super Search has a date in the file name. The first file was dated 3/8. The latest file is dated 3/23. There were a lot of additions since 3/22 – mostly media, organizations and business services providers. They are highlighted in light gray. There were also 3 name changes, highlighted in orange. MORE CHANGES ON DAY 1 – Highlighted in yellow! 


GLOBAL PET EXPO 2021…Packed with Opportunities!

The premiere event of the U.S. pet industry gets under way on March 24th. This is the 63rd show (my 33rd) in a tradition that began in 1958. Both the show and the industry have grown spectacularly since then, until a Global Pandemic produced a true worldwide crisis. With Pet Parents often stuck at home, they have turned more of their attention to their Pet Children. During this time consumers have focused on essential spending. Since there is no doubt that Pets are an essential part of U.S. families, it is no surprise that the Pet Product segments of the industry have grown even stronger.

That brings us to trade shows, specifically GPE 2021. Until December, it was scheduled to be an in person event. However, it became obvious that this was not practical or even possible, so it was made virtual – Global Pet Expo Digital Access. Both the exhibitor count and the number of registered attendees are down significantly but continue to grow. As of February 26, there were 189 Exhibitors. Normally, there are 1000+. The number of registered attendees is also smaller. However, that will grow significantly. Remember, you don’t have to plan a trip, just show up online. A quick review of the buyers showed that companies responsible for selling 90+% of the Pet Products sold in the U.S. will be attending. That raises a question for the companies who have chosen not to exhibit. “Can you really afford to not exhibit at this show?” I guess that they’ll wait and see.

Before we start our preview of what you will see at GPE 2021, I would like to put some recent events into perspective. Normally, the health and progress of an industry are largely dependent upon the choices and decisions made by the participants. Since 2018, outside influences have had a major impact on the pet industry. It began with the FDA warning on grain free dog food. This was followed by the added tariffs which drove Supplies prices up. Finally, we are currently in the midst of a global pandemic which has radically affected the lives of both people and businesses. No one had control over these events. However, you have control of how you react to them. Businesses must be prepared to adapt to a changing environment or face extinction. That is the choice to be made.

Now let’s look at GPE 2021. I am not aware of special sections and there is no way to tell since there is no “floorplan”. However, we can note a big change in the number of International exhibitors. In a normal year there would be over 250, about 25%. In 2021 there are less than 25. As you recall, many Chinese exhibitors had to drop out of GPE 2020 due to travel restrictions. There are also less 1st time exhibitors. Usually, there are 300 who didn’t do the previous year’s show, about 30%. This year, less than 40 weren’t at GPE 2020. Although the event is virtual, it appears that COVID-19 had a big impact.

I will be publishing my Super Search exhibitor visit planner to help guide your time on the virtual show floor. I have researched the product category offerings of every exhibitor. Let’s take a look at the results from this year’s research.

First, we’ll Compare Exhibitor Types – By function: By Animal type (Data is based on the exhibitor list as of 2/26/21) Note: Distributors were removed from the animal type count to more accurately reflect product category coverage.

I included the actual booth count for 2021 but not the change in numbers from 2020. Because of the huge drop in the number of exhibitors, the change in share is a better way to compare the 2 years.

  • Dogs Still Rule …and their kingdom is growing. About 7 of every 8 exhibitors sell dog products.
  • Cats continue to gain shareIn 2021, Cat Products are offered by 62% of exhibitors. Up from 40% in 2014.
  • Fish/Aquatic – In 2020 this category was down 42% from 2017. It continues to fade.
  • Other Animals – Horses & Reptiles lost a little in share, but Birds and Small Animals held their ground.
  • Business Services – Besides wellness products, this has been the other big trend in the Industry. Private label/OEM has become important and reflects the changing needs in the industry. 18 exhibitors is a small number, but it is twice as many as in 2014.
  • Distributors – Although the share is small, it is double that of last year and provides national coverage.
  • Gift/Gen Mdse – This category has been declining since 2016. These products are not a big priority in the pandemic.

Dogs and Cats are the undisputed royalty of Pet and they are even more of a focus in these trying times. Because of their huge impact on the industry, I have divided the products designed for them into 33 subcategories. Let’s see how this year’s GPE Top 15 (17 due to a tie) are doing. The rank was determined by the number of exhibitors, less distributors.

There was a shuffling in the rankings as only 4 held their place, including the Top 3. Furniture dropped out of the top 15 and was replaced by Dental, Rawhide and Scratching. (Remember, because of the tie, there are 17 on the list)

  • Treats are still #1 and gained share. 1 in 2 exhibitors offers treats. (Many supplements are in treat form.)
  • OTC Meds/Supplements/Devices also continues to gain strength and share. In 2014 their share was 11%.
  • Food and Feeding Accessories – Food made a big increase in rank and share so Accessories dropped in rank.
  • Toys, Scratching – It’s not all about health and nutrition. Toys held their rank and Scratching gained ground.
  • Collars, Leads & Harnesses – They held their share but fell 1 spot in rank due to the Food lift.
  • Beds/Mats – They had the biggest drop in share and fell 2 spots to 8th
  • Apparel – This less essential category had the 2nd biggest drop in share but the biggest drop in rank, 8th to 13th.
  • Waste Pickup, Shampoo, Stain & Odor, Grooming Tools – All these categories gained in share and all but Grooming Tools gained in rank. Obviously, cleanliness is also a big aspect of the trend to a healthier life for pets.
  • Rawhide & Dental – These categories made huge gains in rank and share. Dogs definitely need to chew.
  • Carriers & Crates, Litter Acc. – Both gained share. Litter Accessories fell in rank due to big gains from other categories.

Pet Parents’ concern for the overall health and wellness of their “pet children” remains the biggest trend.

The last chart details the specifics for all 33 of the Dog/Cat product categories that I defined. Of note: All the data inputs for this report and the SuperSearch tool come from  visits to over 200 websites. They’re not 100% accurate, but pretty close. Which categories are of interest to your business?

GPE 2021 is smaller and virtual but it still showcases the World of Pets and is Packed with Opportunities in products, services and education to fulfill your needs. Speaking of Education, there are 39 targeted sessions offered during the afternoons of every show day. They are live but many will be available on demand thanks to the virtual nature of the show. However, to reap all these benefits, you still need a plan. Exhibitors must showcase the “right” items. Attendees need to strategically analyze their data, determine what they need to improve their business, develop a plan to find the products to fulfill their needs, then…execute the plan. Although your fingers will be “doing the walking” during GPE 2021, your time is still limited. As always, time is still our most valuable commodity. The GPE 2021 SuperSearch Tool will be available by 3/8 and regularly updated. It should help you make more efficient use of your time at the show. Try it out and…the best of luck at GPE Digital Access and for the balance of 2021!

Hope to see you in person in 2022 in Orlando!

Retail Channel Monthly $ Update – December Final & January Advance

Time for our monthly update on U.S. retail sales by channel. The current COVID-19 crisis has caused turmoil in the Retail Marketplace. Consumer spending behavior has changed and continues to evolve. In this report we will track the changes and migration between channels. We will do that with data from two reports provided by the U.S. Census Bureau.

The Reports are the Monthly Retail Sales Report and the Advance Retail Sales Report. Both are derived from sales data gathered from retailers across the U.S. and are published monthly at the same time. The Advance Report has a smaller sample size so it can be published quickly – approximately 2 weeks after month end. The Monthly Final Report includes data from all respondents, so it takes longer to compile the data – about 6 weeks. Although the sample size for the Advance report is smaller, the results over the years have proven it to be statistically accurate with the final monthly reports. The biggest difference is that the full sample in the Final report allows us to “drill” a little deeper into the retail channels.

We will look at the latest release of both reports. We will begin with the Final Retail Report from December and then move to the Advance Retail Report for January. This will allow us to look at both the final numbers for 2020 and do an initial comparison of January 2021 vs 2020.

Both reports include the following:

  • Total Retail, Restaurants, Auto, Gas Stations and Relevant Retail (removing Restaurants, Auto and Gas)
  • Individual Channel Data – This will be more detailed in the “Final” reports and we fill focus on Pet Relevant Channels

The information will be presented in detailed charts to facilitate visual comparison between groups/channels of:

  • Current Month change – % & $ vs previous month
  • Current Month change – % & $ vs same month one year ago.
  • Current YTD change – % & $ vs 2019 (Note: In the January Advance we will compare January 2020 to 2019)
  • Monthly and Year To Date $ will also be shown for each group/channel

First, the December Final. U.S. Retail hit bottom in April then began to recover. December $ were up from November, and still growing vs 2019. Here are the major retail groups. (The Data in all graphs is Actual, Not Seasonally Adjusted)

The final total is $3.4B less than the Advance report projected a month ago. All but Gas Stations were down but most of the reduction came from Relevant Retail: -$2.5B; Restaurants: -$0.1B; Auto: -$0.6B; Gas Stations: N/C. All groups were up vs November and set a new record Total Retail $ peak. YTD Total $ales finished more positive vs 2019 thanks to another strong month from Relevant Retail and Auto. The Auto segment finally beat 2019 $, but Restaurants and Gas Stations are down -$229B. Relevant Retail was the driving force in turning Total YTD sales positive vs 2019.

Now, let’s see how some Key Pet Relevant channels were doing in December.

  • Overall– $ in 10 of 11 groups were up vs November and 9 were up vs December 2019 and YTD. That’s very good.
  • Building Material Stores – Their “Spring” lift continued through Summer, Fall and now Winter. While sales peaked in June, they’re still showing double digit % increases vs 2019. Sporting Goods stores are not included in this group, but they have a similar Spring lift pattern. Their sales took off in May, and ultimately hit a record peak in December. In June, their YTD $ vs 2019 turned positive and by yearend they were up 16.6%.
  • Food & Drug – Supermarket $ slowed in Aug, Sep & Nov but turned up in October & December. They finished 2020 up +$77.7B. Drug Stores $ dipped in Aug & Nov but increased in Sep, Oct & Dec. They ended up +$17B.
  • General Merchandise Stores – $ in Clubs/SuperCtrs slowed in September then grew in Oct>Dec. They finished at +$33.2B vs 2019. $ Stores sales slowed from June>Sept but grew in Oct>Dec and ended 2020 +12.0% vs 2019. Discount Dept. store sales were slowing before the pandemic. This trend continues despite their Nov>Dec lift.
  • Office, Gift & Souvenir Stores– A 44% lift after a 28% November drop . A holiday lift but recovery is long way off.
  • Internet/Mail Order – The pandemic has accelerated this channel’s growth vs 2019. $ hit another record peak in December. Many consumers have discovered online shopping and the behavior is likely to become habitual.
  • A/O Miscellaneous – This is a group of small to midsized specialty retailers – chains and independents. It includes Florists, Art Stores and Pet Stores (22 to 24% of total $). Pet Stores were usually essential, but most stores were not. The others began reopening in May. That number grew in June and YTD $ surpassed 2019. Sales have been stable and strong vs 2019 since then and peaked in December. Their 2020 total sales were up +11.6%.

The recovery began in May and accelerated in June>July as even more businesses began to re-open. The Relevant Retail Segment was positive in all measurements in May>July. In Aug>Sept $ slowed but were still strong vs 2019. In Oct>Dec $ turned up and reached a record peak. The key drivers in the positive numbers vs 2019 were the Internet, Supermarkets, SuperCtrs/Clubs/$ Stores and Hdwe/Farm.  Now, how is 2021 starting off? Here are the Advance numbers for January.

April & May 2020 were the 2 biggest spending drops in history. Then sales began to recover and in October YTD Total Retail turned positive for the 1st time since February. Sales dipped in November but not vs 2019 . In December, Total Retail set a sales record. In January, as expected, $ fell but still set a new record high. All but Gas Stations and Restaurants are up from 2020.

Total Retail – Total Retail spending hit a record $616.6B in December and 2020 finished +$37B vs 2019. As usual, $ plummeted in January but still hit a record $509B, $27.9B ahead of 2020 and $51.7B ahead of 2019. (add the $ changes in the 2 columns to get status vs 2019). Remember, the impact of the pandemic didn’t begin until March 2020.

Restaurants – Spending was basically unchanged vs December but down $9.6B versus 2020, which shows the continuing impact of the pandemic on this group. Last January, $ fell 7% from December but were up 7.1% from 2019. Normally, January and February are the 2 slowest months, but they finished on top last year. Their 2020 totals were down $149B,  -19.5%. Recovery is still a long way off. If 2019 $ are the target for a return to normal, then they are only down $5.6B.

Automobile & Gas Stations – When you are staying home your car becomes less of a focus in your life. Auto Dealers began combating this attitude with fantastic deals and a lot of advertising. Monthly $ turned positive versus 2019 in June and stayed that way, finishing 2020 at +1.0% vs 2019. 2021 started even stronger, +10.4%. Gas Station $ales hit bottom in April and have been up and down ever since. However, sales have remained consistently about 16% below 2019. They finished 2020 -$79.6B (-15.9%). January began down $3.4B but we should note that $ were up $0.1B vs 2019.

Relevant Retail – Less Auto, Gas and Restaurants – Many non-essential businesses shuttered their doors in March but there was a rash of binge/panic buying for “necessities”, especially groceries, which drove spending up $19B. April brought a full month of closures and an end in binge buying, spending dropped $34B from March. In May, the overall market began to reopen so spending began to move in the right direction and growth continued through July. $ales fell in Aug/Sept but turned up again in Oct>Dec, reaching a record $412.9B in December. For 2020, they were up $252.9B, +6.8%. That brought us to January. Sales fell 22.5% (-$92.7B) from December. However, that was less than the 24.5%     (-$93.7B) drop in 2020. So $ are up 10.8%, triple the 3.6% from a year ago and the Relevant Retail group now has posted positive numbers versus last year and YTD for 9 consecutive months. The primary drivers continue to be Nonstore, Grocery, SuperCenters/Clubs/$ Stores plus a radically extended “spring lift” from Hardware/Farm and Sporting Goods.

Now let’s look at what is happening in the individual retail channels. After a record December, relevant retail $ took an expected plunge in January but was still +$31.3B vs 2020. Let’s see where the $ came from. These groups are less defined than in the Final Monthly reports and we will look across the whole market, not just pet relevant outlets.

In December, all 13 channels beat last month’s $. In January they were all down. 10 channels beat January 2020 $. Last year 12 beat 2019 $. However, the 2021 increases were generally significantly higher than 2020. Clothing stores had the biggest decrease vs 2020 but Department stores are the only channel with decreases in both years.

After April’s widespread closures there was a retail surge in May, but things truly opened up in June/July. In Aug/Sept, sales slowed but growth began again in October and peaked with a record December. Relevant Retail finished up $252.9B vs 2019 and started 2021 strong, +10.8%. Essential channels are responsible for the continued lift, primarily:

  • Nonstore Retailers – Even more consumers are online shopping.
  • Food & Beverage, especially Grocery– Restaurant $ are still down so consumers continue to eat & drink at home.
  • Bldg Materials/Garden/Farm– Their “Spring” lift continues unabated as consumers focus on their home.
  • SuperCtrs/Club/Value/$ Strs – Sales slowed in April but came back in May and continue to grow vs the previous year. They turned the whole Gen Mdse channel positive. It clearly shows that value is still a consumer priority.

Regarding the Individual Large Channels

General Merchandise Stores – As expected Sales dropped in January after the holiday lift with the biggest % decrease coming from Department Stores. Their problems were amplified by the pandemic but existed before as they are the only channel down in January vs a year ago for 2 consecutive years. Club/SuperCtr/$ stores are still the big positive force. They finished 2020 up $33B, +7.4% and started off 2021 at +9.6%, considerably better than the +3.5% in January 2020.

Food and Beverage, plus Health & Personal Care Stores – The Grocery segment is still strong and growing, +11.3% in January, due to the continuing big drop in restaurant sales. Sales in the Health, Personal Care group turned positive vs 2019 in September and finished +1.7%. They started 2021 even better, +3.3%. Drug Store $ growth has been the driver.

Clothing and Accessories; Electronic & Appliances; Home Furnishings – Except for September, monthly sales have grown every month since May. All 3 channels finished the year down significant percentages in sales vs 2019. Clothing Stores have been the worst performers and that continued in January. Home Furnishing stores may be breaking the pattern in 2021. In January, their sales were up 9.3% vs 2020. Perhaps their recovery has truly begun.

Building Material, Farm & Garden & Hardware – Sales peaked in late spring, as usual. However, this channel continues to benefit from consumers turning their focus to their home needs, including house and yard repair and improvements. Their Spring lift extended into winter and they finished +$53B (+13.8%). No change for 2021 – January $ +13.7% vs 2020.

Sporting Goods, Hobby and Book Stores – Book and Hobby stores are open and sales in Sporting Goods stores have taken off as Consumers are seeking more recreation. They were down -$3.4B in April. This deficit was wiped out in September and driven by Sporting Goods stores, sales exploded in December. They ended 2020 up $4.4B, +5.5%. January 2021 sales fell 35.8% from December but they are still up an amazing 22.0% vs January 2020.

All Miscellaneous Stores – This group is mostly small to medium specialty stores – both chains and independents. Pet Stores are essential but most other stores are not, so closures hit this group particularly hard. Sales hit bottom at -$3.8B in April then began to rebound in May and grew through July when they finally beat the monthly sales for 2019. Sales seesawed up and down but finished with a strong December. They ended 2020 down $1.0B, -0.7%. They started out 2021 +6.9% but this is only about half of the +13.3% start in 2020. We’ll see how their recovery progresses in 2021.

NonStore Retailers – 90% of the volume of this group comes from Internet/Mail Order/TV businesses. The COVID-19 crisis has only accelerated the ongoing movement to online retail. In February NonStore was up 8.6% YTD. In December monthly sales exceeded $100B for the 1st time. They ended 2020 at +21.9%, +$173.9B YTD. Their increase is 69% of the total $ increase for Relevant Retail Channels. Their 2020 performance far exceeds their 12.9% annual increase in 2019 and they started off 2021 even better, +22.1%. Last January, in pre-pandemic times, they were only up 7.1%.

Note: Almost without exception, online sales by brick ‘n mortar retailers are recorded along with their store sales in their regular channel. Whether they are up or down, their online sales are included in the totals.

Recap – April and May saw the 2 biggest year over year monthly sales declines in history. Restaurants, Auto and Gas Stations increased sales from May through July, but results were mixed until yearend. The Auto segment did beat 2019 YTD $ in December, but Restaurants and Gas Stations finished down -$229B. The Relevant Retail segment was the only true positive. Sales began to recover in May and hit a record high in December. They finished 2020 up $253B but for some segments in this group there is still a long way to go. Total Retail Sales passed 2019 in October, set a new monthly $ record in December and ended the year +$37B (+0.6%) vs 2019. In 2021 Relevant Retail and Auto both began the year at +10% vs 2020, much better than last year. For Restaurants and Gas Stations the problems continue as both started off 2021 down significantly vs 2020. Thanks to Auto and Relevant Retail, Total Retail is +5.8% vs 2020. (last year they were +5.2%) However, this is an ongoing battle. We will continue to monitor the data and provide you with regular updates.


2019 Pet Services Spending was $8.62B – Where did it come from…?

Next, we will look at Pet Services. They are by far the smallest Segment at $8.62B. Spending turned down $0.10B in 2019 after a $1.95B (+28.9%) lift in 2018, which was by far the biggest increase in history. The number of outlets offering Services has been strongly increasing in recent years as brick ‘n mortar retailers look for a way to combat the growing influence of online outlets. After all, you can certainly buy products, but you can’t get your dog groomed on the Internet. This created a highly price competitive market for Pet Services. In 2017 there was a slight increase in visit frequency, but Pet Parents just paid less. This resulted in a 1.0% decrease in Services spending. In 2018 consumer behavior changed as a significant number decided to take advantage of the increased availability and convenience of Pet Services and spending literally took off. In 2019, Services $ essentially held their ground at this new higher level. However, there was some turmoil as the demographic segments spending more or less were almost equally divided. We saw evidence of some value shopping as the younger groups spent less. However, the older age groups stepped up to take advantage of this new more convenient and affordable marketplace.

Pet Services maintained their stronger “presence” at the Pet Industry “table” and spending in this highly discretionary segment became a little more balanced. Let’s look a little deeper into the demographics.

Let’s start by identifying the groups most responsible for the bulk of Services spending in 2019 and the $0.10B decrease. The first chart details the biggest Pet Services spenders for each of 10 demographic categories. It shows their share of CU’s, share of Services spending and their spending performance (Share of spending/share of CU’s). The differences from the products segments are immediately apparent. In order to better target the bulk of the spending we had to alter the groups in two categories – education and area. The performance level should also be noted as 5 of 10 groups have a performance level above 120%. This is the same as Food but less than the 6 for Total Pet & Veterinary, and 7 for Supplies. Last year they had 7 over 120% which indicates that there is a little less disparity between the best and worst performing segments in 2019. Income is absolutely the biggest factor in Services Spending. The categories are presented in the order that reflects their share of Total Pet Spending which highlights the differences of the 8 matching groups.

  1. Race/Ethnic – White, not Hispanic (87.3%) up from 85.5%.This big group accounts for the vast majority of spending in every segment. Services Spending became slightly less diverse in terms of race and ethnicity in 2019 as their performance grew from 123.8% to 127.4% and they moved up from 5th to 4th in terms of importance.
  2. Housing – Homeowners (84.5%) up from 80.8%. Homeownership is a big factor in pet ownership and spending in all industry segments. The Homeowners’ share of Services rebounded sharply in 2019 as did their performance, which grew from 127.3% to 132.6%. Homeownership moved up to 3rd from 5th in terms of importance for increased Services $. Homeowners w/o mtge spent 25% more, but those w/mtge spent 4% less and … Renters $ were down 20%.
  3. # in CU – 2+ people (75.9%) down from 77.3% The share of market for 2+ CU’s is over 75% for all segments. It is lowest in Veterinary (75.0%) and Services (75.9%). Their performance of 108.7% is down from 109.6% and is also next to last. The explanation is that Singles (30.2% of CUs) spent 5% more while 2+ CUs spent -3% less.
  4. Education – College Grads (72.2%) up from 68.9% Income generally increases with education. Services spending moves up with each increasing level of education. This is why we again shifted the group up to College Grads. Performance of 162.6% was up from 157.9% and a college education is still the 2nd most important factor.
  5. # Earners – “Everyone Works” (67.6%) down from (71.5%) All adults in the CU are employed. Income is important so a high market share is expected. However, their performance fell to 115.6% from 123.8% and they are no longer in the 120% club. This was due to a 56% increase by No Earner, Singles and a 6% increase by 1 Earner, 2+ CUs.
  6. Occupation– All Wage & Salaried (69.8%) down from 71.4% – Blue Collar workers spent more but couldn’t overcome the decrease by White Collar workers, Managers and Professionals. Retirees also spent 18.5% more on Services. All of this contributed to All Wage & Salaried workers’ performance rating decreasing from 116.9% to 114.5%. Services spending became a little more balanced in terms of Occupation.
  7. Income – Over $70K (75.0%) up from 72.3% This group’s performance rating is 180.7%, up from 179.4% which shows that CU income is still the single most important factor in increased Pet Services Spending. <$70K was down -$0.26B. $70K> was up $0.16B but Services $ were on an income rollercoaster. <$30K was -$0.07B; $30>39K was +$0.19; $40>69K was -$0.38B; $70>149K was +$0.25B; $150K> was -$0.09B.
  8. Age – 35>64 (61.2%) down from 63.7%. Their performance fell from 120.4% to 117.0% and they dropped out of the 120% club. There was a clear age dividing line. <45 spent less. 45> spent more. In 2018 the 35>44 yr olds had the biggest increase. In 2019, they had the biggest decrease, -$0.43B. Spending by the 75+ group was up +$0.34B.
  9. Area – City/Suburbs >2500 (87.1%) up from 85.3% in share, while performance increased from 104.7% to 106.9%. Services is an Urban Segment. After a strong 2018, Central City $ fell -13% in 2019. The large Suburbs were the only segment to spend more, +$0.55B (+14.8%). All areas <2500 spent -$0.17B (-13.4%) less.
  10. CU Composition – Married Couples (61.4%) down from 62.8%. Married couples are a big share of $ and have 120+% performance in all segments but Veterinary. Their performance dropped to 125.7% from 126.6% and they fell to 5th place in terms of importance to Services spending. Married Couples with children spent -$0.28 less on Services while all CUs without children spent +$0.23B more.

We changed 2 of the groups for Services – Education and Area, to better target the biggest spenders. We should also note that Income is more important to spending in Services than in any other segment but the performance in categories related to income – # Earners, Occupation and Education was mixed. # Earners and Occupation became less important while higher Education grew in importance. In some categories, spending was slightly more balanced in 2019.

Now, we’ll look at 2019’s best and worst performing Pet Services spending segments in each category.

Most of the best and worst performers are not a surprise. There are 7 that are different from 2018 – 3 of the best and 4 of the worst, down from 8 last year. The 3 new winners are high income and big pet spenders. You can see the move away from youth after the big lift in 2018, but not completely as Gen Xers, including the 45>54 yr olds are still on top. Changes from 2018 are “boxed”. We should note:

  • Income is even more important to Pet Services. While the 342.3% Performance by the $200K> group is less than last year’s 364.0%, it is 45% higher than Supplies and 78% higher than the best performing income segment in Food.
  • Generation – Gen X retained Top Spot and Millennials/Gen Z returned to the bottom. 2019 reversed some of the gains made by the younger generations in 2018.
  • Age – The 45>54 group reflects the move to more expected winners. They spend the most $ and are by far the best performers. All groups from 35>64 perform at 100+%. The low income <25 group returned to the bottom.
  • Area –Suburbs 2500> kept the lead in $ and regained the lead in performance from Center City. As we have said Services is an Urban segment. Areas 2500> perform at 106.9%. Areas <2500 perform at 69.6%.
  • CU Composition Married Couples Only returned to the top by eking out a small, 2.2% increase. Married couples with children spent less on Services in 2019 but Marriage and children are important factors in Services spending. Married Couples only and those with children of any age all perform over 100%. They all earn their share.

In Pet Services spending performance, income is still the major factor. After the youth movement in 2018, spending skewed towards older groups in 2019.

It’s time to “Show you the money”. Here are segments with the biggest $ changes in Pet Services Spending.

Pet Services Spending was down $0.10B, essentially flat. In this chart you immediately see a difference from last year. In 2018, six categories had no segments that spent less on Services. In 2019, there were none. You also see that in most cases the changes for the winner and loser tend to cancel each other out. Although the total $ change was small, the spending was more tumultuous than in 2018. There were only 2 repeats, compared to 7 last year. Also, 9 of 24 segments switched their position from first to last or vice versa. There were only 5 in 2018. Here are the specifics:

  • Area Type – Center City flipped from 1st to last. They have flipped every year since 2016.
    • Winner – Suburbs 2500> – Pet Services Spending: $4.28B; Up $0.55B (+14.8%)           2018: Center City
    • Loser – Center City – Pet Services Spending: $3.23B; Down $0.48B (-12.9%)                   2018: Suburbs <2500
    • Comment – The large Suburbs won and were also the only area to spend more on Services in 2019.
  • Housing – Homeowners w/o Mtge flipped from last to first.
    • Winner – Homeowner w/o Mtge – Services: $2.33B; Up $0.46B (+24.9%)           2018: Homeowner w/Mtge
    • Loser – Renter – Services: $1.34B; Down $0.33B (-20.0%)                                          2018: Homeowner w/o Mtge
    • Comment – Renters and Homeowners w/mtge spent less. The lift by Homeowners w/o mtge is tied to Retirees.
  • Age – The 35>44 yr olds flipped from 1st to last…
    • Winner – 75+ yrs – Pet Services Spending: $0.76B; Up $0.34B (+80.5%)                                 2018: 35>44 yrs
    • Loser – 35>44 yrs – Pet Services Spending: $1.57B; Down $0.43B (-21.7%)                               2018: 65>74 yrs
    • Comment: In 2018, all age groups spent more on Services. The 35>44 yr olds led the way, followed by 45>54. In 2019 all groups under 45 yrs old spent less, -$0.60B, while all groups over 45 spent more, +$0.50B. The 75+ year olds led the way and like 2018, the 45>54 yr olds came in second.
  • # Earners– No repeats or flips. No Earner, Singles and 1 Earner, 2+ CUs had the only increases.
    • Winner – No Earner, Single – Pet Services Spending: $0.86B; Up $0.31B (+56.0%)     2018: 2 Earners
    • Loser – 1 Earner, Single – Pet Services Spending: $1.22B; Down $0.20B (-14.4%)         2018: No Earner, 2+ CU
    • Comment – The # of Earners became slightly less important as “Everyone Works” CUs spent -$0.40B less.
  • Generation – Gen X flipped from 1st to last.
    • Winner – Born <1946 – Services: $0.95B; Up $0.24B (+33.0%)                                             2018: Gen X
    • Loser – Gen X – Services: $3.04B; Down $0.31B (-9.1%)                                                           2018: Baby Boomers
    • Comment – Despite their drop in $, Gen X maintained their position as the biggest Services Spenders. 2019 saw a clear Generational divide in Pet Services spending. Gen X & Millennials spent less while Boomers and those born before 1946 spent more,
  • Occupation – Both the winner and loser flipped.
    • Winner–– Retired – Pet Services Spending: $1.46B; Up $0.23B (+18.5%)                   2018: Mgrs & Professionals
    • Loser – Mgrs & Professionals – Pet Services Spending: $3.55B; Down $0.34B (-8.6%)                    2018: Retired
    • Comment – Retirees & Blue Collar workers spent more while White Collar workers & Self-Employed spent less.
  • Education – Advanced College Degree held their spot on top.
    • Winner – Adv. College Degree – Pet Services Spending: $3.30B; Up $0.20B (+6.6%)             2018: Adv. College Degree
    • Loser – HS Grad w/some College – Pet Services Spending: $0.93B; Down $0.24B (-20.3%)        2018: HS Grad
    • Comment – Again we have a clear dividing line on Services Spending. All those with a formal college degree, from Associates on up, spent more. All other education levels spent less.
  • Income – The winner flipped from last to first.
    • Winner – $30 to $39K – Pet Services Spending: $0.46B; Up $0.19B (+69.9%)                           2018: $200K+
    • Loser – $50 to $69K – Pet Services Spending: $0.63B; Down $0.21B (-24.8%)                            2018: $30 to $39K
    • Comment – The win by the $30>39K is not surprising. This income range corresponds to the average income of Retirees, so they undoubtedly were the primary driver. However, as we stated earlier, we had a rollercoaster in Pet Services spending in 2019. <$30K was down -$0.07B: $30>39K was up $0.46B; $40>69K was down -$0.38B; $70>149K was up $0.25K; $150K> was down -$0.09B.
  • Region – The Midwest won while flipping for the second consecutive year.
    • Winner – Midwest – Pet Services Spending: $1.82B; Up $0.18B (+11.3%)                                 2018: South
    • Loser – Northeast – Pet Services Spending: $1.45B; Down $0.23B (-13.8%)                             2018: Midwest
    • Comment – Last year all regions spent more. This year it was only the Midwest and West.
  • # in CU – 5+ Person CUs flipped from last to first.
    • Winner – 5+ People – Pet Services Spending: $0.63B; Up $0.11B (+21.5%)                        2018: 2 People
    • Loser – 3 People – Pet Services Spending: $1.29B; Down $0.17B (-11.6%)                           2018: 5+ People
    • Comment: The winner was a bit of a surprise and narrowly edged out Singles to come out on top.
  • CU Composition – The winner and loser are both new.
    • Winner – Married, Oldest Child 6>17 – Services: $1.16B; Up $0.11B (+10.3%)                  2018: Singles
    • Loser – Married, Oldest Child <6 – Services: $0.41B; Down $0.20B (-32.8%)                    2018: Single Parents
    • Comment – Although Gen X had the biggest decrease, they are still strong. The winner in this group was likely produced by the 45>54 yr old group. The loser was more likely to be younger.
  • Race/Ethnic – White, Not Hispanics held their position at the top.
    • Winner – White, Not Hispanic – Services: $7.53B; Up $0.08B (+1.0%)                     2018: White, Not Hispanic
    • Loser – Hispanic – Services: $0.53B; Down $0.11B (-17.6%)                                           2018: African American
    • Comment – Higher incomes – Whites & Asians spent more. Lower incomes – Hispanics & Blacks spent less.

We’ve now seen the winners and losers in terms of increase and decrease in Services Spending $ for 12 Demographic Categories. After a fabulous 2018, Services $ essentially flattened out in 2019. 49% of segments spent more compared to 88% in 2018. The winning increase in each category averaged +$0.25B, down from +$1.04B in 2018, while the biggest decreases averaged -$0.27B, up from -$0.02B. The spending also flipped from younger to older groups. Income is still of primary importance, but we saw a mixed bag of results for different levels. Urban areas are still the primary spenders but in 2019 more $ moved to the big Suburbs. The -$0.10B decrease was minor and we have detailed the best segments in performance and $. However, there were others who performed well but didn’t finish on top. They deserve….

HONORABLE MENTION

Higher income is important, but the results were mixed in 2019. The $30>39K group won but there were also positive performances by the high income Asians, the middle income $70>99K group and Blue Collar Workers. Also, unless your oldest child was between 6>17, CUs with kids spent less on Services. CUs with no children spent more. 1 Earner, 2+ CUs was 1 of only 2 segments in the Earners category to spend more and are the only segment to increase Services spending for 4 consecutive years. The largest, 5+ Person CUs narrowly edged out the smallest, 1 Person CUs for the win.  Spending increases, 49% and decreases, 51% were evenly split.

Summary

The Services segment has usually been “above” changes in other segments. Since 2010 prices have steadily increased but so did Spending …until 2017. An increase in outlets offering Services created a much more competitive environment. While prices didn’t deflate, inflation slowed significantly, and “deals” abounded as Retailers began a pitched battle for Consumers’ Services $. The net result was turmoil and a 1% decrease in spending. In 2018, the abundance of outlets and competitive prices finally had their intended impact. Many more consumers took advantage of the convenience of Pet Services and spending literally took off. In 2019 Consumers held their ground at the new higher level but we saw turmoil similar to 2017. Value shopping likely contributed to the small decrease.

Pet Services are definitely needed by some groups. However, for most demographics, Services are a convenience and spending is very discretionary in nature. The result of this is that usually CU income is of real importance to increased Services spending. While we saw mixed results according to income level in 2019, higher incomes still won out. 41.5% of CUs make over $70K and account for 75.0% of Services spending. This is a performance rating of 180.7% – the highest rating earned in any industry segment.

Performance is an important measurement. There were 5 categories with high performing big groups, down from 7 in 2018. This is equal to Food but less than Supplies (7) & Veterinary (6). This indicates less disparity in Services Spending.

  • Income    · Higher Education     · Homeownership    · CU Composition     · Race/Ethnicity

The two categories that dropped out were Age and # of Earners. They surpassed the 120% marker in 2018 because there was a strong youth movement. In 2019 the increases came from groups over 45 so the Age category became more balanced. Younger CUs also have more earners, so this category became less important as spending skewed a little older. However, we should note that while Gen X had the biggest decrease, they are still #1 in Services Spending.

2018 saw the biggest lift in history and it was widespread as 88% of all demographic segments spent more on Services. In 2019 Services essentially held their ground, only falling -$0.10B (-1.1%). The small decrease is reflected  in the mixed demographic spending pattern. 51% of the segments spent less while 49% spent more.

The Services segment has seen a radical increase in the number of outlets. Services is the most discretionary industry segment and much of the spending is driven by the consumers’ need for convenience. The increase in outlets certainly made things more convenient, but it also created a more competitive market. This produced “deals”, the biggest driver for all Americans. This made Services an option for more Americans and drove the huge 2018 lift. “Value shopping” was probably a factor in the small decrease in 2019. The 2020 pandemic probably hit this segment rather hard. We’ll see.

At Last – The “Ultimate” Pet Services Spending Consumer Unit consists of 2 people – a married couple, only. They are White, but not of Hispanic origin. At least one of them has an advanced College Degree. They are 45 to 54 years old and both of them work, in managerial positions. They’re doing well with an income over $200K. They live in a large suburb of a metropolitan area of over 2.5 million in the Western U.S. and are still paying off their mortgage.