2019 Veterinary Spending was $21.80B – Where did it come from…?
Now we will turn our attention to the final Industry Segment – Veterinary Services. For years, Veterinary Services prices have had high inflation. This has resulted in CU income becoming the most dominant factor in spending behavior and a reduction in visit frequency. Consumers paid more, just used Veterinary Services less often.
Things changed in 2017 as Veterinary pricing had an all-time record low inflation rate. Consumers responded with a 7.2% increase in visit frequency and spent $2.5B more on Veterinary Services. In 2018 inflation began to return to more normal levels. Visit frequency fell slightly -0.2%, but Consumers spent $0.56B more (+2.7%). However, the inflation rate was 2.6% so virtually all of the lift was from increased prices. In 2019 the situation got worse. Consumers spent $0.58B (+2.7%) more but inflation was 4.14%. This means that there was an actual decrease in the amount of Veterinary Services purchased in 2019. In this report we’ll look deeper into the situation.
We’ll start with the groups who were responsible for the bulk of Veterinary spending in 2019 and the $0.58B increase. The first chart details the biggest pet Veterinary spenders for each of 10 demographic categories. It shows their share of CU’s, share of Veterinary spending and their spending performance (Share of spending/share of CU’s). We immediately note a difference in performance – 6 of 10 groups perform above 120%. This is the same as 2018 and equal to Total Pet. Supplies leads with 7 and Food & Services trail with 5. This means that these big spenders are performing well but it also signals that there is a large disparity between the best and worst performing segments. Income is clearly the biggest factor in Veterinary Spending. The categories are presented in the order that reflects their share of Total Pet Spending which highlights the differences of the categories.

- Race/Ethnic – White, not Hispanic (90.9%) the same as 2018. This group accounts for the vast majority of spending in every segment., but a 91% share is extraordinary. Their 132.6% performance rating now ranks #2 in terms of importance in Veterinary Spending demographics and reflects the spending disparity. Hispanics, African Americans and Asians account for 31% of U.S. CU’s, but they only spend 9% of Vet $. Asians and African Americans have a significantly lower percentage of pet ownership and African Americans have the lowest average CU income.
- Housing – Homeowners (83.2%) down from (83.4%) Homeownership is a major factor in pet ownership and spending in all industry segments. In terms of importance to Veterinary spending, their 130.5% performance rating, down from 131.4%, keeps homeownership in 4th place. The slight decrease in share and performance was driven by a small $0.11B decrease in spending by Homeowners w/o Mtge and a lift by renters. We should note that Homeownership is not as important to Veterinary Spending as it once was. In 2015 their share was 88.4% with performance of 141.8%.
- # in CU – 2+ people (75.0%) down from (81.6%) This group, which is 70% of U.S. CUs, lost significant share and their performance fell from 115.7% to 107.4%. Their rank in terms of importance in Veterinary Spending fell from 7th to last. Only 1 & 3 person CUs spent more. Much of the big loss in share and performance was driven by a $1.54B (+39.5%) spending increase by singles.
- Education – Associates Degree and Higher (73.5) down from (76.3%) Income generally increases with education. It is also important in understanding the need for regular Veterinary care. Performance also fell from 140.0% to 132.3%. Education became weaker as it fell from 2nd to 3rd in importance in Vet spending. Those with an Advanced College degree spent $1.14B more but couldn’t overcome a -$1.31B decrease from BA/BS and Associates Degrees.
- # Earners – “Everyone Works” (70.4%) up from (66.5%) In this group, all adults in the CU are employed. Their Performance also grew to 120.3% up from 115.1% and they joined the 120+% club, ranked #6. The gains come from a $2.13B increase from working singles and 2 Earner CUs. All other segments but No Earner, Singles spent less.
- Occupation – All Wage & Salaried (67.3%) up from (66.5%) and their performance only increased from 108.3% to 110.3%. The gains were small because the results were mixed. Inside the group, Managers & Professionals spent $0.59B less, while lower level White Collar and Blue Collar Workers spent $1.22B more. Outside the group, Retirees spent $0.50B more but the Self-Employed spent -$0.57B less.
- Income – Over $70K (66.3%) down from (68.2%) The performance of the $70K> group fell significantly from 169.2% to 159.8%. However, higher income is still the most important factor in increased Vet spending. $70K> spent -$0.03B less while <$70K spent $0.60B more. However, the results were mixed. <$30K: up $0.58B; $30>50K: -$0.19B; $50>70K: +$0.21B; $70>100K: +$0.48B; $100>150K: -$0.59B; $150>200K +$0.44B; $200K>: -$0.36B
- Age – 35>64 (63.2%) down from (66.1%) Their performance also fell from 124.9% to 120.7% but Age remained 5th in terms of importance. All the turmoil was within the group. 35>44 yr olds spent $1.23B more but the 45>64 yr olds spent $1.48B less. A $0.72B increase by the 65+ group also contributed to the decreases in share and performance.
- Area – Suburban (63.6%) up from (63.2%) Suburban CU’s are the biggest spenders in every segment. They gained a little in share and in performance, which was 114.4%, up from 113.9%. The gains were entirely due to a $1.34B increase by the large suburbs. 2019 was about population. <2500 (Urban & Rural): -$1.11B; 2500>: +$1.69B
- CU Composition – Married Couples (57.0%) down from (60.6%) Previously, Married Couples had a 60+% market share and 120+% performance in all segments. That ended in 2019 as their performance also fell to 116.7% from 122.2% and they dropped out of the 120+% club. Married Couples Only spent $1.04B less but those with an oldest child over 6 also were down $0.25. This, in combination with a $1.54B increase by Singles, caused the losses.
Although performance fell, Higher income is still by far the biggest single factor in Veterinary spending. We see the impact of this in many groups as it often contributes to the big spending disparity between segments. The most notable change was that Married Couples were replaced by # Earners in the 120+% performance club.
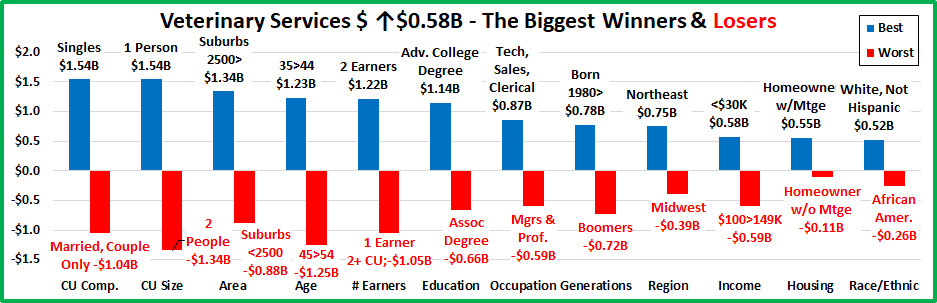
Now, we’ll look at 2019’s best and worst performing Veterinary spending segments in each category.

Almost all of the best and worst performers are those that we would expect. However, there are 11 that are different from 2018. This is much more than the (7) in Food & Services and (5) in Supplies. This suggests some spending turmoil even though there was no big change in $, up or down. The changes from 2018 are “boxed”. We should note:
- Income – Down from the $200K> group in 2018. 1st and last are also a little closer together, 15%.
- Earners – New, but not unexpected, winner and loser. However, the gap between the two is 32% lower in 2019.
- Occupation – 2018: Self -Employed; 2019: Mgrs & Professionals. They are the 2 highest income segments.
- Education – Back to the usual winner and loser but the gap between the two also narrowed slightly, 8%.
- Age – In a surprise, the 35>44 year olds took over from the highest income group, 45>54. The loser also flipped from the oldest to the youngest, not a big surprise. By the way, only CUs in the 35>64 age range perform above 100%.
- CU Composition – It was a good year for Married Couples with an Oldest Child over 18 and Singles. The Married group held their ground in spending but became the top performer and Singles got off the bottom.
- # in CU – 3 and 1 person CUs were the only groups to increase Veterinary spending. Singles had the biggest lift, but they still have a long way to go. The 5+ CUs finished on the bottom for the second year in a row.
- Region – Northeast won again – 5 straight years. The South has finished last for 4 years in a row.
It’s time to “Show you the money”. Here are segments with the biggest $ changes in Veterinary Spending.
We saw some turmoil in performance, but not here. There were 8 repeats and only 4 segments flipped from 1st to last or vice versa. Last year they had 2 repeats and 10 flips. Veterinary was the calmest segment in $ change. There were some surprise winners – Tech/Sls/Clerical, <$30K, Millennial/Gen Z and losers – Mgrs/Profess, $100>149K, 45>54. There were also surprising repeats W: 35>44 & Singles; L: Boomers & Married Couple only. Here are the specifics:
- CU Composition – The winner and loser are both repeats.
- Winner – Singles – Veterinary: $5.45B; Up $1.54B (+18.6%) 2018: Singles
- Loser – Married, Couple Only – Veterinary: $5.73B; Down $1.04B (-7.8%) 2018: Married, Couple Only
- Comment – Singles had another strong year while Married, Couple Only CUs had another bad one. In CUs with children, only those with an oldest child under 6 had an increase.
- # in CU – 1 Person CUs were the repeat winner in this category too.
- Winner – 1 Person – Veterinary Spending: $5.45B; Up $1.54B (+18.6%) 2018: 1 Person
- Loser – 2 People – Veterinary Spending: $8.23B; Down $1.34B (-8.3%) 2018: 3 People
- Comment: The winning numbers were 1 and 3, with a total increase of $2.04B. CUs of all other sizes spent $1.47B less. Most of the big drop by the 2 person group was driven by Married, Couple Only CUs.
- Area Type – The winner and loser are new, but both are Suburban.
- Winner – Suburbs 2500> – Veterinary Spending: $11.21B; Up $1.34B (+13.8%) 2018: Central City
- Loser – Suburbs <2500 – Veterinary Spending: $2.66B; Down $0.88B (-32.2%) 2018: Rural
- Comment – There was a clear spending break at a population of 2500. Those areas with a population over 2500 spent $1.69B more. Those under 2500 spent $1.11B less.
- Age – In a bit of a surprise, the 35>44 are repeat winners.
- Winner – 35>44 yrs – Veterinary Spending: $5.06B; Up $1.23B (+28.3%) 2018: 35>44 yrs
- Loser – 45>54 yrs – Veterinary Spending: $4.16B; Down $1.25B (-11.9%) 2018: 55>64 yrs
- Comment: The highest income group, 45>54 yr olds, are somewhat of a surprise loser. Last year, Veterinary spending by age group was up and down, a spending rollercoaster. In 2019 it was more defined. The 45>64 yr olds spent $1.48B less. All other age groups, younger and older, spent $2.06B more.
- # Earners – Both the winner and loser are new, but not surprising.
- Winner – 2 Earners – Veterinary Spending: $9.75B; Up $1.22B (+27.5%) 2018: 1 Earner, Single
- Loser – 1 Earner, 2+ CU – Veterinary Spending: $3.11B; Down $1.05B (-19.4%) 2018: No Earner, 2+ CU
- Comment – Income is of primary importance to increased Veterinary Spending and in 2019, the number of earners took on added significance. All single CUs spent more but in 2+ person CUs, only those with 2 earners increased Veterinary spending.
- Education – Those with an Advanced College Degree flipped from last to first.
- Winner – Adv. College Degree – Veterinary Spending: $6.53B; Up $1.14B (+12.6%) 2018: BA/BS Degree
- Loser – Associates Degree – Veterinary Spending: $2.10B; Down $0.66B (-8.5%) 2018: Adv. College Degree
- Comment – Another spending rollercoaster – < HS: Up $0.23B; HS Grad: Down -$0.14B; HS Grad w/some College: Up $0.65B; Associates/BA/BS Degrees: Down -$1.31B; Advanced College Degree: Up $1.14B.
- Occupation – A new winner and loser with the “Bosses” on the bottom.
- Winner – Tech/Sales/Clerical – Veterinary Spending: $3.70B; Up $0.87B (+43.5%) 2018: Self-Employed
- Loser – Mgrs & Professionals – Veterinary Spending: $7.77B; Down $0.59B (-15.0%) 2018: Retired
- Comment – The highest income groups – Self-Employed and Mgrs & Professionals spent $1.16B less. However, the lower income groups – Retirees, Blue Collar workers and Tech/Sls/Clerical spent $1.71B more.
- Generation – Millennials/Gen Z edge out Gen X for the win – a payback for last year?
- Winner – Born after 1980 – Veterinary: $5.18B; Up $0.78B (+15.9%) 2018: Gen X
- Loser – Baby Boomers – Veterinary: $7.48B; Down $0.72B (-17.7%) 2018: Baby Boomers
- Comments – The Boomers held on to the bottom spot. This year the spending was clearly divided. The younger groups, Gen X and Millennials spent more while the older generations spent less.
- Region – A second consecutive dual flip in this category.
- Winner – Northeast – Veterinary Spending: $5.08B; Up $0.75B (+19.0%) 2018: Midwest
- Loser – Midwest – Veterinary Spending: $4.62B; Down $0.39B (-7.2%) 2018: Northeast
- Comment – The South finished second for the 3rd consecutive year. Only the Midwest spent less.
- Housing – The winner and loser held their positions.
- Winner – Homeowner w/Mtge – Veterinary: $12.45B; Up $0.55B (+10.5%) 2018: Homeowner w/Mtge
- Loser – Homeowner w/o Mtge – Veterinary: $5.69B; Down $0.11B (-7.7%) 2018: Homeowner w/o Mtge
- Comment – Only Homeowners w/o Mtge spent less. This decrease comes when Retirees and the over 65 group spent more. Much of it may have been driven by slightly younger CUs who have paid off their mortgage.
- Income – In a total surprise the under $30K group flipped from last to first.
- Winner – <$30K – Veterinary Spending: $2.37B; Up $0.58B (+13.7%) 2018: $150K>199K
- Loser – $100>149K – Veterinary Spending: $3.91B; Down $0.59B (-29.9%) 2018: <$30K
- Comment – Our final spending rollercoaster – <$30K: Up $0.58B; $30>50K: Down $0.19B; $50>99K: Up $0.69B; $100>149K: Down $0.59B; $150>199K: Up $0.44B; $200K>: Down $0.36B.
- Race/Ethnic – White, non-Hispanics stayed on top and maintained their overwhelming dominance in this segment.
- Winner – White, Not Hispanic – Veterinary: $19.83B; Up $0.52B (+3.8%) 2018: White, Not Hispanic
- Loser – African American – Veterinary: $0.57B; Down $0.26B (-31.1%) 2018: Asian Americans
- Comment – Only African Americans spent less but this comes after a 60% increase last year. High inflation has caused a reduction in visit frequency. This has often produced big annual $ swings in low income minorities.
We’ve now seen the winners and losers in terms of increase/decrease in Veterinary Spending $ for 12 Demographic Categories. 2019 saw continued slow growth in Veterinary spending. With 8 segments holding their position from 2018 and only 4 flipping from first to last or vice versa, 2019 was much calmer than 2018. Most of the winners were not unexpected but there were some surprises like <$30K, 35>44 and Singles. The “youth movement” also continued as Gen X and Millennials both spent more. However, there were also “hidden” segments that didn’t win but made a significant contribution to the 2019 spending increase. These groups don’t win an award, but they certainly deserve….
HONORABLE MENTION
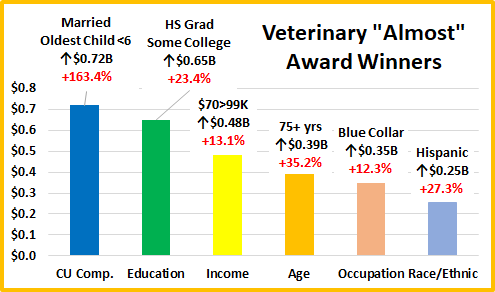
Married CUs with an oldest child <6 were the only CU with kids to spend more. Spending became more balanced in Education & Income which is reflected by the performance of HS Grads w/some College and the $70>99K groups. It wasn’t just the younger groups who spent more. The 75+ yr olds were up $0.39B (+35.2%). All the lower income occupations spent significantly more on Veterinary Services, including Blue Collar Workers, +$0.35B (+12.3%). Hispanics bounced back with a 27% increase after a 19% drop in 2018. 57% of 96 demographic segments spent more, down slightly from 63% last year.
Summary
2016 and 2017 produced a combined increase of $3.6B in Veterinary Spending as inflation moved to record low levels. In 2018 we had the Baby Boomer Spending “Bust” which especially impacted Food and Veterinary. The Boomers spending continued to fall in 2019. Fortunately, Gen X and Millennials stepped up to produce a small. 2.7% increase in both years. Overall, Veterinary Spending became a little more balanced in Income, Age, Education and the size and makeup of CUs.
Veterinary spending did become a little more balanced in terms of Income and Education, but these 2 categories are still of primary importance in terms of increased spending, Both had an up and down rollercoaster spending pattern between segments. Let’s look at the final result. To compare groups, we will look at performance. (Share Vet $/Share CUs)
Income: Performance increases with income and reaches the “break even” point (100%) at $70K+. CU’s over $70K (41.5%) account for 66.3% of Veterinary $. Performance = 159.8%. Performance for <$70K = 57.6%. That’s a difference of 100.2%. Spending may be more balanced but that is still a huge disparity.
Higher Education: Performance increases with Education but doesn’t reach 100% until you have a BA/BS degree. College Grads, 44.4% of CUs, account for 63.9% of Veterinary $. Performance = 144.1%. Performance for <College Grads= 64.8%. The difference is 79.3%. The disparity is not as bad as Income but still huge. Equality in both categories is a long way off.
The performance of other big spending groups is also very important in the Veterinary segment. We identified six demographic categories with high performing large groups. (There were 7 for Supplies, 5 for Services and Food). Consumers have no control over Race/Ethnicity or Age but in addition to Income and Education, Homeownership and # Earners are also important factors in Veterinary spending. Actually, all 6 of these groups are tied to income and their high performance demonstrates that there are still big spending disparities among segments within these categories.
There were some changes of note. Marriage lost ground as Singles increased their spending and # Earners became significantly more important, which relates to both income and the strong performance by the younger generations.
2019 saw another small spending increase (+2.7%) for Veterinary Services. 57% of all segments increased spending but with a 4.14% inflation rate, the amount of Veterinary Services actually decreased . The lift was again driven by Gen Xers and Millennials which was reflected in the strong performance of segments like Singles, Tech/Sls/Clerical, 2 Earners and 35>44 yr olds. While spending became a little more balanced, the importance of income to spending in this segment was still very apparent. That brings us to 2020. The COVID-19 pandemic has had the greatest negative impact on lower income groups. We’ll see if that works to increase the Income disparity in Veterinary Spending.
Finally – The “Ultimate” Veterinary Services Spending Consumer Unit consists of 3 people – a married couple and their 18 yr old child. They are at the top of the 35 to 44 age range. They are White, but not of Hispanic origin. At least one of them has an Adv. College Degree. Both are Mgrs/Professionals and their total income is $150>$200K. They live in a small suburb, adjacent to a big city in the Northeastern U.S. and are still paying off the mortgage on their home.

