2020 Top 100 U.S. Retailers – Sales: $2.4 Trillion, Up 8.5% – 152,931 Stores with Pet Products……plus the Internet!

The U.S. Retail market reached $6.22 Trillion in 2020 from all channels – Auto Dealers, Supermarkets, Restaurants, Online retailers and even Pet Stores. Due to the pandemic, this year’s increase of $30B (+0.5%) was far below last year’s increase of $216B (+3.6%). The Total Retail Market was massively negatively impacted by COVID related closures and restrictions and only eked out a positive number because of increased spending in the Relevant Retail Segment. (Data courtesy of the Census Bureau’s monthly retail trade report.)

In this report we will focus on the top 100 Retailers in the U.S. Market. The base data on the Top 100 comes from Kantar Research and was published by the National Retail Federation (NRF). The criteria for inclusion was changed for 2020 as Restaurants were removed from the list. Along with 15 restaurants, 3 other retailers from 2019 didn’t make the 2020 list. In order to make more valid comparisons between 2020 and 2019, I used the data to create a revised “Restaurant Free” 2019 list. The Top 100 are the retail elite and account for 39% of the total market. The vast majority also stock and sell a lot of Pet Products. Let’s get started. The report does contain a lot of data, but we’ll break it up into smaller pieces to make it more digestible.

We’ll begin with an overview:

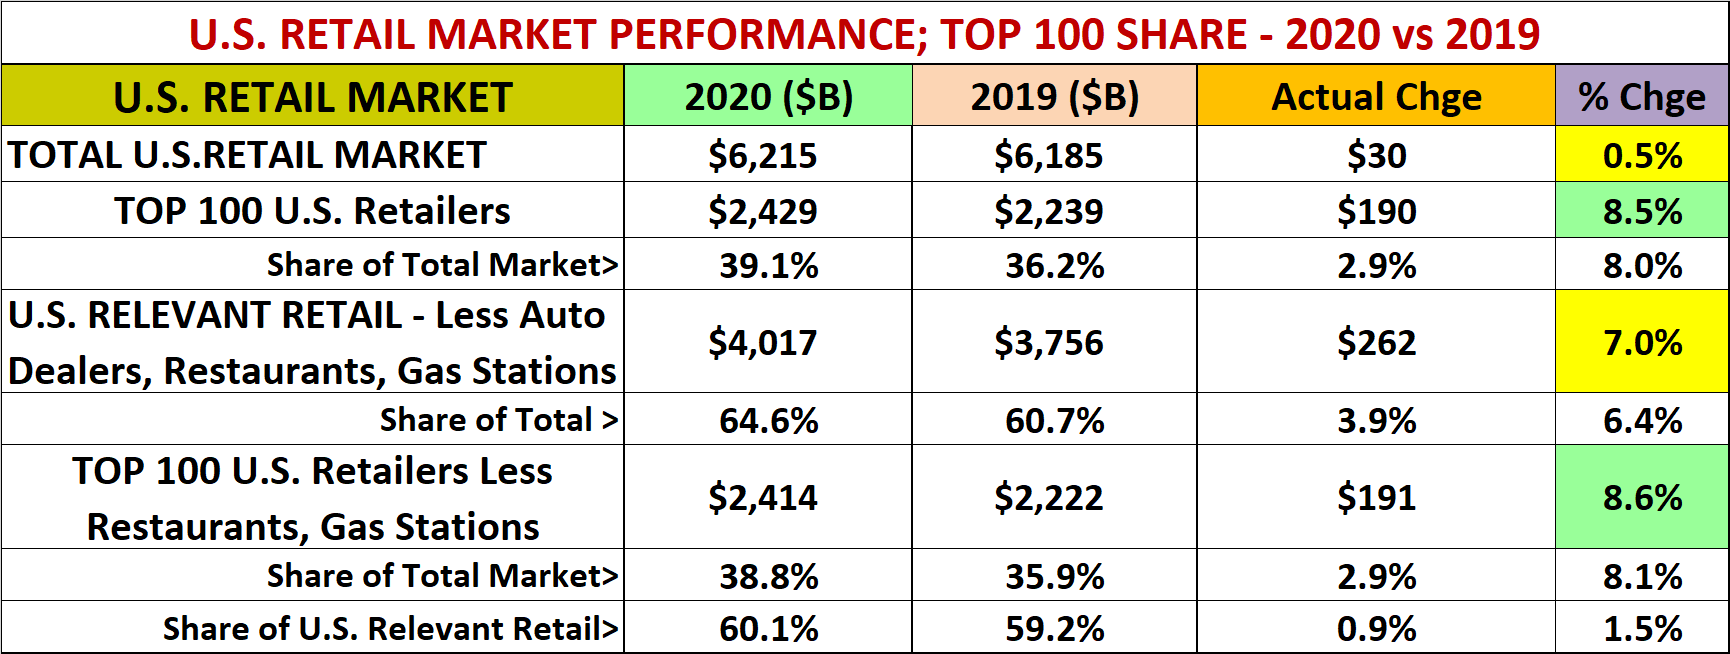
  • The total Retail Market only grew $30B in 2020 (+0.5%) It was $216B (+3.6%) in 2019, +4.9% in 2018 and +4.3% in 2017. You can clearly see the impact of the pandemic on the Total Retail Marketplace.
    • The Top 100 grew $190B (+8.5%) – almost double last year’s +4.5% and radically better than the total market.
    • The Top 100 generates $2.4 Trillion in revenue, 39.1% of the total U.S. retail market – 8% more than 2019.
  • Let’s make the data a bit more relevant. If you remove the revenue from Auto, Restaurant and Gas Stations, the “targeted” retail market for the Pet Industry is $4.0 Trillion – 64.6% of the total market. By the way, the gain in share is due to the loss of revenue in Restaurants and Gas Stations.
    • If we also remove Restaurant & Gas Station $ from the Top 100, the remaining $2.4T is 38.8% of the total market.
    • … and 60.1% of the $4.0 Trillion “target” market.

The Top 100 generally outperforms the overall market. In 2020 the difference in performance was significant. The big lift was driven by the Top 100 targeted retail group, less gas stations. Remember, the Top 100 is really a contest. Companies drop out and new ones are added. This can be the result of mergers, acquisitions or simply surging or slumping sales. In 2020 in addition to 15 restaurants being removed, 3 companies dropped out due to a big drop in sales:

  • Ascena Retail Group
  • Saks/Lord & Taylor
  • Nieman Marcus

These companies are Apparel or Department Stores. Companies in both these groups generally fell in rank in 2020.

18 Companies were added to the top 100. Grocery – Supermarkets (9) and Convenience (2) led the way, along with:

  • Pet Store
  • Musical Instrument Store
  • Electronics Store
  • Auto Parts Store
  • Apparel Stores (2)
  • Alcoholic Beverage Store

Now let’s start “drilling down” into the specifics of the 2020 Top 100. First, let’s take Gas Stations out of the mix. Here’s a summary of Regular and Online Retailers versus Gas Stations.

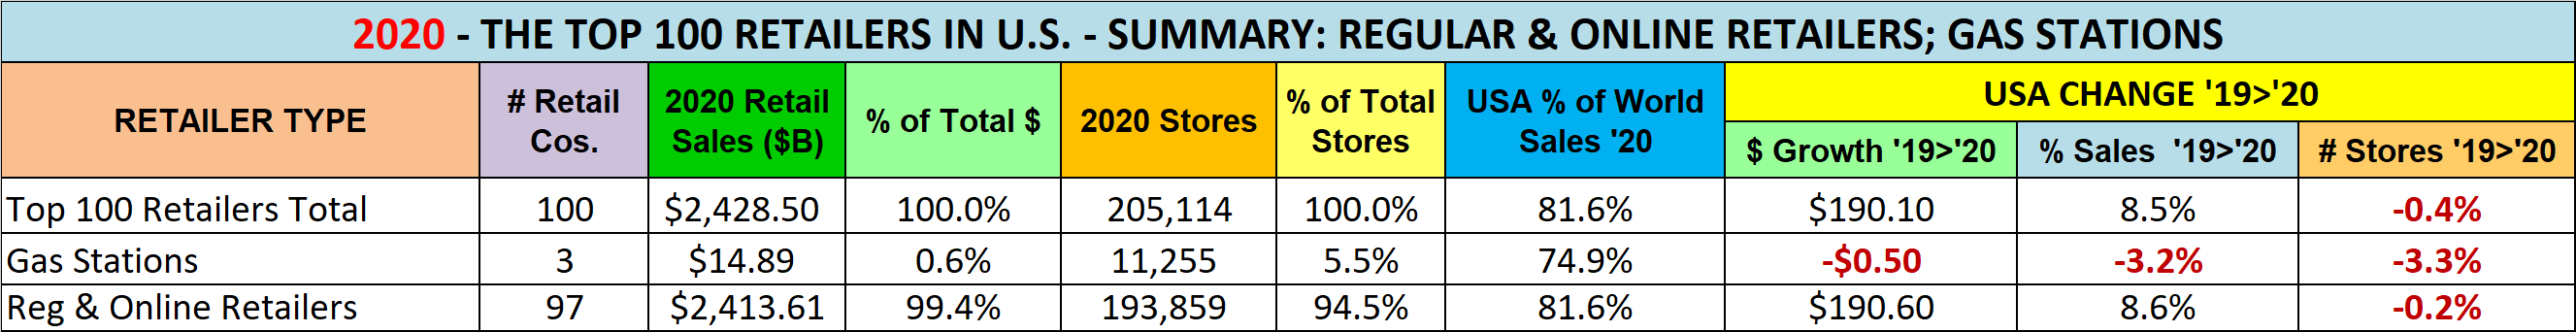
For Gas Stations, you can see that their share of stores (5.5%) is significantly higher than their share of sales (0.6%). The impact of the pandemic on Gas Stations is very apparent as even these 3 biggest chains lost ground in $ and stores.

The impact on regular retailers was more complex. Their sales were up $191B (8.6%) while store count fell -0.2%.

  • 71 Retailers gained +$244.7B (+12.5%) in sales and +0.8%in stores.
  • 26 Retailers lost -$54.1B (-20.4%) in sales and -4.7% in stores.

Now that we have an overview of the Top 100, let’s take a look at the “targeted” retailer segment. There are 97 total companies. How many are buying and selling Pet Products? This will reinforce how Pets have become an integral part of the American Household and how fierce that the competition for the Pet Parents’ $ has become.

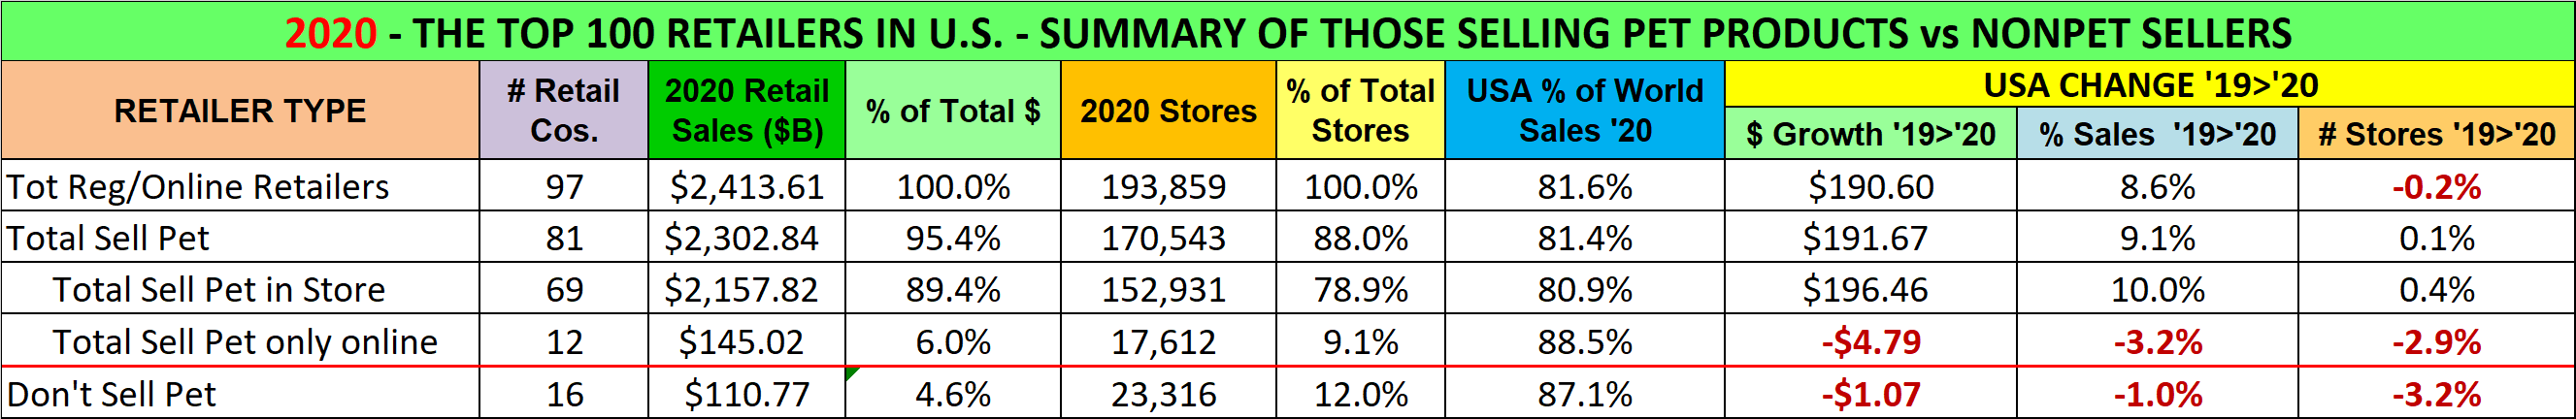
  • Of 97 companies, 81 are selling some Pet Products in stores and/or online – up from 69 in the 2019 list w/restaurants
    • Their Total Retail Sales of all products is $2.30 Trillion which is…
      • 95.4% of the total business for Regular & Online Retailers in the Top 100
      • 37.0% of the Total Retail market and 57.3% of Relevant Retail – from 81 Companies who sell Pet Products.
    • 69 Cos., with $2.16T sales sell pet products off the retail shelf in 152,931 stores – 600 more than they had in 2019.
      • As you can see by the growth in both sales and store count, “in store” is still the best way to sell pet.
    • Online only is another story and the story gets complicated.
      • Amazon includes Whole Foods, which has stores so the Amazon $ are in the “Pet in Store” numbers.
      • Retailers who only sell pet online are losing market share and closing stores. However, internet only retailers, like Wayfair are showing strong growth.
    • Obviously, not selling pet products is not the best way to go as this group was down in sales and especially in stores.

Pet products are an integral part of the strongest retailers and are widespread across the entire U.S. marketplace. Of the Top 100, 152,900 stores carry at least some pet items at retail. There are thousands of additional “pet” outlets including 15,000 Grocery Stores, 9,000 Pet Stores, 16,000 Vet Clinics, 5,000 Pet Services businesses and more. Pet Products are on the shelf in over 200,000 U.S. brick ‘n mortar stores… plus the internet.

Before we analyze the whole list in greater detail let’s take a quick look at the Top 10 retailers in the U.S.

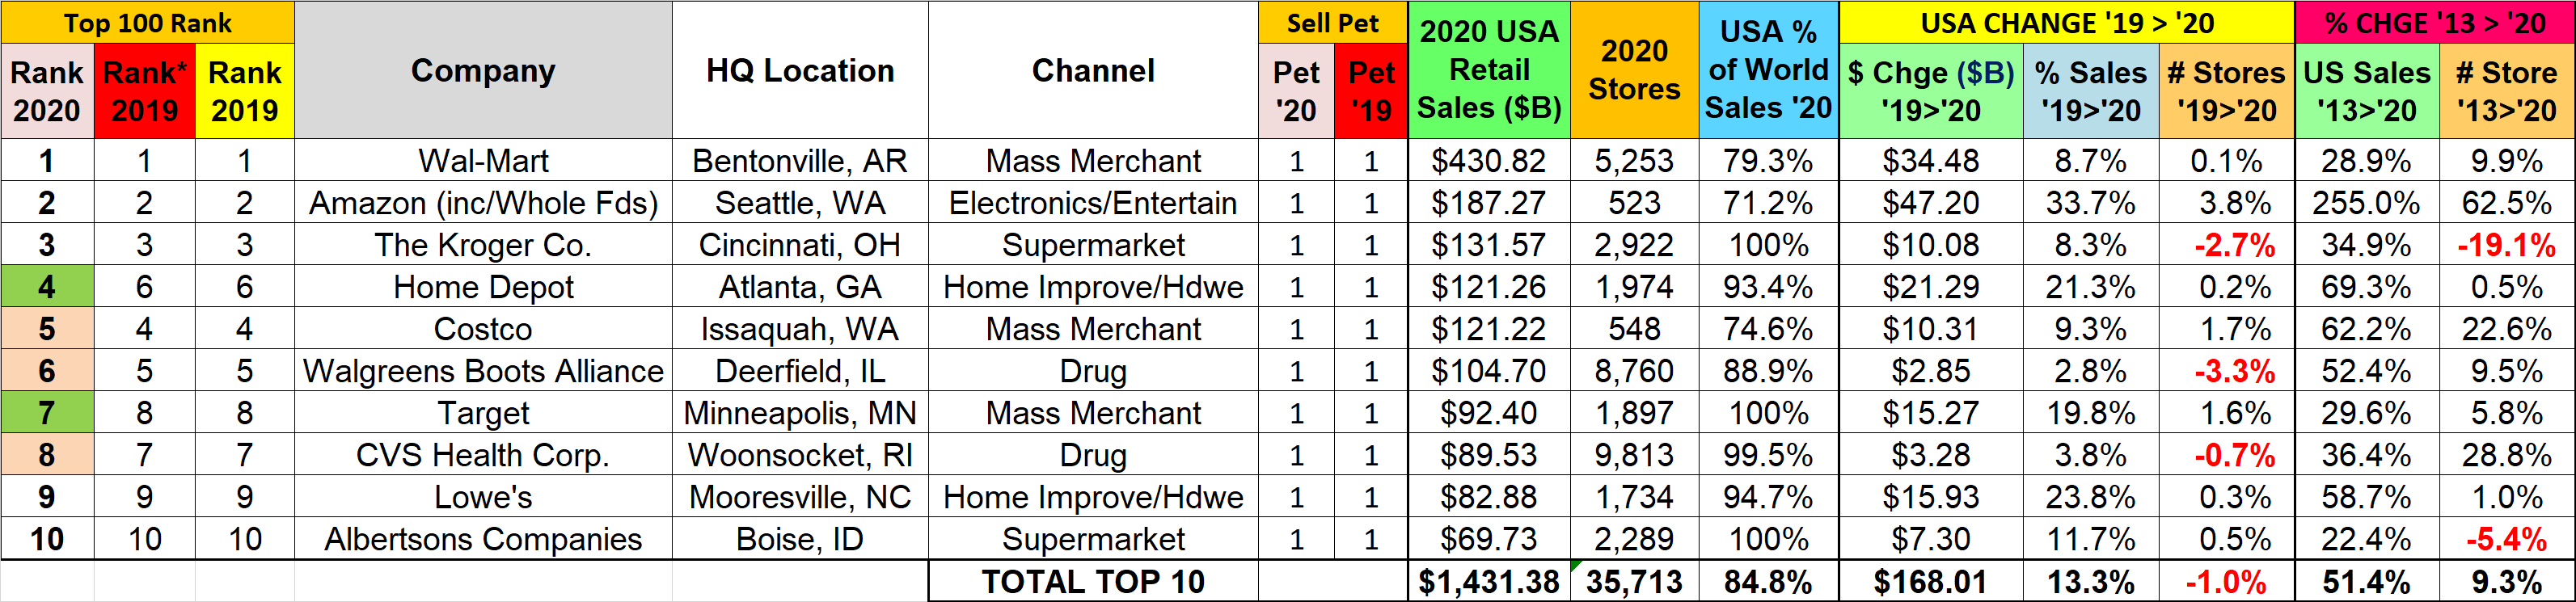
  • They did $1.43 Trillion in Sales
    • 58.9% of Top 100 $ales
    • 23.0% of Total U.S. Retail $
  • 2 up, 3 down in rank; (Group is unchanged since 2015)
  • Sales are up for all. Amazon leads the way…again.
  • Store count is down 360, (-1.0%)

In the next section we will look at the detailed list of the top 100. We’ll sort it by retail channel with subtotals in key columns. We’ll then break it into smaller sections for comments.

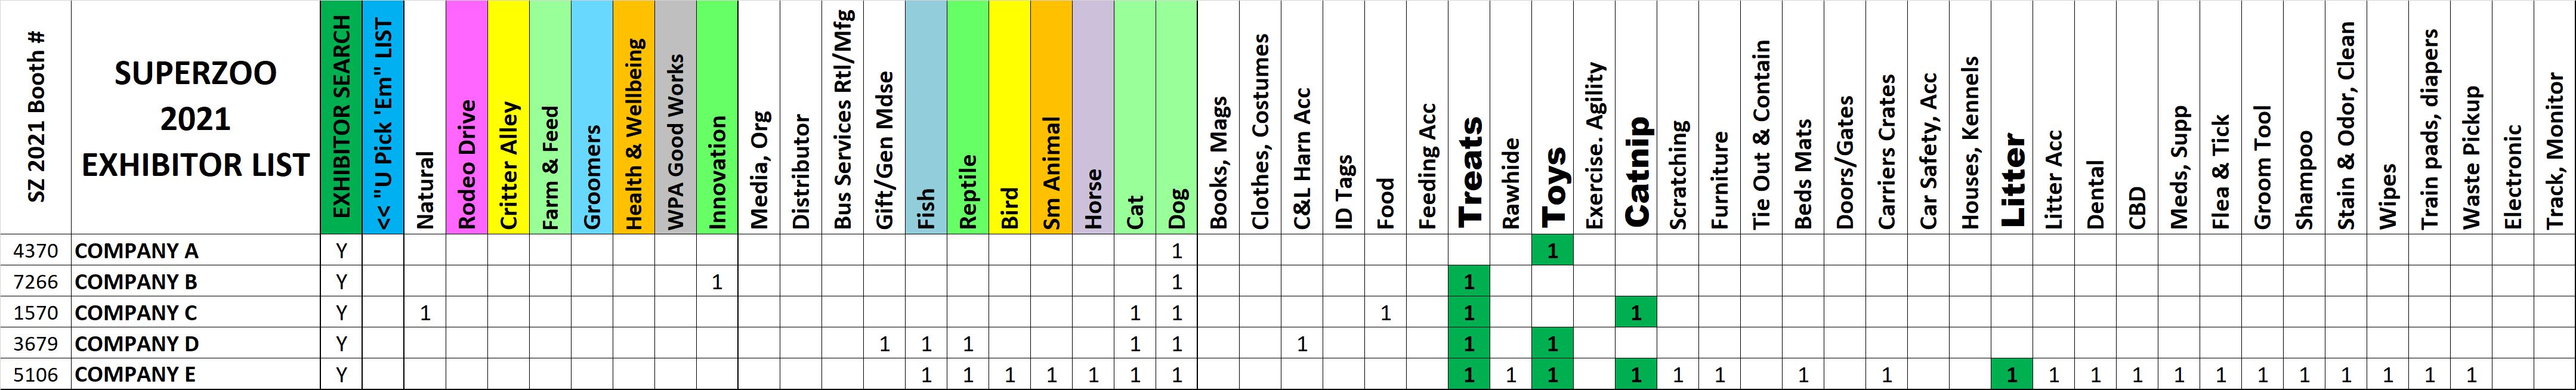
I have not done a lot of highlighting however:

  • Pet Columns ’20 & ‘19 – a “1” with an orange highlight indicates that products are only sold online
  • Rank Columns – “Red” 2019 column is my revised 2019 list w/o restaurants. “Yellow” 2019 is the original 2019 rank with restaurants. 2020 changes in rank from the “Red” 2019 list are highlighted as follows:
    • Up 4-5 spots = Lt Blue; Up 6 or more = Green
    • Down 4-5 Spots = Yellow; Down 6 or more = Pink

Let’s get started. Remember online sales are included in the sales of all companies
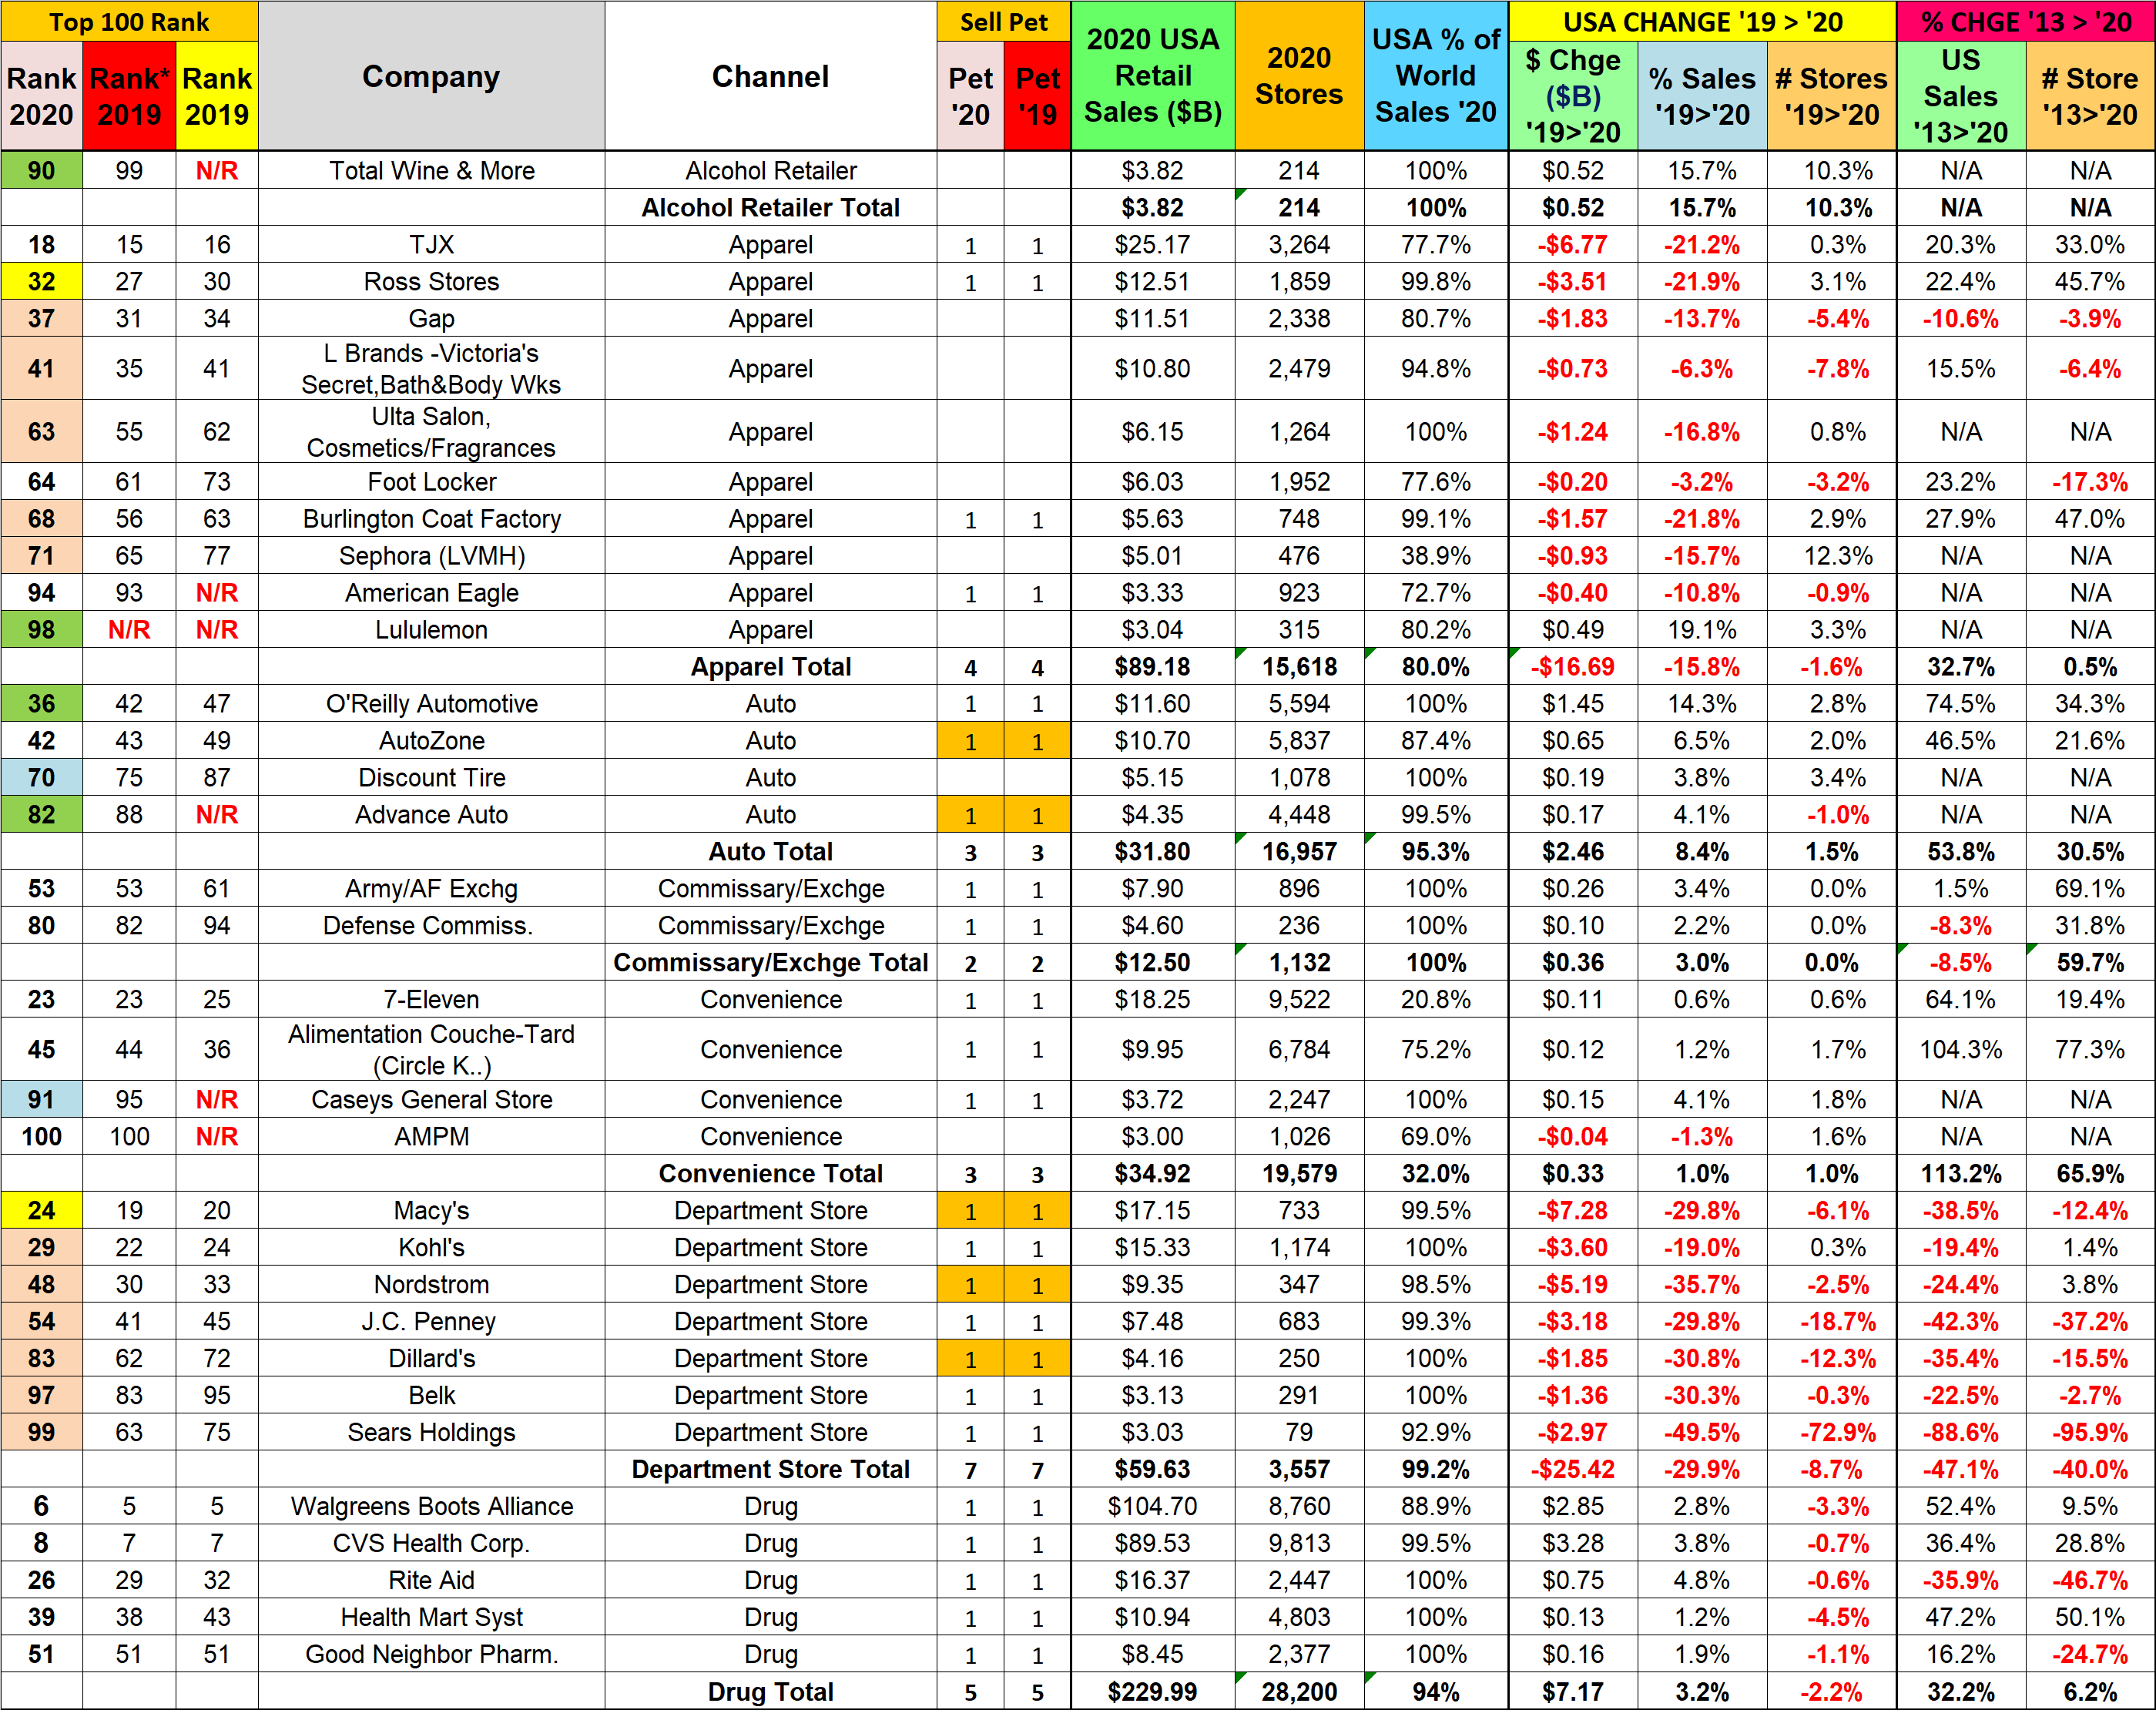
Observations

  • After a number of acquisitions over several years, Drug is still in turmoil. Now we are seeing a growing number of closures of unproductive stores. However, sales are still growing. They are still “essential” outlets.
  • The decline of the Traditional Department store segment was accelerated by the pandemic. Sales were down -29.9% and stores -8.7%. Although all carry a few pet items, often online, this channel has never fully embraced Pet Products.
    • Sears demise is just getting closer.
    • Saks sold Lord & Taylor in November 2019 and fell off the list as did Neiman Marcus.
  • Much of the growth in the Convenience Store Chains in the Top 100 in recent years has come through acquisitions. There were no major acquisitions, but 2 chains were added to the revised list. Overall, $ and stores are +1.0%.
  • Military Exchanges/Commissaries have added locations in recent years, which fueled the growth in sales. In 2017 they began reducing the number of Army/AF Exchanges. By 2019 this policy had spread to all military groups. In 2020 the number of stores stabilized but sales were up for all outlets and 3.0% overall.
  • Alcoholic Beverage stores make their first appearance in the Top 100 – probably due to more at home dining.
  • Auto Parts Stores accelerated their $ growth from 5.5% to 8.4% and added a new chain, Advance Auto. All chains but Advance also increased their stores for a net gain of 250 (+1.5%)
  • In Apparel, Ascena dropped out, but Lululemon and American Eagle were added. These stores were nonessential, so sales and rank fell for virtually all and $ were -15.8% for the channel. Store count was mixed but down -1.6% overall.
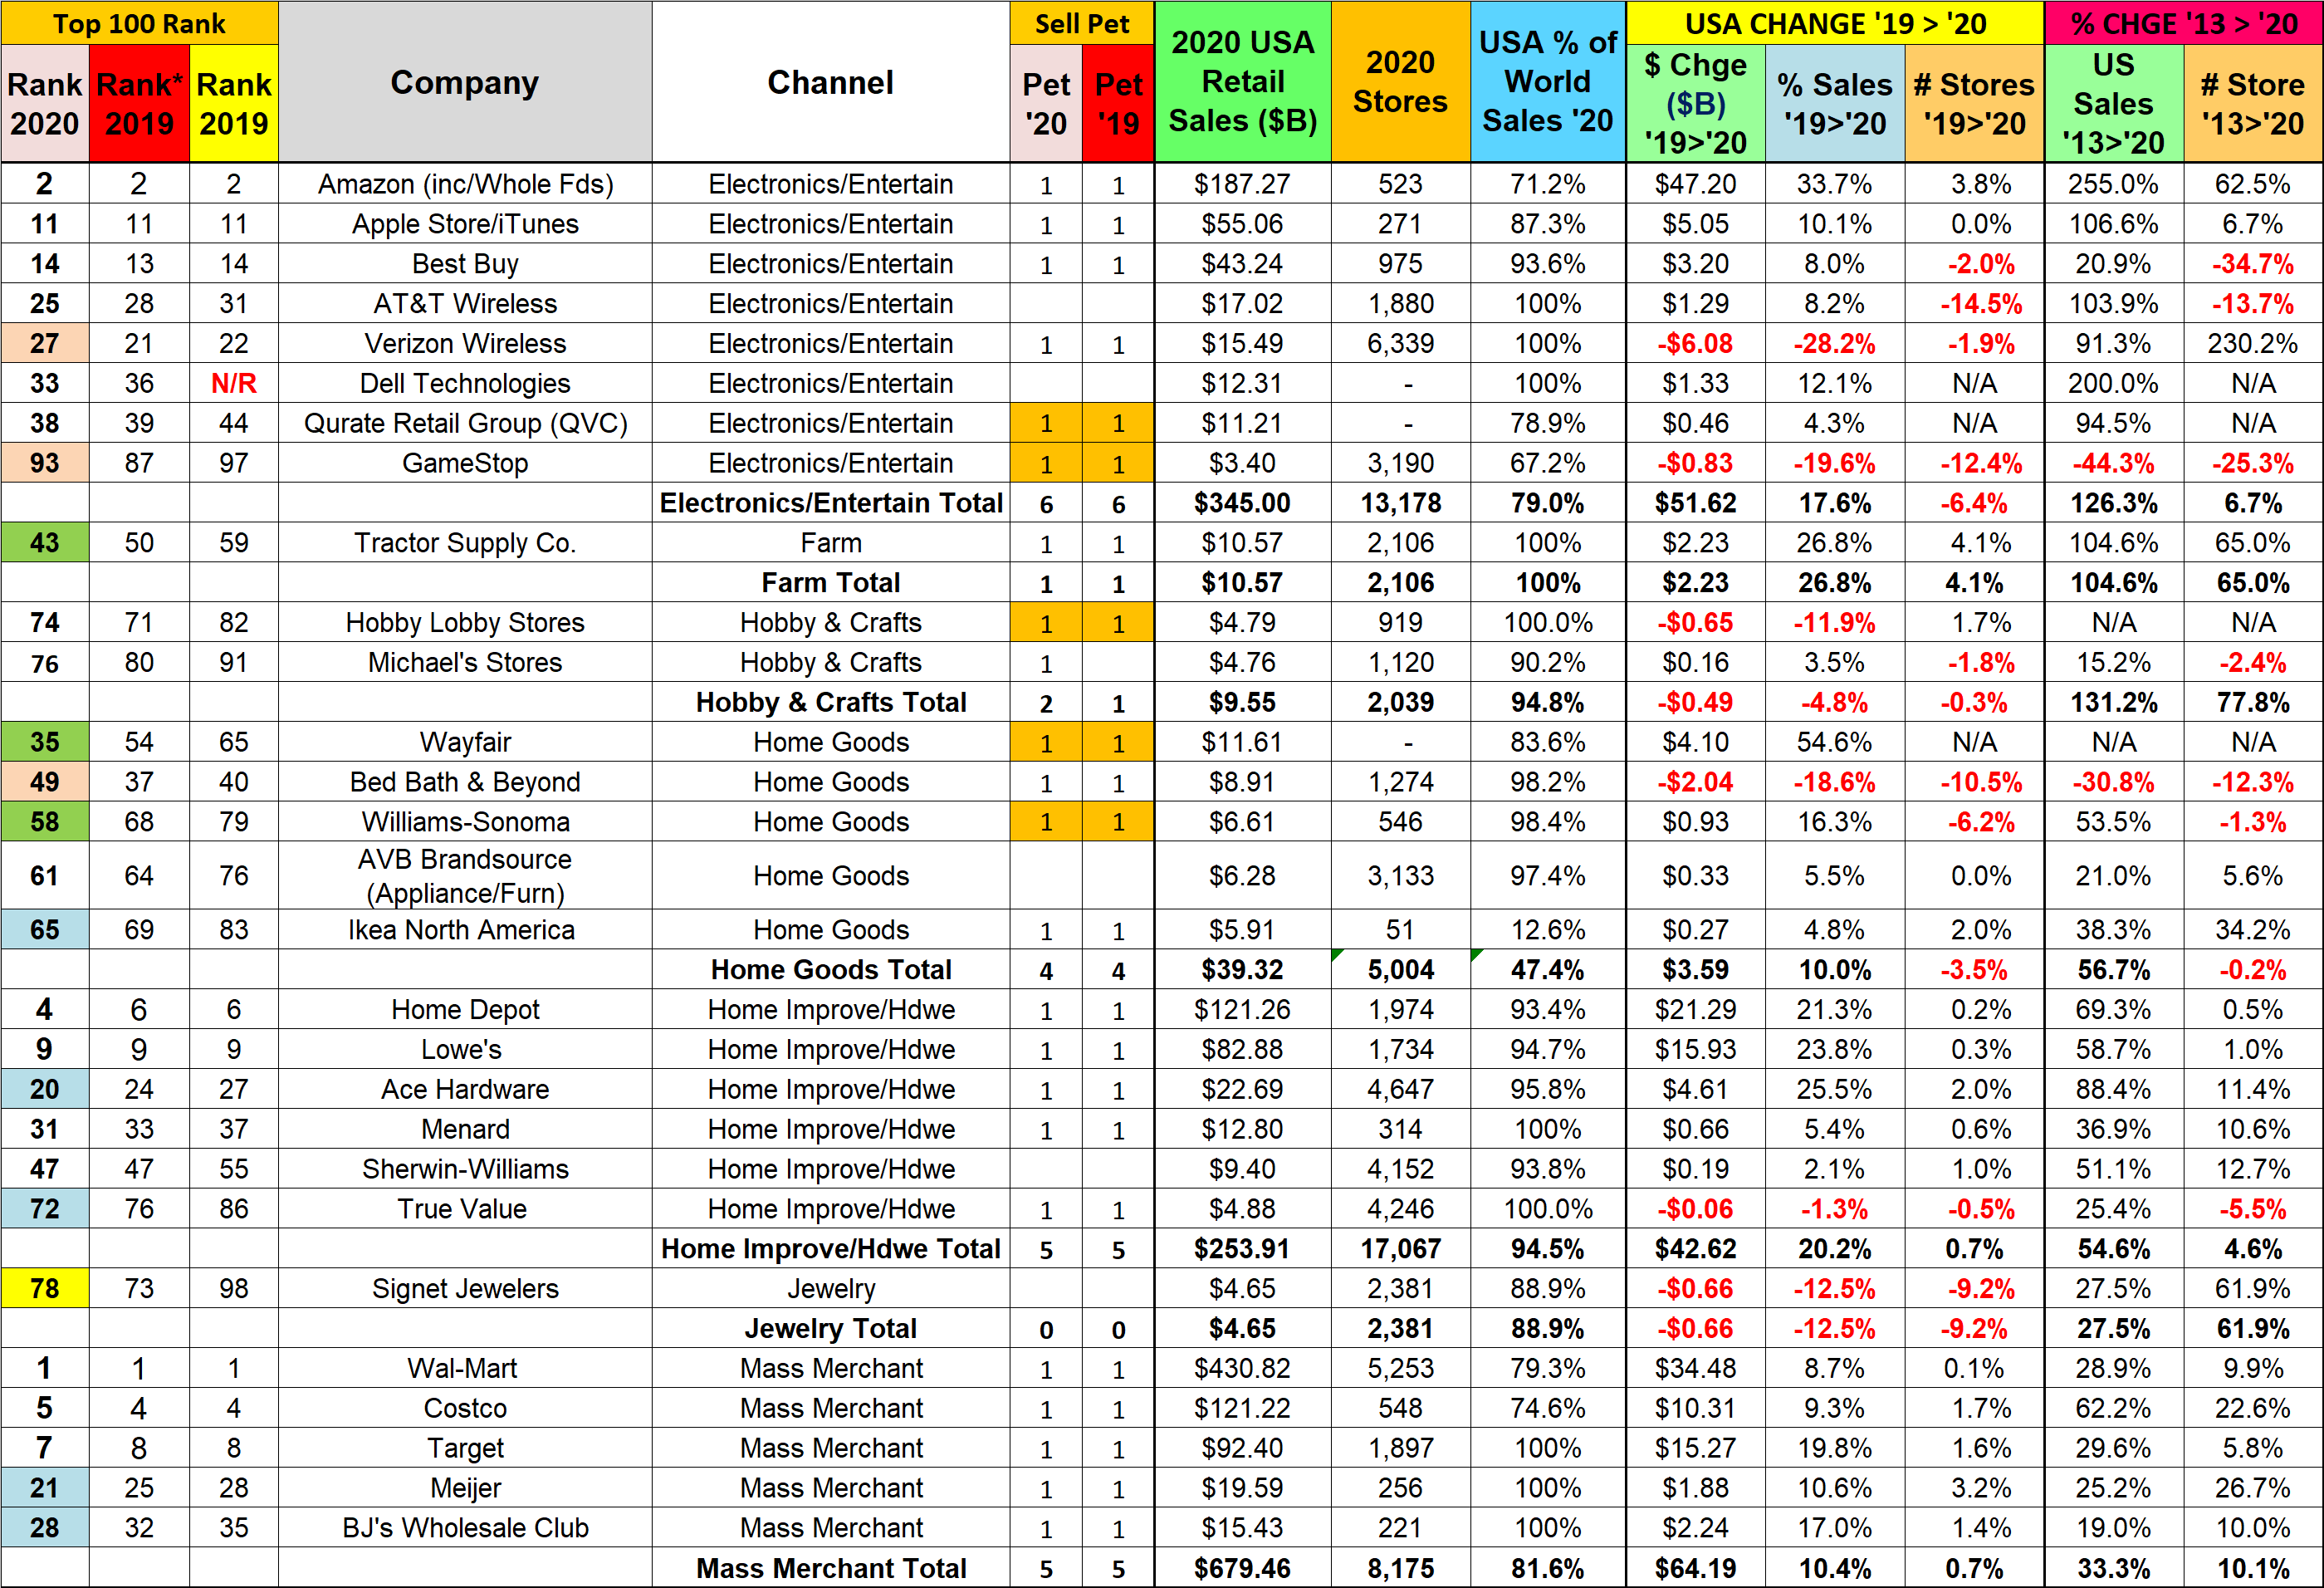
Observations

  • Electronics/Entertainment was up 17.6% in sales but down -6.4% in stores which reflects the pandemic influence.
    • Amazon growth accelerated in the pandemic from 20.9% in 2019 to 33.7%. With the acquisition of Whole Foods in 2017 they also have a small but growing brick ‘n mortar presence in the market.
    • Only Verizon and Gamestop declined in $ and lost significant rank. Dell Technologies was added to the group.
  • Signet Jewelry’s sales were down -12.5%. Their decline began in 2017 but was radically increased by COVID.
  • Mass Merchants have 3 of the 7 largest volume retailers in America – Wal-Mart, Costco and Target. In recent years, Wal-mart & Costco have driven the growth in this channel. In 2020, the lift was strong across the board, +10.4%.
    • Wal-Mart had a 8.7% increase in sales which is triple last year’s 2.6%. Their SuperCenter business was essential, so store sales increased, and their online sales took off. However, “regular” Discount Department Stores are losing market share. This impacts both Wal-Mart and Target so many outlets are adding more fresh groceries.
    • Target posted a 4th consecutive sales increase in 2020, +19.8%, the largest in the string and for the entire group.
    • Costco had another +9.3% increase. New store growth slowed but the $ are increasing, both in store and online.
    • BJ’s sales were up +17.0%, the 3rd consecutive increase after a string of annual declines from 2013 to 2017.
    • Meijer had +10.6% growth in sales and increased their store count by 3.2% in 2020.
  • Consumers’ thoughts turned to their homes in the pandemic. This was very apparent as Home Improvement & Hardware companies increased sales by +20.2%. The big guys, Lowe’s, Home Depot & Ace led the way but only True Value had decreased sales or store count.
  • Like 2018 & 2019, all Home Goods Companies but Bed Bath & Beyond increased sales. They also drove down store count. Sales were up 10.1%, but it was again driven by Wayfair, +$4.1B (+54.6%) who now ranks #35, up 19 from 2019.
  • Tractor Supply $ skyrocketed, +26.8%, triple their average rate of +8.3% since 2013. They also increased stores +4.1%.
  • Hobby & Crafts stores $ were down -4.8%, due to Hobby Lobby and down -0.3% in stores due to Michael’s.
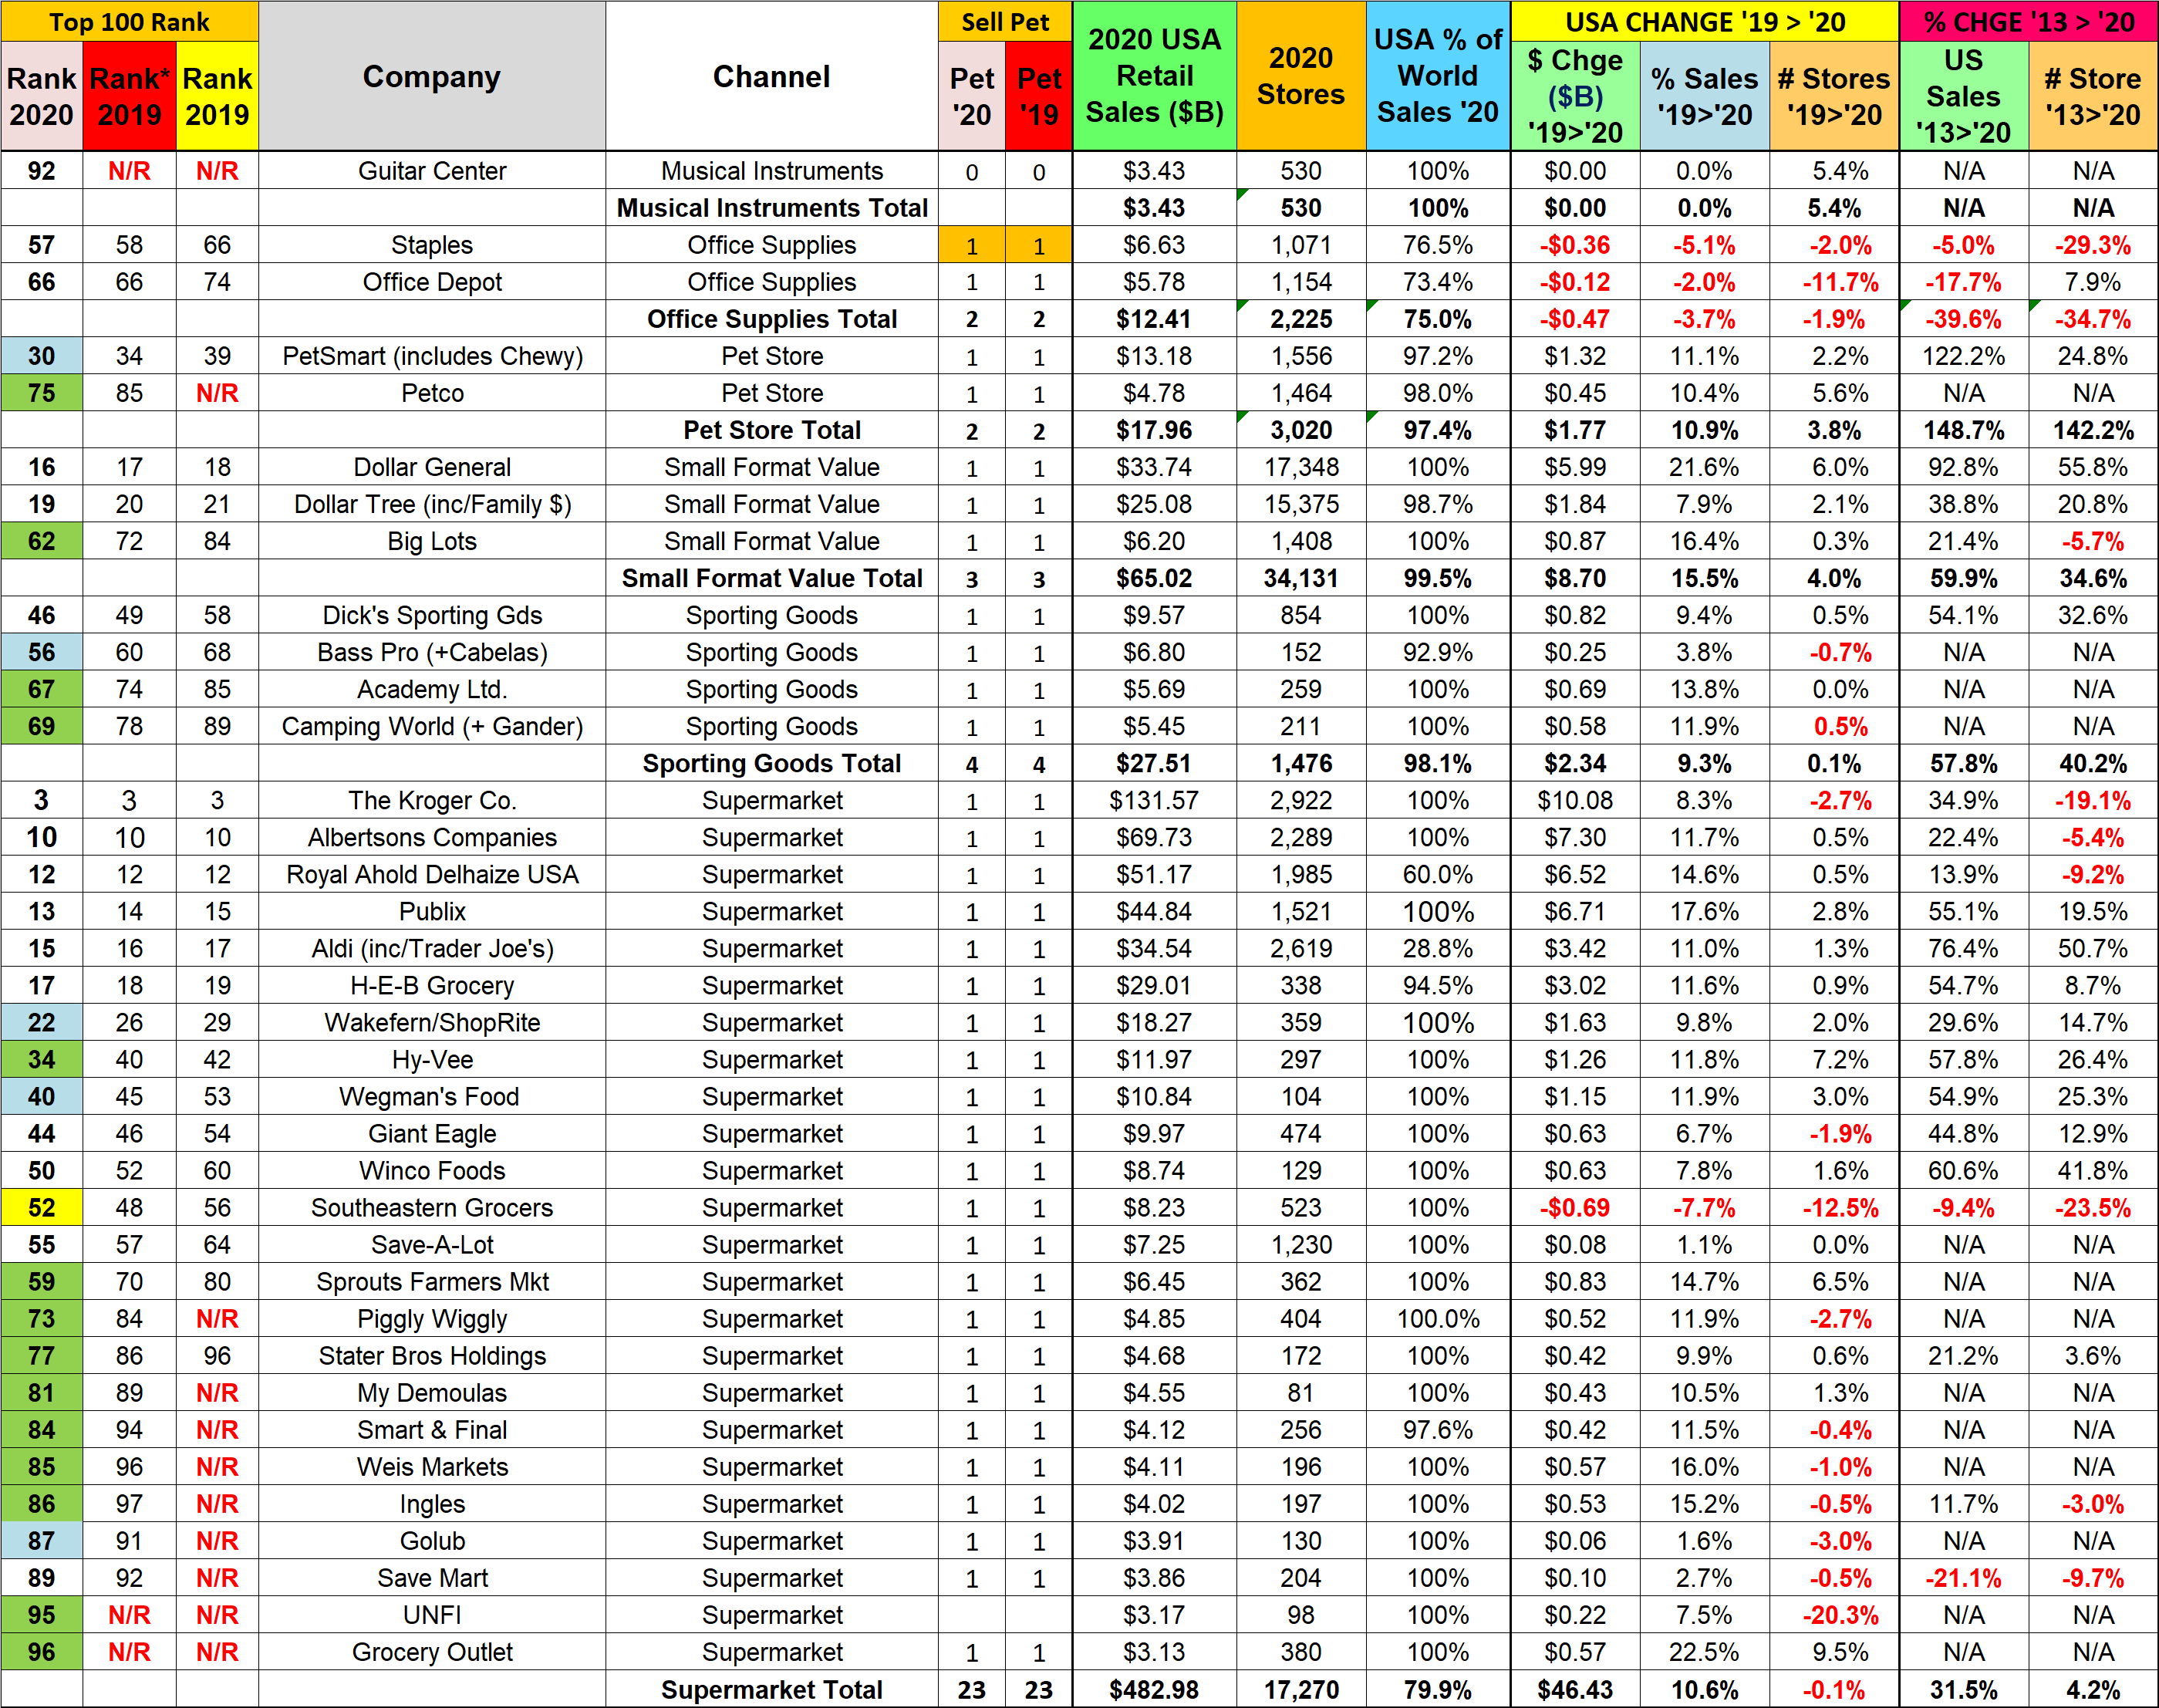
Observations

  • Supermarkets – $483B in Sales; 24 Companies; With 23 Selling Pet Products in 17,000 stores. This is a very important group for the Pet Industry. With the highest frequency of consumer visits of any channel, the competition is fierce. The mergers and acquisitions have slowed. All companies but Southeastern showed increased sales, most in double digit %. Southeastern Grocers filed for bankruptcy in 2018. Store closures and reduced sales continue.
    • Overall sales were up $46.4B (+10.6%) while store count fell slightly, -0.1%
  • Small Format Value Stores: These stores offer both value and convenience – great consumer appeal in a pandemic.
    • All companies increased sales and store count. Overall $ales were up $8.7B (+15.5%) and stores were +4.0%.
    • Dollar General continues to lead the way in growth, Sales +21.6%, Stores +6.0%.
    • Dollar Tree growth in sales and stores more than doubled 2019 but still lags behind Dollar General.
    • Big Lots had small growth in stores but a 16.4% increase in sales, for 2 consecutive years of increases.
  • Pet Stores, as essential retailers showed strong growth in 2020. Sales were up $1.8B (+10.8%) and the number of stores grew by 3.8
    • After the acquisition of Chewy in 2017, PetSmart’s sales registered a huge increase. In 2020 Chewy undoubtedly produced a substantial amount of the $ growth as consumers increased online shopping.
    • Petco qualified for the Top 100 for the first time in 2016. They hung on in 2017 but didn’t make the cut in 2018 & 2019. In the 2020 restaurant free list and with a pandemic surge in sales, they came back strong at #75. It is also important to note that they had a 5.6% increase in stores.
  • Office Supply Stores – This channel continues its decline as Consumers accelerated their move to online ordering.
  • Sporting Goods – This group also benefited in the pandemic as consumers turned their attention to personal recreation. 2 companies closed a few stores and 1 had no change but all increased sales with overall growth of $2.3B (+9.3%). By the way, the largest company, Dick’s Sporting Goods opened enough stores to push the group to +0.1%.

Gas Stations and the Totals

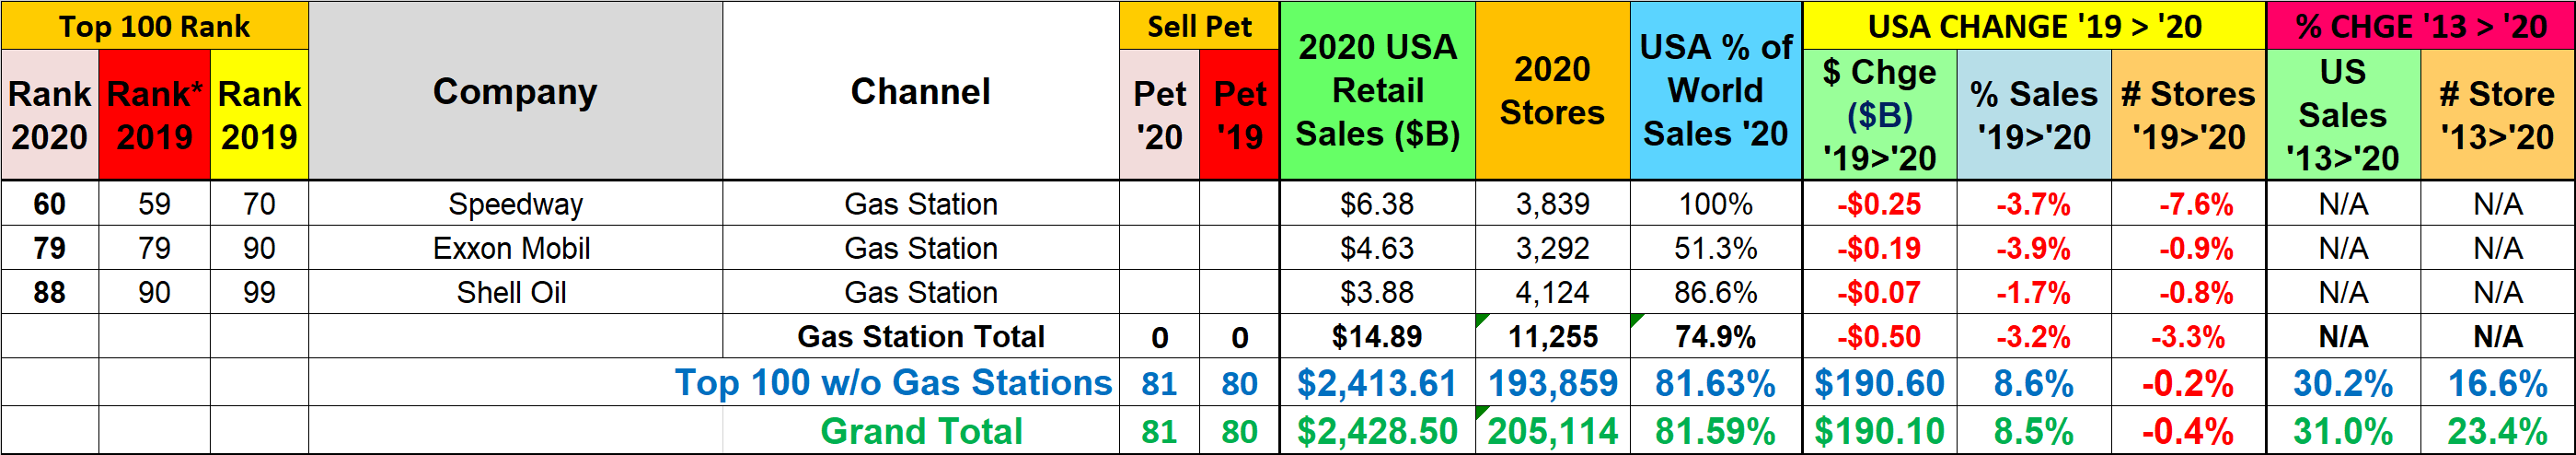
Gas Station Observations

Although gas stations aren’t relevant in terms of Pet Products Sales, they are relevant in our daily lives.

  • Falling gas prices in 2019 flattened the revenue growth of the total Gas Station Channel. The Top 100 Gas Station sales and stores were both up that year only because Speedway acquired Andeavor Brands with their 3200+ outlets.
  • 2020 brought the pandemic and gas usage plummeted. The big chains outperformed the overall channel, but all closed some outlets and had decreased sales.
  • In 2021 recovery began, prices inflated and 7 Eleven bought Speedway. We’ll see the impact on the Top 100 in 2021.

Wrapping it up!

The Top 100 became the Top 100 by producing big sales numbers and their performance, except for 2018, has usually exceeded the overall market. In 2019 things returned to “normal”, +4.5% for the Top 100 vs +3.6% for Total Retail. Normal went away in 2020 with the onset of the pandemic. Restaurants and Gas Stations were hit hard by closures and consumers’ stay at home attitude. The impact on regular retailers varied widely. Essential outlets like Grocery, Supercenters/Clubs and $ Stores prospered. Retail channels like Hardware, Farm and Sporting Goods stores also benefited as consumers focused their attention on “home”. Of course, sales from internet retailers exploded and we can’t forget Pet Stores. Consumers spent more time with their pets and adopted more. This drove up product sales. The non-essential stores were a different story entirely. Department Stores, Office Supply, Apparel and Jewelry stores were hit hard. All but Apparel had been trending down for years, but the pandemic accelerated their slide.

The pandemic also caused a change in methodology for choosing the Top 100 as restaurants are now excluded from the list. Using available data, I took it upon myself to generate a revised “restaurant free” 2019 Top 100 to allow more valid comparisons between the two. This “relevant retail” Top 100 grew $191B (+8.6%) in 2020 and has been a major factor in the ongoing recovery of the U.S. Retail Marketplace.

Pet Products are an important part of the success of the Top 100. 81 companies on the list sell Pet Products in 152,931 stores and/or online. Let’s look closer at the 69 companies that stock pet products in their stores. This group generated $2.16T in total sales. How much was from pet? Let’s “Do the math”. If we take out the $18B done by PetSmart & Petco, and the remaining companies generated only 1.7% of their sales from Pet, we’re looking at $36.4B in Pet Products sales from only 67 “non-pet” sources! (Note: The 1.7% share for Pet is a low-end estimate based on data from the Economic Census.) The APPA reported $64B in Pet Products sales for 2020. That means 67 mass market retailers accounted for 56.8% of all the Pet Products sold in the U.S. in 2020. Add back Petco & PetSmart/Chewy and the Top 100 did 81.8%.

Pet Products are widespread in the retail marketplace but the $ are concentrated. Regardless of your position in the Pet Industry, monitoring the Top 100 group is important. This group reflects the triumphs, tribulations and ongoing evolution in the retail market – the growing influence of the internet and the importance of Value. The COVID-19 crisis caused turmoil in 2020. 2021 has started strong. We’ll see what changes it brings to the retail market and the Top 100.

Retail Channel Monthly $ Update – June Final & July Advance

In May 2020, the Retail market began its recovery after hitting bottom in April. The road back has been long and complex and Consumer spending behavior continues to evolve. Now, the virus is resurging so we will continue to track the impact on the recovery of the retail marketplace with data from two reports provided by the U.S. Census Bureau.

The Reports are the Monthly Retail Sales Report and the Advance Retail Sales Report. Both are derived from sales data gathered from retailers across the U.S. and are published monthly at the same time. The Advance Report has a smaller sample size so it can be published quickly – about 2 weeks after month end. The Monthly Final Report includes data from all respondents, so it takes longer to compile the data – about 6 weeks. Although the sample size for the Advance report is smaller, the results over the years have proven it to be statistically accurate with the final monthly reports. The biggest difference is that the full sample in the Final report allows us to “drill” a little deeper into the retail channels.

We will begin with the Final Retail Report for June and then move to the Advance Retail Report for July. Remember, the retail impact of the pandemic began in March 2020, peaked in April, then recovery started in May. We will compare 2021 to both 2020 and 2019 to document the progress that the retail market has made towards a full recovery.

Both reports include the following:

  • Total Retail, Restaurants, Auto, Gas Stations and Relevant Retail (removing Restaurants, Auto and Gas)
  • Individual Channel Data – This will be more detailed in the “Final” reports and we fill focus on Pet Relevant Channels

The information will be presented in detailed charts to facilitate visual comparison between groups/channels of:

  • Current Month change – % & $ vs previous month
  • Current Month change – % & $ vs same month in 2020 and 2019
  • Current YTD change – % & $ vs 2020 and 2019
  • Monthly and Year To Date $ will also be shown for each group/channel

First, the June Final. Retail hit bottom in April 2020 but began recovery, hitting record $ in December. $ fell in January & February but they took off in March, setting a new all time $ record. In April $ fell but they rebounded in May to another record high. Now, in June another $ dip. Here are the major retail groups. (All Data is Actual, Not Seasonally Adjusted)

The final total is $3.5B more than the Advance report projected a month ago. All groups but Auto were up slightly. The specifics were: Relevant Retail: +$2.3B; Gas Stations: $1.4B; Restaurants: +$0.1B; Auto: -$0.3B. Sales vs May were down in all but Gas Stations and Total Retail $ were the 2nd highest month of all time. Total $ales broke $600B for the 1st time in December and has now done it 5 times. Auto still has the strongest recovery and is in fact prospering – annual YTD growth rate since 2019 is +13.1%. Except for the spending dips vs May, for the first time since the recovery began, all groups, including Restaurants, were positive in all other measurements.

Now, let’s see how some Key Pet Relevant channels were doing in June.

  • Overall– 6 of 11 channels were down vs May but all were up vs May 2020 and 10 vs May 2019. In YTD $, 10 were up vs 2020 and 10 vs 2019. 9 were up vs both. June was the 5th biggest month in history for Relevant Retail.
  • Building Material Stores – Their amazing lift continues. The ongoing surge came as a result of pandemic spending patterns developed in 2020. Consumers began focusing on their homes. Their Spring lift has slowed but Building and Farm stores are still going strong. Sporting Goods stores have a similar spending pattern. Sales took off in May 2020, hit a record peak in December and continued strong into 2021, peaking in March. April & May $ fell slightly but rebounded in June. YTD they are +51% vs 2019. That’s an Annual Growth Rate of 22.9%!
  • Food & Drug – Supermarkets were +$77.7B in 2020. $ are down vs May but YTD are on par with the 2020 binge. They are still up 15% vs June 2019 and 14% vs YTD 2019. Drug Stores were +$17B (+5.7%) for 2020. Their $ rose in June after monthly declines from a record March. Now all measurements are positive and YTD $ are +7.4%.
  • General Merchandise Stores – $ in all channels fell in Jan & Feb then spiked in March. In April, sales in all but $ stores declined but they bounced back in May. In June, sales dipped for all but they are going strong. $ Stores and Clubs/SuperCtrs are leading the way with a combined annual growth rate of +8.4%. These channels promote value. Their success vs both 2020 and 2019 reinforces its importance in Consumer spending decisions.
  • Office, Gift & Souvenir Stores– $ increased slightly from May and were +41.6% vs June 2020. The pandemic hit them hard. They are still down vs 2019 – monthly and YTD. Recovery is a long way off, but things are improving.
  • Internet/Mail Order – Their $ increased slightly in June as the pandemic continues to foster this channel’s growth. In June of 2019, their YTD growth was +13.3%. Now, their avg growth rate is +20.6% – a 54.6% increase.
  • A/O Miscellaneous – This is a group of small to midsized specialty retailers – chains and independents. It includes Florists, Art Stores and Pet Stores (22>24% of total $). Pet Stores were usually essential, but most stores were not. In May 2020 they began their recovery. Their 2020 total sales were up +11.6%. Their June $ were up slightly from May and another all-time record. YTD sales are +30.5% vs 2020 and +39.3% vs 2019. Very strong!

Relevant Retail began recovery in May and reached a record level in December. $ fell in Jan & Feb, turned up again in March and began a monthly up/down rollercoaster. June $ are down but virtually all channels are showing growth. The key drivers are the Internet, SuperCtrs/Clubs/$ Stores and Hdwe/Farm. Now, here are the Advance numbers for July.

2020 was a memorable year for both its traumas and triumphs. In April & May we experienced the 2 biggest retail spending drops in history, but the problems actually began in March. Retail sales began to recover in June and in October, YTD Total Retail turned positive for the 1st time since February. In December, Total Retail broke the $600B barrier – a historic first. Sales fell from their December peak in both January and February but still set monthly sales records. Then they took off again in March, setting a new monthly sales record of $633B. April sales were down slightly but they took off again in May to set yet another spending record, $641.5B. June $ fell but the rollercoaster ride continued as July $ bounced back to become the 2nd biggest $ month in history. Auto and Relevant Retail, the leaders of the recovery, were down from June but all the major groups were positive in all other measurements for the second straight month. Some other areas of the economy are still suffering, some spending behavior has changed, and inflation has become a factor in some increases. However, consumers continue to spend “big bucks” and the overall Retail marketplace has strongly recovered.

Total Retail – In March, Total Retail hit $633.1B, a record for the most spending in any month in any year. In April, $ales dipped to $625.5B but were still $218.3B more than April 2020 – a record increase that was more than double the size of last year’s record drop. In May, sales set another new record, $641.5B. In June sales dipped slightly but rebounded in July to $637.0B, the 2nd biggest month in history. Moreover, the current YTD average annual sales growth rate since 2019 is 9.2%, the highest ever in records going back to 1992. Total Retail has not just recovered. It is stronger than ever.

Restaurants – This group has no negative measurements vs 2020 or 2019 for 2 straight months. Last February YTD sales were up 8.1% vs 2019. The Pandemic changed that. Restaurants started to close or cease in person dining in March and sales fell -$33.3B (-52.5%) compared to March 2019. Sales bottomed out in April at $30.1, the lowest April sales since 2003. Sales started to slowly increase in May but never reached a level higher than 88% compared to the previous year. 2021 started off slowly. Through February, YTD sales were down -16.7% from pre-pandemic 2020 and -10.0% from 2019. In March sales took off and grew steadily in April and May. Sales dipped slightly in June but were still strong vs 2019 & 2020. In July the $ turned up. YTD their $ are plus 30.5% vs 2020 and +2.4% vs 2019. Their recovery is getting stronger.

Auto (Motor Vehicle & Parts Dealers)   – Staying home causes your car to be less of a focus in your life. Sales began to fall in March and hit bottom in April. Auto Dealers began combating this “stay at home” attitude with fantastic deals and a lot of advertising. It worked. They finished 2020 up 1% vs 2019 and have returned to a strong positive pattern in 2021. The “attitude” grew amazingly positive in March and slowed only slightly in April>July as sales exceeded $134B in all 5 months, by far the 5 biggest months in history. To show how well consumers responded to their campaign you just need to look at the data. This group has exceeded $110B in monthly sales only 13 times in history. 11 of those occurred after the onset of the pandemic.  YTD Avg Annual Growth Since 2019 = +12.8% – the best performance of any big group.

Gas Stations – Gas Station $ales have been a mixed bag. If you drive less, you visit the gas station less often. Sales turned down in March 2020 and reached their low point in April. They moved up but generally stayed about 15% below 2019 levels for the rest of 2020. In February they were still behind 2020 in monthly and YTD $ but ahead of 2019 in both measurements. In March, sales skyrocketed and continued to grow in April > July to a record $53.7B, 38.1% above July 2020. They have been positive in all measurements vs both 2019 and 2020 since March. Their comeback continues but there is another factor that must be considered – inflation. Gas prices can be pretty volatile. They dipped in the first 2 months of the pandemic but then returned to more normal levels for the balance of 2020. They began strongly inflating in 2021. In fact, the July 2021 prices were 41.8% above July 2020. That means that the 38.1% year over year $ lift in July was actually a decrease in the amount of gas sold. YTD Annual Avg Growth Rate Since 2019 = +4.2%

Relevant Retail – Less Auto, Gas and Restaurants – This is what we consider the “core” of U.S. retail and has traditionally accounted for about 60% of Total Retail Spending. When you look at the individual channels in this group, you see a variety of results due to many factors – non-essential closures, binge buying, online shopping and a consumer focus on “home”. However, overall, April 2020 was the only month in which spending in this group was down vs 2019. Monthly $ales exceeded $400B for the first time ever in December ($407B). They finished 2020 up $260B, +7.1%. Their performance was the only reason that Total Retail was able to finish 2020 with positive numbers, +0.5%. Sales fell in January and February but set monthly records. In March they turned sharply up and then down in April. They bounced back in May then fell in June. July was down slightly from June, -$1.5B (-0.4%) but was still the biggest July ever and the 6th largest month on record. We should also note that that while December 2020 is still #1, March > July are five of the seven highest $ months of all time. The Relevant Retail Market has exceeded $366B in monthly sales 7 tImes in history. 6 of those have occurred since the onset of the pandemic. It is also very important that the Relevant Retail group has posted positive numbers versus last year and YTD for every month since April 2020 and their average YTD growth rate since 2019 now stands at +10.3%. Through July all but Department Stores continue to be positive in all measurements vs both 2020 and 2019. However, the primary drivers throughout the pandemic were and continue to be Nonstore, Grocery, SuperCenters/Clubs/$ Stores plus never ending “spring lift” from Hardware/Farm and Sporting Goods.

Now let’s look at what is happening in the individual retail channels to see where the $ are coming from. July $ were down slightly from June and none of the increases were “off the charts”. However, it was still the 6th largest month in history for Relevant Retail outlets. The groups are less defined than in the Final Monthly reports and we will look across the whole market, not just pet relevant outlets.

Sales in only 4 of 13 channels were down vs June but all were up vs July 2020, vs July 2019 and YTD vs 2020. Only 1 was down YTD vs 2019 and they were only -0.1%. (Relevant Retail YTD Avg Annual Growth Rate since 2019 = +10.3%)

After hitting bottom in April 2020, Relevant Retail has now beaten the previous year’s $ for 15 consecutive months. The group set an all-time record of $407B in December and finished 2020 +$260B vs 2019. 2021 started strong, with record sales in every month. March > July were 5 of the 7 biggest of all time. Essential channels are still the primary drivers:

  • Nonstore Retailers – The biggest driver. Online shopping continues to grow in # of households and in $.
  • Food & Beverage – Grocery– Restaurant $ are improving but consumers continue to eat & drink more at home.
  • Bldg Materials/Garden/Farm– Their “Spring” lift continues unabated as consumers focus on their home.
  • SuperCtrs/Club/Value/$ Strs – They keep the GM channel positive. Value is still a major consumer priority.

Regarding the Individual Large Channels (Includes YTD Avg Annual Growth Rate since 2019)

General Merchandise Stores – Sales rose in July and all other numbers are positive. YTD Department Stores $ remain up vs 2020 but are down -0.1% vs 2019. Their problems began before the Pandemic. After dipping to +7.5% in February, the growth rate by Club/SuperCtr/$ stores has remained near the current 8.6%. These stores are still the key to this channel.

  • YTD Avg Annual Growth: All GM = +7.1%; Dept Stores = -0.07%; Club/SuprCtr/$ = +8.6%

Food and Beverage, plus Health & Personal Care Stores – Sales in Grocery were down in March>May from 2020 – No surprise, as these were 2020 binge months. In June/July they beat 2020 $. The Health, Personal Care group finished 2020 at +1.8%. 2021 has started even better. Although July was down -1.0%, YTD they are +10.2% vs 2020 and +9.9% vs 2019.

  • YTD Avg Annual Growth: Grocery = +6.9%; Health/Drug Stores = +4.9%

Clothing and Accessories; Electronic & Appliances; Home Furnishings – March > July have been spectacular for all these channels. The increase in Clothing vs July 2020 was not “off the chart” but was still +45.8%. All of these groups were up vs June and they remained positive in all measurements vs 2020 or 2019 for the 5th consecutive month.

  • YTD Avg Annual Growth: Clothing = +4.8%; Electronic/Appliance = +3.6%; Furniture = +10.2%

Building Material, Farm & Garden & Hardware – Their Spring lift began on time in 2020 and has never stopped. They have greatly benefited from consumers focusing on their home needs. They finished 2020 +53B (+13.8%). Sales took off in March, set a record in April then trended down May > July. They are still +16.4% YTD. Avg Annual Growth = +14.1%

Sporting Goods, Hobby and Book Stores – Book & Hobby stores are open but Sporting Goods stores have driven the lift in this group. Consumers turned their attention to personal recreation and sales in Sporting Goods outlets took off. The group ended 2020 +5.5% vs 2019. The growth accelerated in 2021. January > July set monthly records and March had the most $ of any non-December month in history. July YTD they are +39.0% vs 2020. Avg Annual Growth = +17.5%

All Miscellaneous Stores – Pet Stores were deemed essential but most other stores were not, so closures hit this group particularly hard. Sales hit bottom at -$3.8B in April then began to rebound. They finished with a strong December and ended 2020 -$1.0B, -0.7%. In March sales took off and the channel set a new all-time monthly record of $14.39B in May. However, they beat that record in June with $14.41B and now July with $14.65B. Their YTD sales are now 36.2% above 2020 and 26.0% more than 2019. Their recovery has become very real. YTD Avg Annual Growth = +12.2% (4th Best)

NonStore Retailers – 90% of the volume of this group comes from Internet/Mail Order/TV. The pandemic accelerated the movement to online retail. In February 2020 NonStore $ were +8.6% YTD. In December monthly sales exceeded $100B for the 1st time. They ended 2020 at +21.4%, +$162.9B. This was 63% of the total $ increase for Relevant Retail Channels. Their 2020 performance far exceeded their 12.9% increase in 2019 and every month in 2021 has produced record $. July was -3.7% vs June but still +3.7% vs 2020. Their YTD $ are +16.9%. YTD Avg Annual Growth = +18.0%

Note: Almost without exception, online sales by brick ‘n mortar retailers are recorded with their regular store sales.

Recap – 2020 was quite a year. April & May had the 2 biggest year over year sales decreases in history while December sales broke $600B for the first time. 2021 may become even more memorable. March>July became the 5 biggest $ales months in history with the 5 largest year over year monthly sales increases ever. The total increase was +$701B, which totally dwarfs the -$174B decrease from March>May 2020 which caused so much concern. At yearend 2020, Restaurants, Auto and Gas Stations were still struggling but Auto had largely recovered. Relevant retail had segments that also struggled but overall, they led the way for Total Spending to finish the year +0.5% vs 2019. 2021 has grown even more positive. In June and now July, all major groups, including Restaurants are positive vs both 2020 and 2019. The details show that the recovery in Relevant retail has become real for virtually all channels and monthly sales continue to set records. Retail has recovered so the question is, “Will the resurgence of COVID negatively impact Retail?”

PET STORES – A 30 YEAR HISTORY from 1987 to 2017

Pet Products are sold seemingly everywhere today – 160,000 retail outlets of all kinds – clothing stores, supermarkets, gas stations, the internet. That number climbs to over 200,000 when you add in the services outlets. However, when you think of the beginning of this colossal industry, you must think of the independent pet store as the seed that became the mighty oak. We will take a look back to 1987 to see where this channel was and how it has evolved through the years.

The data in this report is courtesy of the U.S. Census Bureau. Their Economic Census is done every 5 years in years ending in “2” and “7”. The early years have only basic information but since 1997, more detailed information is readily available. In 2017 they did change some classifications which will make a few comparisons no longer possible.

Let’s get started. Here is a detailed chart on some key measurements and a graph of their growth from 1987 > 2017.

The little chart has a wealth of information, and the graph shows the spectacular overall results. First, the number of stores almost doubled but the key factor was that the sales per store is 7.4 times greater. The number of stores increased but superstores and chains became the dominant type. This is evident by the fact that the number of employees per store is 2.3 times more in 2017 than it was in 1987. Add this to the attitudinal conversion of pet owners to pet parents, with an ever increasing personification of their pets and you get 13.5 times more $.

Now let’s drill deeper. Sales increased +$16.99B (+1249%). How much of the increase was real or just due to petflation?

The annual growth rate in “full” $ was 9.0% from 1987 to 2017. Pet Food and Supply prices went up 77.5% during this time. This is an annual inflation rate of 1.9% which is better than the overall 2.6% CPI rate during this period. This made the “real” growth rate 7.0%. That’s damn good and means that 77.3% of Pet Store $ growth has been real. However, this doesn’t tell the whole story. On the chart you see that real growth flattened from 2007 to 2012. This was largely due to the fact that Pet Food and Supply prices increased an incredible 17.0%. (8.2% per year) from 2007 to 2009. Coming at the onset of the recession, this drove consumers to look for value. The result was that consumers moved strongly to other channels. Pet Stores’ share of total pet products sales fell from 39.0% in 2007 to 33.1% in 2012 and Total General Merchandise took over the top spot in Pet Products sales. All the Food and Supply prices have fallen or at least flattened out since 2009. Total Pet Products inflation from 2009 to 2017 was 1.1%, an annual rate of 0.13% – almost nothing. As a result, “real” sales for Pet Stores returned to a more normal path.

Now, let’s take a look at the progress of the key contributing factors over the years in 5 year segments.

  • 1987 to 1992 – The Number of Pet Stores grew significantly – from 5475 to 7150 (+30.8%). The number of employees per store is about the same. Superstores and chains were just getting started so these were mostly traditional sized stores. The amount of sales per store increases 50% as American’s love for pets truly begins to show. The result – sales basically double in 5 years.
  • 1992 to 1997 – The rise of Superstores. Note the 37.1% increase in employees per store. They are being built and they generate significantly more volume per store – +76.6%. The result – sales more than double in 5 years. In 1997 Pet Stores pushed Supermarkets out of the top spot in Pet Products sales, with 40% of all $.
  • 1997 to 2002 – Superstores continue to rise but at a cost to the independents. The net result is 692 fewer outlets (-8.3%). The Sales per store increases 50.8% which reflects the higher percentage of larger format stores. The total channel sales growth rate slows markedly from the previous 10 years, but sales were still up +38.2%.
  • 2002 to 2007 – The channel bounces back with a 15.2% increase in stores – most of which are chains and superstores. The per store sales goes up another 30.5%, reflecting this change. The result – sales grow 50.3%. They continue to hold their ground in the overall marketplace, with 39% of all Pet Products Sales.
  • 2007 to 2012 – Huge price increases…plus a major recession. There is no growth in the number of stores, but an even higher percentage are superstores. The overall channel sales growth – +29.9% – exactly mirrors the per store growth. Also consider:
    • The overall pet food and supplies category (in all channels) grew 50% from 2007 to 2012.
    • Actual Pet Store Sales from 2007-2012 was only up 6.6% – (Factoring in the huge price increases)
    • The result – Pet Store Sales grew but had a big loss in pet products market share – down to 33.1%
  • 2012 to 2017 – Inflation essentially ends, and more outlets are opened, +13.5%. Per store sales were also up slightly, +9.8%. This produced an overall sales increase of +24.7%. Products were +27.7% which resulted in a minimal gain in market share to 33.3%. This is small, but significant because Pet Stores and $ stores were the only brick ‘n mortar outlets to gain pet products market share in a major consumer movement to the internet.

Through the years, pet Stores have grown larger in size but paused their growth in numbers from 2007 to 2012, largely due to the great recession. During this recession period, their growth in revenue slowed to +29% and did not kept pace with the overall market in the Pet Food and Supplies category, so they lost some market share. However, they bounced back in the 2012 to 2017 period, with more stores and a total sales increase of 24.7% (Products $ were +27.7%). Although this was the smallest $ percentage increase in history it was very significant. The Pet Products marketplace is incredibly competitive, and a new major player is now in the game – the internet. Pet Stores, with their vast array of pet products and services and $ stores, with their value and convenience were the only 2 brick ‘n mortar retail channels to gain share in Pet Products in what was a tsunami like movement of consumers to internet shopping. It shows that Pet Stores have not lost their appeal and that they are both resilient and adaptable in changing circumstances.

Now, let’s look deeper into the retail sales numbers for Pet Stores for trends in specific Product segments. There is sales data from the U.S. Economic Census back to 1987. From 1997 on the data gets reasonably detailed. As I said the Census Bureau changed their product classification system in 2017. This will keep us from doing some comparisons to earlier years. However, I have built a chart which is inclusive of both systems to maximize our ability to compare specific data.

The chart contains all available data. The 2017 numbers are highlighted to indicate the % change from 2012.

  • Green = 10%> Increase
  • Blue = <10% Increase
  • Pink = Any Decrease

Here are the details which are followed by specific category observations for each 5 year period.

Observations 1992 to 1997

  1. Data was limited in 1992 but we saw strong growth in store count as superstores and other chains rapidly expanded.
  2. Sales in Pets and Pet Products more than doubled, +103.9% as Pet Stores became the #1 “go to” channel for Pet Products. Over 95% of Pet Stores’ total sales came from Pets and Pet Products in both 1992 and 1997.
  3. There was a hint of growing diversity as Pet Services $ grew by 260% and A/O revenue more than doubled. Pet Book sales also doubled as they reached what would be their all-time high in $.

Observations 1997 to 2002

  1. The store count fell 8% due to the loss of many independent stores. Total revenue increased 38% but the $ per store increased 50%, which reflects the dominance of the larger stores.
  2. Pets and Pet Products $ales increased +36.2%, which was slightly less than total revenue so their share of Total Pet Store $ dipped to 93.8%. This came from a combination of factors.
  3. The number of stores carrying live pets (nonfish) fell -11.8% but sales increased +32.5%. Obviously, the sales were becoming more concentrated. Fish and aquarium supplies was a different story. The numbers are bundled but Total Aquarium (Fish & Products) fell -28.5% in store count and -12.7% in $. This Category became markedly less popular.
  4. Pet Services continued strong growth, with a 53% increase in store count and a 267% increase in sales. A/O revenue increased +19.6%. Books were available in 40.2% more stores but began their long revenue slide -24.9% in $.
  5. Non Aquarium Pet Supplies increased sales $1.0B, +48.8% to $3.1B, which allowed them to slightly widen their razor thin lead over Pet Food as the #1 category in Pet Stores.
  6. Pet Food sales increased sales by $0.9B, +42.9% to $2.9B. We should note that in 1997 and 2002 Pet Food was carried in 2% fewer stores than Pet Supplies. However, there is no doubt that Food is the primary driver in most pet store consumer visits. It is the most “needed” category for Pet Parents. That’s why it’s put at the back of the store.
  7. Pet Store offerings became a little more diverse. However, 78.7% of Pet Stores’ total revenue in 2002 and 89.5% of the increase from 1997 came from Pet Food and Non-Aquatic Pet Supplies. They are the key categories.

Observations 2002 to 2007

  1. Total revenue increased to $11.4B. (+50.3%) as store count grew 15.2%, primarily due to chains.
  2. The sale of pets (non-fish) increased both in number of stores (+8.1%) and sales volume (+17.1%).
  3. In 2007 Pet Foods became the largest segment. Sales were $4.6B, +$1.7B (+59.6%). This was due to the initial move to premium which began in 2004 and the 2007 melamine recall which began the “buy Made in the USA” trend.
  4. Pet Supplies share of $ is much higher in Pet Stores than in the overall market. Sales hit $4.2B, +$1.1B (+37.3%) but the growth rate was below the overall market. This segment is very vulnerable to migration to other channels.
  5. Between 2002 and 2007, Aquarium products came back strong, with spectacular growth in the number of outlets – +25.8% and volume, +$405M (+59.3%). Sales reached a billion dollars for the first time – $1.09B to be exact.
  6. A/O products $ grew +25.6% but Pet Books continued their slide, -21.1%. Their drops pretty much mirror the overall book market as more and more consumers turn to other sources and to electronic formats.
  7. The Service Segment provided by Pet Stores reached $734M, up $427M (+139%) in revenue – Now 6.4% of Total $.

Observations 2007 to 2012

  1. Total revenue hit $14.7B, a $3.3B increase (+29%). However, the store count remained stagnant at just under 8800.
  2. Pets, Food and Supplies sales increased $2.9B to $13.3B. However, this 27.6% increase was considerably below the 50% increase in the overall Pet Products market, which resulted in a large drop in market share for Pet Stores.
  3. Pets (nonfish) were sold in 3% fewer outlets…but the drop in sales was very significant… -34%.
  4. Pet Foods remained the largest segment with strong growth, +44.8%. This $2.1B gain accounted for 63% of the increase in the total $ for the channel. This is probably a reflection of the strength of “premium” pet food sales. Notably, the number of stores stocking pet food exceeded the number stocking supplies for the first time…ever.
  5. Pet Supply Sales increased $0.9B (22.5%). This is less than half of the increase of the overall market and reflects the consumer migration to other channels. Prices deflated after 2009 and more categories became commoditized.
  6. Fish and Aquarium Products had no growth in the number of outlets and only 5% growth in sales. Considering the overall inflation rate during the period (+4.4%), “real” sales were essentially flat.
  7. A/O products growth slowed to +8.5%. Book sales continued to fall and in 2012 were less than half of 2002.
  8. Services were offered in 25% more Pet Stores and sales grew +$0.4B (+54.5%) to reach $1.1B, which was 7.7% of total revenue. Services is a great opportunity to gain business which can’t migrate to the Mass Market channels.
  9. Pets, Services and Channel Differentiated Premium Pet Foods and Products are keys to maintaining the consumer traffic and sales in the Pet Store Channel. The U.S. consumer is looking for value. The generally higher prices on supplies and “regular” food in these stores have encouraged the migration to other channels.

Observations 2012 to 2017

  1. Total Revenue increased $3.6B, +24.7% to reach $18.4B. The store count grew +13.5% to 9984 – almost hit 10,000.
  2. Pets and Pet Products $ was $17.1B, a $3.7B (+27.7%). This was strong enough for Pet Stores to be only 1 of 2 retail channels to actually gain share (only 0.2%) in Pet Products $ against the strong consumer movement to the internet.
  3. Live pets/fish $ grew +$0.23B, +32.9% to $0.9B but the % of stores stocking any live animals fell to a record low 58%.
  4. Pet Food $ales soared to $9.8B, up +$3.1B (+45.5%) and for the first time, in 2017 accounted for more than half of total Pet store revenue – 53.3%. The number of stores stocking pet food was 14.8% more than the number stocking supplies. Pet Food provided 83.8% of the lift in Pet Products $ and 86.1% of the increase in total pet store revenue. Pet Food and more specifically super premium pet food was the primary reason that Pet Stores held their ground and even gained a little share in the overall Pet Products marketplace.
  5. Pet Supplies also increased sales, +$0.3B (+6.3%) but it was far less than food and their share of total Pet Store revenue fell to a record low 39.8%. The number of stores stocking Pet Supplies fell 5% and only 74.1% of Pet Stores stocked Pet Supplies – a record low.
  6. Aquarium Products, excluding live fish, showed some positivity. The number of stores stocking Aquarium Products increased +4.1% and sales increased +$0.1B, +11.2% to a total of $0.9B.
  7. All other products and services has always been a very small part of pet stores revenue but sales have always increased…until 2017 when they fell -16% and their share of total $ fell to 0.9%.
  8. The number of Pet Stores carrying books actually increased by 1% but sales plummeted to $3.3M, which is -89% below the sales from 20 years ago in 1997.
  9. The number of Pet Stores offering Pet Services actually fell -7.2% from 2012 and sales decreased -$30M (-2.7%) to $1.103B. This is a bit of a surprise but it came as a result of competition. Pet Services outlets grew in number, giving Pet Parents more options and better prices. This segment had not yet drawn a significant amount of new users. According to the US BLS Consumer Expenditure Survey, this changed in 2018 and spending skyrocketed. I’m sure that Pet Stores got their share. This segment is an important allure for Pet Parents who want one stop pet shopping.
  10. Pet Stores strongly increased sales from 2012 to 2017 and even gained a small amount of share in the total Pet Product marketplace where the internet cut into virtually every other channel’s business. This was primarily due to the consumer demand for Super Premium Pet Foods, where Pet Stores were the “go to” source.

Wrapping it up

Pet Stores pioneered the pet industry but they also led the way in trends that have spurred the spectacular growth of the industry since 1987. The rise of superstores and chains provided unprecedented space for Pet Supplies. This was important for existing manufacturers but it was especially important for new companies. There was finally retail space for a “flood” of new products. According to the US BLS Consumer Expenditure Survey, in 1987 Pets Supplies accounted for 13.9% of Total Pet Spending. Then came Pet Superstores and chains. By 1996 the Pet Supplies share of Total pet $ was 23.5%. It has remained near this level ever since. Although larger Pet Stores showed the way, this spurred a radical expansion of pet product distribution across the whole retail marketplace. Another key industry trend was the move to premium Pet Food. Pet Stores led the way again. They had the room for new premium foods, which became increasingly desired by Pet Parents. This trend began in about 2004. The 2007 Melamine recall accelerated the movement as consumers moved successively to made in the USA, then to all ingredients from the USA, next to all natural and now to super premium. Plus, you can add the latest big movement – pet health supplements, often in treat form.

Take a look at the following graph to better “see” the business impact of these trends on Pet Stores.

In 1997, Pets and Supplies $ dominated the channel with 58.2% of the total revenue. Food started to gain ground between 2002 and 2007 when premiumization began. They moved to the top in 2012 when overall Pet Stores lost considerable market share to other channels. Then Super Premium Foods took off and Pet Stores were the “go to” outlet. In 2017, the share of sales for Pet Food had essentially flipped from 2007. The A/O business has always been small but is now becoming insignificant. The Services Segment is small, around 6% of total revenue since 2007, but it is not insignificant. Offering Pet Services makes Pet Stores more of a one stop shopping experience for Pet Parents and is a big positive point of differentiation. This differentiation and the “one stop shopping” that it provides for Pet Parents was a key factor that allowed Pet Stores to hold their market share against the internet wave that began from 2012 to 2017.

There’s more to the story!

Larger format pet stores bundled into chains – big and small was obviously a great idea but more than that, the timing was perfect – for society, for consumer attitude and for the retail marketplace. To take a closer look at this timing, we have to go back over 75 years to the passing of the G.I. Bill in 1944. This rewarded Veterans for their service by providing education and job training benefits to help advance their after service careers. It also offered low interest home mortgages which was a major reason that the homeownership rate for the U.S. rose from 40% in 1940 to 60% in 1960. Also, more space was needed for this expansion which resulted in the creation of the suburbs, a new concept which offered the convenience of urban living with more space for households.

The soldiers returning from World War II also helped create another movement – more children. U.S. birthrates soared from 1946 to 1964, creating the largest generation – the Baby Boomers. Many of them grew up in this new suburban environment – which offered more space in a home that was owned and controlled by their parents. Pets began to be added to the household mix – sometimes in a big way. I am a Boomer. By the time that I was in 3rd grade (1956), my older brother and I had 2 dogs, 2 cats, a canary, a parakeet, a hamster and…a raccoon. In those days dogs and cats were “outdoor” animals. They didn’t come into the house but we let them take refuge in the basement during inclement weather. As we moved into our early teens, we no longer required a babysitter. While our parents worked, we roamed the neighborhood, especially in the summer. Our dogs were our constant companions. In the summer, we spent more time with them than we did with our parents. They became siblings to us so it is no surprise that when we grew up, we bought suburban homes, started families and added Pet “children” to our household.

So the changes in society and consumer attitudes were underway. However, we still needed major changes in the retail marketplace. When Boomers were growing up, Department Stores “ruled”. This channel has never embraced pet products. This indicated that they weren’t in tune with consumers and was an early sign that they would fade. In the 60’s discount stores came into being. First came general merchandise, Wal-Mart, K-Mart, Target. They grew and ultimately progressed to SuperCenters and Clubs in the 90’s. Consumers became used to large stores with a huge product selection. In the late 80’s and 90’s this concept trickled down as large format specialty stores came to the forefront – Toys R Us, Office Depot, Circuit City, Barnes & Noble, etc. Consumers were ready for Pet Super Stores.

There is one more key element – money. Income has been and continues to be the driving force in increased pet spending. Let’s go back to the key players. In 1991 the oldest Baby Boomers were turning 45. 45>54 is the highest income age group so in the 90’s, the biggest generation was entering their peak earning years. Pet Parents finally had outlets that not only filled their pets’ wants and needs but introduced new ones and… they had the money to buy it all.

The creation and development of larger format pet stores and chains was literally a positive example of the “perfect storm”. It was a great idea, all the elements were in place and the timing was perfect. Pet stores continue to evolve as the does the market. The store size has dialed back a little to make shopping a little more convenient. The channel is also not just huge chains. Small chains and local independents are also strong. The successful outlets are adapting to a virtual world, offering features like BOPIS. However, one thing will remain unchanged and that guarantees their continued success. Pets are very personal. Boomers were the first pet parents but they passed this mantle on to their children and it has now become the norm across the U.S. In fact the relationship has become even stronger as we increasingly personify our pets. This has led to substantial growth in categories like apparel but probably had its greatest impact on categories related to health. It fueled the spectacular and ever growing movement to higher quality, super premium foods and now medical supplements. Pet Parents want and need the opportunity for personal interaction when shopping for their pets, especially when considering any new product. This can only happen in Pet Stores.

Attending SuperZoo 2021? – It is a great Opportunity! But….You Need a Plan!

SuperZoo has now returned to an in-person event. It has been 5 months since the last virtual show so the New Product Showcase is packed with entries. The exhibitor count is down due to the pandemic, but the booths continue to get bigger. To help attendees in working this huge show the floor sections were made more targeted and new sections were created. One thing is unchanged. There is a huge array of exhibitors in every product category.

Consider these 2021 SuperZoo facts:

  • 800 exhibitors
  • 8 “Targeted” Floor Sections: Nature’s Pathway, Rodeo Drive, Groomers, Critter Alley, Health & Wellbeing, Innovation Incubator, Farm & Feed, WPA Good Works
  • 220,000+ sq ft of exhibitor booths; Plus, a 37,000 sq ft New Products Showcase
  • SuperZoo Education: Seminars on Retail and Grooming – 97 hours; 88 separate sessions
  • Almost 5 miles of aisles – just to walk the exhibit floor

Whew! This show is still huge. The show floor is open for 21 hours so…Let’s “Do the Math!”

 If you don’t attend any seminars, visit the New Product Showcase, stop to chat with anyone in the aisles or for food, a drink or to go to the bathroom and maintain a walking speed of 2.5 mph…

You can spend…1 MINUTE AND 25 SECONDS…with each exhibitor…You definitely need a plan!

With a higher concentration of Pet retailer attendees and a commitment to groomers, there are subtle differences between SuperZoo and GPE.  However, like GPE, SuperZoo has attendees from every major retail channel and before being limited by pandemic travel restrictions, attracted a multitude of exhibitors and attendees from around the globe.

Despite the variety of offerings to fill an attendee’s time, SuperZoo is still primarily about Pet Products. New Products are critical to maintaining and growing any business so you must take the time to visit the new product area. Knowledge is power so you should also sign up for any relevant classes. Sometimes it’s not what you know, but who you know that matters most. This makes networking with other industry professionals a priority.

Every business can improve in terms of products. If you are a retailer, what sections of your store are not doing as well as you hoped and need a “facelift” or conversely, what areas are growing and need products to fill additional space? Category managers for distributors and retail chains may only be interested in targeted visits to exhibitors relevant to their “categories”. Representatives may be looking for new manufacturers…in specific product categories. Manufacturers could be looking to find distributors to handle their products or just looking to “check out” the competition. In regard to products, there is always something to see…for everyone! Plus, there are 330 Exhibitors at SZ 21 that weren’t at GPE 20.

SuperZoo is a great place to review products but Business Services, everything from Private label to POS, have also become increasingly important. In fact, 1 out of every 7 exhibitors offers some type of Business Service. Attendees can now “Leave no stone unturned” in their quest for business success. SuperZoo is about gathering information and making decisions to improve your business – whether they are made on the spot or put on your “must do” list. Your only real limitation is time. How do you make the most effective use of your time on the show floor? Here’s a suggestion.

Use the Super Search Exhibitor Visit Planner to make SuperZoo easier and more productive. I initially designed it in 2014 and have updated the data and produced a new version for every GPE and SuperZoo since then…including SZ 2021.

The “update” is not just exhibitor lists but also to the product category offerings for every exhibitor. I reviewed every exhibitor profile on the show site, but I also visited over 800 websites and conducted separate internet searches to “validate” their product offerings. It is not 100% accurate, but it is close.

What does the Super Search do?…It searches for and produces a list of Exhibitors by product categories.

  • From the simplest – “give me a list that I can look at on my phone or tablet in either Booth # order or alphabetically”
  • To the most complex…”can do a simultaneous search for multiple specific product categories, allowing you to personally narrow down the initial results and see the “final” alphabetically or by booth number.

The SuperZoo Super Search Exhibitor Visit Planner does both…and more…and does it quickly! Take a look at the New Quick Start Guide. You will see that it looks complex but is really quite simple.

SuperZoo 2021 Super Search Exhibitor Visit Planner – Quick Start Guide

First: When you download the Excel file, Remember to Enable Editing & Macros!

The SZ 2021 Super Search Exhibitor visit planner is designed to make your time on the show floor more efficient and more productive. With the Super Search you can conduct up to 5 separate and distinct product category searches simultaneously with consolidated results produced in booth # order to facilitate your “journey”. There are detailed instructions for reference and to help you understand the nuances of the tool. However, it is really very simple so let’s get started. Here is the Dashboard where you set up your searches.

On the dashboard, the first things to note are the numerous category columns. There are 8 separate floor sections, 11 different Exhibitor or Animal Types and 33 Dog and/or Cat Product categories. You can search exhibitors for any combination of these.

Let’s take a specific example running 3 simultaneous searches for several Dog/Cat categories:

  • Toys
  • Treats
  • Catnip & Litter (Must sell both)

Now referring to the Dashboard, let’s take it by the numbers:

  1. This column is where you activate each search. Type in a “Y” (Cells C3>C7 will auto-capitalize) This search “line” becomes active.(cell turns green) In our example we are running 3 searches, so we have 3 “Y”s.
  2. Now we enter a 1 in the correct column for each search line. Search Line 1: Toys; Search Line 2: Treats.
  3. In Search Line 3 we want exhibitors that sell both Catnip and Litter, so we put a 1 in both of these columns.
  4. Now we just “click” the Execute Search Button. The searches are done simultaneously, and the results combined into a single list in alphabetical order.
  5. If you would like to view the list in Booth # order, just click the Booth # Sort.
  6. You can switch the list back to an alpha view by clicking the Alpha Sort Button.
  7. To Clear all your search categories and start a new search, click the Clear Criteria Button. Then click Execute (#4) again and you will be back to the full list

Note: Any Search Line with a Y and no 1’s in any column will always deliver the entire list regardless of what is selected in other lines. Change the Y back to an N in unused search lines. Now a sample of the results:

Company A – Has Toys Only; Company B has Dog Treats Only and is also a “Startup”; Company C is on the list for Treats and also has Catnip, but no Litter. This is not unusual as Catnip is often a Treat; Company D has Treats & Toys. Company E has both Catnip and Litter and in fact, actually has it all!

Note: The Super Search highlights your search categories, so you know “why you are there”. However, it also shows all categories that are available. Some might “pique” your interest while you are visiting the booth.

You can review the exhibitors alphabetically then put the list in Booth # order to make it easier to “work”. The Super Search also allows you to “cut down” the list during your review. (Pg 2; Point #11 – “U Pick ‘em” in Detailed Instructions) But First, I suggest that you “play” with the Super Search to get a “feel” for the tool, and then review the Detailed Instructions. With your “play” experience, the detailed instructions will become a “quick read” and a valuable reference. You’ll soon be “up to speed” on the full capabilities of Super Search.

Good Luck and Good “Hunting” at SZ 2021.

Use the links below to download The Super Search (Be Sure to Enable editing/macros/content), the Quick Start Guide and the Detailed Instructions. Then GET STARTED!  

(To save the PDF to your computer Right Click the download link and select “Save Link As…”)

(To save the PDF to your computer Right Click the download link and select “Save Link As…”)

(For the Excel file to work on your computer, be sure to enable macros/editing/content if asked.)

3 more exhibitors cancelled after our Final Part 2. The show is over but I updated the file to create a “For the record” list of SuperZoo 2021 exhibitors for future reference.

SUPERZOO 2021 – THE PET INDUSTRY BEGINS THE JOURNEY BACK TO NORMAL

SuperZoo 2021 is only 3 weeks away. It has been 18 months since the last in person Pet Trade show, GPE 2020 and 2 years since the last SuperZoo. Pet Parents spent more time with their children during the pandemic, so the Pet Products segments prospered during this challenging time. However, pet trade shows have essentially been shut down.

Although the internet has shown exceptional growth in Pet Products sales, these $ are coming from proven products. Buyers of all kinds, from consumers to chain store executives prefer to make in person buying decisions on new pet items. Thus, the return of in person Pet Trade shows is critically important to the continued growth of the Pet Industry.

With SuperZoo 2021, the Pet Industry will begin to get “back on track” to normal. It will not be easy. Currently SuperZoo 2021 has 781 exhibitors. That is down 321 (-29.1%) from SuperZoo 2019. Of course, the ongoing reaction to the pandemic is the primary reason behind the drop in exhibitors but it is somewhat more complex. Consider:

  1. International Travel Restrictions have caused many exhibitors to cancel (This also happened at GPE 2020)
  2. The pandemic has been especially hard on startups and smaller companies.
  3. Some companies have decided to “play it safe” and wait until 2022.
  4. A non-pandemic factor: The wave of mergers and acquisitions continues.

SuperZoo is still a very powerful event. There are 220,000 sq ft of booths, a 37,000 sq ft New Products Showcase, with over 700 items – more than 2019, and 18,000 sq ft devoted to Show Floor Education and demonstrations. There are also 88 separate educational sessions on grooming or business subjects totaling 97 hours. That is powerful in every way.

New is always a focus at Pet Trade shows. That also applies to exhibitors. At SuperZoo 2021:

  • 289 (37.0%) Exhibitors weren’t at SZ 2019
  • 330 (42.3%) weren’t at GPE 2020
  • And 205 (26.2%) didn’t do either of those show

Those are some strong arguments for attending SuperZoo 2021. Now, let’s look at some specifics of what you will see there. First, a warning: With a 29% pandemic induced drop in exhibitors, you’re going to see a lot of negative numbers when compared to SZ 2019. I suggest that you focus on share of booths. Change in this measurement will indicate how a particular group or product category is performing during difficult times.

First, we’ll look at the overall show floor in terms of specialized sections.

  • The first thing that you notice is that 3 sections went away and were replaced by 4 new sections.
  • Health & Wellbeing products have been showing strength for years. Good Works gives a focal point for non-profits. Farm & Feed replaces “Poultry” and Innovation Incubator includes only startups, replacing the 1st timers’ section. It doesn’t reflect the amount of 1st time exhibitors at the show, which numbers over 160 – mostly on the open floor.
  • Another critical fact demonstrates the importance of targeted floor sections. For the first time…ever, the share of all special floor sections booths exceeds 50% of the booths – 51.2% to be exact.
  • Natural not only gained a huge amount in share. They actually increased their number of booths. That is truly remarkable under the current circumstances and proves the importance of “Natural” in the marketplace.
  • Grooming basically held its ground in share while Critter Alley lost a bit.
  • The biggest share decrease was in Rodeo drive. This reflects the drop in small companies who largely fill this section.

Now let’s look at the Exhibitors by type, including animal.

  • Almost all media and organizations made it back to the show.
  • The importance of pet retailers at the show is evident as Distributors gained share.
  • Business Services continues to show strength, down in count, but still double the number from 5 years ago.
  • Gifts/Gen Mdse exhibitors lost the most share, but they have been trending down since peaking at 139 in 2016.
  • All animal types but Birds and Reptiles lost some share. Except for dogs, the share losses were under 1% so they were generally in line with the percentage decrease in exhibitors.
  • Dogs and Cats lost the most in exhibitor count, but they remain the royalty of the Pet Industry.

Let’s take a closer look at the “royalty”. Here are the top 10 Dog and/or Cat Categories at SuperZoo 2021.

  • Apparel was replaced by Waste Pickup. There was a shuffling in the rankings from #5 to #10 – 3 gained; 3 lost.
  • Meds & Supplements remain strong and continue to help Treats maintain an unparalleled prominence at #1 as Supplements are often produced in Treat form. They again rank #1 & #2 in terms of exhibitor count and share gain.
  • The biggest losses in share are in Collars & Leads, Bowls, Beds and Apparel. The drop is due to a combination of losses – in International Exhibitors who focus on commodities and small fashion oriented companies.
  • Premium Food has become even more important in pandemic times – gaining share and moving up in rank.
  • Grooming is a mixed bag. Grooming tools dropped in rank and booth count after a reaching a record level in 2019. However, shampoo moved up 3 spots in rank. The addition of Waste pickup to the list may reflect the radical increase in Pet Parents’ “Pandemic Dog Walking”.
  • Toys maintained their rank, but a question remains, “Can attendees “survive” with only 127 booths offering toys?”

SuperZoo has 29% fewer exhibitors. However, the average booth size is now 294 sq ft., up from 252 in 2019 and 50% larger than 2016. Products and services are available to fill virtually every need or want of the attendees and the show is keeping “in tune” with changes. Increasing the number of special floor sections and making them more targeted along with a massive amount of educational sessions are prime examples of the WPA’s ongoing efforts to improve the show.

653 exhibitors (84%) focus on Dog and Cat. Let’s take a closer look.

There are 321 fewer Exhibitors at SuperZoo. Those offering Dog and/or Cat products fell by 285. The Dog/Cat share fell slightly from 84.4% to 83.6% but Dogs and Cats remain the unquestioned “royalty” of the industry. Once again we will focus on change in share

  • 19 of 33 (58%) Dog/Cat categories increased their share of exhibitors.
  • 9 increased their share by at least 0.6% and 5 by more than 1%.

When you look at the Dog/Cat Categories making share gains, you see that again the most common thread is the health and wellness of our companion animals, including CBD products and Wipes. All of these fit right in with the ongoing trend to more nutritionally focused Super Premium Pet Food and Supplements in Treat form.

The biggest losses came from Top 10 categories – Apparel, Collars & Leads, Bowls, Toys and Beds. The drop in Grooming Tools and Stain & Odor is a bit of a surprise because virtually every other category associated with grooming and cleaning showed gains, including Litter, Shampoo, Training Pads and Waste Pickup.

SuperZoo again showcases what is “happening” in the Pet Industry and offers a great opportunity for the Industry to get “back on track” to normal. It will take effort and commitment from everyone, but SZ 2021 is the surest bet in Las Vegas!

Finally, the chart below details the specifics for all 33 of the Dog/Cat product categories that I defined for the Super Search Exhibitor Visit Planner.  (Note: The SZ 2021 Super Search will be available for download at PetBusinessprofessor.com on 8/2.

THE SUPERZOO “TRAIN” DEPARTS ON 8/16. I HOPE TO SEE YOU IN VEGAS!

Retail Channel Monthly $ Update – May Final & June Advance

In May 2020  the Retail market began its recovery after hitting bottom in April. The road back has been long and complex and Consumer spending behavior continues to evolve. In this report we will track the changes, migration between channels and the retail recovery with data from two reports provided by the U.S. Census Bureau.

The Reports are the Monthly Retail Sales Report and the Advance Retail Sales Report. Both are derived from sales data gathered from retailers across the U.S. and are published monthly at the same time. The Advance Report has a smaller sample size so it can be published quickly – about 2 weeks after month end. The Monthly Final Report includes data from all respondents, so it takes longer to compile the data – about 6 weeks. Although the sample size for the Advance report is smaller, the results over the years have proven it to be statistically accurate with the final monthly reports. The biggest difference is that the full sample in the Final report allows us to “drill” a little deeper into the retail channels.

We will begin with the Final Retail Report for May and then move to the Advance Retail Report for June. Remember, the retail impact of the pandemic began in March 2020, peaked in April, then recovery started in May. We will compare 2021 to both 2020 and 2019 to document the progress that the retail market has made towards a full recovery.

Both reports include the following:

  • Total Retail, Restaurants, Auto, Gas Stations and Relevant Retail (removing Restaurants, Auto and Gas)
  • Individual Channel Data – This will be more detailed in the “Final” reports and we fill focus on Pet Relevant Channels

The information will be presented in detailed charts to facilitate visual comparison between groups/channels of:

  • Current Month change – % & $ vs previous month
  • Current Month change – % & $ vs same month in 2020 and 2019
  • Current YTD change – % & $ vs 2020 and 2019
  • Monthly and Year To Date $ will also be shown for each group/channel

First, the May Final. Retail hit bottom in April 2020 but began recovery, hitting record $ in December. In January & February $ fell but they skyrocketed in March, setting a new all time $ record. In April $ fell a bit but they rebounded in May to yet another record high. Here are the major retail groups. (All Data is Actual, Not Seasonally Adjusted)

The final total is $2.9B less than the Advance report projected a month ago. All groups but Restaurants were down slightly. The specifics were: Relevant Retail: -$2.2B Auto: -$1.1B; Restaurants: +$1.2B; Gas Stations: -$0.8B. Sales vs April were up in all but Auto and Total Retail $ set a new all-time record. Total $ales broke $600B for the 1st time in December and has now done it 4 times. Auto has the strongest recovery and is in fact prospering – annual YTD growth rate since 2019 is +12.9%. Except for the spending dip by Auto vs April, all but Restaurants were positive in all other measurements. Restaurants are still slightly negative vs 2019 but the Retail recovery is strong.

Now, let’s see how some Key Pet Relevant channels were doing in May.

  • Overall– 7 of 11 channels were down vs April but 10 were up vs May 2020 and 10 vs May 2019. In YTD $, 10 were up vs 2020 and 10 vs 2019. 9 were up vs both. May was the 3rd biggest month in history for Relevant Retail.
  • Building Material Stores – Their amazing lift continues. The ongoing surge came as a result of pandemic spending patterns developed in 2020. Consumers began focusing on their homes. Now we’re into the 2021 Spring lift for both Building and Farm stores . Sporting Goods stores are not in this group but have a similar spending pattern. Sales took off in May, hit a record peak in December and continued strong into 2021, peaking in March. May $ fell slightly again but are +30.6% vs 2020 and +49.5% vs 2019. YTD they are still +53% vs 2019.
  • Food & Drug – Supermarkets were +$77.7B in 2020. $ are down vs April and YTD 2020 due to last year’s binge buying. They are still up 14% vs May 2019 and YTD 2019. Drug Stores ended up +$17B (+5.7%) for 2020. Their $ fell in April and May after a setting a record in March. All other measurements are positive and YTD $ are +7.2%.
  • General Merchandise Stores – $ in all channels fell in Jan & Feb then spiked in March. In April, sales in all but $ stores declined but they bounced back in May. Discount Store were having problems before the pandemic, but they have strongly recovered, +8.5% YTD vs 2019. Clubs/SuperCtrs and $ Stores remain strong. These channels promote value. Their success vs both 2020 and 2019 reinforces its importance in Consumer spending decisions.
  • Office, Gift & Souvenir Stores– $ increased slightly from April and were +79% vs May 2020. The pandemic hit them hard. They are still down vs 2019 – monthly and YTD. Recovery is a long way off, but things are improving.
  • Internet/Mail Order – Although $ dropped again in May the pandemic continues to foster this channel’s growth. In May of 2019, their YTD growth rate was +13.0%. In May 2021, it is +20.4% – a 56.4% increase.
  • A/O Miscellaneous – This is a group of small to midsized specialty retailers – chains and independents. It includes Florists, Art Stores and Pet Stores (22>24% of total $). Pet Stores were usually essential, but most stores were not. In May 2020 they began their recovery. Their 2020 total sales were up +11.6%. Their May $ hit $10B for the 1st time to set a new all-time record. YTD sales are +32.7% vs 2020 and +38.6% vs 2019. Very strong!

The Relevant Retail Segment began recovery in May, reached a record level in December, then $ fell in Jan & Feb. Sales turned up again in March, fell slightly in April then bounced back in May. Almost all channels are showing growth. The key drivers are the Internet, SuperCtrs/Clubs/$ Stores and Hdwe/Farm.

Now, here are the Advance numbers for June.

2020 was a memorable year for both its traumas and triumphs. In April & May we experienced the 2 biggest retail spending drops in history, but the problems actually began in March. Retail sales began to recover in June and in October, YTD Total Retail turned positive for the 1st time since February. In December, Total Retail broke the $600B barrier – a historic first. Sales fell from their December peak in both January and February but still set monthly sales records. Then they took off again in March, setting a new monthly sales record of $633B. April sales were down slightly but they took off again in May to set yet another spending record, $641.5B. June brought another slight dip in this rollercoaster ride but was still the 3rd biggest $ month in history. All but Gas Stations were down vs May, but all the major groups were positive in all other measurements. The big news is that for the 1st time YTD Restaurant $ were positive versus 2019 – just barely, +0.1%. Some other areas of the economy are still suffering, some spending behavior has changed and inflation has become a factor in some increases. However, consumers are back spending money and the overall Retail marketplace has strongly recovered.

Total Retail – In March, Total Retail hit $633.1B, a record for the most spending in any month in any year. In April, $ales dipped to $625.5B but were still $218.3B more than April 2020 – a record increase, which was more than double the size of last year’s record drop. In May, sales set another new record, $641.5B. In June sales dipped slightly to $631.1B, but it was still the 3rd biggest month in history. Moreover, the current YTD average annual sales growth rate since 2019 is 9.0%, the strongest ever in records going back to 1992. Total Retail has not just recovered. It is stronger than ever.

Restaurants – This group finally has no negative measurements vs 2020 or 2019. Last February YTD sales were up 8.1% vs 2019. The Pandemic changed that. Restaurants started to close or cease in person dining in March and sales fell -$33.3B (-52.5%) compared to March 2019. Sales bottomed out in April at $30.1, the lowest April sales since 2003. Sales started to slowly increase in May but never reached a level higher than 88% compared to the previous year. 2021 started off slowly. Through February, YTD sales were down -16.7% from pre-pandemic 2020 and -10.0% from 2019. In March sales took off and grew steadily in April and May. Sales dipped slightly in June but were still strong vs 2019 & 2020. YTD their $ are ahead of 2020 and exceeded 2019 by 0.5B (+0.1%). Their recovery is gaining strength.

Auto (Motor Vehicle & Parts Dealers)   – Staying home causes your car to be less of a focus in your life. Sales began to fall in March and hit bottom in April. Auto Dealers began combating this “stay at home” attitude with fantastic deals and a lot of advertising. It worked. They finished 2020 up 1% vs 2019 and have returned to a strong positive pattern in 2021. The “attitude” grew amazingly positive in March and slowed only slightly in April>June as sales exceeded $137B in all 4 months, by far the 4 biggest months in history. To show how well consumers responded to their campaign you just need to look at the data. This group has exceeded $110B in monthly sales only 12 times in history. 10 of those occurred after the onset of the pandemic.  YTD Avg Annual Growth Since 2019 = +13.2% – the best performance of any big group.

Gas Stations – Gas Station $ales have been a mixed bag. If you drive less, you visit the gas station less often. Sales turned down in March 2020 and reached their low point in April. They moved up but generally stayed about 15% below 2019 levels for the rest of 2020. In February they were still behind 2020 in monthly and YTD $ but ahead of 2019 in both measurements. In March, sales skyrocketed. They increased slightly in April, May and June and were 37.4% above June 2020. They have been positive in all measurements vs both 2019 and 2020 since March. Their comeback continues but there is another factor that must be considered – inflation. Gas prices can be pretty volatile. They dipped in the first 2 months of the pandemic but then returned to more normal levels for the balance of 2020. They began strongly inflating in 2021. In fact, the June 2021 prices were 45% above June 2020. That means that the 37.4% year over year $ lift in June was actually a decrease in the amount of gas sold. YTD Annual Avg Growth Rate Since 2019 = +3.1%

Relevant Retail – Less Auto, Gas and Restaurants – This is what we consider the “core” of U.S. retail and has traditionally accounted for about 60% of Total Retail Spending. When you look at the individual channels in this group, you see a variety of results due to many factors – non-essential closures, binge buying, online shopping and a consumer focus on “home”. However, overall, April 2020 was the only month in which spending in this group was down vs 2019. Monthly $ales exceeded $400B for the first time ever in December ($407B). They finished 2020 up $260B, +7.1%. Their performance was the only reason that Total Retail was able to finish 2020 with positive numbers, +0.5%. Sales fell in January and February but set monthly records. In March they turned sharply up again, then dipped slightly in April but May brought the 3rd highest $ of all time. June saw another slight $ decline but they are still up $40.8B, +12.3% vs June 2020 and  +$298.8B, +16.5% YTD. We should note that that while December 2020 is still #1, March ($374.7B), April ($366.8B), May ($376.7B) and June ($371.5B) of 2021 are four of the six highest monthly totals of all time. It is also important that the Relevant Retail group has posted positive numbers versus last year and YTD for every month since April 2020 and their average YTD growth rate since 2019 now stands at +10.2%. Through June all but one channel have now turned positive in all measurements vs both 2020 and 2019. However, the primary drivers throughout the pandemic were and continue to be Nonstore, Grocery, SuperCenters/Clubs/$ Stores plus a seemingly never ending “spring lift” from Hardware/Farm and Sporting Goods.

Now let’s look at what is happening in the individual retail channels to see where the $ are coming from. June $ were down slightly from May and none of the increases were “off the charts”. However, it was still the 5th largest month in history for Relevant Retail outlets. The groups are less defined than in the Final Monthly reports and we will look across the whole market, not just pet relevant outlets.

Sales in 7 of 13 channels were down vs May but all were up vs June 2020, vs June 2019 and YTD vs 2020. Only 1 was down YTD vs 2019. (Relevant Retail YTD Avg Annual Growth Rate since 2019 = +10.2%)

After hitting bottom in April 2020, Relevant Retail has now beaten the previous year’s $ for 14 consecutive months. The group set an all-time record of $407B in December and finished 2020 +$260B vs 2019. 2021 started strong, with record sales in every month. March > June were 4 of the 6 biggest of all time. Essential channels are still the primary drivers:

  • Nonstore Retailers – The biggest driver. Online shopping continues to grow in # of households and in $.
  • Food & Beverage – Grocery– Restaurant $ are improving but consumers continue to eat & drink more at home.
  • Bldg Materials/Garden/Farm– Their “Spring” lift continues unabated as consumers focus on their home.
  • SuperCtrs/Club/Value/$ Strs – They keep the GM channel positive. Value is still a major consumer priority.

Regarding the Individual Large Channels (Includes YTD Avg Annual Growth Rate since 2019)

General Merchandise Stores – Sales fell in June but all other numbers are positive. YTD Department Stores $ remain up vs 2020 but down vs 2019. They were having problems before the Pandemic. After dipping to +7.5% in February, the growth rate by Club/SuperCtr/$ stores has remained near the current 8.4%. These stores are still the key to this channel.

  • YTD Avg Annual Growth: All GM = +6.8%; Dept Stores = -0.9%; Club/SuprCtr/$ = +8.4%

Food and Beverage, plus Health & Personal Care Stores – Sales in Grocery were down in March>May from 2020 – No surprise, as these were 2020 binge months. In June they beat 2020 $. The Health, Personal Care group finished 2020 at +1.8%. 2021 has started even better. With strong March > June sales, YTD they are +10.7% vs 2020 and +9.5% vs 2019.

  • YTD Avg Annual Growth: Grocery = +6.7%; Health/Drug Stores = +4.6%

Clothing and Accessories; Electronic & Appliances; Home Furnishings – March > June have been spectacular for all these channels. The increase in Clothing Stores vs June 2020 was not “off the chart” but was still +49.4%. Although all of these groups were down vs May they remain positive in all measurements vs 2020 or 2019 for the 4th consecutive month.

  • YTD Avg Annual Growth: Clothing = +3.6%; Electronic/Appliance = +2.5%; Furniture = +10.1%

Building Material, Farm & Garden & Hardware – Their Spring lift began on time in 2020 and has never stopped. They have greatly benefited from consumers focusing on their home needs. They finished 2020 +53B (+13.8%). Sales took off in March, set a record in April then dipped slightly in May & June. They are +18.3% YTD. Avg Annual Growth = +14.6%

Sporting Goods, Hobby and Book Stores – Book & Hobby stores are open but Sporting Goods stores have driven the lift in this group. Consumers turned their attention to personal recreation and sales in Sporting Goods outlets took off. The group ended 2020 +5.5% vs 2019. The growth accelerated in 2021. January > June set monthly records and March had the most $ of any non-December month in history. June YTD they are +44.6% vs 2020. Avg Annual Growth = +17.5%

All Miscellaneous Stores – Pet Stores were deemed essential but most other stores were not, so closures hit this group particularly hard. Sales hit bottom at -$3.8B in April then began to rebound. They finished with a strong December and ended 2020 down $1.0B, -0.7%. In March sales took off and the channel set a new all-time monthly record of $14.39B in May. However, they beat that record in June with $14.41B. Their YTD sales are now 31.9% above 2020 and 25.1% more than 2019. Their recovery has become very real. YTD Avg Annual Growth = +11.9%

NonStore Retailers – 90% of the volume of this group comes from Internet/Mail Order/TV. The pandemic accelerated the movement to online retail. In February 2020 NonStore $ were +8.6% YTD. In December monthly sales exceeded $100B for the 1st time. They ended 2020 at +21.4%, +$162.9B. This was 63% of the total $ increase for Relevant Retail Channels. Their 2020 performance far exceeded their 12.9% increase in 2019 and every month in 2021 has produced record $. June was +2.0% vs May and +12.0% vs 2020. Their YTD $ are +19.1%. YTD Avg Annual Growth = +18.5%

Note: Almost without exception, online sales by brick ‘n mortar retailers are recorded with their regular store sales.

Recap – 2020 was quite a year. April & May had the 2 biggest year over year sales decreases in history while December sales broke $600B for the first time. 2021 may become even more memorable. March>June became the 4 biggest Retail $ales months in history with the 4 largest year over year monthly sales increases ever. The total increase was +$608B, almost quadruple (3.87 times) the -$157B decrease from March>June 2020. At yearend 2020, Restaurants, Auto and Gas Stations were still struggling but Auto had largely recovered. Relevant retail had segments that also struggled but overall, they led the way for Total Spending to finish the year +0.5% vs 2019. 2021 has grown even more positive. The Auto Segment is setting sales records. Gas Stations, with help from inflation, is all positive vs 2020 and 2019 and thanks to a great June, so are Restaurants. The details show that the recovery in Relevant retail has become real for virtually all channels and monthly sales continue to set records. Retail has recovered but one question remains, “How high can the $ go?”


U.S. Pet Services Spending (Non-Vet) $7.84B (↓$0.97B): 2020 Mid-Year Update

The US BLS released their Mid-Year Update of the Consumer Expenditure Survey covering the period from 7/1/2019 to 6/30/2020. In our analysis of Pet Supplies Spending, we saw the drop in spending sparked by tariffs had now reach 18 months. However, Pet Food Spending turned up, first in the 2nd half of 2019, as it recovered from the FDA warning on grain free dog food. Then it had a huge lift in the 1st half of 2020 as many Pet Parents “panic” bought food due to the onset of the pandemic. Now we turn our attention to Pet Services. The Mid-year numbers show that spending in this segment was $7.84B, down $0.97B (-11.0%) from the previous year. Up until 2018, this segment was known for consistent, small growth. In 2018, increased outlets and competitive prices brought on a wave of new users and spending increased +$1.95B. Spending remained near this new high normal until we reached 2020. March closures due to the pandemic drove spending down $0.78B in the first half so that Pet Services spending returned to the Mid-Year 2018 level. This deserves a closer look. First, we’ll review recent Services spending history since 2014.

Here are the 2020 Mid-Year Specifics:

Mid-Year 2020: $7.84B; ↓$0.97B (-11.0%) vs Mid-Yr 2019

  • Jul > Dec 2019: ↓$0.19B
  • Jan > Jun 2020: ↓$0.78B

Pet Services is by far the smallest industry segment. However, except for 2010 and 2011, the period immediately following the Great Recession, it had consistent annual growth from 2000 through 2016. Spending in Food and Supplies have been on a roller coaster ride during that period. Services Spending more than tripled from 2000 to 2016, with an average annual growth rate of 7.6%. Spending in the Services Segment is the most discretionary in the industry and is more strongly skewed towards higher income households. Prior to the great recession, the inflation rate averaged 3.9% with no negative impact. The recession affected every industry segment, including Services. Consumers became more value conscious, especially in terms of discretionary spending. Services saw a slight drop in spending in both 2010 and 2011, but then the inflation rate fell to the 2+% range and the segment returned to more “normal” spending behavior. In mid-2016 inflation dropped below 2% and continued down to 1.1% by the end of 2017. This was primarily due to increased competition from free standing businesses but also an increase in the number of Pet Stores and Veterinary Clinics offering pet services. While prices still went up slightly, there were deals to be had and consumers shopped for the best price. There was no decrease in purchase frequency. Consumers just paid less so spending fell slightly. In the 2nd half of 2017 spending turned up again. More Consumers began to take advantage of the value and convenience of the increased number of outlets offering Services. This deeper market penetration caused Services Spending to take off in 2018, up $1.95B, by far the biggest annual increase in history. Prices turned up again in the first half of 2019, increasing  2.8% from 2018. However, Services spending inched up $0.09B. In the 2nd half of 2019 Value shopping again came to the forefront as spending fell -$0.19B. Then came 2020 and the pandemic. Many of these nonessential businesses were forced to close and spending fell -$0.78B to $7.84B, the same as Mid-Year 2018.

Let’s take a closer look at some spending demographics – Age and Income.

The graphs that follow we compare spending for the 12 months ending 6/30/20 to the previous 12 months. The graphs also include the 2019 yearend $, so you can see spending changes in the 2nd half of 2019 and the 1st half of 2020.

The first graph is for Income, the single most important factor in increased Pet Spending, especially in Services.

Here’s how you get the change for each half using the Over $70K group as an example:

Mid-yr Total Spending Change: $6.02B – $6.43B = Down -$0.41B (Note green outline = increase; red outline = decrease)

  • 2nd half of 2019: Subtract Mid-19 ($6.43B) from Total 2019 ($6.47B) = Spending was up $0.04B in 2nd half of 2019.
  • 1st half of 2020: Subtract Total 2019 ($6.47B) from Mid-20 ($6.02B) = Spending was down -$0.45B in 1st half of 2020.

  • We again added an Over/Under $100 measurement. You see how Services Spending is skewed towards higher incomes. The halfway spending point is probably about $125K so 20% of CUs spend 50% of Services $. $70K+ had a slight uptick in the 2nd half of 2019 due to $50>$150K. All other big groups trended down in both halves.
  • The two individual groups below $50K declined in both halves. The $30>$50K had the biggest drops and finished down -$0.41B (-41.4%). They gave back most of a 47% increase a year earlier from a spending surge by Retirees.
  • The middle income $50 to $100K showed the least impact of any group. Spending by the $50>$70K was virtually unchanged in both halves. The $70>$100K group had a small lift in the 2nd half of 2019 and showed almost no impact due to the pandemic so they were the only group to finish positive for the year, +$0.11B (+9.8%).
  • The two over $100K groups had the biggest pandemic impact in $, -$0.44B but for the year they actually gained slightly in share of Services $, moving up to 61.0% from 60.2%.
  • Income is the single biggest factor in choosing the discretionary convenience of Pet Services and it appears that the start of the pandemic has made it even stronger.

Now, Services’ Spending by Age Group.

  • There are a multitude of spending patterns, and none are tied specifically to young or old.
  • Last year the 55>64 yr old Boomers had the only overall decrease. This year the 25>34 year olds had the only increase. It was minor and their spending was flat in the 1st half of 2020. Overall, it was quite a turnaround.
  • The 45>64 and 75+ groups had the same pattern with a lift in the last half of 2019, followed by a drop in the first half of 2020. The 35>44 yr and 65>74 groups were down in both halves, but the Gen Xers were down -$0.58B, -32%.
  • The continuing decrease by the 35>44 group is significant . They are now down -$0.75B (-37.5%) from 2018’s $2B.

Now let’s look at what is happening in Pet Services spending at the start of 2020 across the whole range of demographics. In our final chart we will list the biggest $ moves, up and down by individual segments in 11 demographic categories. Remember, the pandemic drop in the 1st half of 2020 was -$0.78B, a big change from +$0.09B in 2019.

Obviously, 2020 has not started out well, due to pandemic closures. In 4 of the 11 categories, all segments spent less on Services. Also, the $ changes from the losers are overwhelming larger than the positives of the winners. The -$0.78B decrease in Pet Services came from 72 of 82 demographic segments (88%) spending less. The negative impact of the pandemic on the Services segment was extremely widespread.

There is only one usual winner – Self Employed and one usual loser – Singles. However, there are many surprises:

Winners:

  • Under 25 yrs
  • High School Grads
  • Rural
  • Gen Z

Losers:

  • Mgrs/Professionals
  • BA/BS Degree
  • Homeowners w/Mtge
  • Gen X

Like the Supplies segment, the younger groups are providing the only positives. However, the groups are much more defined. We also should note than while the <25 group had the only 1st half lift by any age group, the 25>34 year olds had the only Mid-Yr 12 month lift for any age group and held their Services spending ground in the 1st half of 2020.

The 1st half 2020 positives are coming from specific groups of the youngest Americans, – <25 yrs old, Gen Z (mostly singles) and young, small families – 3 people, Oldest Child 6>17. 4 person CUs also increased spending in 2020 and Millennials were only down slightly -$0.01B. The importance of the younger groups continues to grow as the Baby Boomers must ultimately “pass the torch”.

In 2018 the Services segment reached a new level of prominence in the Pet Industry. In 2019 spending dropped slightly. Then came the pandemic and spending fell sharply. How did we get to this point and what comes next?

We have noted that by 2017 the number of outlets offering Pet Services had radically increased. This created a highly competitive market and the inflation rate dropped to near record lows. Value conscious consumers saw that deals were available, and they took advantage of the situation. However, they didn’t increase the frequency of purchase. They just paid less. This drove overall Pet Services spending down in the 1st half of 2017. The segment started to recover in the 2nd half but not enough to prevent the first annual decrease in Pet Services spending since 2011. However, it was a start. In 2018, more consumers started to recognize the convenience offered by more outlets. The latest big food upgrade was also winding down. The result was that Services started a deeper penetration into the market, especially in the younger groups. The < 45 groups spent $1.47B more on Services in 2018, 74% of the total $1.95B increase in the segment. After such a big lift, a slight downturn in 2019 was not unexpected and it happened, -$0.1B. Then came 2020. Many Services outlets were deemed nonessential and forced to close due to the pandemic. Services Spending fell -$0.78B.

What will happen in the 2nd half of 2020? There was no national mandate so re-openings were dependent upon local decisions. It’s likely that we will see a further decline. One thing hasn’t changed. Pet Services have become an important option that is exercised by an increasing number of Pet Parents. Now, in 2021 America has “opened up”. The Services segment should rebound strongly. We’ll get the full year 2020 data in September and the 1st half of 2021 in May 2022.

U.S. PET SUPPLIES SPENDING $16.28B (↓$1.43B): MID-YR 2020 UPDATE

In our analysis of Pet Food spending, we saw that spending grew in the 2nd half of 2019 then skyrocketed in the beginning of 2020 largely due to Pandemic Panic buying. There was no Panic in Pet Supplies and spending continued its steady decline from its 2018 peak. Mid-Year 2020 Pet Supplies spending was $16.28B, down $1.43B (-8.1%). The continuing spending drop in 2020 puts spending in this segment below the level of 3 years ago in Mid-Yr 2017. The following chart should put the recent spending history of this segment into better perspective.

Here are this year’s specifics:

  • Mid Yr 2020: $16.28B; ↓$1.43B (-8.1%) from Mid Yr 2019. The -$1.43B came from:
    • Jul > Dec 2019: ↓$0.90B
    • Jan > Jun 2020: ↓$0.54B

Like Pet Food, Pet Supplies spending has been on a roller coaster ride. However, the driving force is much different. Pet Food is “need” spending and has been powered by a succession of “must have” trends. Pet Supplies spending is largely discretionary, so it has been

impacted by 2 primary factors. The first is spending in other major segments. When consumers ramp up their spending in Pet Food, like upgrading to Super Premium, they often cut back on Supplies. However, it can go both ways. When they value shop for Premium Pet Food, they take some of the saved money and spend it on Supplies. The other factor is price. Pet Supplies prices reached their peak in September of 2009. Then they began generally deflating and in March 2018 were down -6.7% from 2009. Although it is not a hard and fast rule, Price inflation in this largely discretionary segment can retard sales, usually by reducing the frequency of purchase. On the other hand, price deflation generally drives Supplies spending up. Innovation can “trump” both of these influencers. If a new “must have” product is created, something that significantly improves the pet parenting experience, then consumers will spend their money. The perfect example of this is the successive waves of new food trends. Unfortunately, we haven’t seen much significant innovation in the Supplies segment recently.

Recent history gives a perfect example of the Supplies roller coaster. In 2014 Supplies prices dropped sharply, while the movement to Super Premium Food was barely getting started – Supplies spending went up $2B. In 2015, consumers spent $5.4B more on Pet Food. At the same time, Pet Supplies prices went up 0.5%. This was a “killer” combination as Supplies spending fell $2.1B. In 2016 consumers value shopped for Food, saving $2.99B. Supplies spending stabilized by mid-year then increased by $1B in the second half when prices fell sharply. Consumers spent some of their “saved” money on Supplies. Supplies prices continued to deflate throughout 2017. Food spending increased $4.61B in 2017 but this came from a limited group, generally older CUs, less focused on Supplies. The result was a $2.74B increase in Supplies spending. This appeared to be somewhat of a break with the overall pattern of trading $ between segments.

In the first half of 2018 Pet Food spending slowed to +$0.25B. Supplies’ prices switched from deflation to inflation but were only up 0.1% versus the first half of 2017. During this period Supplies Spending increased by $1.23B. Prices began to climb in the second half of 2018 due to impending new tariffs in September. By June 2019 they were 3.4% higher than 2018. The impact of the tariffs on the Supplies segment was very clear. Spending became flat in the second half of 2018, then took a nosedive in the 1st half of 2019, -$2.09B. Prices stayed high for the rest of 2019 and spending fell an additional -$0.9B. In 2020 prices turned up again through March before plummeting, -3.8% by June. Spending dropped an additional -$0.54B. Initially, the pandemic had no positive impact on Supplies spending. We expect that to change in the second half. More time with their pets and lower prices usually means more Supplies spending.

Let’s take a closer look at the data, starting with the two most popular demographic measures – age and income. The graphs that follow will show both the current and previous 12 months $ as well as 2019 yearend. This will allow you to track the spending changes between halves.

The first graph is for Income, which has been shown to be the single most important factor in increased Pet Spending, especially in Pet Supplies and both of the Service segments.

Here’s how you get the change for each half using the $50>70K group as an example:

Mid-yr Total Spending Change: $1.58B – $2.43B = Down $0.85B (Note: green outline = increase; red outline = decrease)

  • 2nd half of 2019: Subtract Mid-19 ($2.43B) from Total 2019 ($1.93B) = Spending was down $0.50B in 2nd half of 2019.
  • 1st half of 2020: Subtract Total 2019 ($1.93B) from Mid-20 ($1.58) = Spending was down $0.35B in 1st half of 2020.

  • I added an under/over $100K measurement to the graph. As you can see, the share of Supplies spending “flips” based upon the $70>$100K group. That means that the “break even” dividing line is probably slightly above the average CU income of $83.8K. The Supplies $ of CUs above average, 33% is equal to the 67% of CUs below average.
  • There are only 2 spending patterns in the individual segments – drops in both halves or increases in both halves.
  • The decrease in Supplies Spending was widespread across income groups. Both over and under $70K trended down while over $100K was basically flat. The two segments with increases were an unlikely pair – $150K+ and $30>$50K. The higher income group is to be expected but the lower income group is a surprise. $30>50K is the income range for Retirees but it’s not them. It is likely driven by the younger crowd.
  • The spending movement, whether up or down, is gradual. In most cases the $ changes in each half are very close.
  • The two factors, high prices and the onset of the pandemic had very little impact on the over $100K group. It was basically “business as usual”. The biggest negative came from the <$30K and the $50>$70K groups. Their spending fell -$1.43B, likely due to a reduced purchase frequency. There’s no Supplies binge spending yet. Maybe that will come in the 2nd half of 2020 with the big drop in prices?

Now let’s look at Pet Supplies spending by Age Group.

  • Generally, the over 35 group spent less while under 35 spent a little more but there was a mix of patterns.
  • The <25 and 25>34 year olds had opposite patterns for the halves. If there was any “binge” pet supplies spending due to the pandemic, it came from the 25>34 year old Millennials.
  • The 35>54 yr olds, Gen X, were down in both halves, probably due to value shopping and slightly reduced frequency.
  • The 55> group also had a mixture. The 75> were down in both halves. The Boomers were divided. The 65>74 yr olds had a small pandemic lift while spending dropped sharply for the 55>64 group. This drop was correlated to helping to pay for their huge panic buy of Pet Food.

Now let’s look at what is happening in Supplies spending at the start of 2020 across the whole range of demographics. In our final chart we will list the biggest $ moves, up and down by individual segments in 11 demographic categories.

  • The first thing that you notice is that the biggest decreases are radically larger than the biggest increases.
  • The decrease is widespread but not as bad as last year when in 5 of the 11 categories all segments spent less on Supplies. In the 1st half, 27 segments, 33% spent more. This is up from 22 in the 2nd half of 2019 and much better than 8 last year. There’s a long way to go but things are slowly improving in the Supplies segment.
  • There are some “usual suspects” in the winners – Mgrs/Professionals & Adv College Degree and losers – Singles & Blue Collar. There are also some surprise winners – $30>49K & Hispanic and losers – BA/BS & Suburban. However, most of the winners & losers reflect the young vs old pattern that we saw in the age analysis.
  • The young positives are reflected in these winners – 25>34, Center City, 4 people, Married, oldest child 6>17, 2 earners and of course, Millennials. The older losers are no earner singles, homeowner w/no mtge, 55>64, suburban and of course, Baby Boomers.
  • Here’s a hidden positive. Minorities were +$0.12B in the 1st half. African Americans were down slightly, -$0.01B but Asians and Hispanics spent $0.13B more.

The 24 month Spending winning streak for Supplies which began in the second half of 2016 came to an end in the second half of 2018. During that time spending on Pet Supplies increased $4.97B (+33.5%). It was also widespread across America. Of 82 separate demographic segments, only 1 spent less on Supplies in that period – the Greatest Generation. This 92+ year old group has now become too small to be accurately measured.

What are the market conditions that affect Supplies spending? We have to first note that the world changed for Supplies because of the great recession. Prices have generally deflated since then and spending in the segment became more sensitive to changes in price. Prices go up…spending drops, usually due to reduced purchase frequency. Prices go down… spending turns up. This situation did not exist prior to the recession.

The other factor is spending in other segments, especially Food. Pet spending comes out of “one bucket”. A big increase in one segment can result in a cut back in others and big savings can generate more spending. The recent upgrade to Super Premium Food was such a big $ commitment that it magnified this effect.

In 2018, something new was added – outside influence. The FDA warning on grain free dog food had an immediate, negative impact on the Food segment. For Supplies, it was added tariffs. Prices in the Supplies segment began to turn up in the Spring. By June 2019, they were 3.4% higher than 2018. Supplies spending flattened out then plummeted in the 1st half of 2019. Prices stabilized at the high level and Supplies $ continued to fall. Then came the start of the pandemic. This spurred huge panic buying in food but not supplies. In fact, the huge lift in Food probably contributed to Supplies continued decline. I expect Supplies to rebound strongly in the 2nd half . We’ll get the data in September.

Retail Channel Monthly $ Update – April Final & May Advance

In May 2020  the Retail market began its recovery after hitting bottom in April. The road back has been long and complex and Consumer spending behavior continues to evolve. In this report we will track the changes, migration between channels and the retail recovery with data from two reports provided by the U.S. Census Bureau.

The Reports are the Monthly Retail Sales Report and the Advance Retail Sales Report. Both are derived from sales data gathered from retailers across the U.S. and are published monthly at the same time. The Advance Report has a smaller sample size so it can be published quickly – about 2 weeks after month end. The Monthly Final Report includes data from all respondents, so it takes longer to compile the data – about 6 weeks. Although the sample size for the Advance report is smaller, the results over the years have proven it to be statistically accurate with the final monthly reports. The biggest difference is that the full sample in the Final report allows us to “drill” a little deeper into the retail channels.

We will begin with the Final Retail Report for April and then move to the Advance Retail Report for May. Remember, the retail impact of the pandemic began in March 2020, peaked in April, then recovery started in May. We will compare 2021 to both 2020 and 2019 to document the progress that the retail market has made towards a full recovery.

Both reports include the following:

  • Total Retail, Restaurants, Auto, Gas Stations and Relevant Retail (removing Restaurants, Auto and Gas)
  • Individual Channel Data – This will be more detailed in the “Final” reports and we fill focus on Pet Relevant Channels

The information will be presented in detailed charts to facilitate visual comparison between groups/channels of:

  • Current Month change – % & $ vs previous month
  • Current Month change – % & $ vs same month in 2020 and 2019
  • Current YTD change – % & $ vs 2020 and 2019
  • Monthly and Year To Date $ will also be shown for each group/channel

First, the April Final. Retail hit bottom in April but began recovery, hitting record $ in December. In January & February $ fell but were still records for those months. Sales skyrocketed in March, setting a new all time $ record. In April $ fell a bit but it were still the 2nd best in history. Here are the major retail groups. (All Data is Actual, Not Seasonally Adjusted)

The final total is $9.1B more than the Advance report projected a month ago. Led by Relevant Retail, all groups were up. The specifics were: Relevant Retail: +$5.8B Auto: +$1.9B; Restaurants: +$1.2B; Gas Stations: +$0.2B. Sales vs March were mixed but Total Retail $ were still the 2nd highest of all time. Total $ales broke $600B for the 1st time in December and has now done it 3 times. Auto has the strongest recovery and is in fact prospering – annual YTD growth rate since 2019 is +12.8%. Except for the spending dips by 2 groups vs March, all but Restaurants were positive in all other measurements. Restaurants are still slightly negative vs 2019 but the Retail recovery is strong.

Now, let’s see how some Key Pet Relevant channels were doing in April.

  • Overall– 8 of 11 channels were down vs March but 9 of 11 were up vs April 2020 and 10 vs April 2019. In YTD $, 10 were up vs 2020 and 10 vs 2019. 9 were up vs both. April was down vs March, but still strong.
  • Building Material Stores – Their amazing lift continues. The ongoing surge came as a result of pandemic spending patterns developed in 2020. Consumers began focusing on their homes. Now we’re moving into the 2021 Spring lift, with Farm Stores again leading the way. Sporting Goods stores are not in this group but have a similar spending pattern. Sales took off in May, hit a record peak in December and continued strong into 2021, peaking in March. April $ fell slightly but are +124% vs 2020 and +58% vs 2019. YTD they are even +53% vs 2019.
  • Food & Drug – Supermarkets were +$77.7B in 2020. $ are down vs March and YTD 2020 due to last year’s binge buying. They are still up over 13% vs April 2019 and YTD 2019. Drug Stores ended up +$17B (+5.7%) for 2020. Their $ fell in April after a setting a record in March. All other measurements are positive and YTD $ are +5.8%.
  • General Merchandise Stores – $ in all channels fell in Jan & Feb then spiked in March. In April, sales in all but $ stores declined. Discount Store were having problems even before the pandemic, but now even they seem to have largely recovered, +8.7% YTD vs 2019. Clubs/SuperCtrs and $ Stores remain strong. These channels promote value. Their success vs both 2020 and 2019 reinforces its importance in Consumer spending decisions.
  • Office, Gift & Souvenir Stores– $ declined slightly from March but were +159% vs April 2020. The pandemic hit them hard. They are still down vs 2019 – monthly and YTD. Recovery is a long way off, but things are improving.
  • Internet/Mail Order – Although $ dropped in April the pandemic continues to accelerate this channel’s growth. In April of 2020, their YTD growth rate was +17.1%. In April 2021, it is +25.4% – a 48.5% increase.
  • A/O Miscellaneous – This is a group of small to midsized specialty retailers – chains and independents. It includes Florists, Art Stores and Pet Stores (22>24% of total $). Pet Stores were usually essential, but most stores were not. In May 2020 they began their recovery. Their 2020 total sales were up +11.6%. Although April $ were down from March, YTD sales are +31.4% vs 2020 and +46.9% vs 2019. This rivals the Internet. It’s looking good!

The Relevant Retail Segment began recovery in May, reached a record level in December, then $ fell in Jan & Feb. March sales set a record for the month, then the $ fell slightly in April. Almost all channels are showing growth. Currently the key drivers are the Internet, SuperCtrs/Clubs/$ Stores and Hdwe/Farm. Now, here are the Advance numbers for May.

2020 will always be a memorable year for both its traumas and triumphs. In April & May we experienced the 2 biggest retail spending drops in history, but the problems actually began in March. Retail sales began to recover in June and in October, YTD Total Retail turned positive for the 1st time since February. In December, Total Retail broke the $600B barrier – a historic first. While sales fell from their December peak, monthly sales records were set in both January and February. Then they took off again in March, breaking $600B again while setting a new monthly sales record of $633.1B. April sales were down slightly but were the second highest in history. Restaurant $ were down slightly from 2019. This was the only negative vs 2020 or 2019 for any group. In May, Auto had a slight, -0.1% decrease from April. All other groups increased sales. The result was yet another Total Retail spending record, $644.4B. Restaurants were still down slightly YTD vs 2019. Once again, this was the only negative for any big group vs 2020 or 2019. Some other areas of the economy are still suffering, and some spending behavior has changed but the overall Retail marketplace has strongly recovered.

Total Retail – In March, Total Retail hit $633.1B, a record for the most spending in any month in any year. In April, $ales dipped to $616.7B but were still $218.4B more than April 2020 – a record increase, which was more than double the size of last year’s record drop. That brings us to May. As we said, sales set another new record, $644.4B. Moreover, the current YTD average annual sales growth rate since 2019 is 8.7%, the strongest ever in records going back to 1992. Total Retail has not just recovered. It is stronger than ever.

Restaurants – This is the only big group with any negative measurements vs 2020 or 2019 . Last February YTD sales were up 8.1% vs 2019. The Pandemic changed that. Restaurants started to close or cease in person dining in March and sales fell -$33.3B (-52.5%) compared to March 2019. Sales bottomed out in April at $30.1, the lowest April sales since 2003. Sales started to slowly increase in May but never reached a level higher than 88% compared to the previous year. 2021 started off slowly. Through February,  YTD sales were down -16.7% from pre-pandemic 2020 and -10.0% from 2019. In March sales took off and grew steadily in April and May. Sales in both months exceeded 2019. YTD their $ are ahead of 2020 but still $6.3B (-2.0%) behind 2019. They are not “there yet” but their recovery is gaining strength.

Auto (Motor Vehicle & Parts Dealers)   – Staying home causes your car to be less of a focus in your life. Sales began to fall in March and hit bottom in April. Auto Dealers began combating this “stay at home” attitude with fantastic deals and a lot of advertising. It worked. They finished 2020 up 1% vs 2019 and have returned to a strong positive pattern in 2021. The “attitude” grew amazingly positive in March and slowed only slightly in April & May as sales exceeded $143B in all 3 months, by far the 3 biggest months in history. To show how well consumers responded to their campaign you just need to look at the data. This group has exceeded $110B in monthly sales only 11 times in history. 9 of those occurred after the onset of the pandemic.  YTD Avg Annual Growth Since 2019 = +13.0% – the best performance of any big group.

Gas Stations – Gas Station $ales have been a mixed bag. If you drive less, you visit the gas station less often. Sales turned down in March 2020 and reached their low point in April. They moved up but generally stayed about 15% below 2019 levels for the rest of 2020. In February they were still behind 2020 in monthly and YTD $ but ahead of 2019 in both measurements. In March, sales skyrocketed. They increased slightly in April and May and were 56.7% above May 2020. They have been positive in all measurements vs both 2019 and 2020 since March. Their comeback continues but there is another factor that must be considered – inflation. Gas prices can be pretty volatile. They dipped in the first 2 months of the pandemic but then returned to more normal levels for the balance of 2020. They began strongly inflating in 2021. In fact, the May 2021 prices were 56.9% above May 2020. That means that 100% of the 56.7% year over year lift in May came from higher prices. Analyzing retail can be complicated. YTD Annual Avg Growth Rate Since 2019 = +2.9%

Relevant Retail – Less Auto, Gas and Restaurants – This is what we consider the “core” of U.S. retail and has traditionally accounted for about 60% of Total Retail Spending. When you look at the individual channels in this group, you see a variety of results due to many factors – non-essential closures, binge buying, online shopping and a consumer focus on “home”. However, overall, April 2020 was the only month in which spending in this group was down vs 2019. Monthly $ales exceeded $400B for the first time ever in December ($407B). They finished 2020 up $260B, +7.1%. Their performance was the only reason that Total Retail was able to finish 2020 with positive numbers, +0.5%. Sales fell in January and February but set monthly records. In March they turned sharply up again, then dipped slightly in April but May brought the 2nd highest $ of all time. Currently, they are up $56.0B, +17.4% vs May 2020 and  +$260.2B, +17.5% YTD. We should note that that while December 2020 is still #1, March ($374.7B), April ($366.8B) and May ($378.9B) of 2021 are three of the five highest monthly totals of all time. It is also important that the Relevant Retail group has posted positive numbers versus last year and YTD for every month since April 2020 and their average YTD growth rate since 2019 now stands at +10.0%. Through May virtually all channels have now turned positive vs both 2020 and 2019. However, the primary drivers throughout the pandemic were and continue to be Nonstore, Grocery, SuperCenters/Clubs/$ Stores plus a never ending “spring lift” from Hardware/Farm and Sporting Goods.

Now let’s look at what is happening in the individual retail channels to see where the $ are coming from. May beat both April and March, and you will see that one of the increases vs 2020 was again literally “off the charts”. The groups are less defined than in the Final Monthly reports and we will look across the whole market, not just pet relevant outlets.

Sales in 10 of 13 channels were up vs April and 11 were up vs May 2020 $. Only 1 was down vs 2020 YTD while a different channel was down vs 2019 numbers. (Relevant Retail YTD Avg Annual Growth Rate since 2019 = +10.0%)

After hitting bottom in April 2020, Relevant Retail has now beaten the previous year’s $ for 13 consecutive months. The group set an all-time record of $407B in December and finished  2020 +$260B vs 2019. 2021 started strong, with record sales in every month. March > May ranked #2, #4 & #5 of all time. Essential channels are still the primary drivers:

  • Nonstore Retailers – The biggest driver. Online shopping continues to grow in # of households and in $.
  • Food & Beverage – Grocery– Restaurant $ are improving but consumers continue to eat & drink more at home.
  • Bldg Materials/Garden/Farm– Their “Spring” lift continues unabated as consumers focus on their home.
  • SuperCtrs/Club/Value/$ Strs – They keep the GM channel positive. Value is still a major consumer priority.

Regarding the Individual Large Channels (Includes YTD Avg Annual Growth Rate since 2019)

General Merchandise Stores – Sales bounced back in May and all numbers are positive. Department Stores $ remain up vs 2020 but down vs 2019. They were having problems before the Pandemic. After dipping to +7.5% in February, the growth rate by Club/SuperCtr/$ stores has remained near the current 8.7%. These stores are still the key to this channel.

  • YTD Avg Annual Growth: All GM = +6.9%; Dept Stores = -1.8%; Club/SuprCtr/$ = +8.7%

Food and Beverage, plus Health & Personal Care Stores – Sales in Grocery were down in March>May from 2020 – No surprise, as these were 2020 binge months – especially March. The Health, Personal Care group finished 2020 at +1.8%. 2021 has started even better. With strong March > May sales, YTD they are +11.2% vs 2020 and +9.3% vs 2019.

  • YTD Avg Annual Growth: Grocery = +6.7%; Health/Drug Stores = +4.5%

Clothing and Accessories; Electronic & Appliances; Home Furnishings – March, April and May have been spectacular for all these channels. The increase vs May 2020 was again literally off the chart for Clothing. All of these groups were up vs April and remain positive in all measurements vs 2020 or 2019 for the 3rd consecutive month.

  • YTD Avg Annual Growth: Clothing = +2.7%; Electronic/Appliance = +2.3%; Furniture = +10.2%

Building Material, Farm & Garden & Hardware – Their Spring lift began on time in 2020 and has never stopped. They have greatly benefited from consumers focusing on their home needs. They finished 2020 +53B (+13.8%). Sales took off in March, set a record in April then dipped slightly in May. They are +21.1% YTD vs 2020. Avg Annual Growth = +15.0%

Sporting Goods, Hobby and Book Stores – Book & Hobby stores are open but Sporting Goods stores have driven the lift in this group. Consumers turned their attention to personal recreation and sales in Sporting Goods outlets took off. The group ended 2020 +5.5% vs 2019. The growth accelerated in 2021. January > May set monthly records and March had the most $ of any non-December month in history. May YTD they are +55.2% vs 2020. YTD Avg Annual Growth = +17.3%

All Miscellaneous Stores – Pet Stores were deemed essential but most other stores were not, so closures hit this group particularly hard. Sales hit bottom at -$3.8B in April then began to rebound. They finished with a strong December and ended 2020 down $1.0B, -0.7%. In March sales took off and the channel set a new all-time monthly record of $14.3B in May. Their YTD sales are now 33.2% above 2020 and 24.0% more than 2019. It appears that their recovery has become very real. YTD Avg Annual Growth = +11.4%

NonStore Retailers – 90% of the volume of this group comes from Internet/Mail Order/TV. The pandemic accelerated the movement to online retail. In February 2020 NonStore $ were 8.6% YTD. In December monthly sales exceeded $100B for the 1st time. They ended 2020 at +21.4%, +$162.9B. This was 63% of the total $ increase for Relevant Retail Channels. Their 2020 performance far exceeded their 12.9% increase in 2019 and every month in 2021 has produced record $. May was -0.2% vs April but still +8.2% vs 2020 and YTD $ are +21.0%. YTD Avg Annual Growth = +18.2%

Note: Almost without exception, online sales by brick ‘n mortar retailers are recorded with their regular store sales.

Recap – 2020 was quite a year. April & May had the 2 biggest year over year sales decreases in history while December sales broke $600B for the first time. 2021 may become even more memorable. March>May became the 3 biggest $ales months in history with the 3 largest year over year monthly sales increases ever. The total increase was +$513B, almost triple (2.93 times) the -$175B decrease from March>May 2020. At yearend 2020, Restaurants, Auto and Gas Stations were still struggling but Auto had largely recovered. Relevant retail had segments that also struggled but overall, they led the way for Total Spending to finish the year +0.5% vs 2019. 2021 has started out even more positive. The Auto Segment is setting sales records. Gas Stations $, with help from inflation, are now all positive and YTD Restaurant $ are only slightly below 2019. As documented in the report, the recovery in Relevant retail has become real for virtually all channels and monthly sales continue to set records. Retail has recovered. The new question is, “How high can the $ go?”

U.S. PET FOOD SPENDING $37.96B (↑$9.06B): MID-YEAR 2020 UPDATE

Overview of Pandemic Impact on the Survey & Data

The Pandemic has had a tremendous impact on consumers. It also impacted information gathering, including the Consumer Expenditure Survey which is managed by the US BLS and conducted by Census Bureau personnel. After March 8th nothing was done in person. In person Interviews moved online or to phone calls. Hard copy diaries were no longer collected. This process was also moved online or to phone calls where consumers read their diaries to agents over the phone. This had little impact on the interview reports. Initially there was a 5% drop in the response rate but that soon returned to normal. The Diary collection was a different story. The response rate plummeted by 50%. The US BLS immediately added additional households to the survey to make up for nonrespondents. Things improved as consumers and workers adjusted to the new normal, but the initial months were difficult. Through conscientious selection of participants, the US BLS was able to generate unbiased results. The variation for Total Spending in the 2020 report was 0.94% which is actually better than 2019’s 1.2%. That’s not to say that there were not some exceptions. Pet Food was one. The variation is within acceptable levels but is still substantially higher than 2019. We will address this in the Pet Food spending report that follows.

To put Pet Food spending into better perspective, let’s look at the impact of COVID on Consumer income & spending.

INCOME – Avg CU income $83.9K, +3.3%; 61% of the increase did occur in the 2nd half of 2019.

  • Total U.S. Income – $11.0T, Up $318B (+3.0%); 2nd Half 2019 was +$254B; 1st Half 2020 was +$64B.

SPENDING – Avg CU Spending – $61.7K, Down -1.1%; 2nd Half 2019 was +1.0%; 1st Half 2020 was -2.0%  

  • Total U.S. Spending – $8.1T, Down $116B (-1.4%); 2nd Half 2019 was +$108B; 1st Half 2020 was -$224B.

#CUs – 131.4M, Down 403K, -0.3% from a year ago but down 873K, -0.7% from the yearend 2019 all-time high of 132.2M. The onset of the Pandemic slowed the increased in income, but spending flipped negative, which is not unexpected.

Now Pet Food Spending

The report shows Pet Food (& Treat) Annual Spending at $37.96B, up $9.06B (+31.4%). The following charts and observations were prepared from calculations based upon data from that report and earlier ones. The first chart will help put the $37.96B into historical perspective and truly show you the roller coaster ride that is Pet Food Spending.

Here are the current numbers:

  • Mid 2020: $37.96B; $9.06B (+31.4%) from Mid-2019. The net +$9.06B in Mid 2020 came from:
    • Jul>Dec 2019: Up $2.30B from
    • Jan>Jun 2020: Up $6.76B from 2019.

Historical research has shown that Pet Food spending has been on a roller coaster since 2000, with 2 years up, followed by a flat or even declining year. This up and down “ride” has been driven by a succession of Food trends. The most recent were “Natural” in 2011 and “Super Premium” in 2014. Another factor was added in 2013 – deflation. As consumers opted for higher quality, more expensive pet food, competition became more intense, with the Internet now becoming a key player. 2013 was a definitely a game changer for this segment as it began an extended period of deflation which continued through 2018. Midway through 2018, Pet Food prices were still 2.3% lower than in 2013.

The spending drops in 2013 and 2016 were driven by pet parents value shopping for their recently upgraded pet food.

As it turns out, 2014 brought out yet another new factor in Pet Food spending. For over 30 years Baby Boomers have been the leaders in the Pet Food, both in spending and in adopting new products. They still spend the most, but it turns out that the 25>34 year old Millennials led the movement to Super Premium in late 2014. The older groups, especially Boomers followed in 2015 and spending rose $5.4B. At the same time, the Pet Food spending of the 25>34 yr olds dropped. At first, we thought they had rolled back their upgrade. However, it turns out they were leading the way in another element of the trend to Super Premium – value shopping. The Boomers once again followed their lead and spending fell -$2.99B in 2016. For consumers, the Super Premium upgrade movement consisted of 3 stages:

  1. Trial – The consumer considers the benefits vs the high price and decides to try it out. Usually from a retail outlet.
  2. Commitment – After a period of time, the consumer is satisfied and is committed to the food.
  3. Value Shop – After commitment, the “driver” is to find a cheaper price! – The Internet, Mass Market, Private label

This brought us to 2017. Time for a new “must have” trend. That didn’t happen but the competitive pricing situation brought about another change. Recent food trends have been driven by the higher income and higher education demographics. However, the “value” of Super Premium was established and now more “available”. Blue Collar workers led a new wave of spending, +$4.6B, as Super Premium more deeply penetrated the market. After the big lift in 2017, 2018 started off slowly, +$0.25B. Then came the FDA warning on grain free dog food. Many of the recent Super Premium converts immediately rolled back their upgrade and spending fell -$2.51B. This 2018 decrease broke a 20 year spending pattern. In the 1st half of 2019, Pet Food spending remained stable at the new lower level. In the second half of 2019 we started to see a recovery from the overreaction to the FDA warning and spending increased by $2.3B. Then came 2020. The recovery was continuing but a new outside influence was added which had a massive impact on U.S. consumers – the COVID-19 pandemic. In March nonessential businesses were closed. This also produced a wave of panic buying in some truly essential product categories. In the Pet Industry there is only 1 truly essential category – Pet Food. Coupled with the FDA “recovery” and the ongoing movement to Super Premium, this produced an incredible $6.76B lift in Pet Food Spending in the 1st half of 2020.

Let’s look at Pet Food spending by the 2 most popular demographic measures – age & income. The graphs are divided into larger groups than usual. This helps to mitigate any reporting anomalies. They still show both the current and previous 12 months $ as well as 2019 yearend. This will allow you to track the spending changes between halves.

The first graph is Income, which has been shown to be the single most important factor in increased Pet Spending. Here’s how you get the change for each half using the $70K+ group as an example:

$70K+ Mid-yr Total Spending Change: $25.10B – $16.82B = Up $8.28B (green outline = increase; red outline = decrease)

  • 2nd half of 2019: Subtract Mid-19 ($16.82) from Total 2019 ($19.01B) = Spending was up $2.19B in 2nd half of 2019.
  • 1st half of 2020: Subtract Total 2019 ($19.01B) from Mid-20 ($25.10B) = Spending was up $6.09B in 1st half of 2020.

  • We see 2 distinct spending patterns. Both have a small increase in the 2nd half of 2019 which is then followed either by a bigger lift or a drop in the 1st half of 2020. The $50>$100K group is the driving force behind the 1st half drop and it was big enough to bring the whole <$100K group down.
  • Perhaps the most obvious fact is the spending disparity due to income. Prior to the Super Premium era, $70K was the “halfway point” in Pet Food spending. In 2013 the under $70K group accounted for 67.8% of CUs and 51.3% of Pet Food spending (Performance: Share $/Share CUs = 75.7%). In the Mid-year 2019 report they had fallen to 59.1% of CUs and 41.8% of Pet Food $ (Performance = 70.7%). In this year’s report their share of CUs continued to drop to 57.0% but their share of Pet Food $ plummeted to 33.9% (Performance = 59.5%). Today’s true halfway point is probably about $120K but I added an under/over $100K measurement to get closer to the halfway point.
  • < $70K > Surprisingly, the Pet Food spending patterns for both groups are the same. Both show a small lift in the second half of 2019 as spending begins to recover from the negative impact of the FDA warning. A larger lift then happens in the 1st half of 2019. The FDA recovery continued but we also see the panic spending due to the onset of the pandemic. Obviously, this binge buying came mostly from higher incomes, who could more easily afford it.
  • < $50K This lowest income group closely matches the spending pattern of the highest income, $100K+ group. While income is increasingly becoming the most important factor in Pet Food Spending, it is not the only factor.
  • $50 > $100K – This middle income group was going along fine, recovering from the FDA warning in the 2nd half of 2019. Then came the pandemic and their spending dropped in the 1st half of 2020. The -$2.31B decrease was big enough to drive their spending for the 12 month period down -$1.85B (-20.0%). Based upon the numbers for <$70K and <$50K groups this drop in spending was equally divided between $50>$70K and $70>$100K. Even in “normal” times these low to middle income groups face a lot of pressure trying balance their manifold responsibilities with their take home pay.
  • $100K+ High income is increasingly becoming “where it’s at” in all Pet Spending. In Mid-2020, it went through the roof for Pet Food, +$9.2B (+80.6%). This is where the binge buying of Super Premium Foods happened.
  • < $100K > Although the actual halfway point for this year’s Pet Food spending is probably about $120K, $100K is much closer than $70K. The $100K+ group has 28.3% of CUs but 54.3% of Food $. (Performance = 191.9%) That’s great performance but 1 year ago it was 149.0%, which is not too bad. If we go back to 2013, the $100K+ group had 18.3% of CUs and 28.7% of Pet Food $. (Performance = $156.3%) This shows that the spending pattern has always been there. However, the single biggest factor is the growth in number of CUs. Since 2013 that has increased by 14.1 million, +61.4%. When you break the $100K income barrier, you spend more on your pets and Super Premium Pet Foods are a great “opportunity” for your added disposable income.

Now let’s look at Pet Food spending by Age Group.

Once again, we have bundled segments into larger groups to mitigate the impact of any larger percentages of variation that may be present in smaller segments.

  • We have 3 groups and 3 different patterns so age has a definite impact on spending behavior.
  • Under 35 – This group had a -$0.65B (-13.1%) drop in spending. The drop was basically equal in both halves of the 12 month period. However, most was driven by the <25 group, especially in the 1st half of 2020. Both the 25>34 and <25 groups spent a little less per CU, which may be due to value shopping, but the decline in spending was primarily due to a 2 million decrease in <25 CUs. 83% of this drop (1.7M) occurred in the 1st half of 2020. They likely moved back home with their parents and took their pets with them. This would explain part of the big lift in the 55+ group. Also, the 55+ yr olds likely spent more on premium foods.
  • 35 > 54 – This is the highest income group, but they also have the highest level of career and family responsibilities. They were finishing their FDA recovery in the 2nd half of 2019, +$1.09B. Then came COVID and Pet Food $ dropped -$1.43B. Their income was unaffected, but they dialed back their total CU spending by 2.7% and Pet Food by 11.6%. Much of the 1st half pet food drop was undoubtedly due to value shopping, likely on the internet.
  • 55 and older – This group, which includes all Baby Boomers, had a spending lift in both halves. The $1.52B increase in the second half of 2019 was largely driven by the ongoing recovery from the FDA warning. The spectacular $8.53B lift in the 1st half of 2020 came from a variety of factors. First and foremost was undoubtedly the panic buying of Super Premium pet foods. Remember, these are primarily Baby Boomers, the first Pet Parents. This type of reaction is to be expected. The other factors were a 2.1 million (+4%) increase in CUs and the 2+ million younger CUs who probably moved back home with their parents, bringing their pets with them. The increase was driven by the 55>64 year olds who have the highest income and were best able to handle the situation.
  • Spending in the under 55 group was up slightly in the 2nd half of 2019 but down in the 1st half of 2020. The over 55 group was up in both halves and were the only driver of the massive 1st half increase.

That gives us the “big picture” for our 2020 Mid-year update of Pet Food spending. In a “normal” year we would drill down into the performance of individual segments. However, the variations caused by the initial pandemic information gathering problems show up in individual segments, especially smaller ones. This has less impact on the total numbers but makes comparing segment performance within categories difficult.

The big lift in the 1st half of 2020 may be a little overstated but it comes as no surprise. We all saw pictures of empty shelves from consumers panic buying certain essential items. In the Pet Industry there is no more essential item than Pet Food and the current preference is for Super Premium. It isn’t called Super Premium for no reason. It costs a lot and usually comes in smaller quantities so stocking for a possible emergency can mean spending big bucks.

It also is no surprise that Boomers are behind the big lift. Their unwavering devotion to their Pet Children is what largely built today’s Pet Industry. In my research of the data, I came across an interesting correlation. The overall variation in sampling for Pet Food spending was within acceptable guidelines. The problem showed up in some individual segments.

Here are a few with exceptionally high Pet Food spending and high variation:

  • 55>64 Yr olds (Boomers)
  • Married Couple, oldest child over 18
  • Self-Employed
  • 2 Earners
  • Income $100>150K
  • Live in area <2500 pop.

Based upon our past knowledge, a CU with these characteristics is basically the ultimate Pet Food spending household. These are Super Pet Parents. They are beyond conscientious regarding their pets so it would be expected that they would be the mostly likely to respond to a survey conducted under the difficult circumstances caused by the pandemic. This could give their big $ Pet Food spending a disproportionate share of the sample and significantly drive up the mean. We should also note that this big variation was in Pet Food and not widespread in their responses. The variation in Total Spending was low for these segments with a high of 3.27%. All others were below 2.5%. This means that the US BLS and Census Bureau successfully conducted a survey that was demographically representative with no overall bias. The pet food spending may be a little high, but it is extremely likely that there was a big lift in the 1st half of 2020.

We are left with the usual answer in the Pet Industry…It was the Boomers. They get the credit for the big lift and possibly the “blame” for the big variation.

Even with new techniques, the sampling response returned to a more normal level in the 2nd half of 2020. We look forward to seeing the full year data for 2020 in September.