Retail Channel Monthly $ Update – October Final & November Advance
The Retail market hit bottom in April 2020 then began its recovery. The journey has been long and complex and Consumer spending behavior continues to evolve. We have not beaten the virus yet so we will continue to track the ongoing recovery of the retail marketplace with data from two reports provided by the U.S. Census Bureau.
The Reports are the Monthly Retail Sales Report and the Advance Retail Sales Report. Both are derived from sales data gathered from retailers across the U.S. and are published monthly at the same time. The Advance Report has a smaller sample size so it can be published quickly – about 2 weeks after month end. The Monthly Final Report includes data from all respondents, so it takes longer to compile the data – about 6 weeks. Although the sample size for the Advance report is smaller, the results over the years have proven it to be statistically accurate with the final monthly reports. The biggest difference is that the full sample in the Final report allows us to “drill” a little deeper into the retail channels.
We will begin with the Final Retail Report for October and then move to the Advance Report for November. Remember, the retail impact of the pandemic began in March 2020, peaked in April, then recovery started in May. We will compare 2021 to both 2020 and 2019 to document the progress that the retail market has made towards a full recovery.
Both reports include the following:
- Total Retail, Restaurants, Auto, Gas Stations and Relevant Retail (removing Restaurants, Auto and Gas)
- Individual Channel Data – This will be more detailed in the “Final” reports and we fill focus on Pet Relevant Channels
The information will be presented in detailed charts to facilitate visual comparison between groups/channels of:
- Current Month change – % & $ vs previous month
- Current Month change – % & $ vs same month in 2020 and 2019
- Current YTD change – % & $ vs 2020 and 2019
- Monthly and Year To Date $ will also be shown for each group/channel
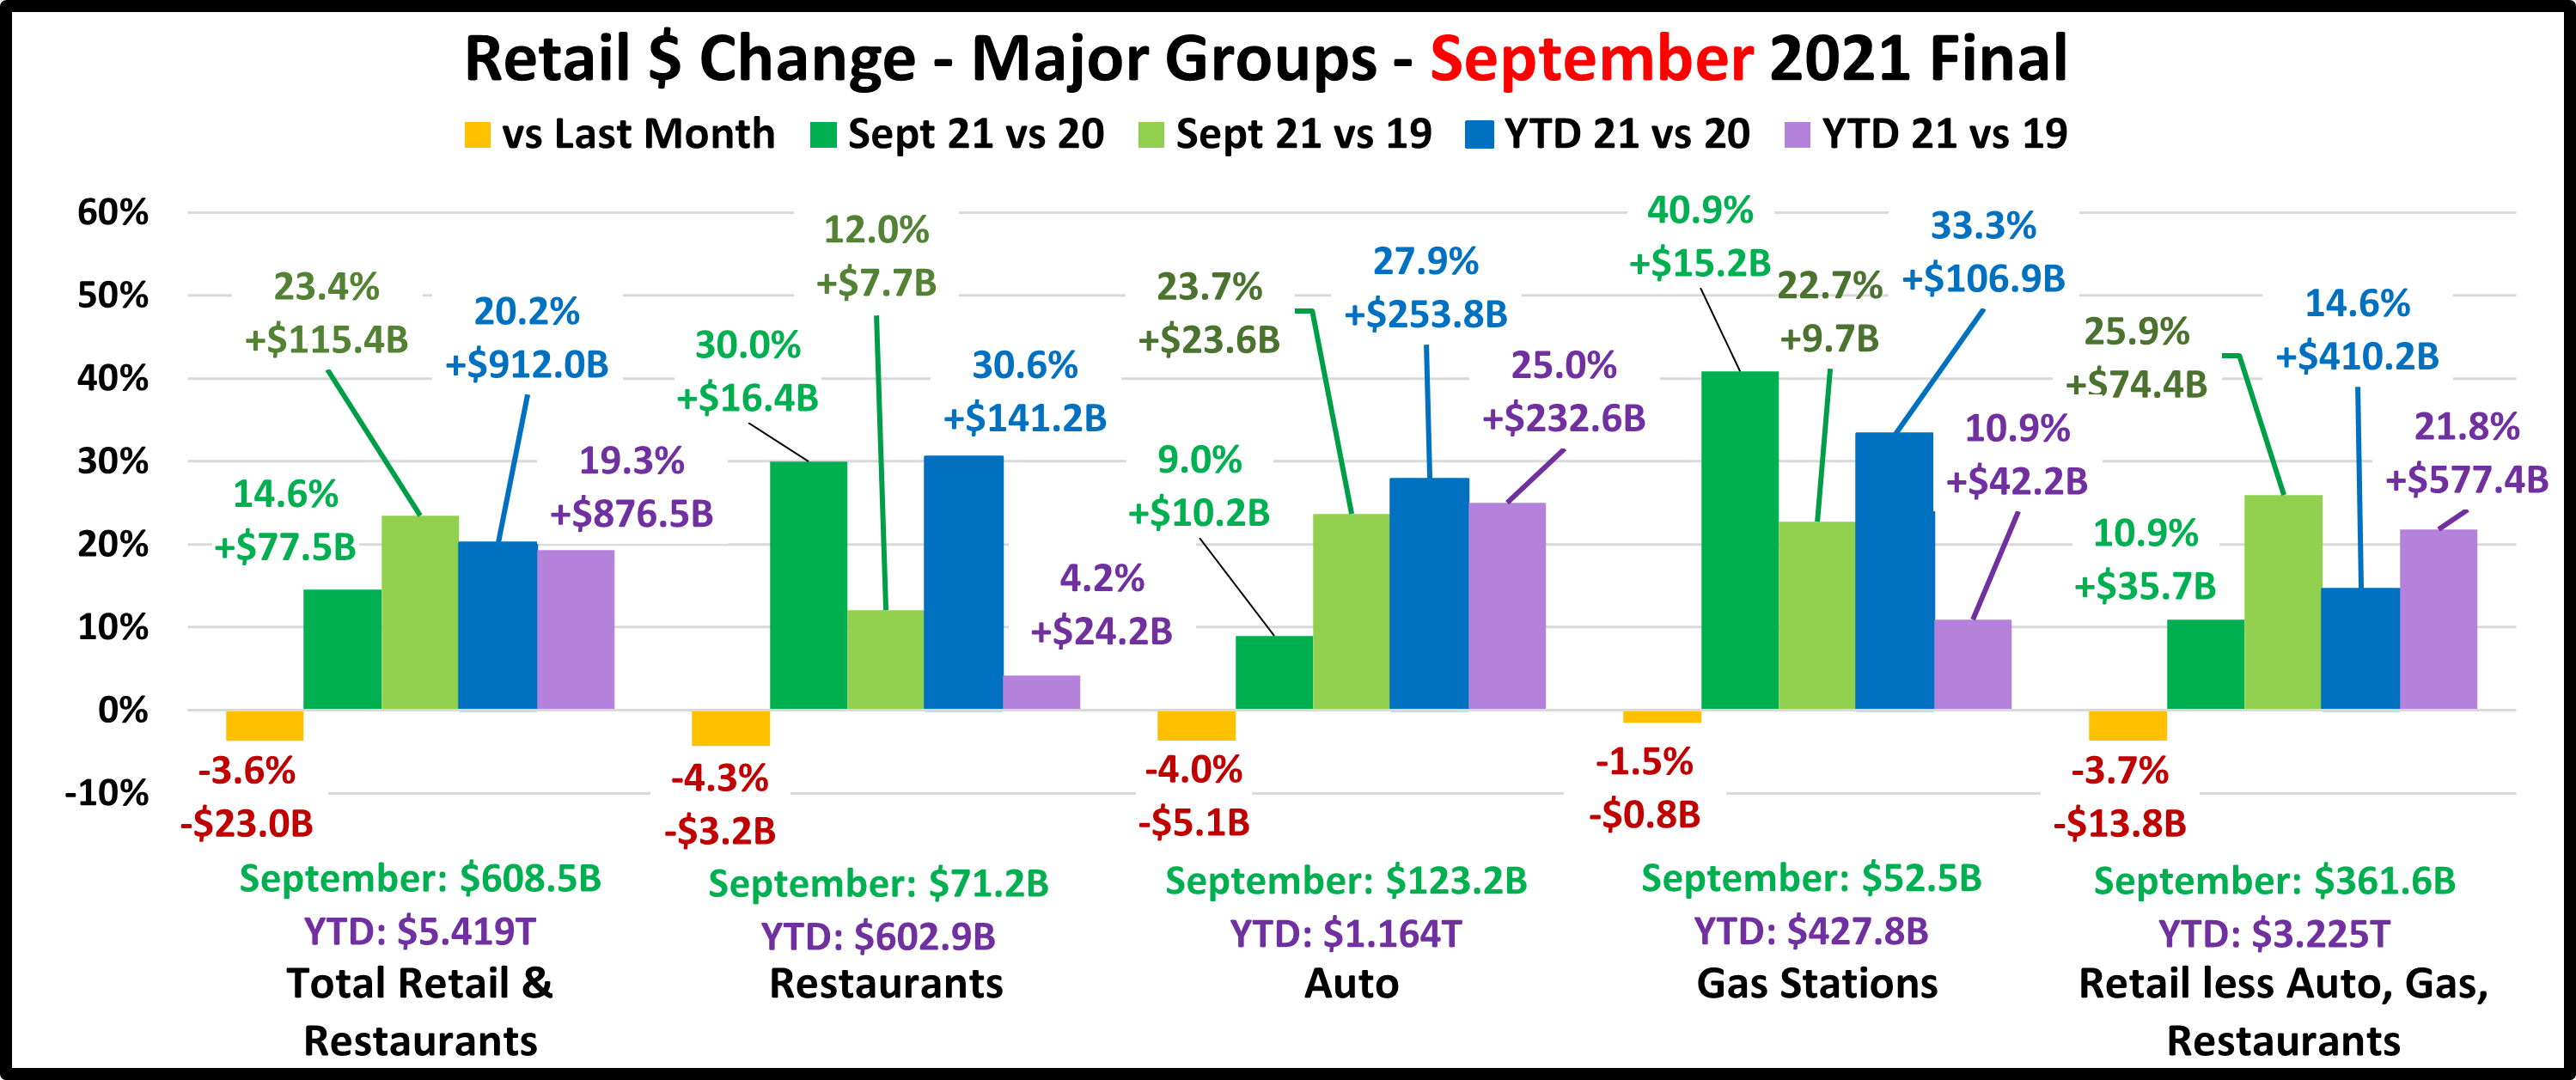
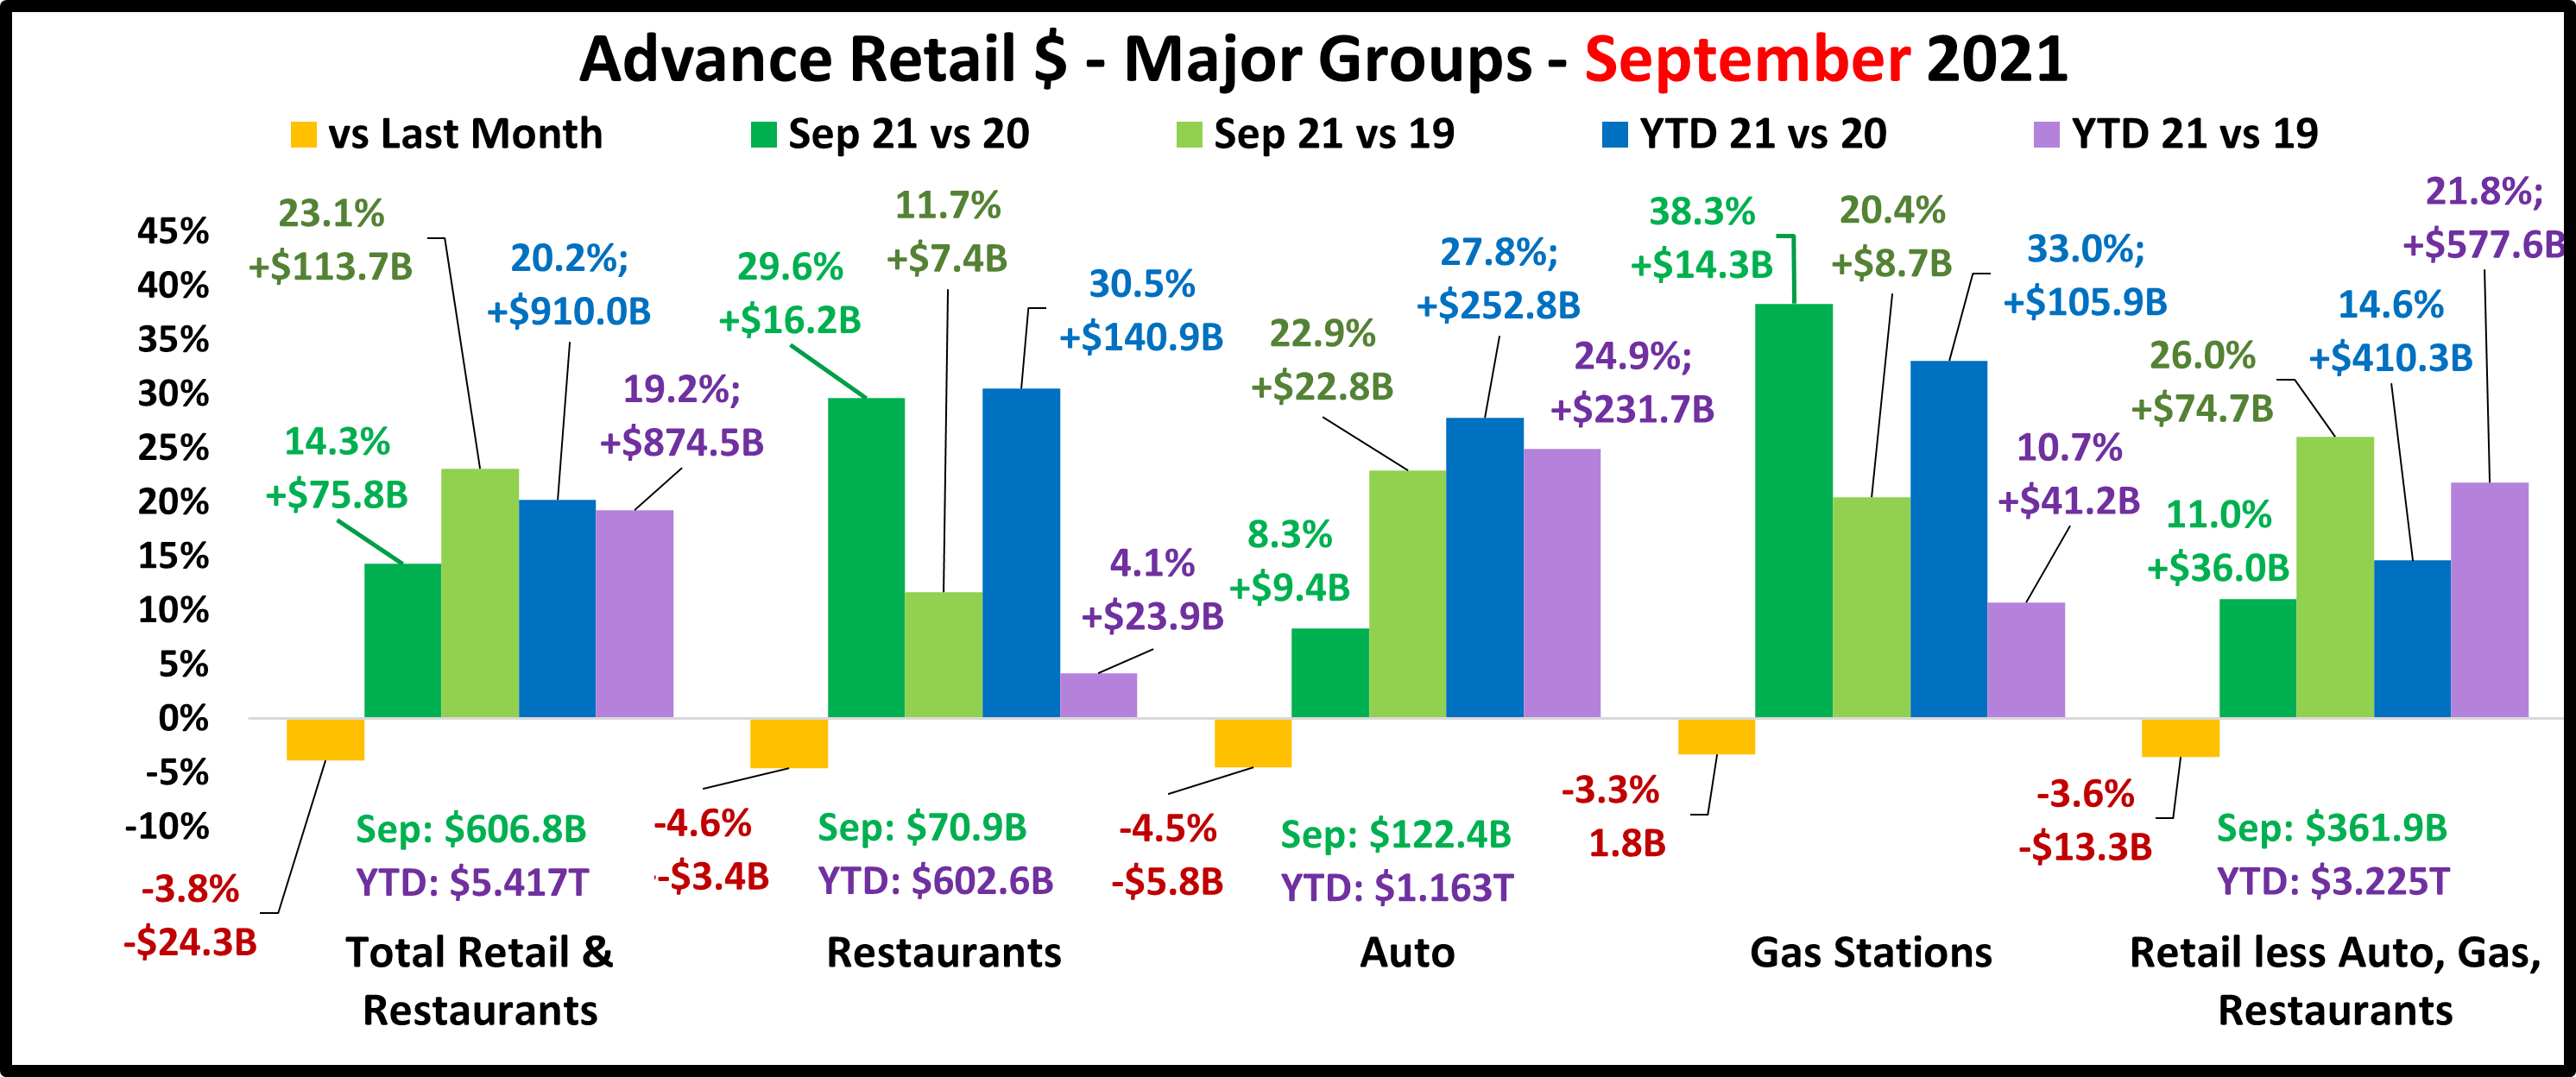
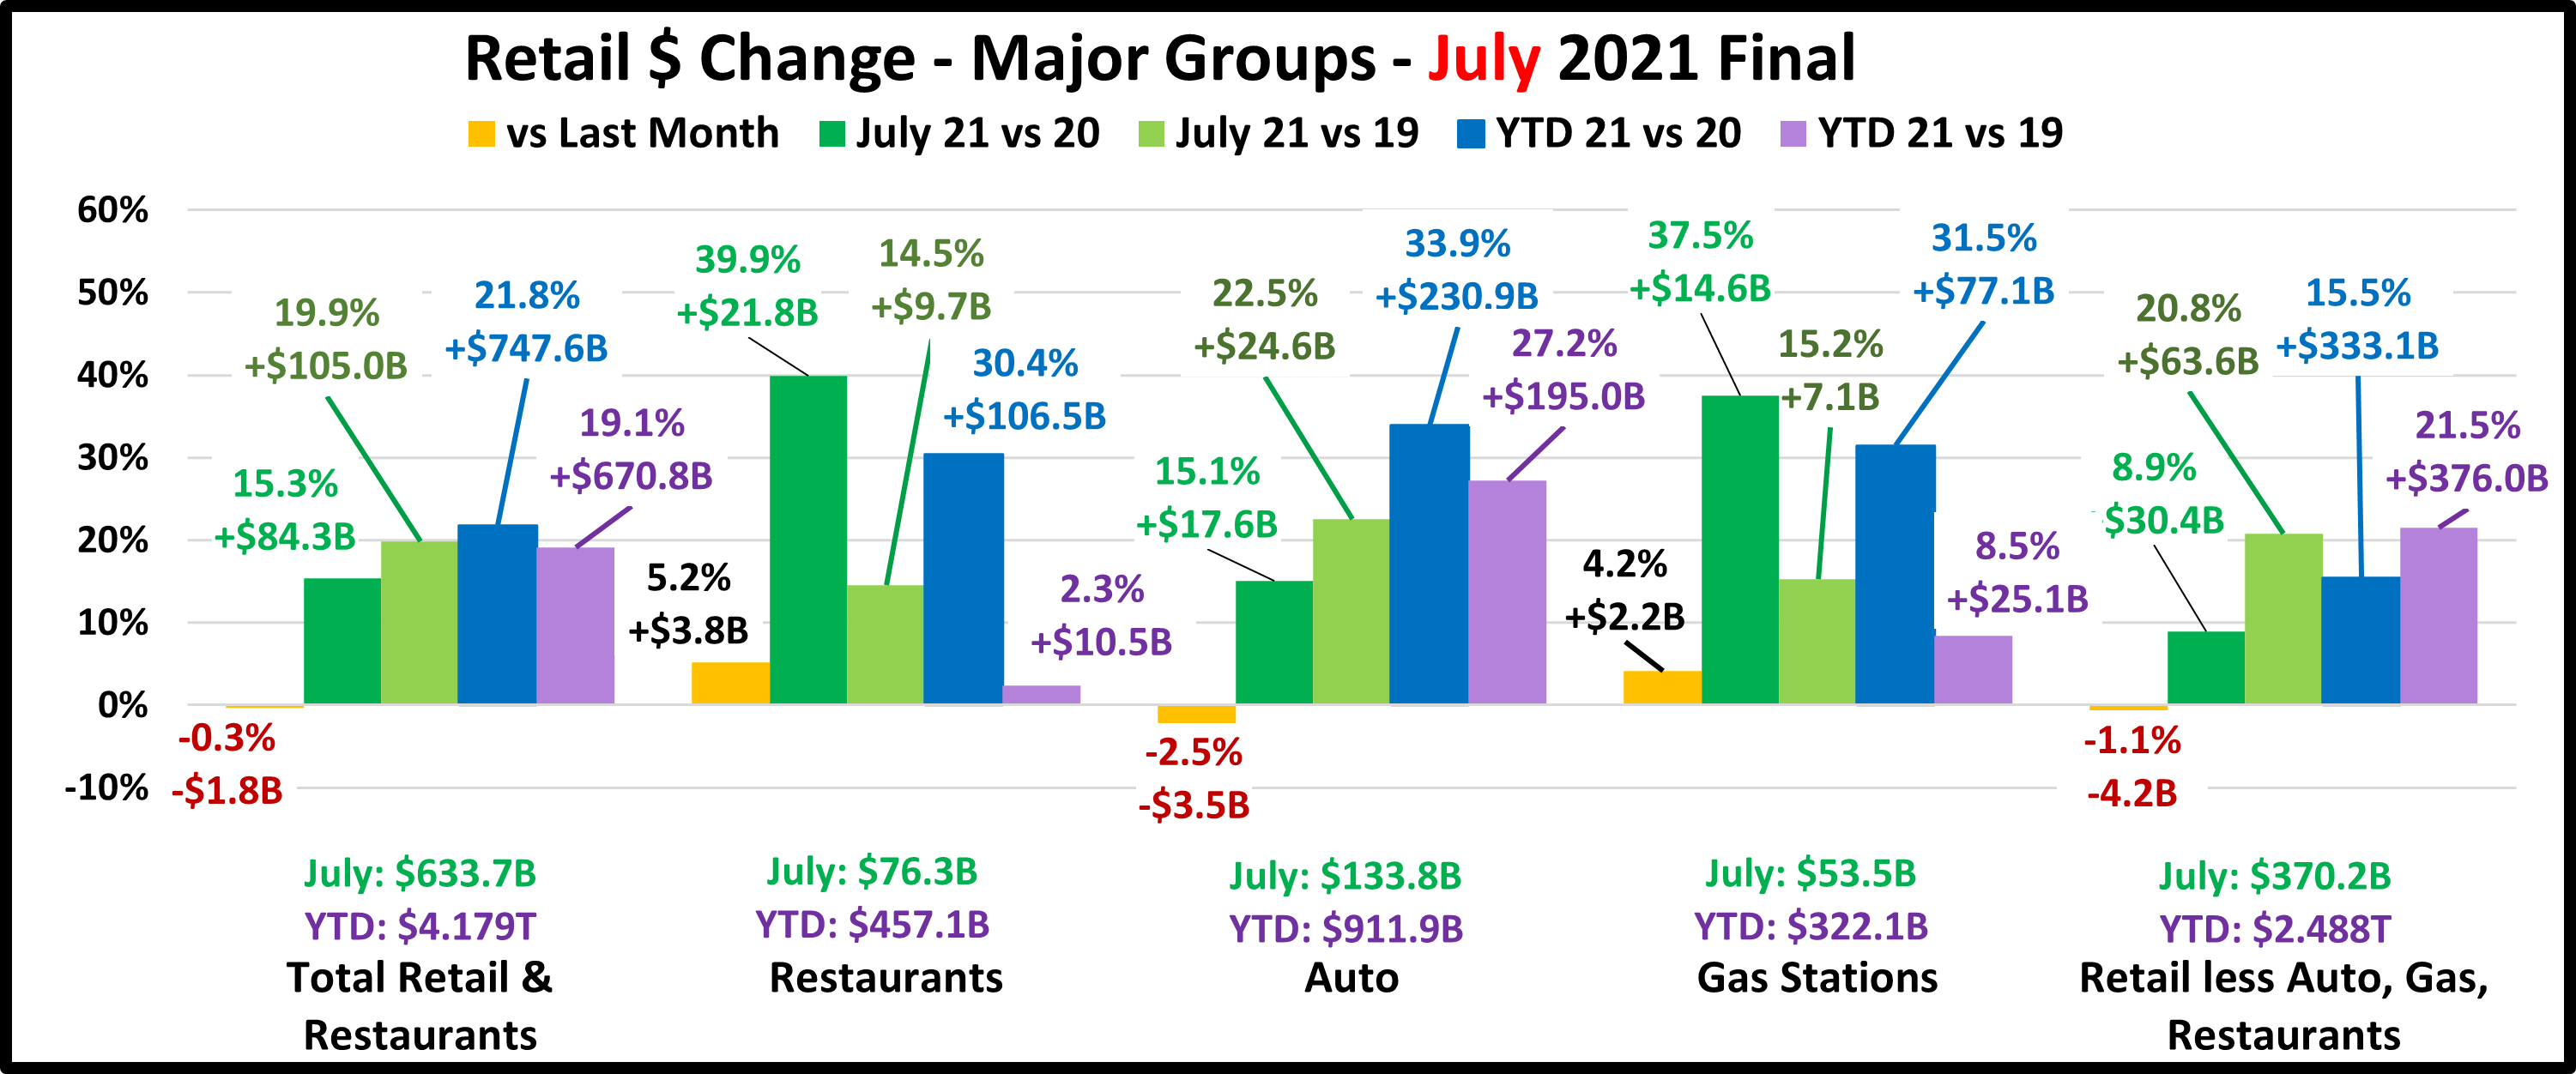
First, the October Final. Retail hit bottom in April 2020 but began recovery, hitting record $ in December. $ fell in January/February but set a new $ records in March and then again in May. Sales declined through September but turned up in October. Here are the major retail groups. (All $ are Actual, Not Seasonally Adjusted)
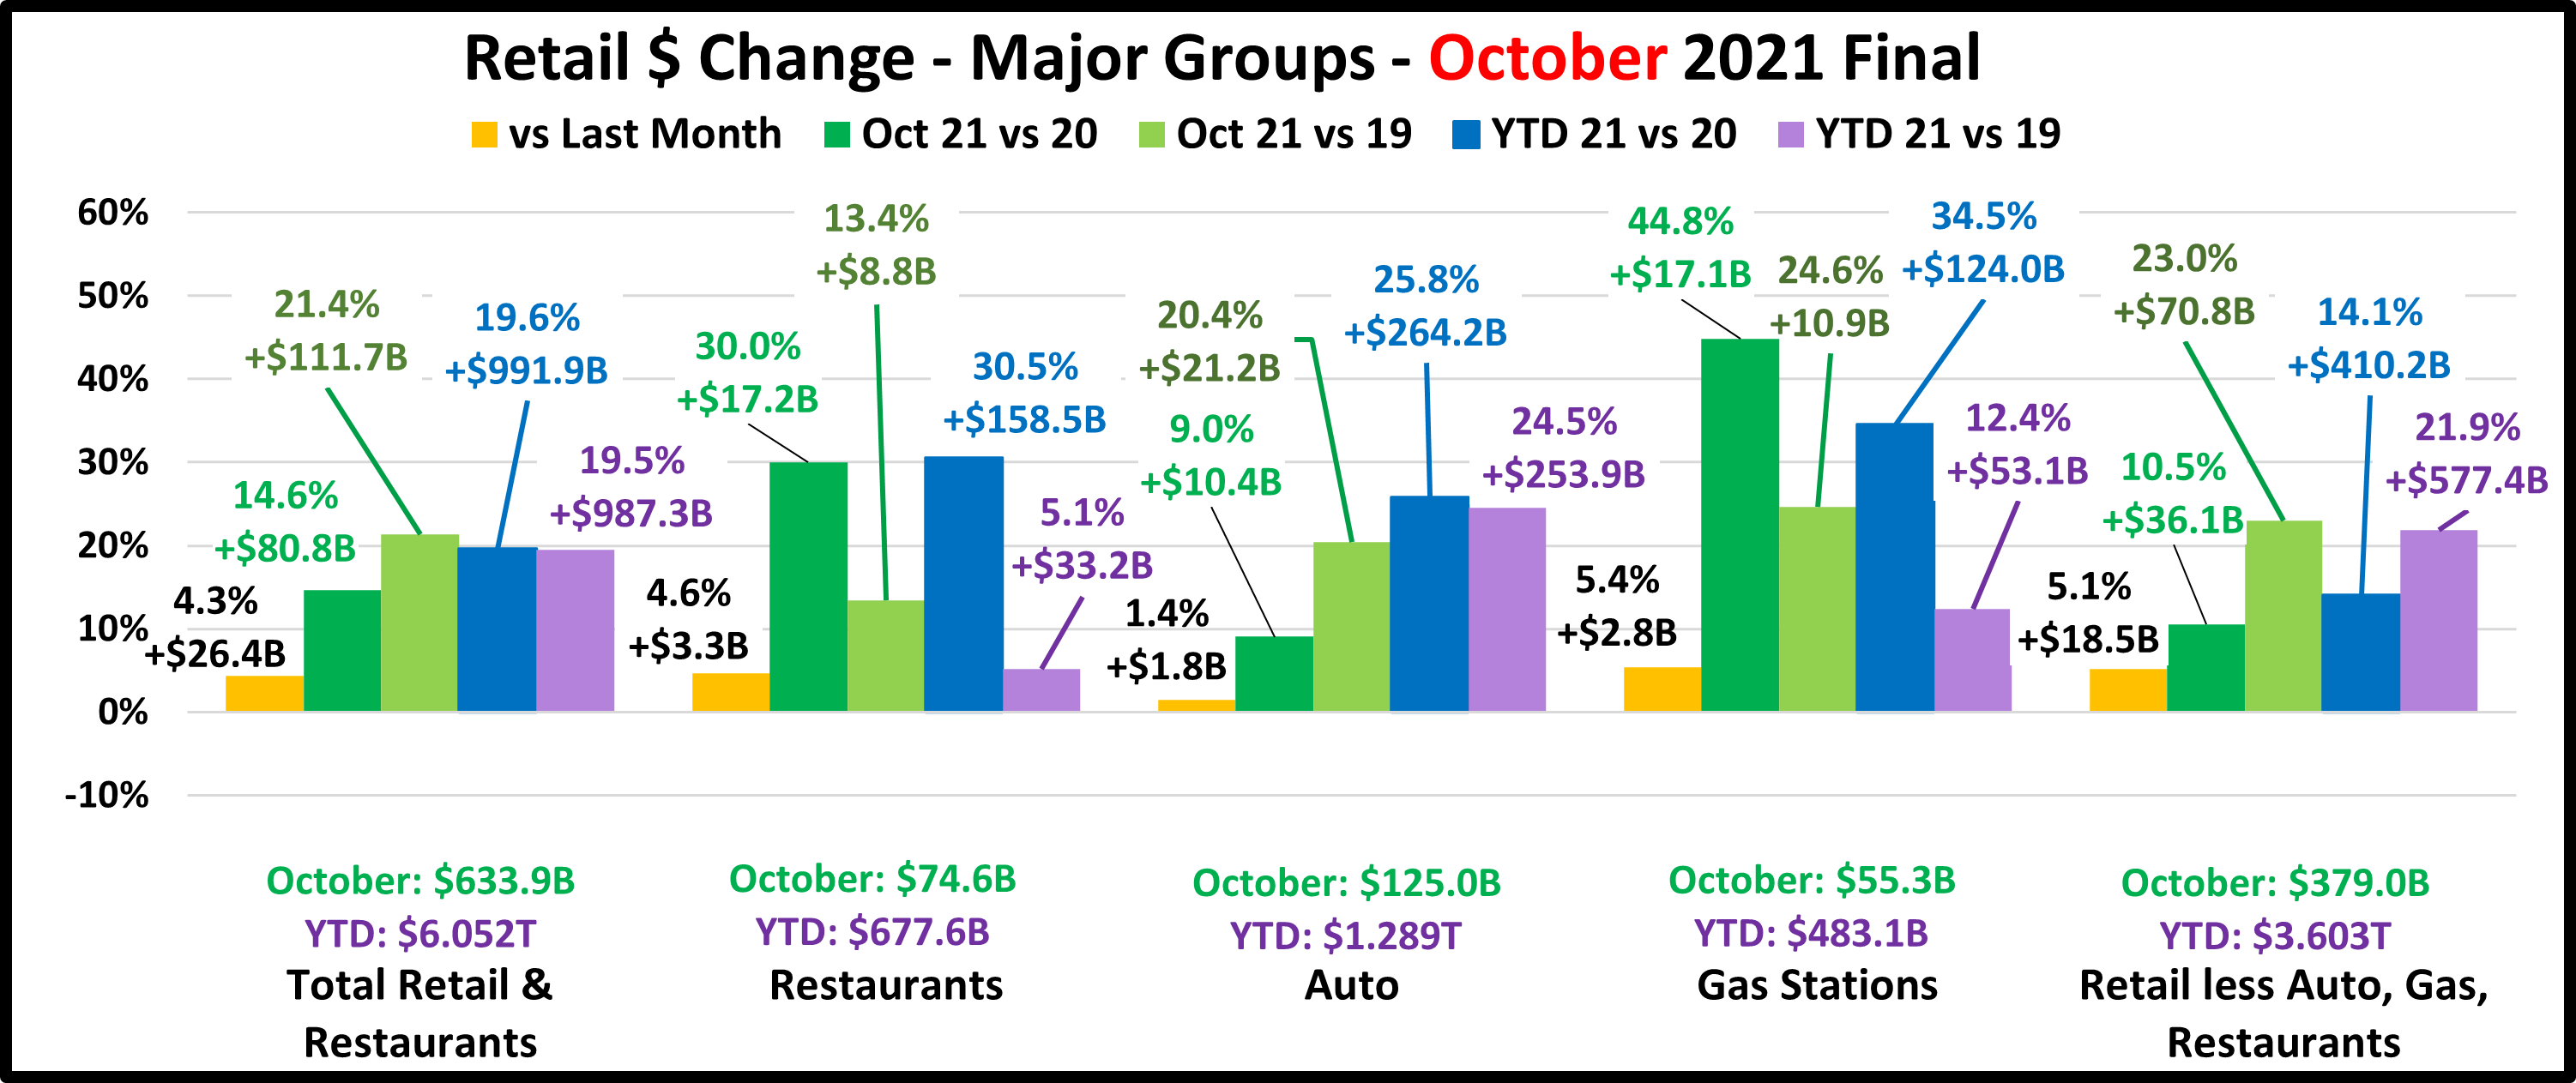
The final total is $0.7B less than the Advance report projected a month ago. All groups but Restaurants were down slightly. The specifics were: Relevant Retail: -$0.8B; Gas Stations: -$0.1B; Auto: -$0.3B; Restaurants: +$0.5B. Sales vs September were up in all groups. Total Retail $ales broke $600B for the 1st time in December. October sales beat that number and in fact were the 4th highest of all time. Auto continues to have the strongest recovery with an annual YTD growth rate since 2019 of +11.6%. While a spending dip in September is the “norm” in U.S. Retail, so is an October rebound. Importantly, for the 5th consecutive month, all groups were positive in all measurements vs 2020 or 2019.
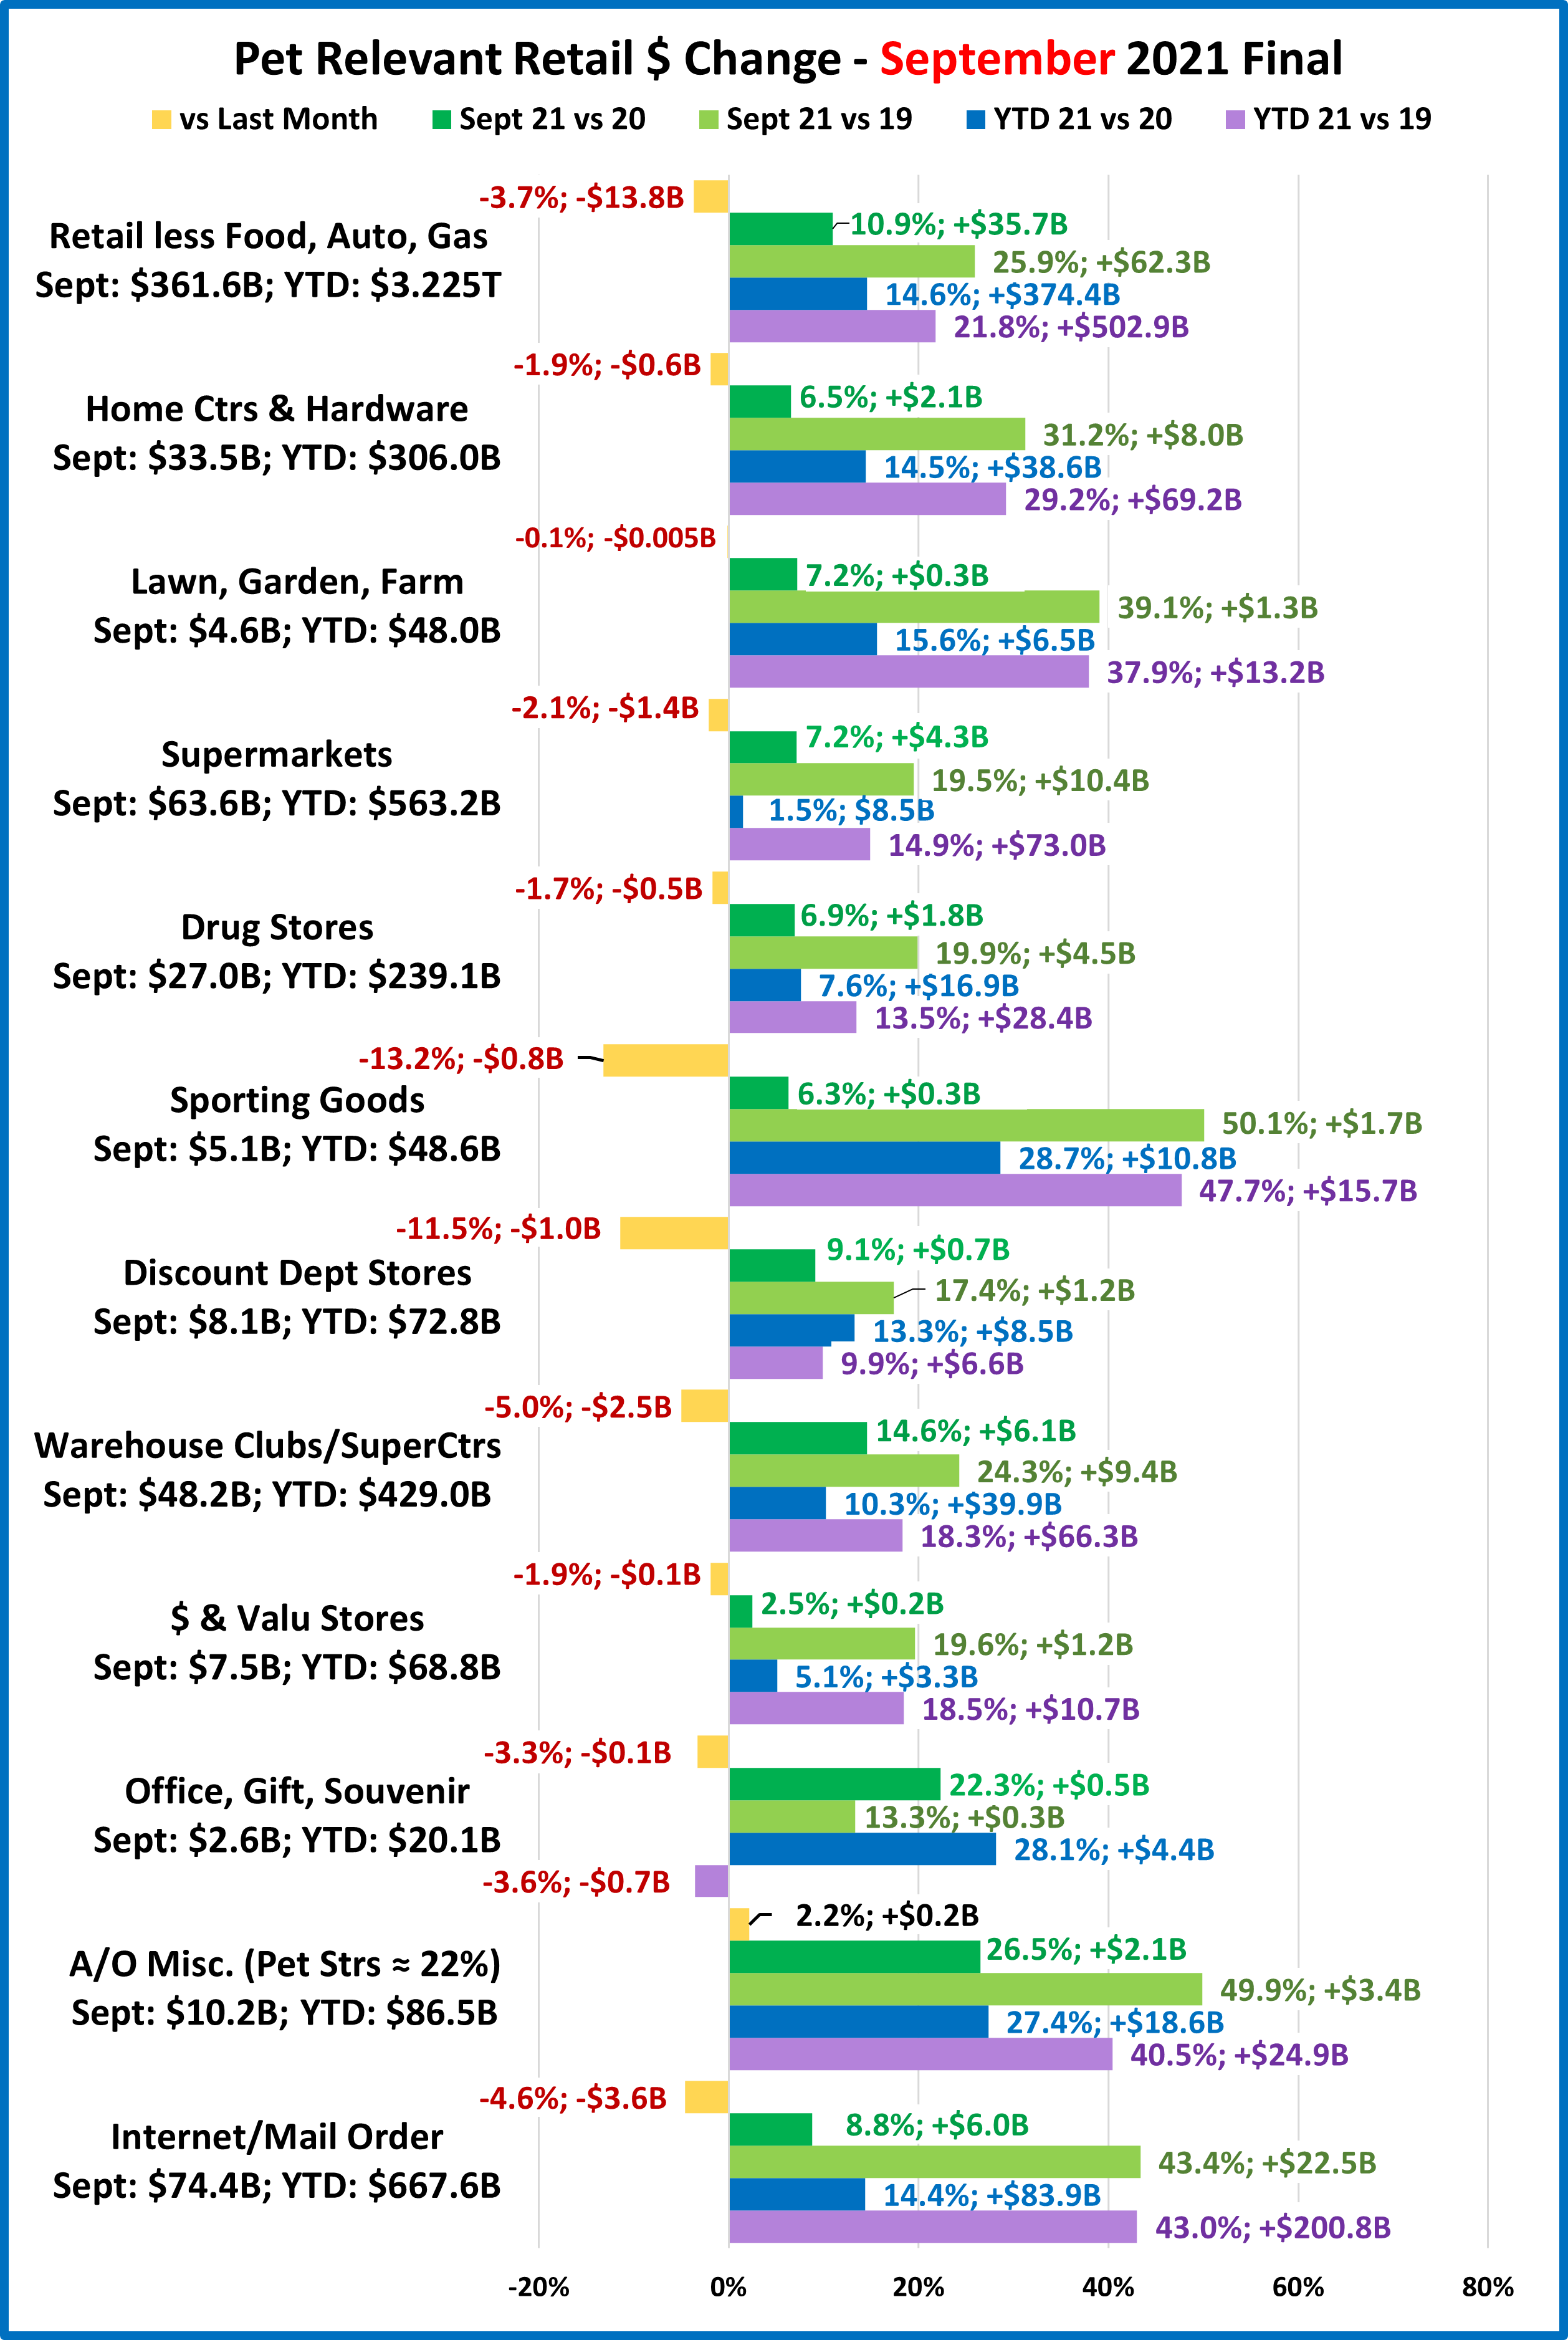
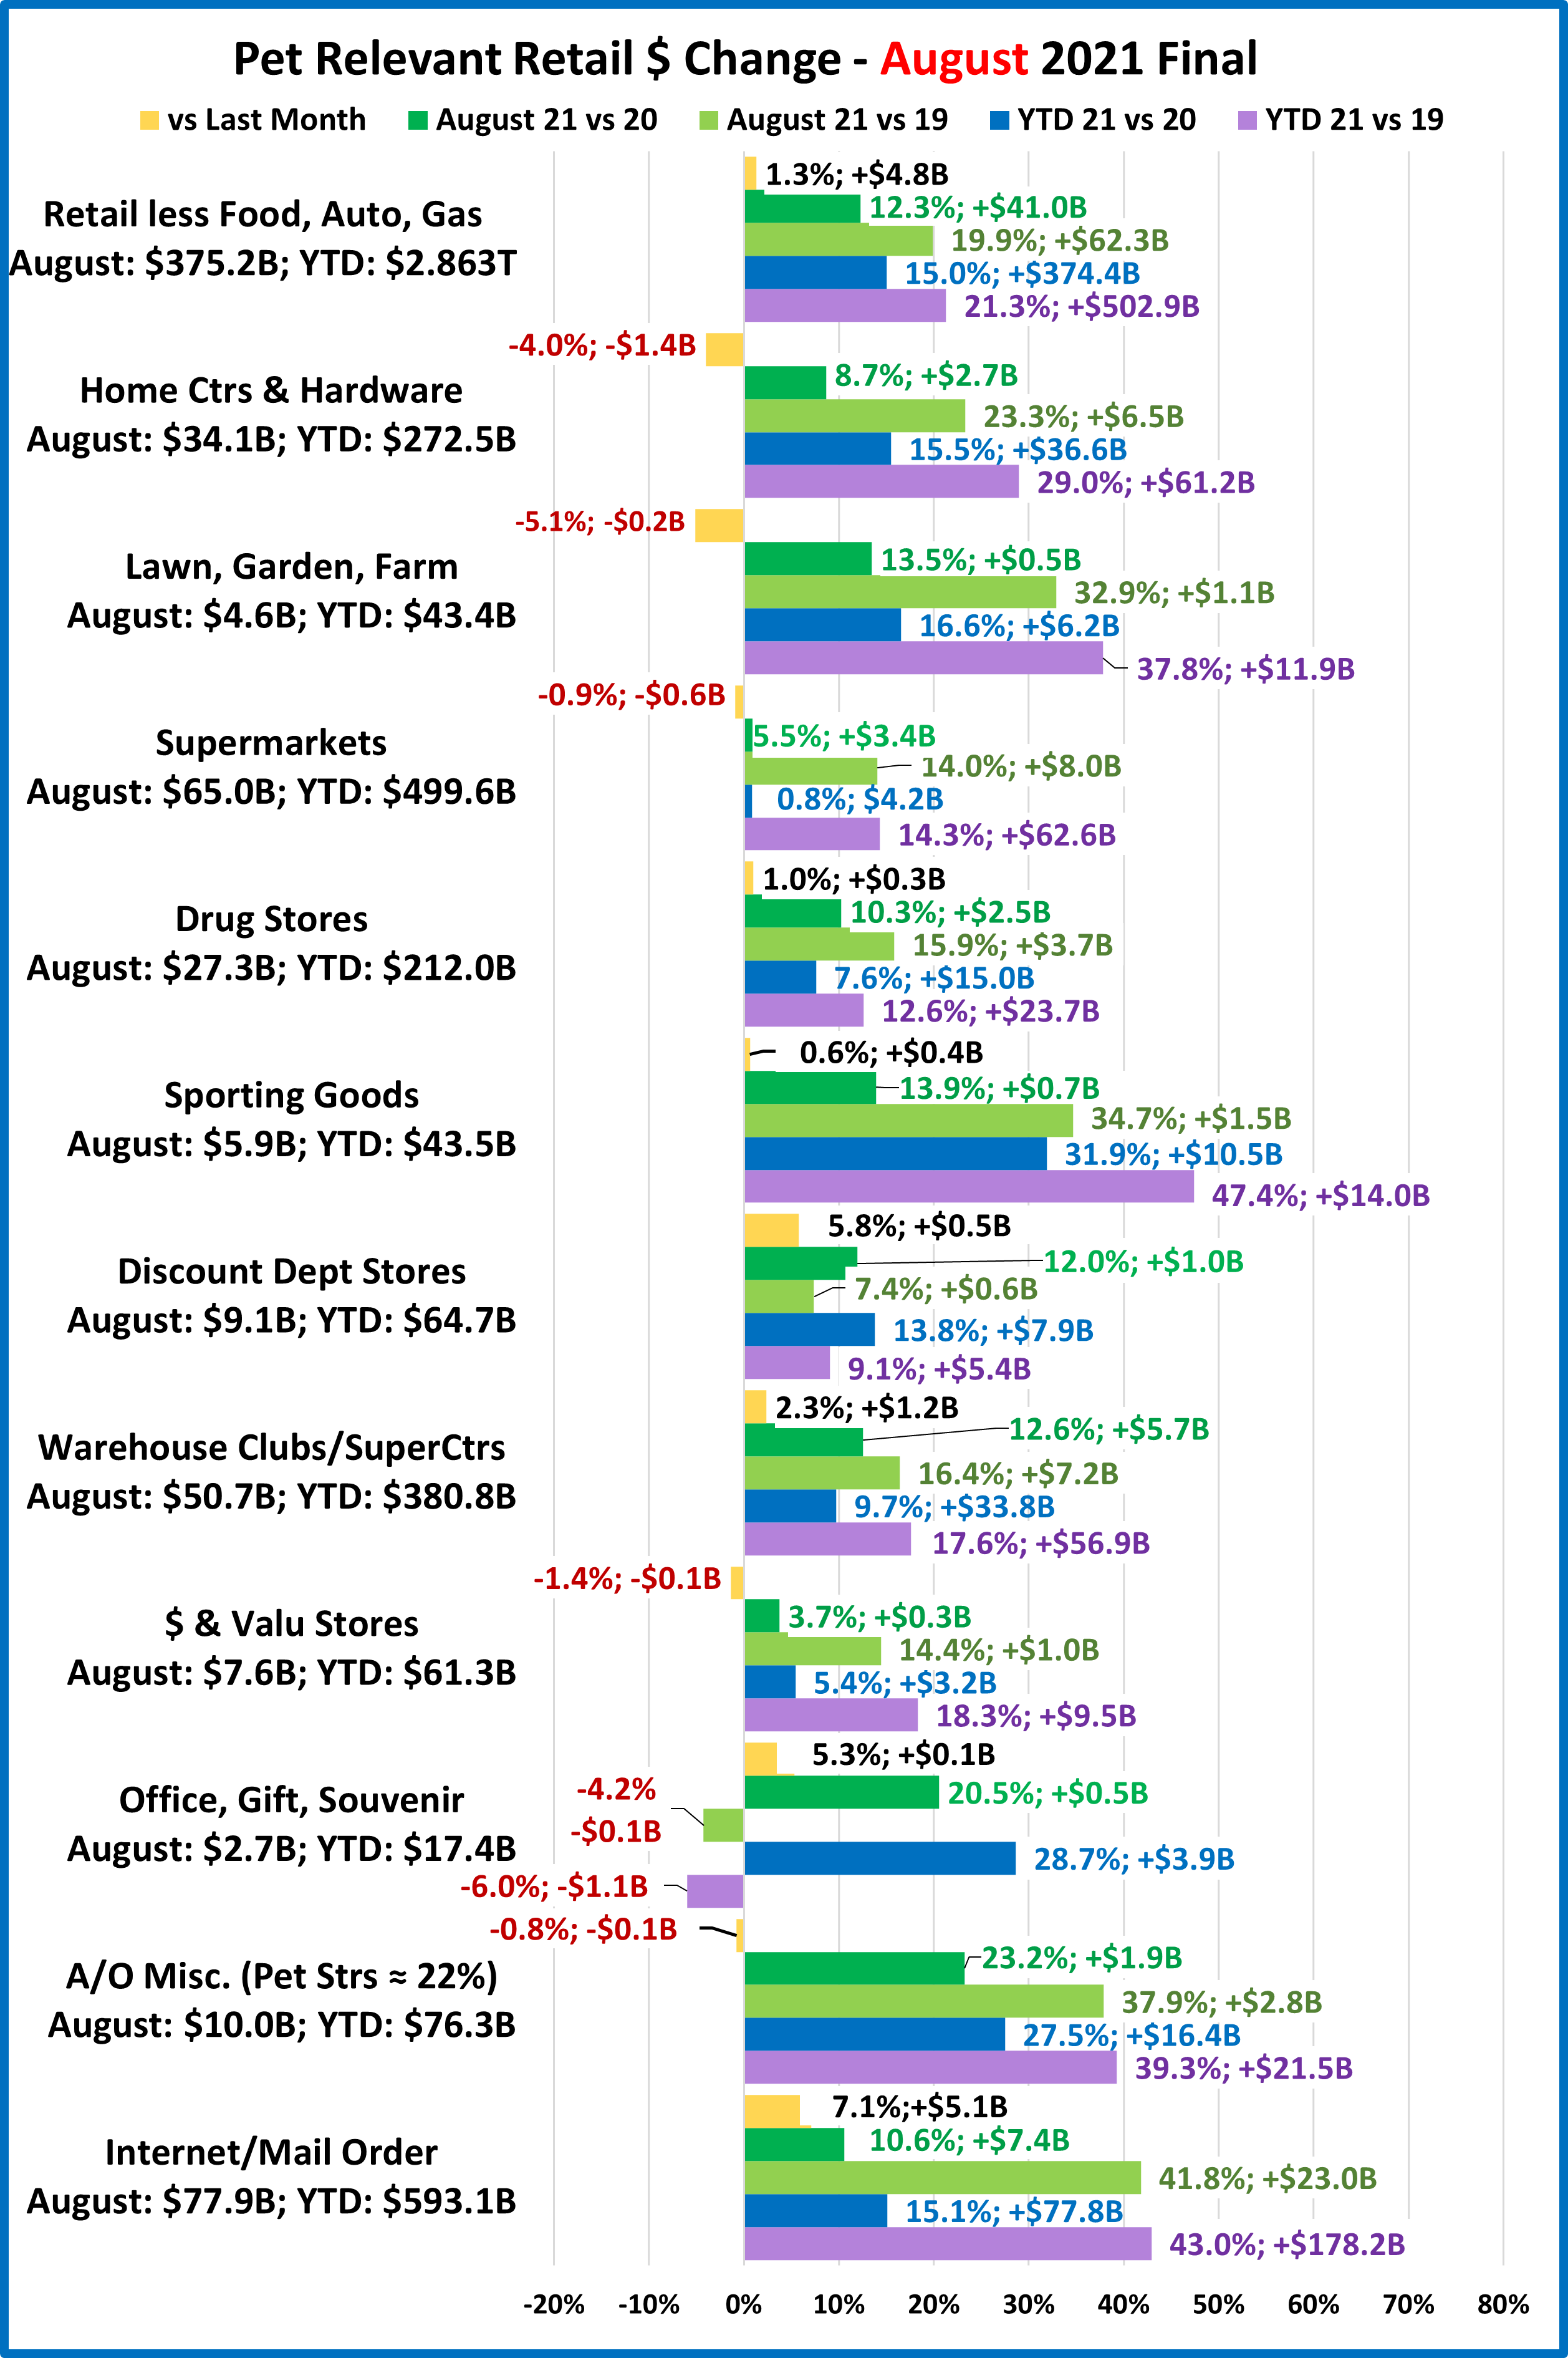
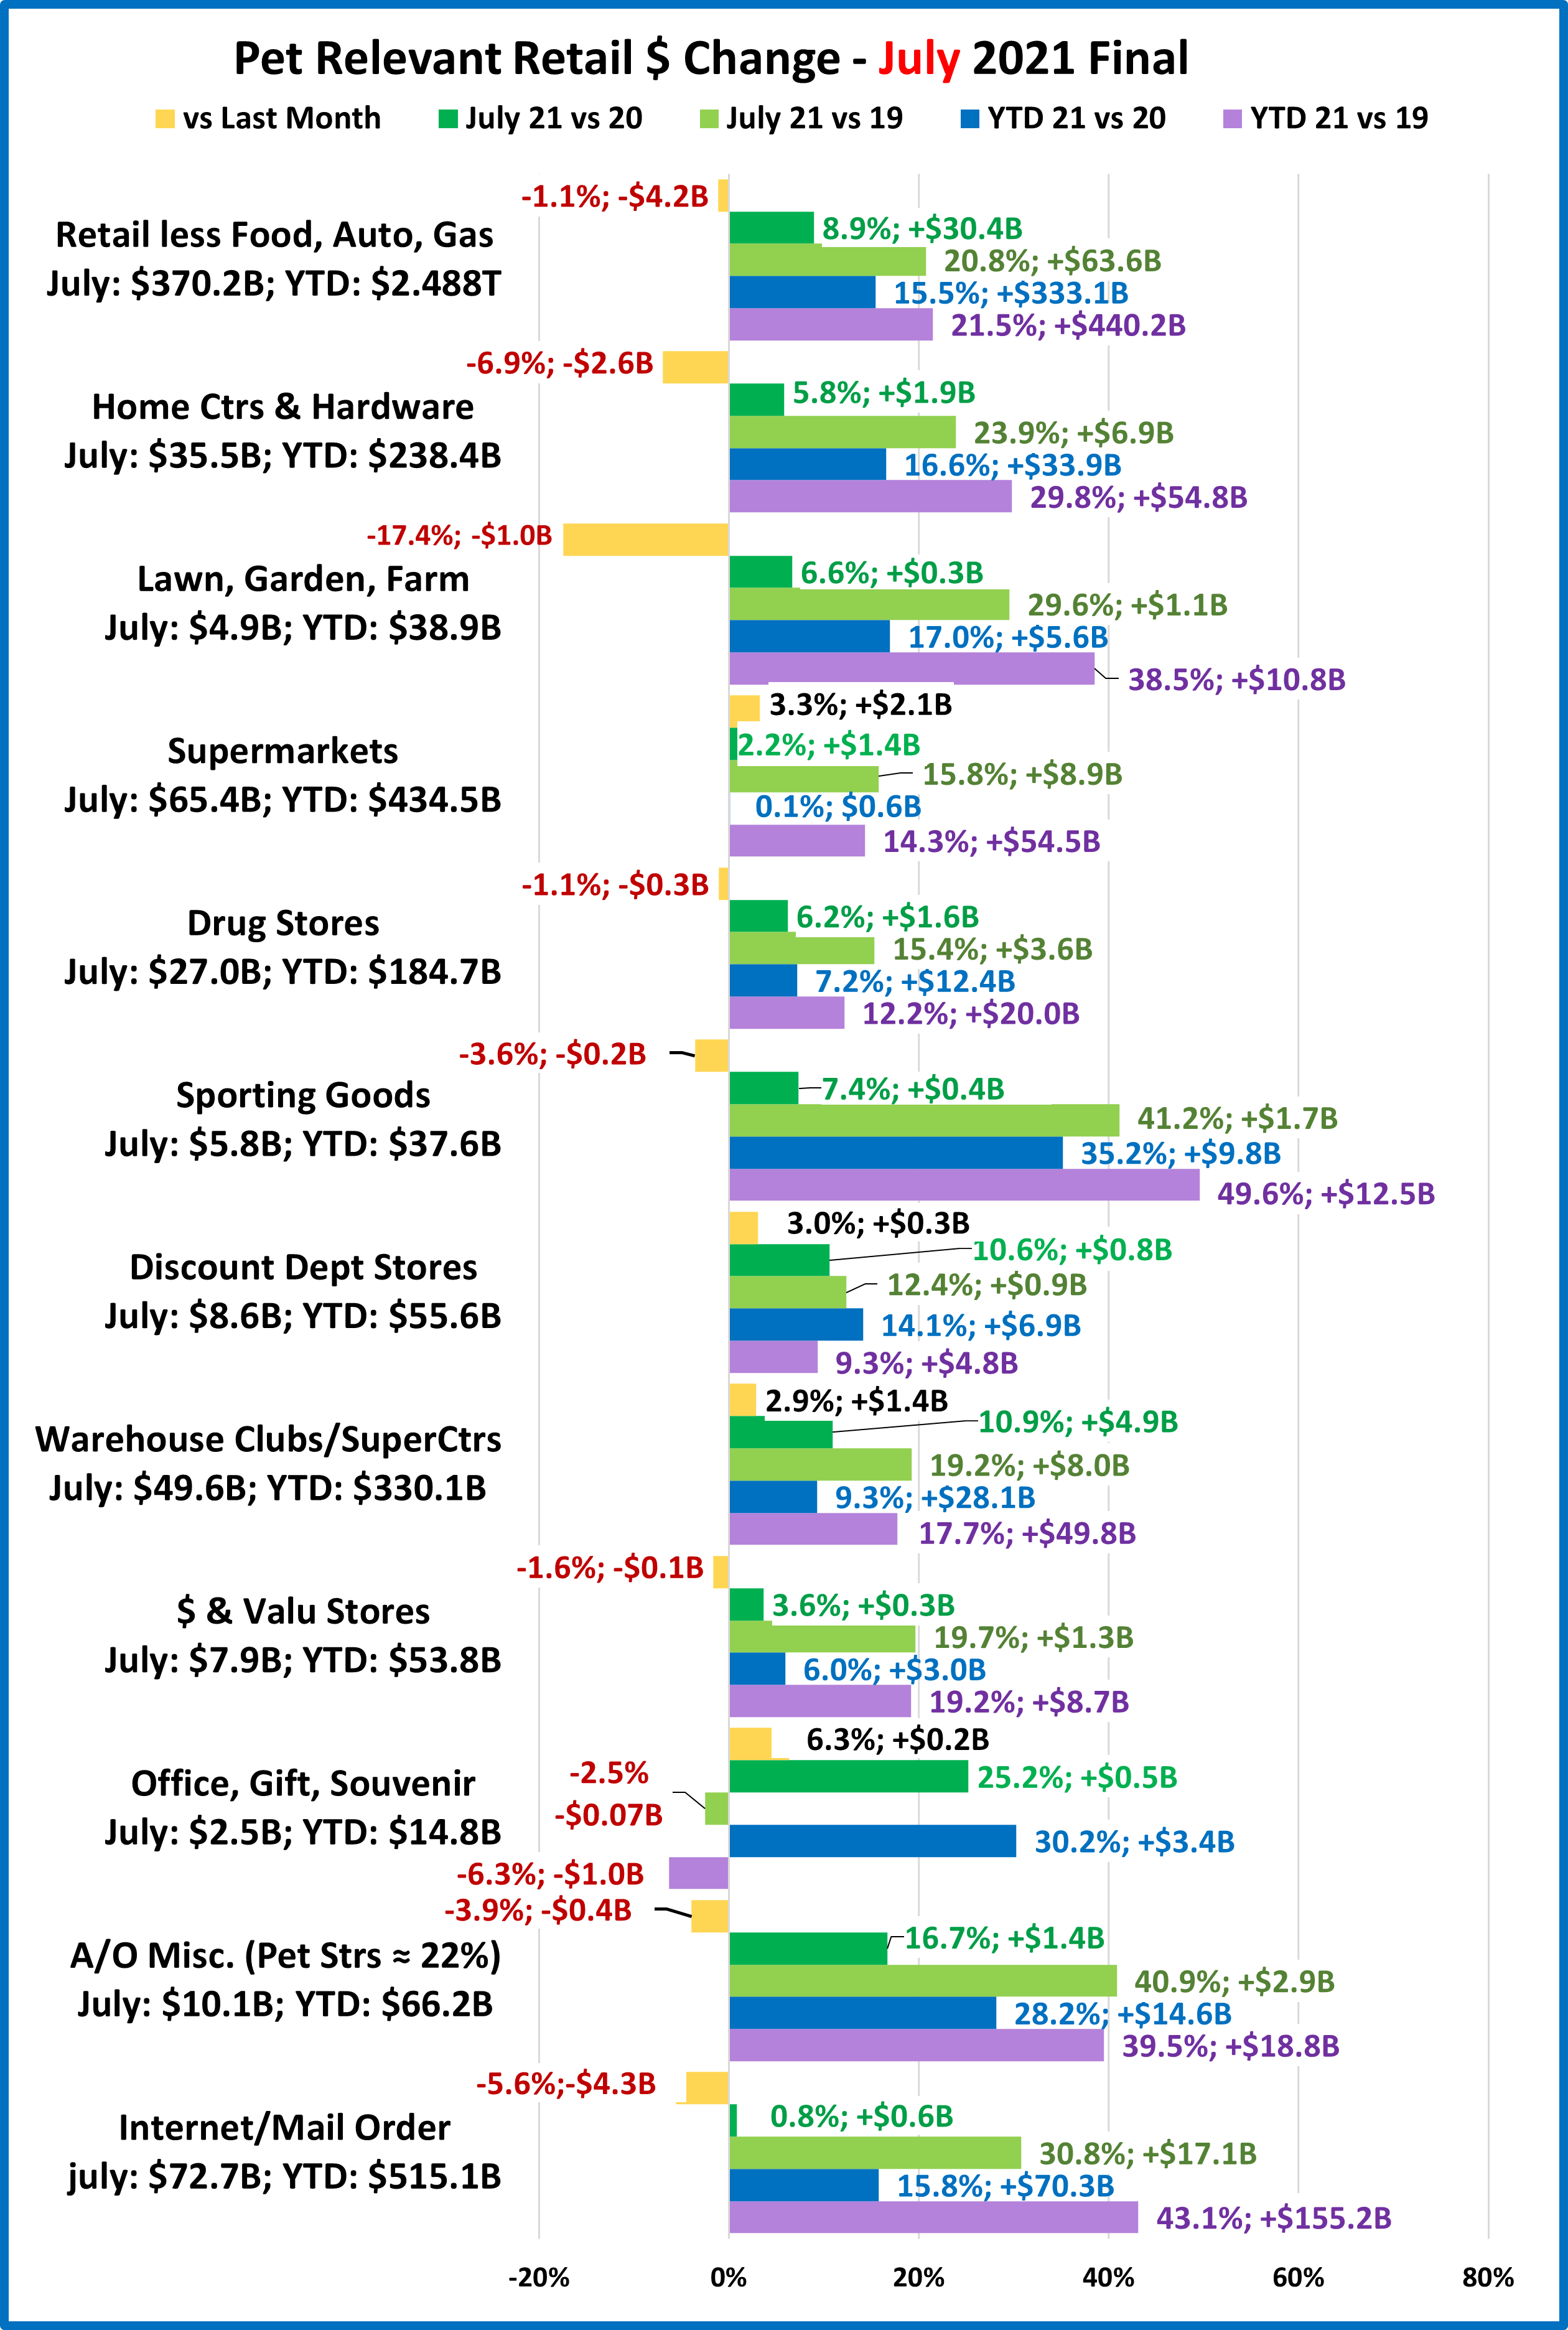
Now, let’s see how some Key Pet Relevant channels were doing in October.
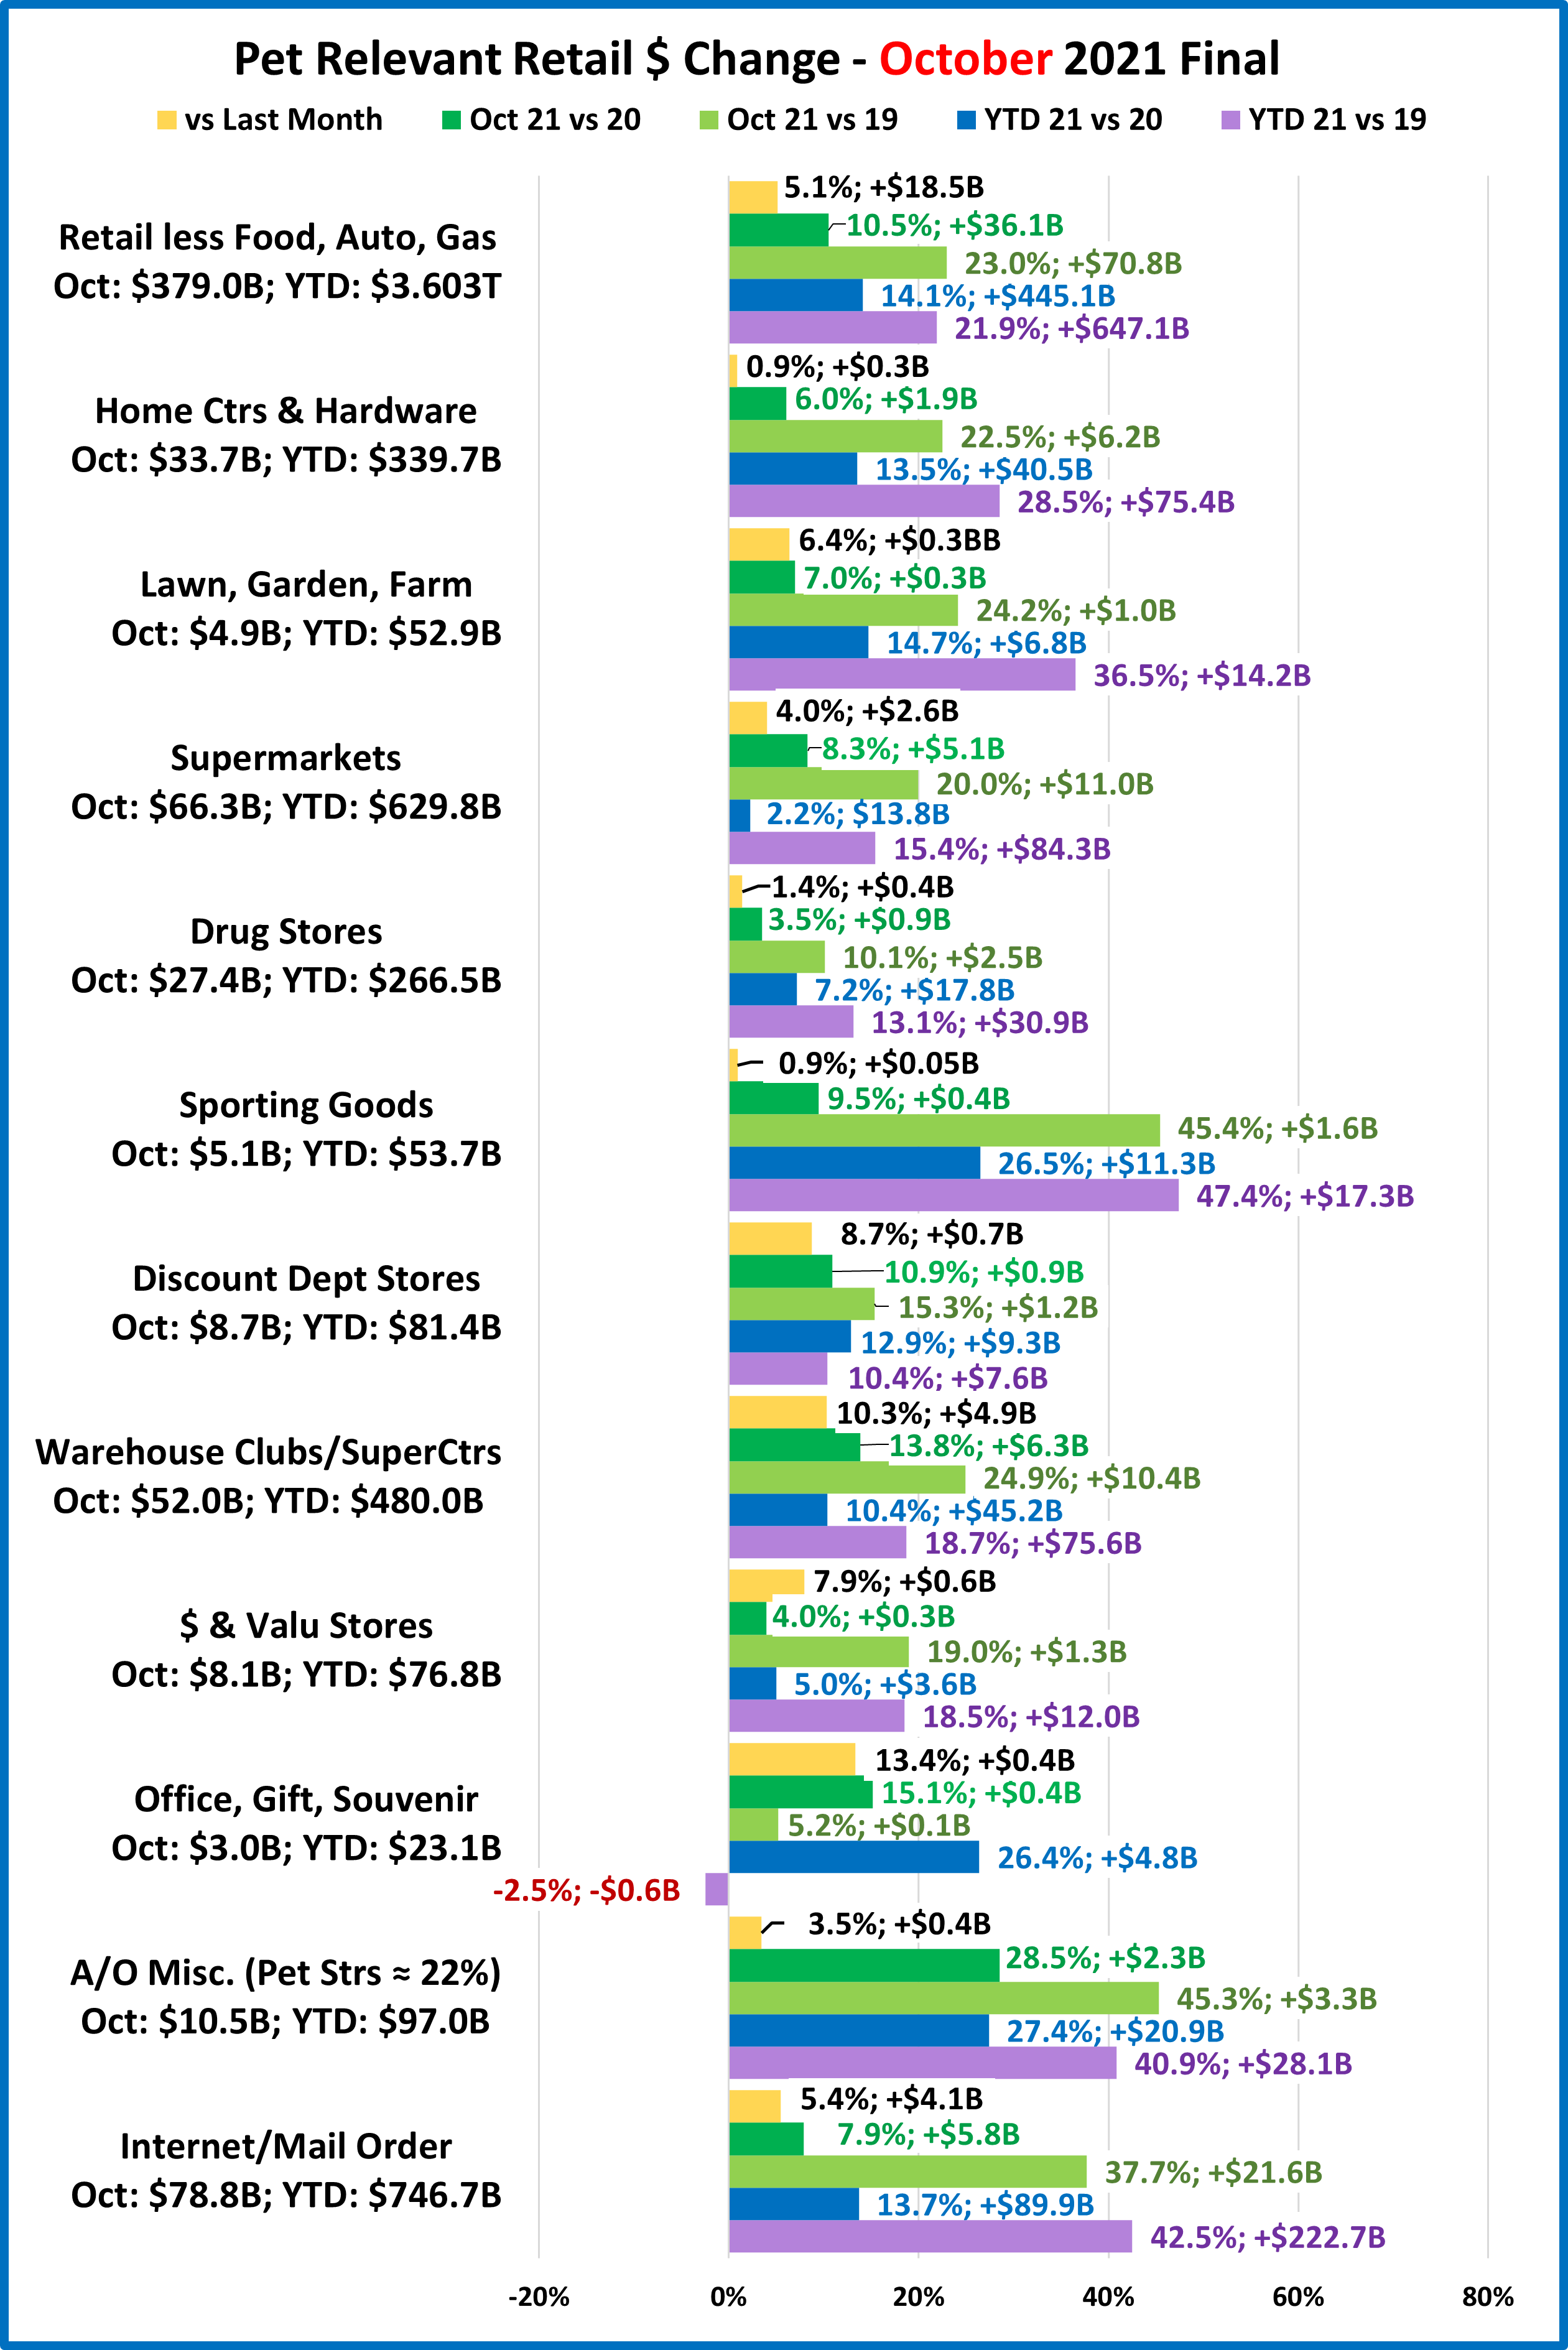
- Overall – No channels were down vs last month, a big change from 10 in September. In fact, the only negative was Office/Gift/Souvenir YTD $ vs 2019. October was the 2nd biggest month in history for Relevant Retail.
- Building Material Stores – Their amazing lift has slowed a little. The surge came as a result of pandemic spending patterns developed in 2020. Consumers began focusing on their homes. Their Spring lift has slowed in 2021 but Building and Farm stores are still going strong. Sporting Goods stores have a similar pattern. Sales took off in May 2020, hit a record peak in December and continued strong into 2021, peaking in March. $ slowed but have now stabilized after a big drop in September. YTD they are +47.4% vs 2019, a Growth Rate of 21.4%!
- Food & Drug – Supermarkets were +$77.7B in 2020. $ are up vs September and +8.3% vs October 2020. YTD $ are on par with the 2020 binge and +15.4% vs 2019. Drug Stores were +$17B (+5.7%) for 2020. They had a record March. Sales have been relatively stable since then. Their YTD $ are +7.2%.
- General Merchandise Stores – $ in all channels fell in Jan & Feb then spiked in March. Monthly sales by channel have been up or down since then but all were strong in October, +10.1% vs September. Clubs/SuprCtrs & $ Stores are leading the way with a combined annual growth rate of +8.9%. These channels promote value. Their success reinforces its importance to consumers. Disc. Dept. Strs are now rebounding with all positive numbers.
- Office, Gift & Souvenir Stores– $ are up from September and were +15.1% vs October 2020. The pandemic hit them hard. They are still down YTD vs 2019. Recovery will take more time, but their situation is improving.
- Internet/Mail Order – Their sales rebounded after dipping in September. The pandemic continues to fuel this channel’s growth. In October 2019, their avg annual growth rate was +14.1%. Now, it is +19.4% – up 37.6%
- A/O Miscellaneous – This is a group of small to midsized specialty retailers – chains and independents. It includes Florists, Art Stores and Pet Stores (22>24% of total $). Pet Stores were usually essential, but most stores were not. In May 2020 they began their recovery. Their 2020 sales were up +12.1%. October 2021 was their 6th consecutive month over $10B and their 2nd biggest month ever. YTD $ are +27.4% vs 2020 and +40.9% vs 2019.
Relevant Retail began recovery in May and set a $ record in December. $ fell in Jan & Feb, turned up again in March and began a monthly up/down rollercoaster. October $ were up for all and all but 1 channel are ahead of all 2020 & 2019 $. The key drivers are the Internet, SuperCtrs/Clubs/$ Stores and Hdwe/Farm. Now, the Advance numbers for November.

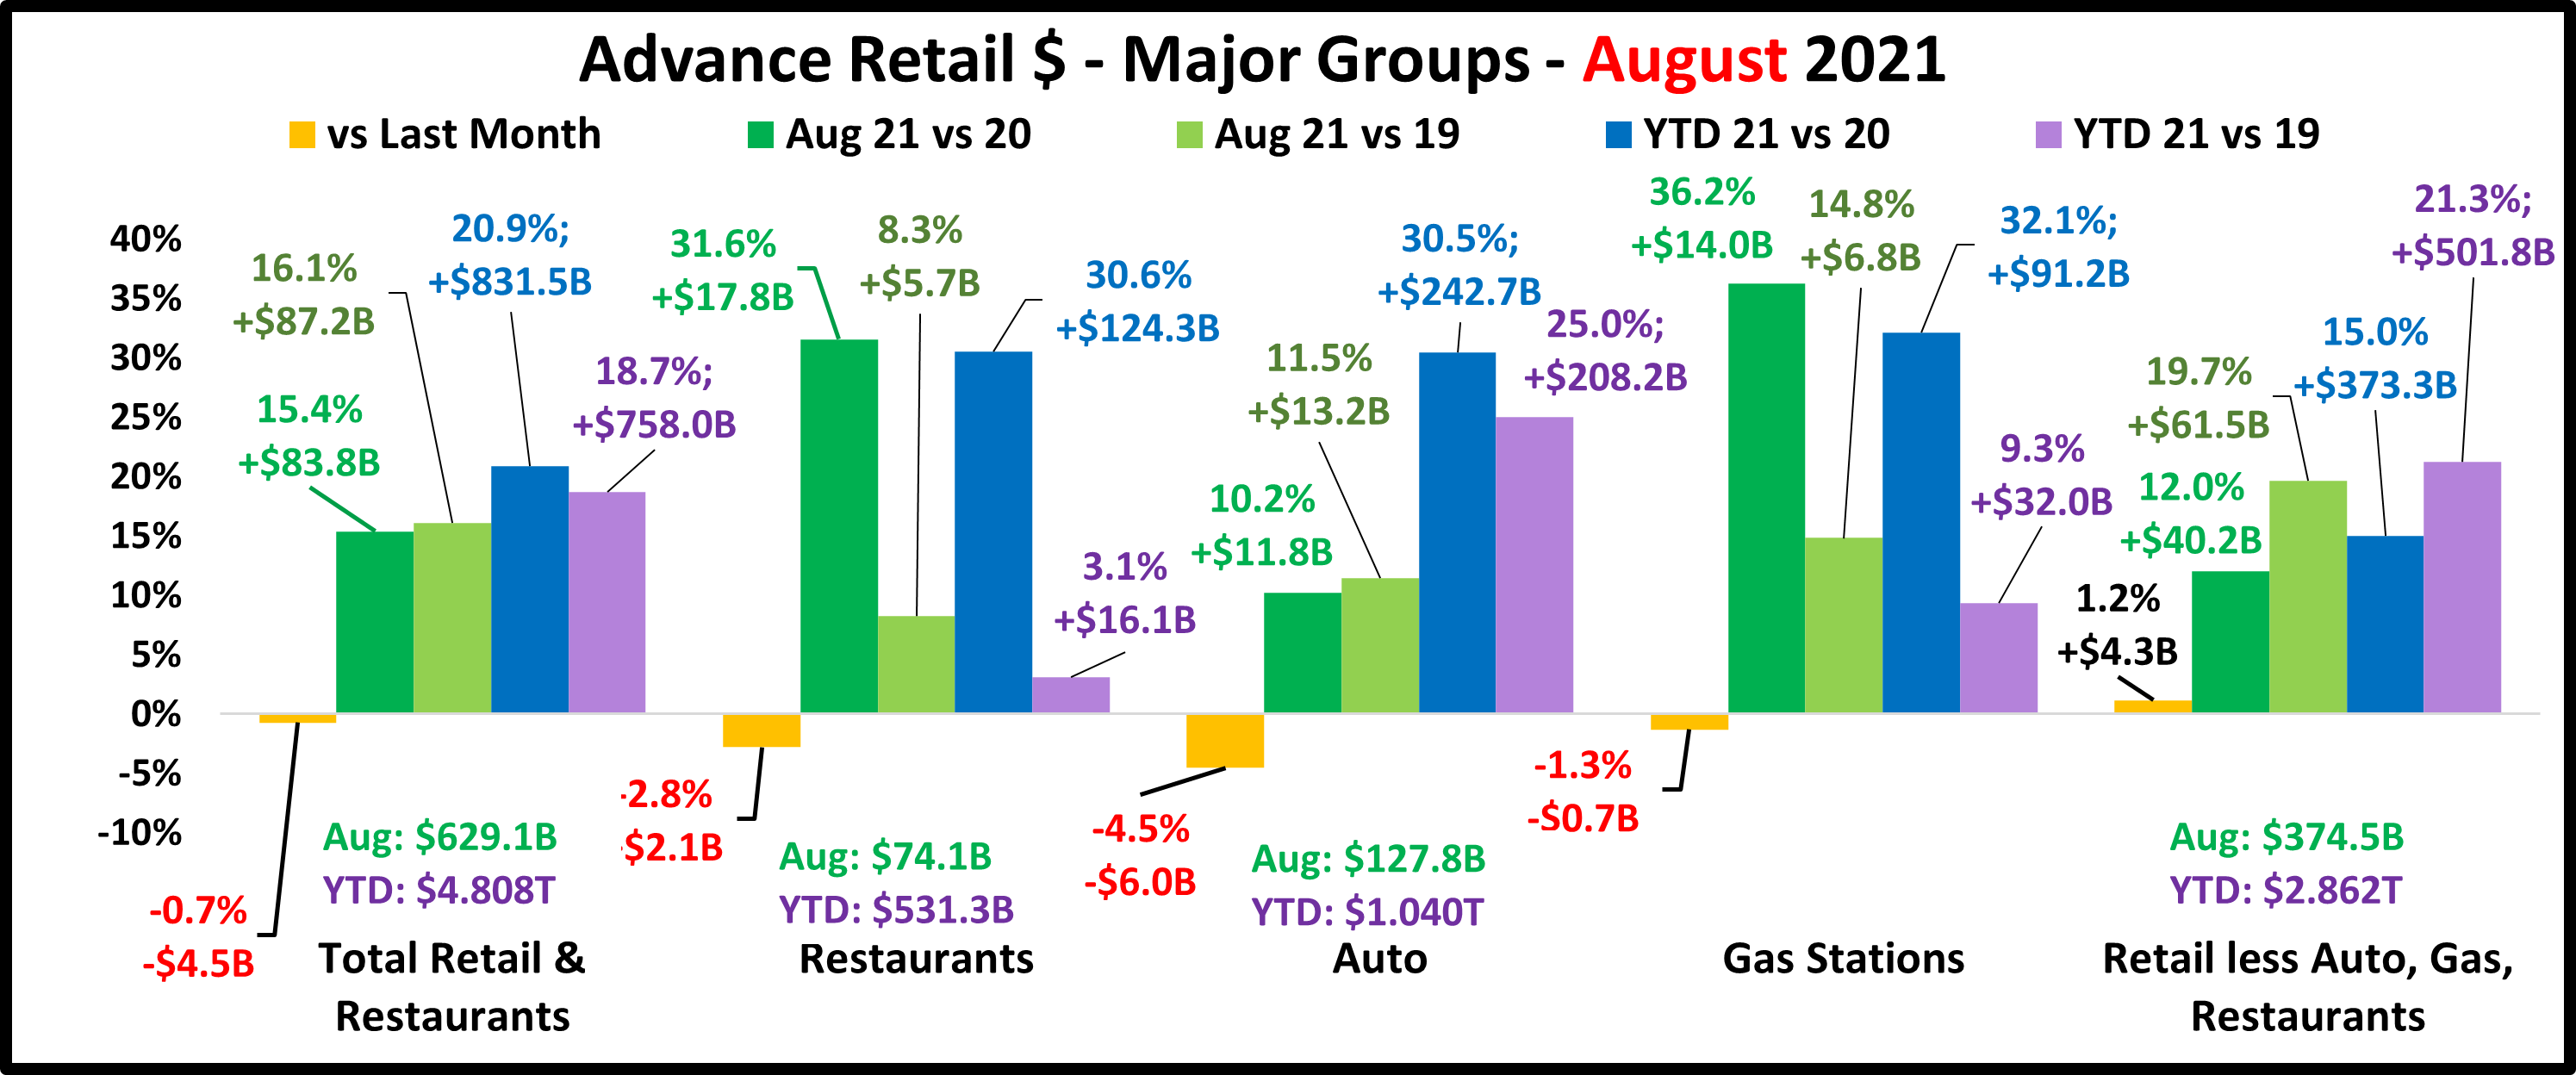
2020 was a memorable year for both its traumas and triumphs. In April & May we experienced the 2 biggest retail spending drops in history, but the problems actually began in March. Retail sales began to recover in June and in October, YTD Total Retail turned positive for the 1st time since February. In December, Total Retail broke the $600B barrier – a historic first. Sales fell in both January and February but still set monthly sales records. Then they took off again in March, setting a new monthly sales record of $633B. April sales were down slightly but they took off again in May to set yet another spending record, $643.1B. June>Sept $ fell but then came back in October & November with November setting a new record of $649.3B. Only Relevant Retail was up vs October, but all were positive in all other measurements for the 6th straight month. Some other areas of the economy are still suffering, some spending behavior has changed, and inflation has become a bigger factor in increases. However, consumers continue to spend “big bucks”, especially in Relevant Retail, and the overall Retail marketplace continues its strong recovery.
Total Retail – In March and then in May Total Retail set new sales records. From June>Sept sales dipped slightly but stayed above $600B. October brought a resurgence and in November sales continued to grow, setting another all time record with monthly sales of $649.3B. Relevant Retail deserves most of the credit for the record as sales for the other groups were down vs October. The current YTD average annual sales growth rate since 2019 for Total Retail is 9.4%, the highest ever in records going back to 1992. Inflation Note: Retail $ were +19.5% vs November 2020. Inflation was +6.8% so up to 35% of the lift came just from higher prices. The “Real” increase was +12.7%. In November 2019 (pre-pandemic) Retail $ were +2.6% over 2018. Inflation was 2.0%, 78% of the lift. The “Real” increase was +0.6%. Long term, strong inflation can slow spending but right now, Retail is far outperforming pre-COVID 2019.
Restaurants – This group has no negative measurements vs 2020 or 2019 for 6 straight months. February 2020 YTD sales were up 8.1% vs 2019. The Pandemic changed that. Restaurants started to close or cease in person dining in March and sales fell -$33.3B (-52.5%) compared to March 2019. Sales bottomed out in April at $30.1B, the lowest April sales since 2003. Sales started to slowly increase in May but never reached a level higher than 88% compared to the previous year. 2021 started off slowly. Through February, YTD sales were down -16.7% from pre-pandemic 2020 and -10.0% from 2019. In March sales took off and grew steadily from April through July. Sales dipped in August/September came back strong in October then fell in November. YTD their $ are +31.7% vs 2020 and +5.2% vs 2019. Their recovery is getting stronger.
Auto (Motor Vehicle & Parts Dealers) – Staying home causes your car to be less of a focus in your life. Sales began to fall in March and hit bottom in April. Auto Dealers began combating this “stay at home” attitude with fantastic deals and a lot of advertising. It worked. They finished 2020 up 1% vs 2019 and have returned to a strong positive pattern in 2021. The “attitude” grew amazingly positive in March and has slowed only slightly from April>November as sales exceeded $119.8B in all 9 months – the 9 biggest months in history. To show the effectiveness of their campaign, just look at the data. This group has exceeded $110B in monthly sales only 18 times in history. 15 of those occurred after the onset of the pandemic. YTD Avg Annual Growth Since 2019 = +11.3% – the best performance of any big group.
Gas Stations – Gas Station $ales have been a mixed bag. If you drive less, you visit the gas station less often. Sales turned down in March 2020 and reached their low point in April. They moved up but generally stayed about 15% below 2019 levels for the rest of 2020. In February they were still behind 2020 in monthly and YTD $ but ahead of 2019 in both measurements. In March, sales skyrocketed and continued to grow to a record level in July. They fell in Aug/Sept but hit a record $55.3B in October. Sales fell in November, but they have been positive in all measurements vs 2019 & 2020 since March. Their comeback continues but inflation comes to the forefront in this channel. Gas prices can be pretty volatile. They dipped in the first 2 months of the pandemic but returned to more normal levels for the balance of 2020. Strong inflation began in 2021. In fact, November prices were 58.1% above 2020. That means that the 53.0% year over year $ lift in November was actually a decrease in the amount of gas sold. YTD Annual Growth Rate Since 2019 = +6.6%
Relevant Retail – Less Auto, Gas and Restaurants – This is what we consider the “core” of U.S. retail and has traditionally accounted for about 60% of Total Retail Spending. In looking at the individual channels in this group, we have seen a variety of results due to many factors, like non-essential closures, binge buying, online shopping and a consumer focus on “home”. However, overall, April 2020 was the only month in which spending in this group was down vs 2019. Monthly $ales exceeded $400B for the first time ever in December. They finished 2020 up $260B, +7.1%. Their performance was the only reason that Total Retail was able to finish 2020 with positive numbers, +0.5%. Sales fell in January and February 2021 but set monthly records. In March they turned sharply up and then began an up/down $ roller coaster ride. In October they reached the 2nd highest amount on record but November took over the top spot with $407.1B. March>November are 9 of the 11 highest $ months of all time. Relevant Retail has exceeded $361B in monthly sales 11 times in history. 10 of those have occurred since the onset of the pandemic. It is also very important that the Relevant Retail group has posted positive numbers versus last year and YTD for every month since April 2020 and their average YTD growth rate since 2019 is +10.5%. The recovery has become widespread as all channels have been positive in all measurements vs both 2020 and 2019 for 4 consecutive months. However, the primary drivers throughout the pandemic were and continue to be Nonstore, Grocery, SuperCenters/Clubs/$ Stores plus a seemingly never ending 2020 “spring lift” from Hardware/Farm and Sporting Goods.
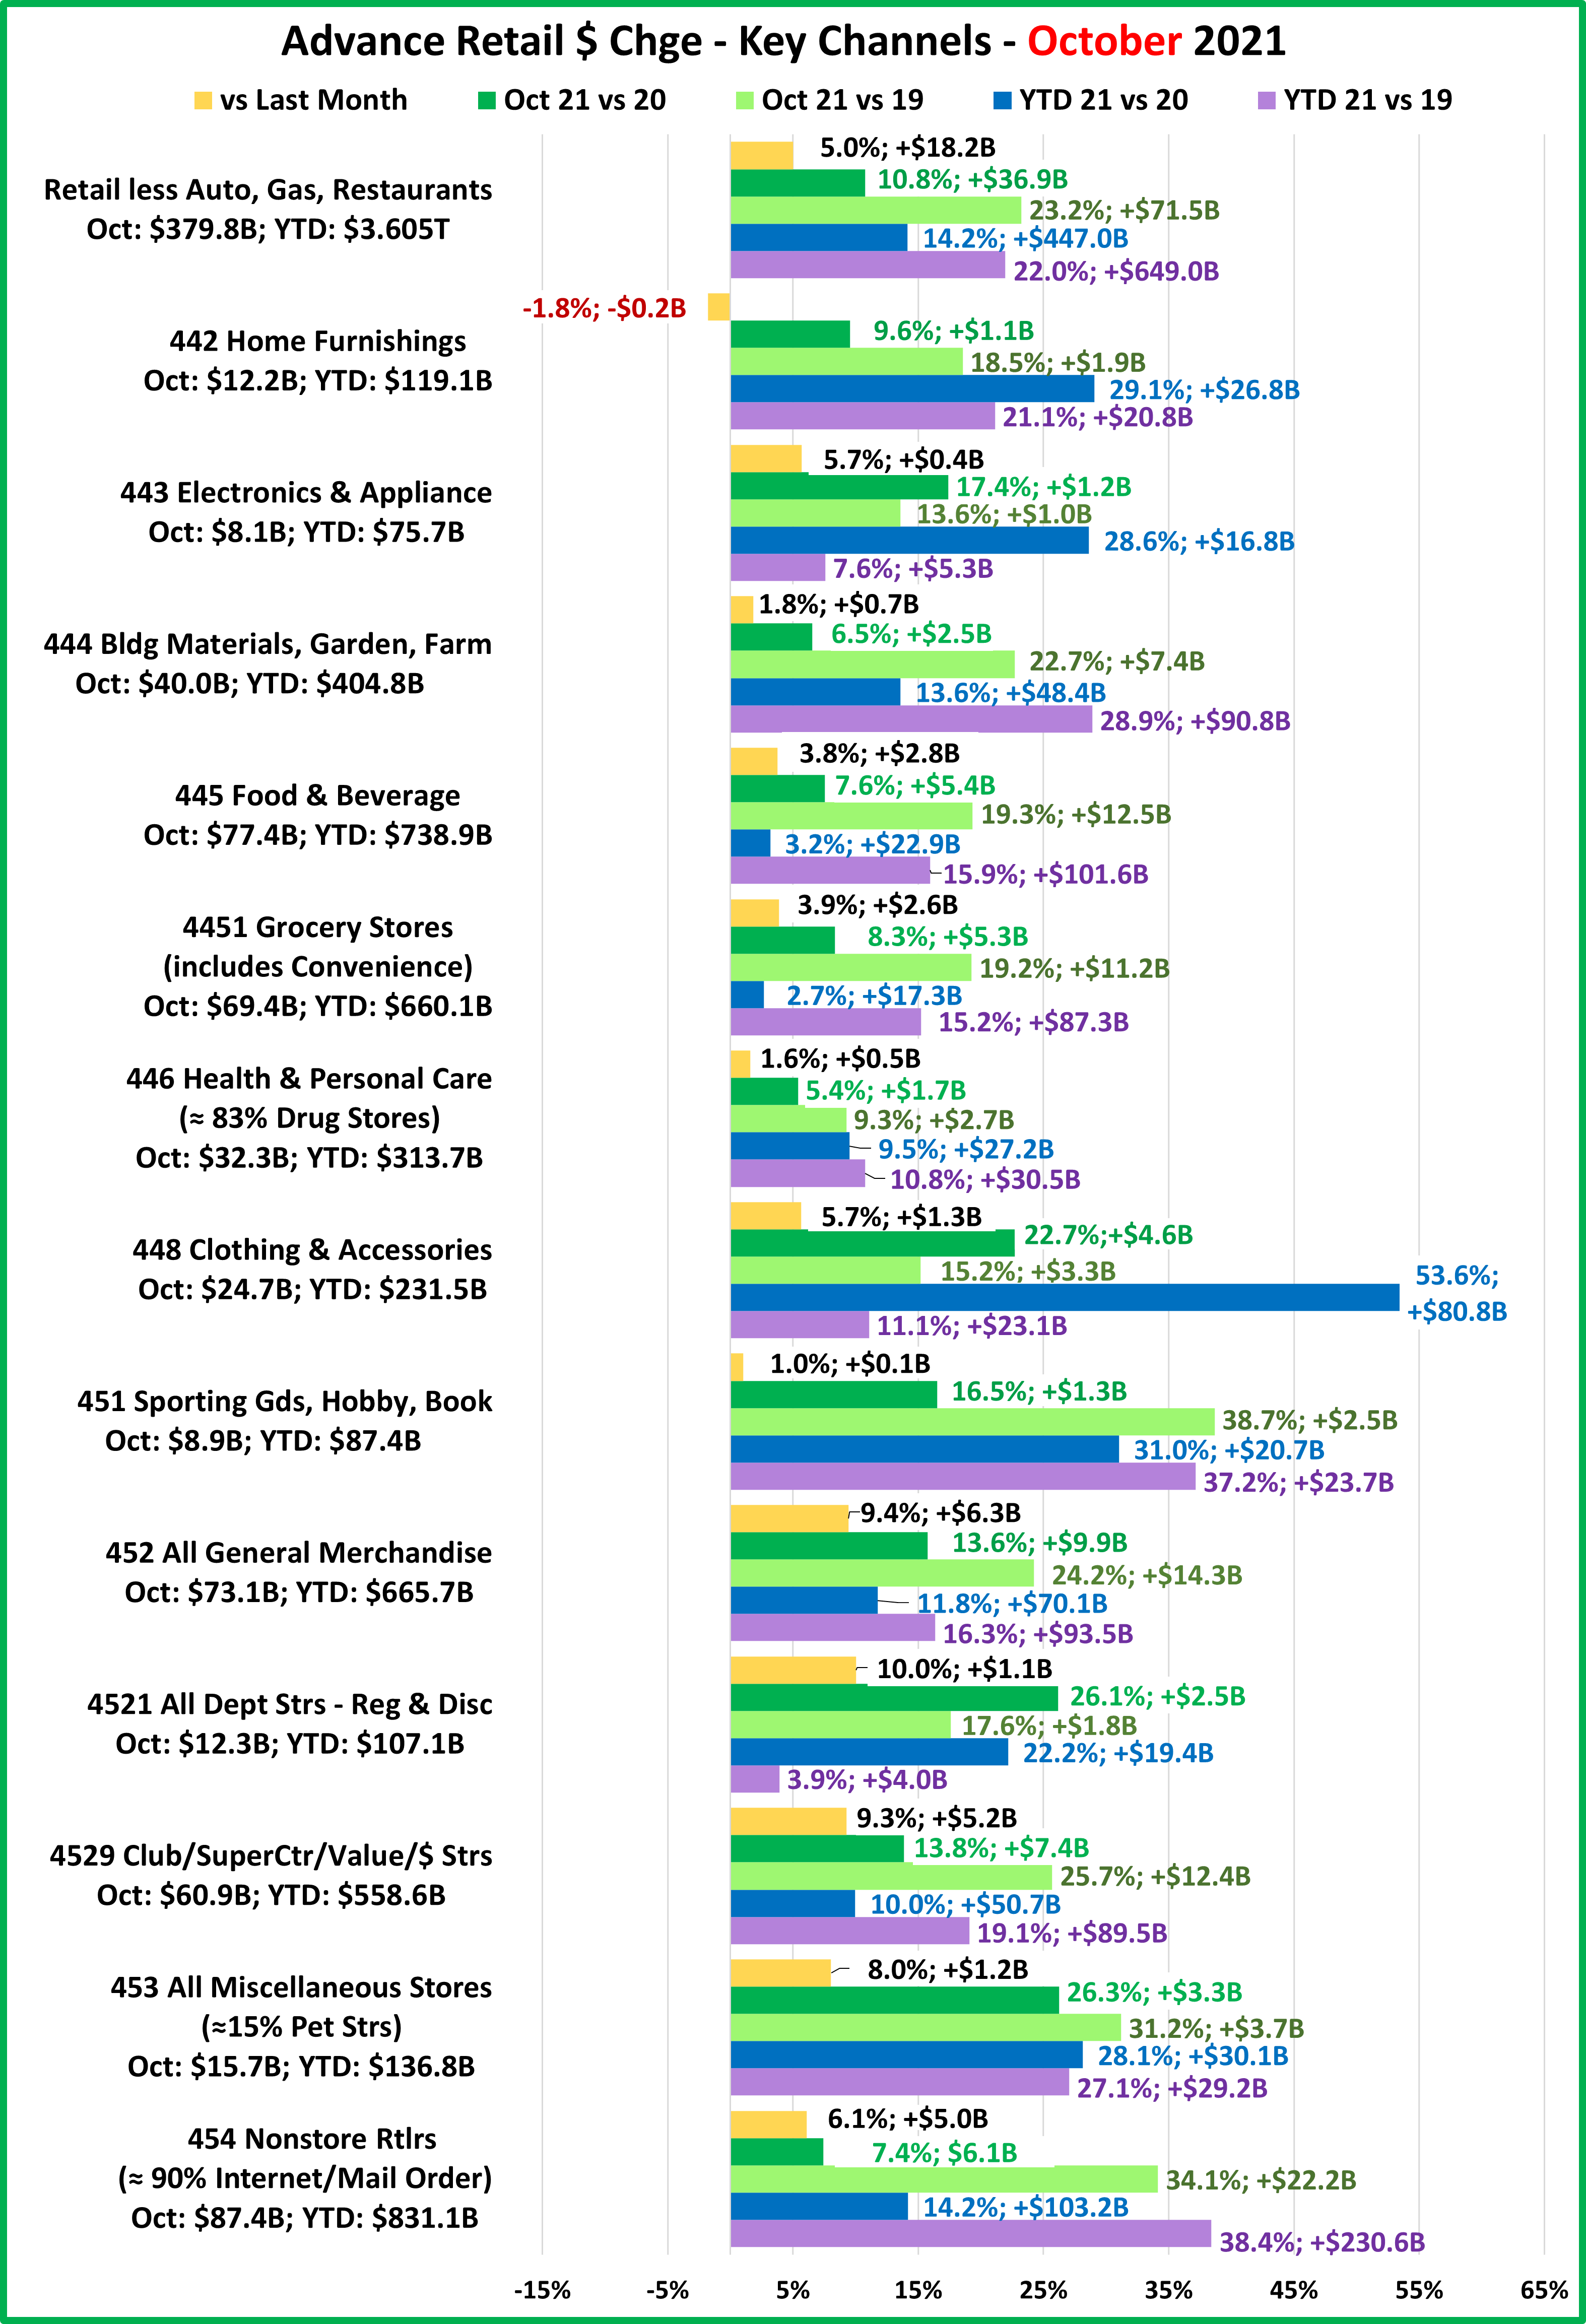
Now let’s look at what is happening in the individual retail channels to see where the $ are coming from. November $ were up 7.4% from October and an increase occurred in 9 of 13 channels. Remember, the groups in the chart are less defined than in the Final Monthly reports and we will look across the whole market, not just pet relevant outlets.

Sales in 9 of 13 channels were up vs October but all were up vs November 2020, vs November 2019 and YTD vs 2020 and 2019. (Relevant Retail YTD Avg Annual Growth Rate since 2019 = +10.5%)
After hitting bottom in April 2020, Relevant Retail has now beaten the previous year’s $ for 19 consecutive months. The group set an all-time record of $406.8B in December and finished 2020 +$260B vs 2019. 2021 started strong, with record sales in every month, including a new all-time record of $407.1B in November. Essential channels are still the big drivers:
- Nonstore Retailers – The biggest driver. Online shopping continues to grow in # of households and in $.
- Food & Beverage – Grocery– Restaurant $ are improving but consumers continue to eat & drink more at home.
- Bldg Materials/Garden/Farm– Their “Spring” lift may be ending but consumers are still focused on their homes.
- SuperCtrs/Club/Value/$ Strs – They kept the GM channel strongly positive. Value is still a big consumer priority.
Regarding the Individual Large Channels (Includes YTD Avg Annual Growth Rate since 2019)
General Merchandise Stores – Sales increased for all channels vs October and all other numbers were also positive. Even Department Stores $ are growing increasingly positive. After dipping to +7.5% in February, the growth rate by Club/SuperCtr/$ stores has stabilized at about 8.8% ever since. These stores are still the key to this channel.
- YTD Avg Annual Growth: All GM = +7.6%; Dept Stores = +1.7%; Club/SuprCtr/$ = +8.9%
Food and Beverage, plus Health & Personal Care Stores – Sales in Grocery were down in March>May from 2020 – No surprise, as these were 2020 binge months. In Jun>Nov they beat 2020 $. Health/Personal Care finished 2020 at +1.8% but 2021 has been better. November was down 2.7% from October but YTD $ are +9.4%% vs 2020 and +10.8% vs 2019.
- YTD Avg Annual Growth: Grocery = +7.5%; Health/Drug Stores = +5.3%
Clothing and Accessories; Electronic & Appliances; Home Furnishings – March > Nov have been spectacular for all these channels. The increase in Clothing vs November 2020 was less than usual but was still +35.3%. All were up vs October and also remained positive in all measurements vs 2020 or 2019 for the 9th consecutive month.
- YTD Avg Annual Growth: Clothing = +5.6%; Electronic/Appliance = +3.6%; Furniture = +10.1%
Building Material, Farm & Garden & Hardware – Their “Spring” lift which began in 2020 has slowed but they have greatly benefited from consumers focusing on their home needs. They finished 2020 +53B (+13.8%). Sales took off in March, set a record in April, but have since slowed and stabilized. They are still +13.4% YTD. Avg Annual Growth = +13.6%
Sporting Goods, Hobby and Book Stores – Book & Hobby stores are open but Sporting Goods stores have driven the lift in this group. Consumers turned their attention to personal recreation and sales in Sporting Goods outlets took off. The group ended 2020 +5.5% vs 2019. The growth accelerated in 2021 with a strong spike in November, up 15.8% from October to $10.2B, the 2nd biggest month ever. November YTD they are +29.9% vs 2020. Avg Annual Growth = +17.1%
All Miscellaneous Stores – Pet Stores were deemed essential but most other stores were not, so closures hit this group particularly hard. Sales hit bottom at -$3.8B in April then began to rebound. They finished with a strong December and ended 2020 -$1.0B, -0.7%. In March 2021 sales took off and reached the $14+B level in May. They have stayed there and set a record of $15.3B in October. Sales fell to $15.0B in November, but it is still #2 of all time. YTD sales are now +27.5% vs 2020 +26.9% vs 2019. Their recovery is very real. YTD Avg Annual Growth = +12.7% (4th Best)
NonStore Retailers – 90% of the volume of this group comes from Internet/Mail Order/TV. The pandemic accelerated the movement to online retail. In February 2020 NonStore $ were +8.6% YTD. In December monthly sales exceeded $100B for the 1st time. They ended 2020 at +21.4%, +$162.9B. This was 63% of the total $ increase for Relevant Retail Channels. Their 2020 performance beat the 12.9% increase in 2019 and every month in 2021 has produced record $. November was +19.9% vs October and set a new record of $105.4B. YTD $ are +14.4%. YTD Avg Annual Growth= +18.1%
Note: Almost without exception, online sales by brick ‘n mortar retailers are recorded with their regular store sales.
Recap – 2020 was quite a year. April & May had the 2 biggest year over year sales decreases in history while December sales broke $600B for the first time. 2021 may become even more memorable. November set a new $ record. Mar>Nov are 9 of the 10 biggest $ months in history with the 9 largest year over year sales increases ever. The total increase was +$1.05T, which is over 6 times the -$174B decrease from March>May 2020 which caused so much concern. At yearend 2020, Restaurants and Gas Stations were still struggling but Auto had largely recovered. Relevant retail had segments that also struggled but they still led the way for Total Spending to finish the year +0.5% vs 2019. 2021 has been even better. In Jun>Nov all major groups were positive vs both 2020 and 2019. The recovery has also become real for virtually all channels and monthly sales continue to set records. In fact, the current annual growth rates of +9.4% for Total retail and +10.5% for Relevant Retail are the best ever. Retail has recovered and continues to grow but we’ll keep checking.