2020 Veterinary Spending was $24.85B – Where did it come from…?
Now we will turn our attention to the final Industry Segment – Veterinary Services. For years, Veterinary Services prices have had high inflation. This has resulted in CU income becoming the most dominant factor in spending behavior and a reduction in visit frequency. Consumers paid more, just used Veterinary Services less often.
Things changed in 2017 as low inflation spurred a 7.2% increase in visit frequency and a $2.5B increase in spending. In 2018 inflation returned to more normal levels. Consumers spent $0.56B more (+2.7%). However, the inflation rate was 2.6% so virtually all of the lift was from increased prices. In 2019 the situation got worse. Consumers spent $0.58B (+2.7%) more but inflation was 4.14%. This means that there was an actual decrease in the amount of Veterinary Services purchased. In 2020 the pandemic hit and consumers concentrated on needs. For Pet Parents, that meant that they became focused on Pet Food & Veterinary Services. As a result, Veterinary spending grew $3.05B, (+14.0%).
We’ll start our analysis with the groups who were responsible for the bulk of Veterinary spending in 2020 and the $3.05B increase. The first chart details the biggest pet Veterinary spenders for each of 10 demographic categories. It shows their share of CU’s, share of Veterinary spending and their spending performance (Share of spending/share of CU’s). In terms of performance – 6 of 10 groups perform above 120%, the same as 2018 & 2019. This is more than Supplies & Services with 5 but much less than Food (8). This means that these big spenders are performing well but it also signals that there is still a large disparity between the best and worst performing demographics in the “needed” segments. Income remains the biggest factor in Veterinary Spending, but Education is also important as College Grads is a different group from Total Pet. The categories are in the order that reflects their share of Total Pet $.
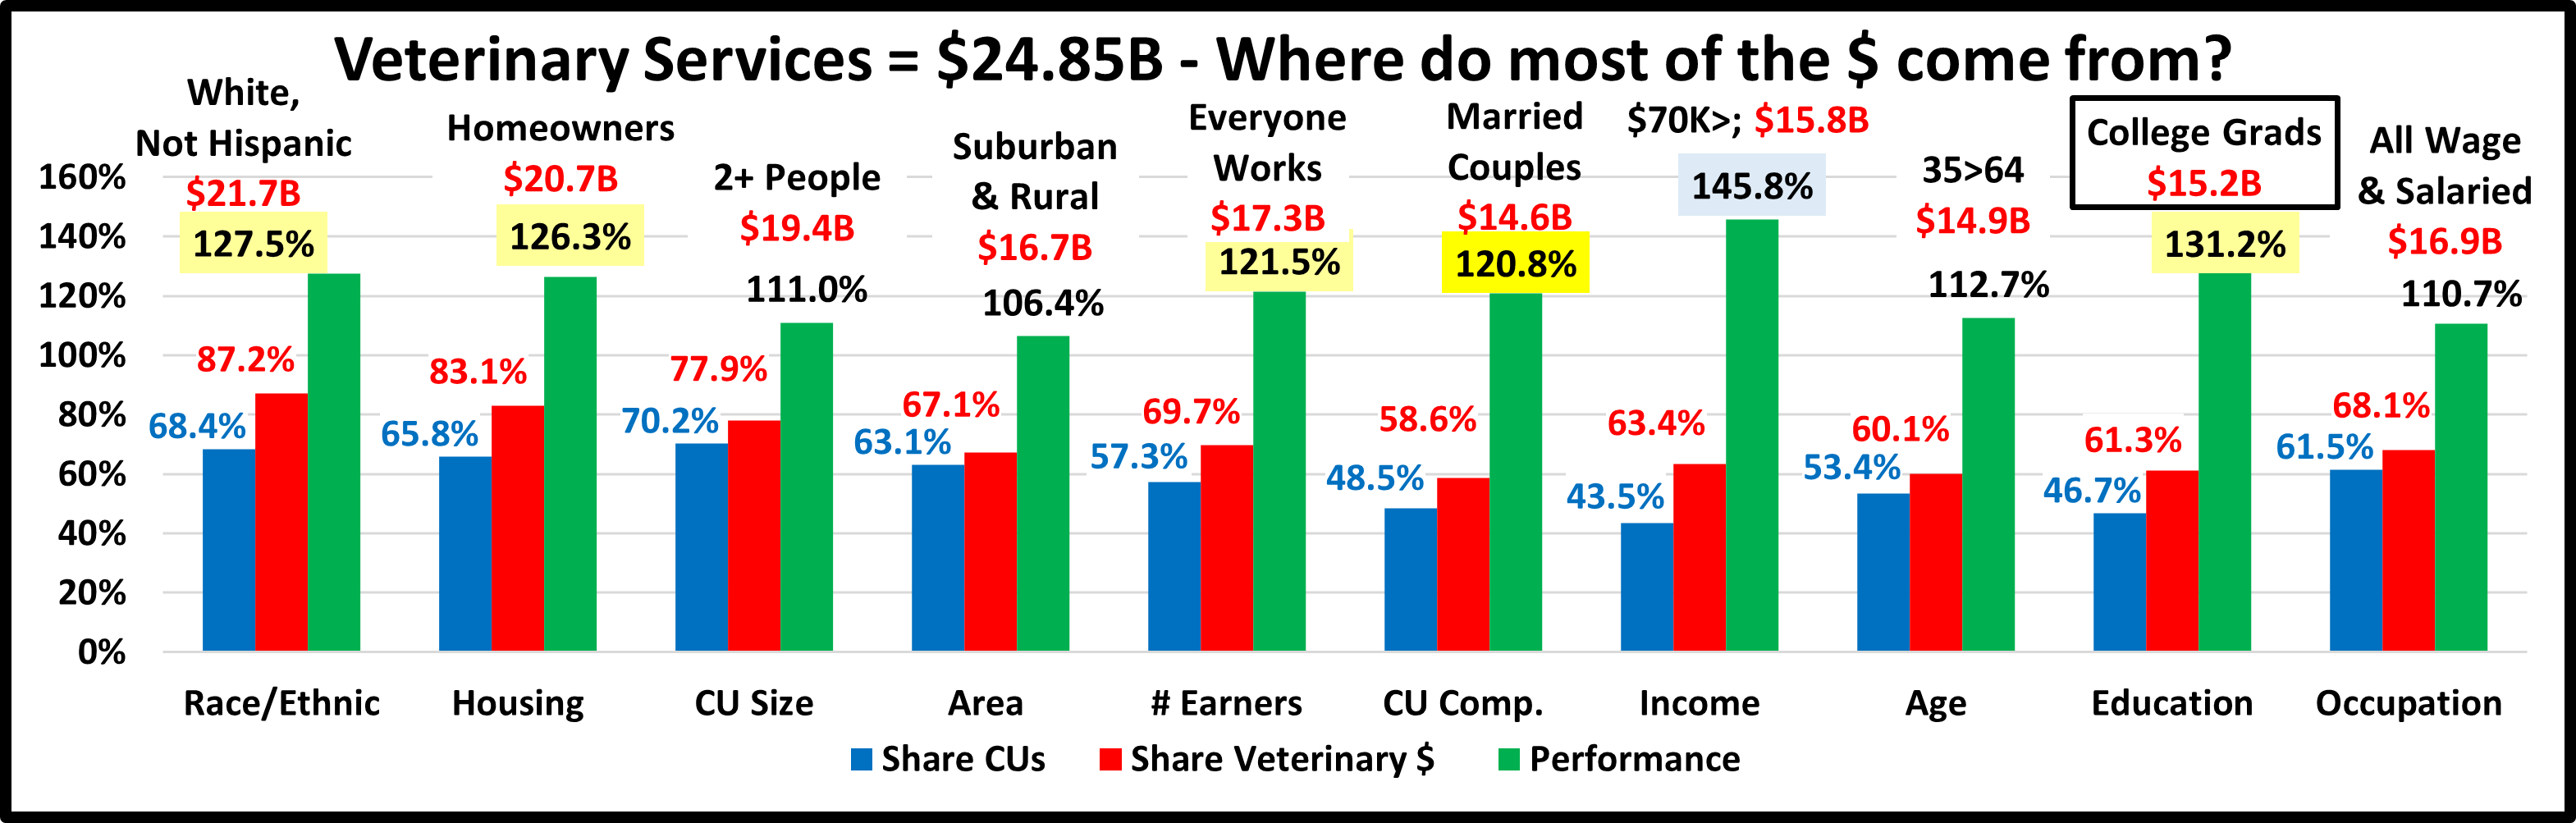
- Race/Ethnic – White, not Hispanic (87.2%) down from 90.9%. This group accounts for the vast majority of spending in every segment, but they lost significant share in 2020. Their 127.5% performance is also down from 132.6% and they fell from 2nd to 3rd in importance in Veterinary Spending but still reflects the spending disparity. Minorities did narrow the gap in 2020. Hispanics & African Americans spent 50% more while the spending by Asians almost tripled.
- Housing – Homeowners (83.1%) down from 83.2% Homeownership is a major factor in pet ownership and spending in all industry segments. In terms of importance to Veterinary spending, their 126.3% performance rating is down from 130.5%, but they held on to 4th place. The slight decrease in share and performance came from a bigger % increase from Renters as they fell in numbers while homeownership grew. We should note that Homeownership is not as important to Veterinary Spending as it once was. In 2015 their share was 88.4% with performance of 141.8%.
- # in CU– 2+ people (77.9%) up from 75.0% This group, which is 70% of U.S. CUs, gained share and their performance grew from 107.4% to 111.0%. Their rank in terms of importance in Veterinary Spending moved up from last to 8th. Spending by Singles and 4 person CUs was flat while 2, 3 & 5 person CUs had big gains.
- Area – Suburban & Rural (67.1%) down from 68.7% Suburban CU’s are the biggest spenders in every segment. Rural had a great year and was added to hit the 60% goal. Performance still fell to 106.4%, from 107.9%. The decreases in share and performance came because Suburbs 2500> were up only 3.2% while Center City was +19.8%.
- # Earners – “Everyone Works” (69.7%) down from 70.4% In this group, all adults in the CU are employed. Their Performance fell from 121.5% to 120.3% and they fell in rank from #5 to #6. Only No Earner, Singles spent less. The small drop in share and performance were due to a huge lift by 2+ People CUs with 1 or no earner.
- CU Composition – Married Couples (58.6%) up from 57.0% Their performance also grew to 120.8% from 116.7% and they returned to the 120+% club at #6. Until 2019, Married Couples had a 60+% market share and 120+% performance in all segments. Only Married Couples with an oldest child <6 spent less. The gains came because the spending by singles was essentially flat, only +0.6%.
- Income – Over $70K (63.4%) down from 66.3% The performance of the $70K> group fell significantly from 159.8% to 145.8%. However, higher income is still the most important factor in increased Vet spending. Only the $50>99K group spent less. The spending by the <$50K group grew by 37.0%. Those making $100K> also spent 16.4% more. The key factor in the big changes in share and performance was a 9.8% drop by the $70>99K group.
- Age – 35>64 (60.1%) down from 63.2% Their performance also fell from 120.7% to 112.7% and they dropped out of the 120% club. Only <25 & 35>44 yr olds spent less. All other groups had double digit % increases. The drop by 35>44 yr-olds in conjunction with a 52.1% lift by 25>34 caused the big loss in share and performance.
- Education – College Grads (61.3%) down from 63.9% Income generally increases with education. It is also important in understanding the need for regular Veterinary care. Performance also fell from 144.1% to 131.2%. Education lost share and performance but moved up to 2nd from 3rd in importance. Only those without a HS diploma spent less. The big drop in share and performance came from a 48.2% lift by HS Grads without a BA/BS. Veterinary Services are very important. The pandemic caused this need to become recognized by more education levels.
- Occupation – All Wage & Salaried (68.1%) up from (67.3%) but their performance only increased from 110.3% to 110.7%. Tech/Sls/Clerical and Retirees spent less while most of the lift was driven by Managers & Professionals. However, the largest percentage increase was from the Self-Employed. This combination slowed the gains. It also reinforces that “the bosses” ruled in 2020.
Spending did become a little more balanced but Higher income remains the biggest single factor in Veterinary spending. We see the impact of this in many groups as it often contributes to the big spending disparity between segments. The most notable change was that the 35>64 age group fell out of the 120+% club due to a big lift by the 25>34 yr olds.
Now, we’ll look at 2020’s best and worst performing Veterinary spending segments in each category.
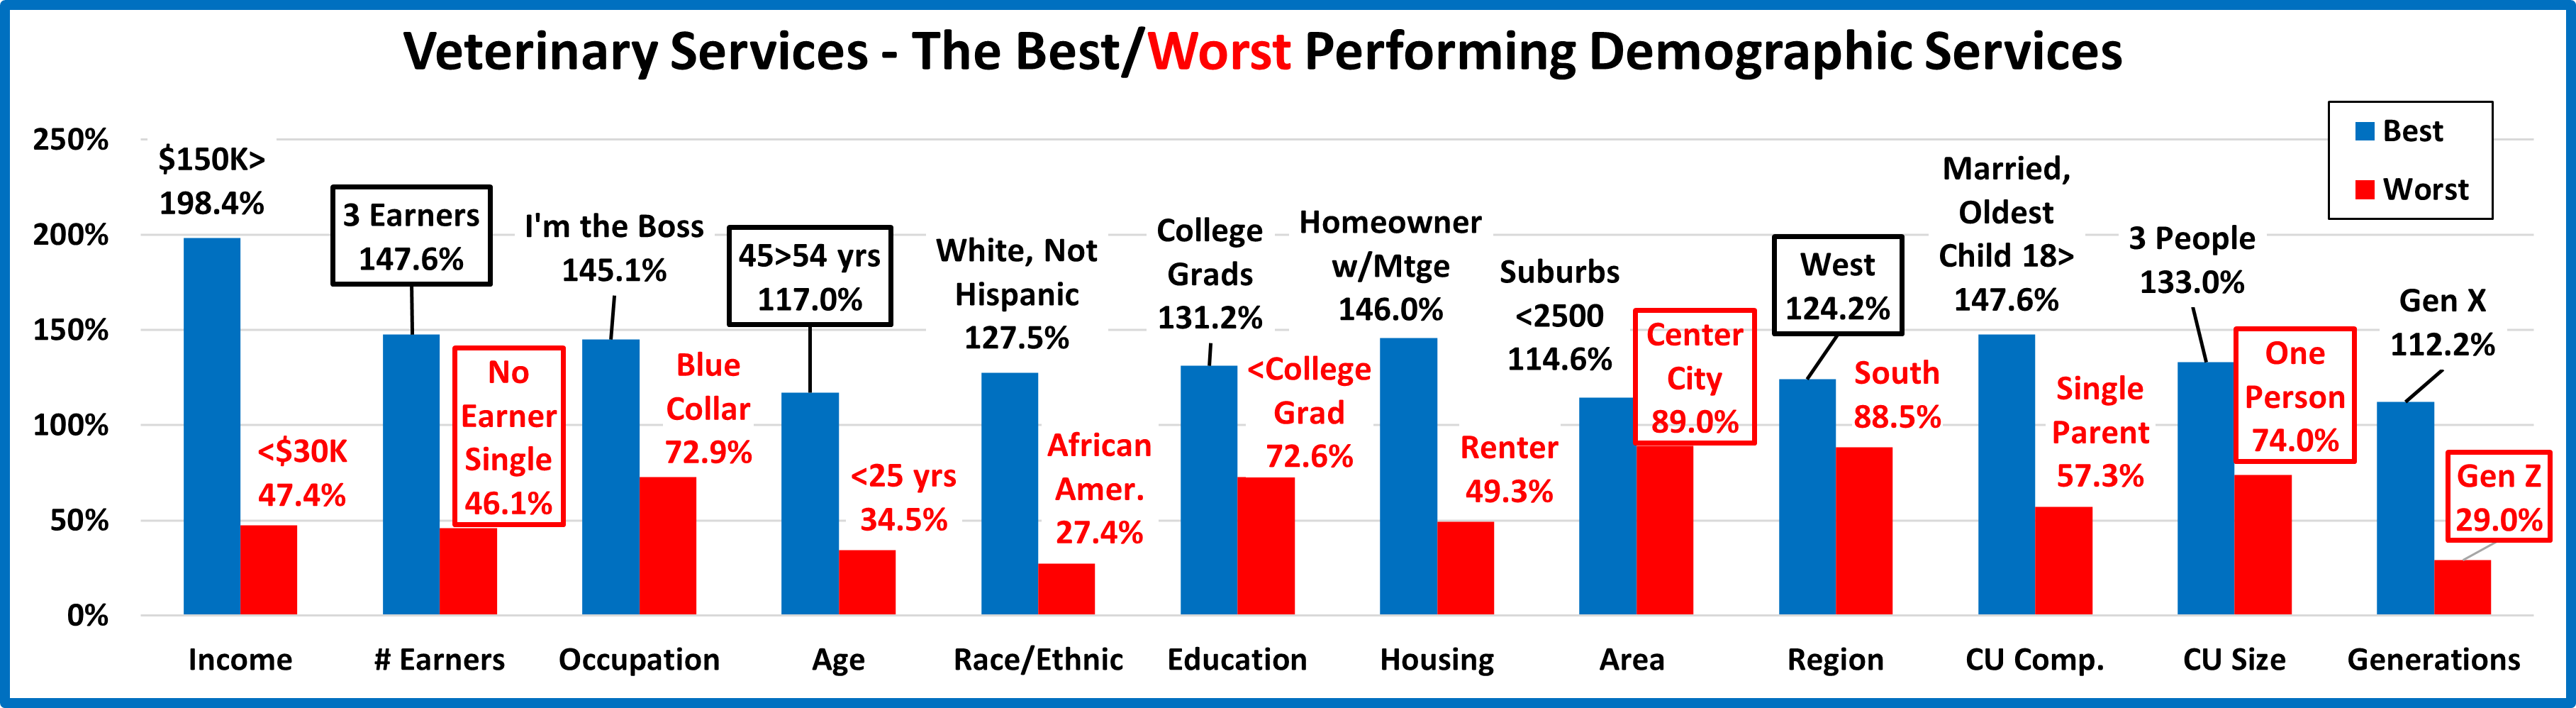
Almost all of the best and worst performers are those that we would expect. However, there are 7 that are different from 2019. This is the same as Services but much more than the 3 in Supplies and much less than the 10 in Food. This suggests some spending turmoil. The changes from 2019 are “boxed”. We should note:
- Income – The winner & losers are the expected groups but they are 30% closer together.
- Earners – New, but not unexpected, winner and loser. They have the highest and lowest incomes.
- Occupation – Once again, it’s all about income
- Age – The highest income group, 45>54 yr-olds returned to the top. Despite a strong showing by the 25>34 group, only those from 35>74 perform above 100%.
- Race/Ethnic; Education; Housing – The usual winners and losers but the performance gap narrowed a bit.
- Area – A fundamental change in the loser based upon population. Last year it was Rural. This year it’s Center City.
- Region – After winning for 5 straight years, the Northeast was replaced by the West at the top. The West is also the only region performing above 100%. The South has now finished last for 5 years in a row.
- CU Composition – No change here but again the performance gap narrowed a little, 10%.
- # in CU – Only 2 & 3 person Cu’s perform above 100%. We have seen spending movement to larger CUs. This is very apparent in Veterinary as the 5+ group spent 67% more and moved up a little after 2 years at the bottom.
- Generation – The loser flipped from the oldest to the youngest and the performance gap widened by 30%.
It’s time to “Show you the money”. Here are segments with the biggest $ changes in Veterinary Spending.
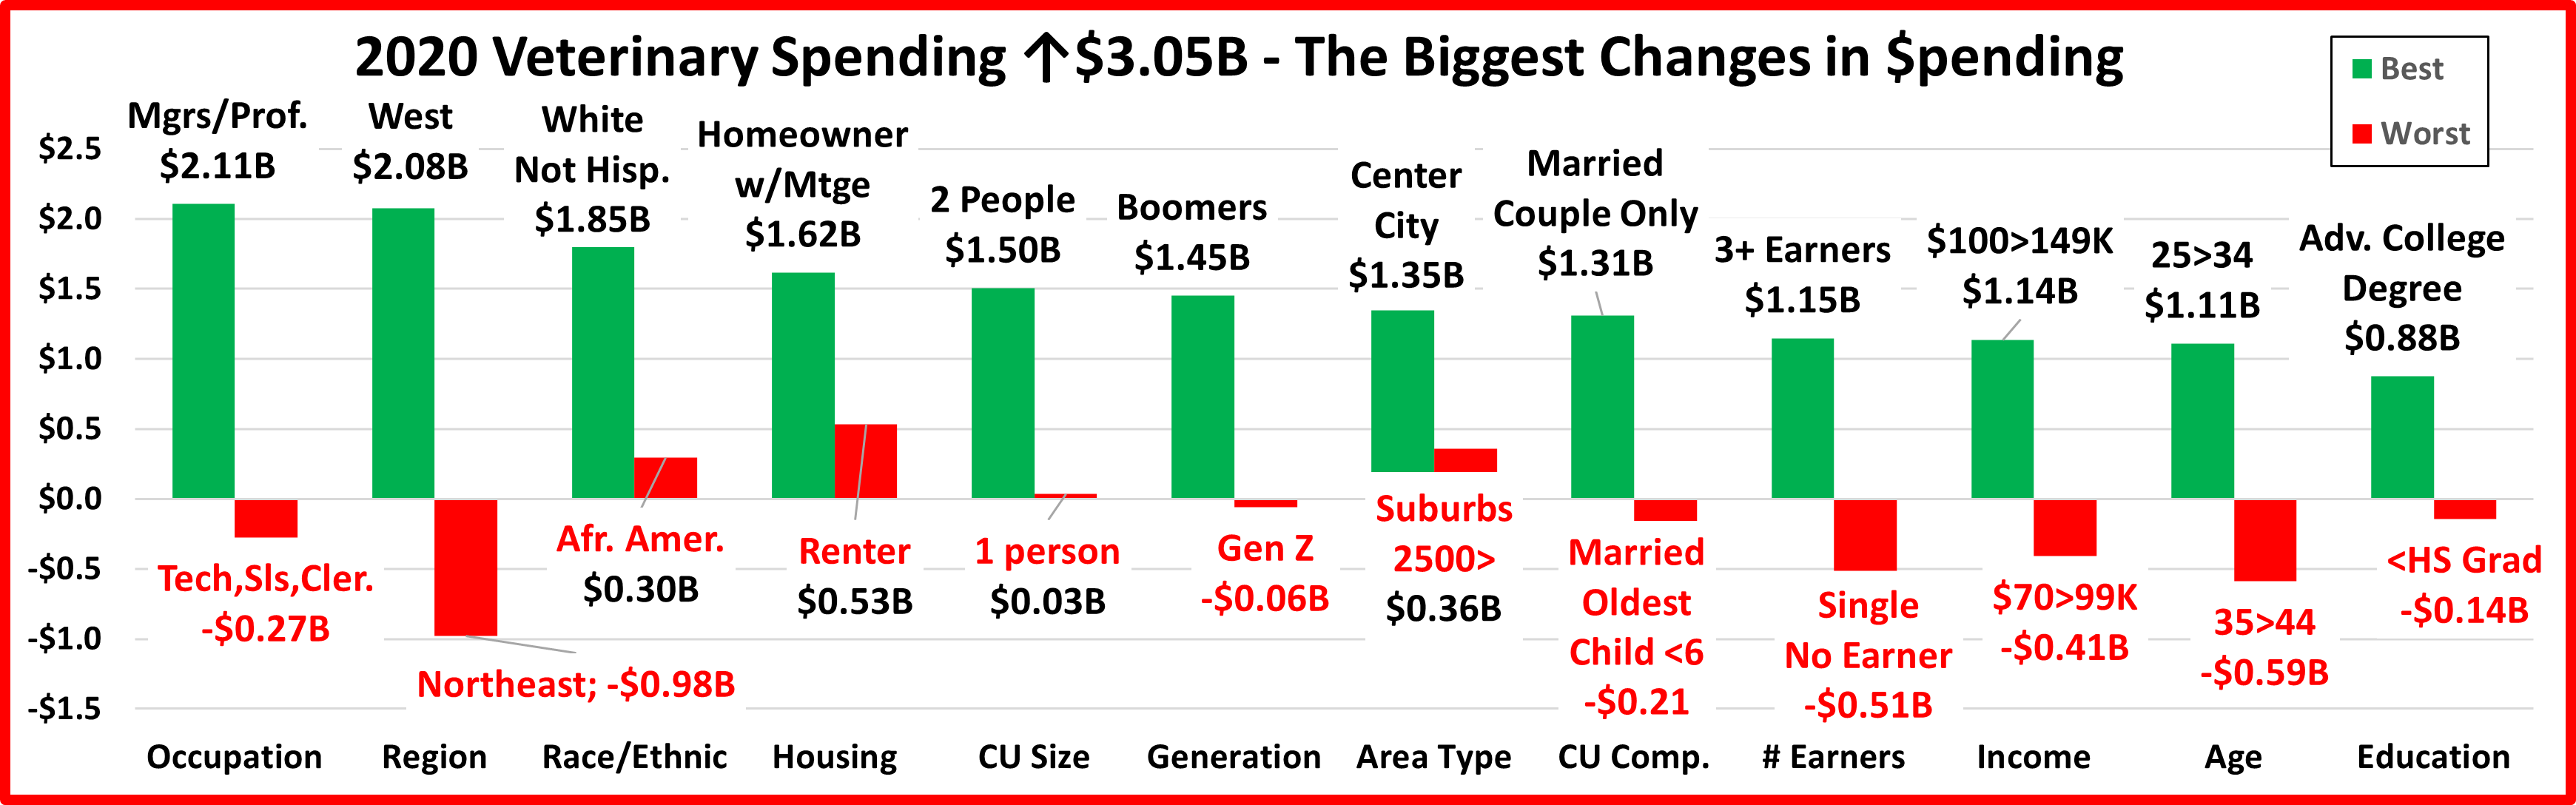
We saw some turmoil in performance. There was even more here. There were 4 repeats and 10 segments flipped from 1st to last or vice versa. Last year they had 8 repeats and 4 flips. There were some surprise winners – 25>34 yr-olds & Center City but no surprise losers. In fact, in 4 categories all segments spent more. You should also note the increases were significantly larger than the decreases and 85% of 96 demographic segments spent more. Here are the specifics:
- Occupation – The winner and loser flipped with the “Bosses” returning to the top.
- Winner – Mgrs & Professionals– Veterinary Spending: $9.87B; Up $2.11B (+27.1%) 2019: Tech/Sales/Clerical
- Loser – Tech/Sales/Clerical – Veterinary Spending: $3.42B; Down $0.27B (-7.4%) 2019: Mgrs & Profess.
- Comment – The highest income groups – Self-Employed and Mgrs & Professionals accounted for 90% of the increase. Blue Collar workers did spend $0.41B more but Retirees spent a little less, -0.04B (-1.0%).
- Region – The Northeast flipped from 1st to last. They have now flipped for 3 consecutive years.
- Winner – West – Veterinary Spending: $7.01B; Up $2.08B (+42.1%) 2019: Northeast
- Loser – Northeast – Veterinary Spending: $4.10B; Down $0.98B (-19.3%) 2019: Midwest
- Comment – The South finished 2nd for the 4th consecutive year. All but the Northeast had double digit % gains.
- Race/Ethnic – Both groups held their spots as White, non-Hispanics maintained their dominance in this segment.
- Winner – White, Not Hispanic – Veterinary: $21.67B; Up $1.85B (+9.3%) 2019: White, Not Hispanic
- Loser – African American – Veterinary: $0.87B; Up $0.30B (+51.8%) 2019: African Americans
- Comment– In 2019 only African Americans spent less. In 2020 everyone spent more. This shows that Pet Parents’ commitment to the health & wellbeing of their Pet Children is widespread across all racial/ethnic groups.
- Housing – Homeowners w/Mtges held their position at the top.
- Winner – Homeowner w/Mtge – Veterinary: $14.06B; Up $1.62B (+13.0%) 2019: Homeowner w/Mtge
- Loser – Renter – Veterinary: $4.19B; Up $0.53B (+14.5%) 2019: Homeowner w/o Mtge
- Comment – Every segment spent more and in fact, Homeowners w/Mtges had the lowest percentage increase. They won because they account for 56.6% of all Veterinary spending.
- # in CU – Both the winner and loser flipped.
- Winner – 2 People – Veterinary Spending: $9.73B; Up $1.50B (+18.3%) 2019: 1 Person
- Loser – 1 Person – Veterinary Spending: $5.48B; Up $0.03B (+0.6%) 2019: 2 People
- Comment: Again, all groups spent more. 4 Person CUs and singles had increases under 2% while everyone else was in double digits, led by 5+ CUs who were up 67%.
- Generation – Baby Boomers flipped from last to first as they focused on their Pets’ needs – Food & Veterinary.
- Winner – Baby Boomers – Veterinary: $8.93B; Up $1.45B (+19.4%) 2019: Millennials
- Loser – Gen Z – Veterinary: $0.20B; Down $0.06B (-22.5%) 2019: Baby Boomers
- Comments – After 2 years at the bottom Boomers returned to the top. Millennials also had a good year, +$1.1B. Gen Z was the only generation to spend less.
- Area Type – Center City is a bit of a surprise and the big suburbs flipped from 1st to last.
- Winner – Center City – Veterinary Spending: $8.17B; Up $1.35B (+19.8%) 2019: Suburbs 2500>
- Loser – Suburbs 2500> – Veterinary Spending: $11.57B; Up $0.36B (+3.2%) 2019: Suburbs <2500
- Comment – All groups also spent more. The question became “How much more?” With 33% of the $ and a 20% increase, Center City won. Suburbs 2500> have 47% of $ but were only +3%. By the way, Rural was +80%.
- CU Composition – Married Couple Only flipped from last to 1st.
- Winner – Married, Couple Only – Veterinary: $7.04B; Up $1.31B (+22.9%) 2019: Singles
- Loser – Married, Oldest Child <6 – Veterinary: $0.95B; Down $0.21B (-18.2%) 2019: Married, Couple Only
- Comment – After a $0.72B increase in 2019, the loser was the only segment to spend less. Single Parents spent 68% more but 63% of the total $ increase came from Married Couples Only and those with a child over 18.
- # Earners – Both the winner and loser are new, but not surprising.
- Winner – 3+ Earners – Veterinary Spending: $3.26B; Up $1.15B (+54.2%) 2019: 2 Earners
- Loser – No Earner, Single – Veterinary Spending: $1.45B; Down $0.51B (-26.1%) 2019: 1 Earner, 2+ CU
- Comment – The winner and loser have the highest and lowest incomes and No Earner, Singles were the only group to spend less. Income is of primary importance to increased Veterinary Spending & # of earners is important. However, not every adult has to work. 1 Earner, 2+ Person CUs was only beaten by $0.03B.
- Income – $100>149K flipped from last to first.
- Winner – $100>149K – Veterinary Spending: $5.04B; Up $1.14B (+29.1%) 2019: <$30K
- Loser – $70>99K – Veterinary Spending: $3.74B; Down $0.41B (-9.8%) 2019: $100>149K
- Comment – Two groups spent less, $50>69K & $70>99K. Last year we had a definite spending rollercoaster. It’s still here in 2020, but with bigger groups. <$50K: +$1.82B; $50>99K: -$0.48B; $100K>: +$1.69B.
- Age – In a bit of a surprise, the 25>34 yr-olds won while 35>44 flipped from 1st to last.
- Winner – 25>34 yrs – Veterinary Spending: $3.74B; Up $1.11B (+42.2%) 2019: 35>44 yrs
- Loser – 35>44 yrs – Veterinary Spending: $4.47B; Down $0.59B (-11.6%) 2019: 45>54 yrs
- Comment: Two groups spent less, the 35>44 yr-olds and the <25 group. Everyone else had double digit percentage increases. The 25>34 group is only 4th in income and 5th in Veterinary spending performance so their win is unexpected. Apparently, they were motivated by the pandemic. Their Services $ were flat but they spent a lot more in all other segments.
- Education – Those with an Advanced College Degree held their spot at the top.
- Winner – Adv. College Degree – Veterinary Spending: $7.41B; Up $0.88B (+13.4%) 2019: Adv. College Degree
- Loser – <High School Grads – Veterinary Spending: $0.34B; Down $0.14B (-29.4%) 2019: Associates Degree
- Comment – Only those without a HS Diploma spent less. College grads were up $1.29B (+9.3%). However, those with a HS Diploma but not a BA/BS spent $1.89B (+25.6%) more so the lift was widespread.
We’ve now seen the winners and losers in terms of increase/decrease in Veterinary Spending $ for 12 Demographic Categories. The 2020 pandemic brought strong growth in Veterinary spending. However, there was some turmoil as only 4 segments held their spot from 2019 while 10 flipped from first to last or vice versa, but with almost no surprising winners. The surprise was in how widespread the spending lift was. In 4 categories, no segments spent less and overall, 85% of all demographic segments spent more. This means that there were “hidden” segments that didn’t win but made a significant contribution to the $3B increase. These groups don’t win an award, but they certainly deserve….
HONORABLE MENTION
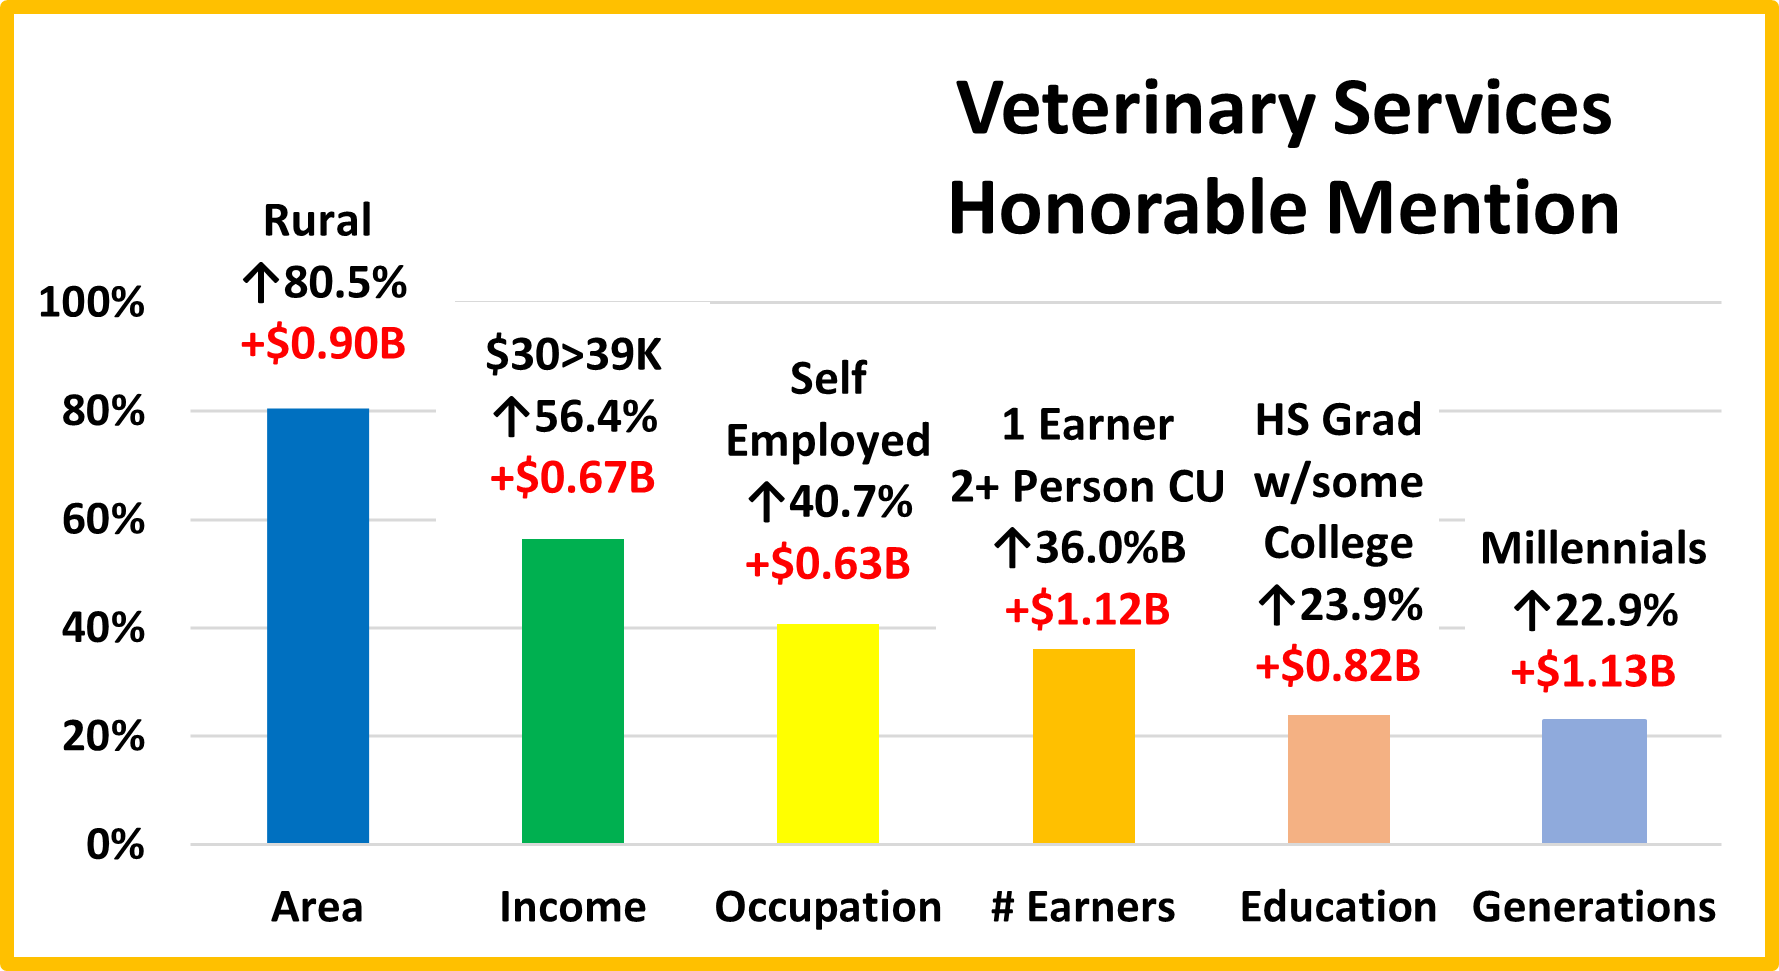
Center City won but Rural came in second – the opposite ends of the population spectrum. Income matters as Self-Employed finished 2nd to Managers & Professionals. However, spending became a little more balanced in both Income & Education which is reflected by the performance of the $30>39K, 1 Earner, 2+CU and HS Grads w/some College groups. It also wasn’t all about Baby Boomers and Gen X. The younger Millennials certainly stood up with a $1B increase in spending. There are many more groups that could be included as 82 of 96 segments (85%) spent more on Veterinary Services. That is significantly better than 57% in 2019 and 63% in 2018. 2020 was a good year!
Summary
2016 and 2017 produced a combined increase of $3.6B in Veterinary Spending as inflation moved to record low levels. In 2018 we had the Baby Boomer Spending “Bust” which especially impacted Food and Veterinary. The Boomers spending continued to fall in 2019. Fortunately, Gen X and Millennials stepped up to produce a small. 2.7% increase in both years. In 2020 the pandemic focused Pet Parents on the needed segments. This drove a $3B increase in Veterinary $. Boomers & Millennials led the way, but the lift was widespread as 85% of demographic segments spent more.
There was some turmoil in the segment, but the net result is that spending became a little more balanced in most demographic categories. In general, the size of the increases far exceeded the size of the decreases. In fact, in 4 categories all segments increased spending. Income and Education remain of primary importance in terms of increased spending.
Income: Performance generally increases with income and reaches it’s highest level, nearly 200% at $150K>. The “halfway” point (50%) occurred at $70>99K in 2020. This is the 1st time that the halfway point has fallen below $100K. Spending may be more balanced, but you can see that there is still a huge disparity.
Higher Education: Performance increases with Education but doesn’t reach 100% until you have a BA/BS degree. The performance of HS Grads with an Associate Degree or at least some college is now over 90%. Those with a College Degree perform at 131%. The disparity is not as bad as Income but still big. Equality in both categories is a long way off.
The performance of other big spending groups is also very important in the Veterinary segment. We identified six demographic categories with high performing large groups. (There were 5 for Supplies and Services but 8 for Food). Consumers have no control over Race/Ethnicity but in addition to Income and Education, Homeownership, # Earners & Marriage are also important factors in Veterinary spending. All groups but Marriage are tied to income and their high performance demonstrates that there are still big spending disparities among segments within these categories.
There were some changes of note. Marriage returned to prominence while a strong year by the 25>34 yr-olds drove the performance of the 35>64 age group significantly down.
In 2019 Veterinary spending increased +2.7% while prices rose 4.14% – a net decrease in the amount of Services. In 2020 spending grew +14.0% while inflation was 3.7%. That’s over 10% in real growth, a very positive situation. Also, although Boomers and Millennials drove the lift, increases were widespread across demographics making Veterinary spending more balanced. In 2021, the overall U.S. economy has largely recovered. We’ll see if Pet Parents continue to spend heavily on Veterinary Services.
Finally – The “Ultimate” Veterinary Services Spending Consumer Unit consists of 3 people – a married couple and their 18 yr old child. They are 45 to 54 years old. They are White, but not of Hispanic origin. At least one of them has an Adv. College Degree. Both are Mgrs/Professionals and their child also works. Their total income is $150>$200K. They live in a small suburb, adjacent to a big city in the Western U.S. and are still paying off the mortgage on their home.

