
2020 U.S. PET SUPPLIES SPENDING $15.16B…DOWN ↓$1.65B
Total Pet spending grew to $83.74B in 2020, up $5.31B (+6.8%) from 2019, a big turnaround. Unfortunately, the Supplies segment was on the other side as spending dropped to $15.16B, down $1.65B (-9.8%). (Note: All numbers in this report come from or are calculated by using data from the US BLS Consumer Expenditure Surveys)
After flattening in the 2nd half of 2018, spending turned sharply down in the 1st half of 2019 and continued to decline through 2020 as the pandemic also contributed to the drop. 2019 & 2020 wiped out 93% of a 24 month $5B gain. We’ll “drill down” into the data to try to determine what and who are “behind” the 2020 drop in Supplies Spending.
In 2020, the average household spent $115.52 on Supplies, down 9.1% from $127.15 in 2019. (Note: A 2020 Pet CU (67%) Spent $172.42) This doesn’t exactly match the -9.8% total $ decrease. Here are the specific details:
- 0.8% less CU’s
- Spent 3.6% less $
- 5.8% less often
Let’s start with a visual overview. The chart below shows recent Supplies spending history.
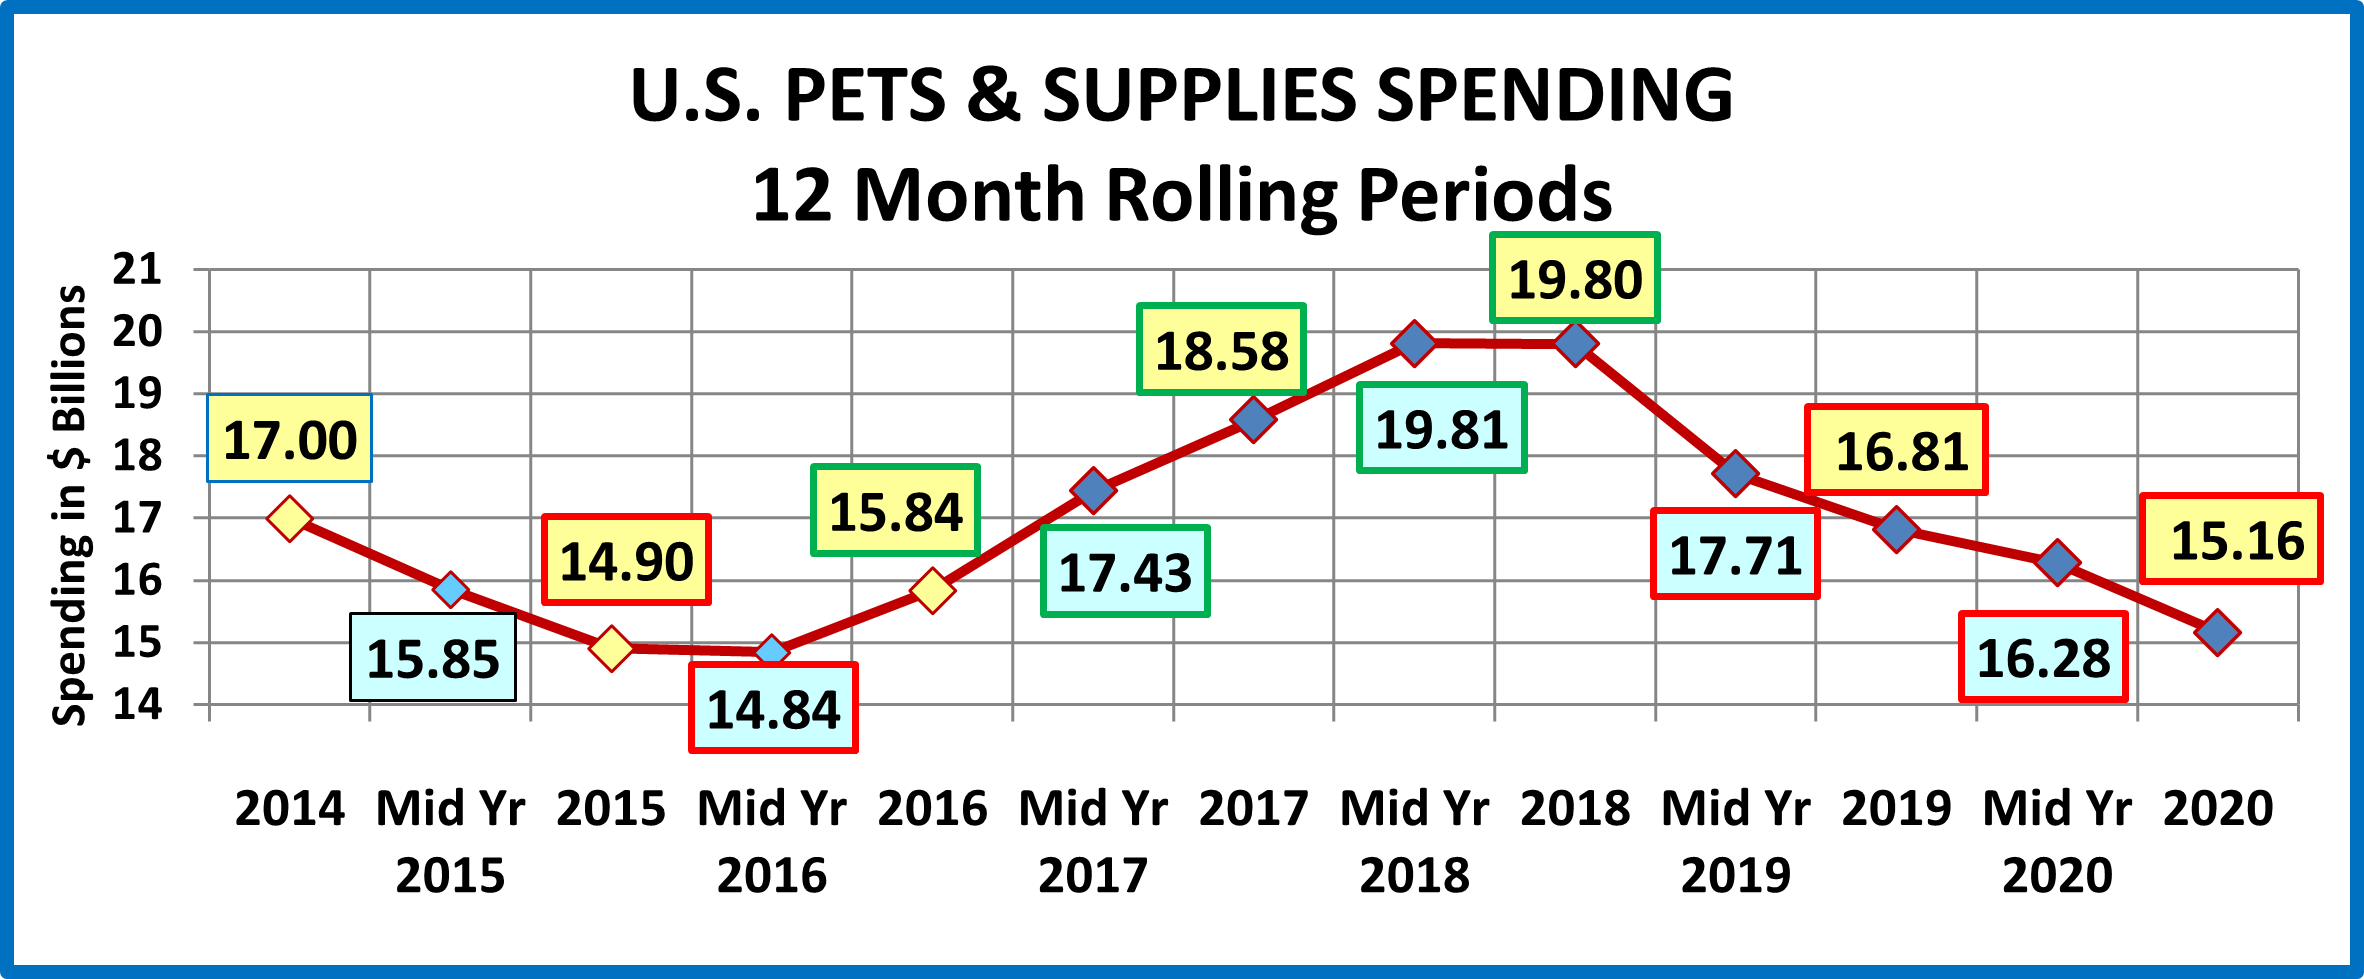
Since the great recession, spending trends in the Supplies segment have been all about price – the CPI. Although many supplies are needed by Pet Parents, when they are bought and how much you spend is often discretionary. Additionally, many of the product categories in this segment are now considered commodities, so price is the main driver behind consumer purchasing behavior. When prices fall, consumers are more likely to buy more. When they go up, consumers spend less and/or buy less frequently.
2014 was the third consecutive year of deflation in Supplies as prices reached a level not seen since 2007. Consumers responded with a spending increase of over $2B. Prices stabilized and then moved up in 2015.
In 2015 we saw how the discretionary aspect of the Supplies segment can impact spending in another way. Consumers spent $5.4B for a food upgrade and cut back on Supplies – swapping $. This, in conjunction with inflation, caused supplies to suffer as consumers spent 4.1% less, but they bought 10% less often. That drop in purchase frequency drove $1.6B (78%) of the $2.1B decrease in Supplies spending.
In 2016, supplies’ prices flattened out and consumers value shopped for their upgraded food. Supplies spending stabilized and began to increase in the second half. In 2017 supplies prices deflated, reaching a new post-recession low. The consumers responded with a huge $2.74B increase in Supplies spending that was widespread across demographic segments. An important factor in the lift was an increase in purchase frequency which was within 5% of the 2014 rate.
In 2018 prices started to move up in April and rapidly increased later in the year due to the impact of new tariffs. By December, Supplies prices were 3.3% higher than a year ago. This explains the initial growth and pull back in spending.
In 2019 we saw the full impact of the tariffs. Prices continued to increase. By yearend they were up 5.7% from the Spring of 2018 and spending plummeted -$2.98B. The major factor in the drop was a 13.1% decrease in purchasing frequency.
2020 brought the pandemic, with retail restrictions and the consumers focus on needed items. Both the amount spent and frequency of purchase of Supplies fell slightly. This could be the result of a strong consumer move to the internet.
That gives us an overview of the years leading up to 2020. Now let’s look at some specifics regarding the “who” behind the 2020 numbers. First, we’ll look at spending by income level, the most influential demographic in Pet Spending.
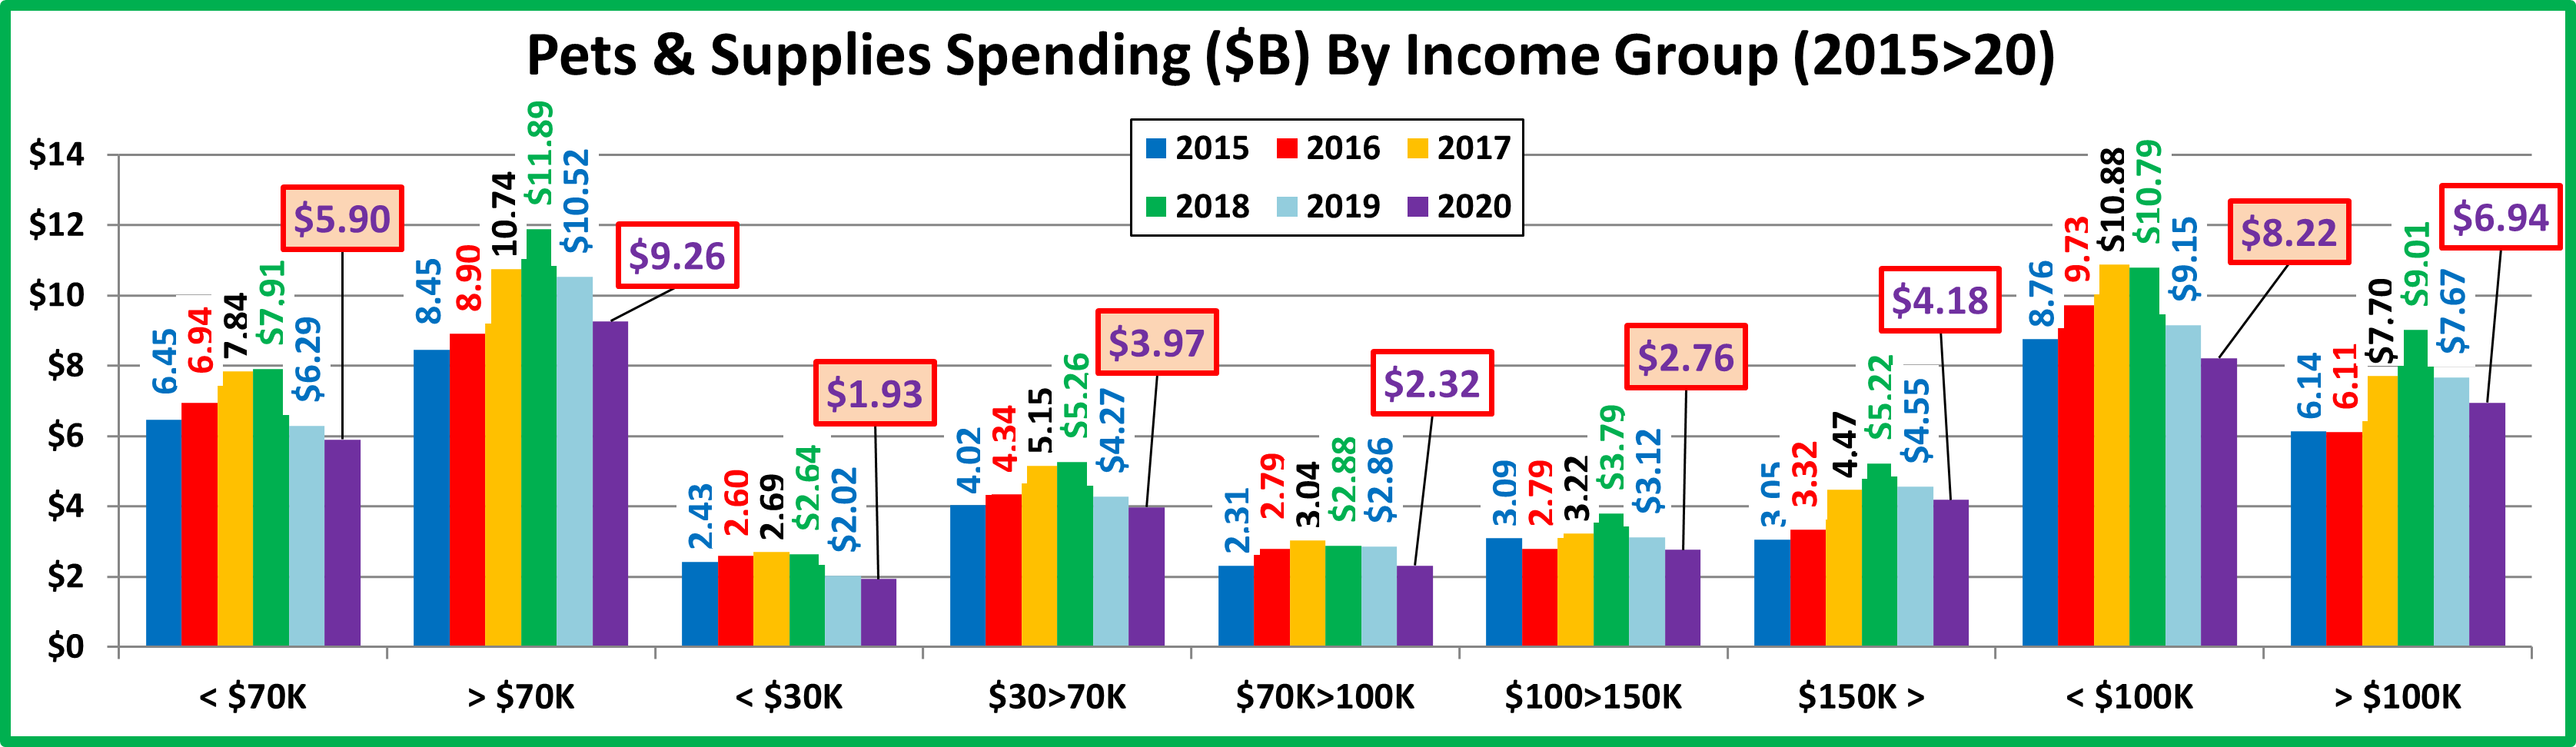
National: $115.52 per CU (-9.1%) – $15.16B – Down $1.65B (-9.8%).
All big income groups spent less but the 50/50 $ divide remained the same as 2019, $92K, the lowest of all segments.
- <$30K (25.4% of CU’s)- $57.73 per CU (+2.1%) $1.93B– Down $0.09B (-4.6%). This group is very price sensitive, but they actually spent more per CU. 6.5% fewer CUs caused the decrease and put them even further below 2015 $.
- $30K>70K (31.1% of CU’s)- $97.38 per CU (-5.1%) $3.97B Down $0.30 (-7.0%). This big, lower income group closely matches both the national pattern and that of the $150K+ group. The tariff prices had a big impact and COVID a lesser one. Amazingly enough, until 2019 they were the leader in Total Supplies Spending $.
- $70>$100K (15.0% of CU’s) – $117.65 per CU (-21.3%) – $2.32B Down $0.54B (-19.0%). This middle-income group had been consistent in Supplies spending. 2020 hit them hard in all segments, including a 19% drop in Supplies $.
- $100K>$150K (14.4% of CU’s) – $146.42 per CU (-14.4%) – $2.76B Down $0.36B (-11.4%). This higher income group is also sensitive due to family needs. They had the 2nd biggest % drop and traded Supplies $ for Food & Veterinary.
- $150K> (14.1% of CU’s) – $225.91 per CU (-13.0%) $4.18B Down $0.36B (-8.0%). The $150>199K was up $0.01B but the $200K+ group spent $0.38B less. Money matters in Supplies, but the pandemic impact was widespread.
Every group spent less but the biggest negative impact occurred in the middle range – $70K >$150K. This group has the biggest family and career pressures, so it is not surprising that their discretionary spending on Supplies was less.
Now, we’ll look at spending by Age Group.
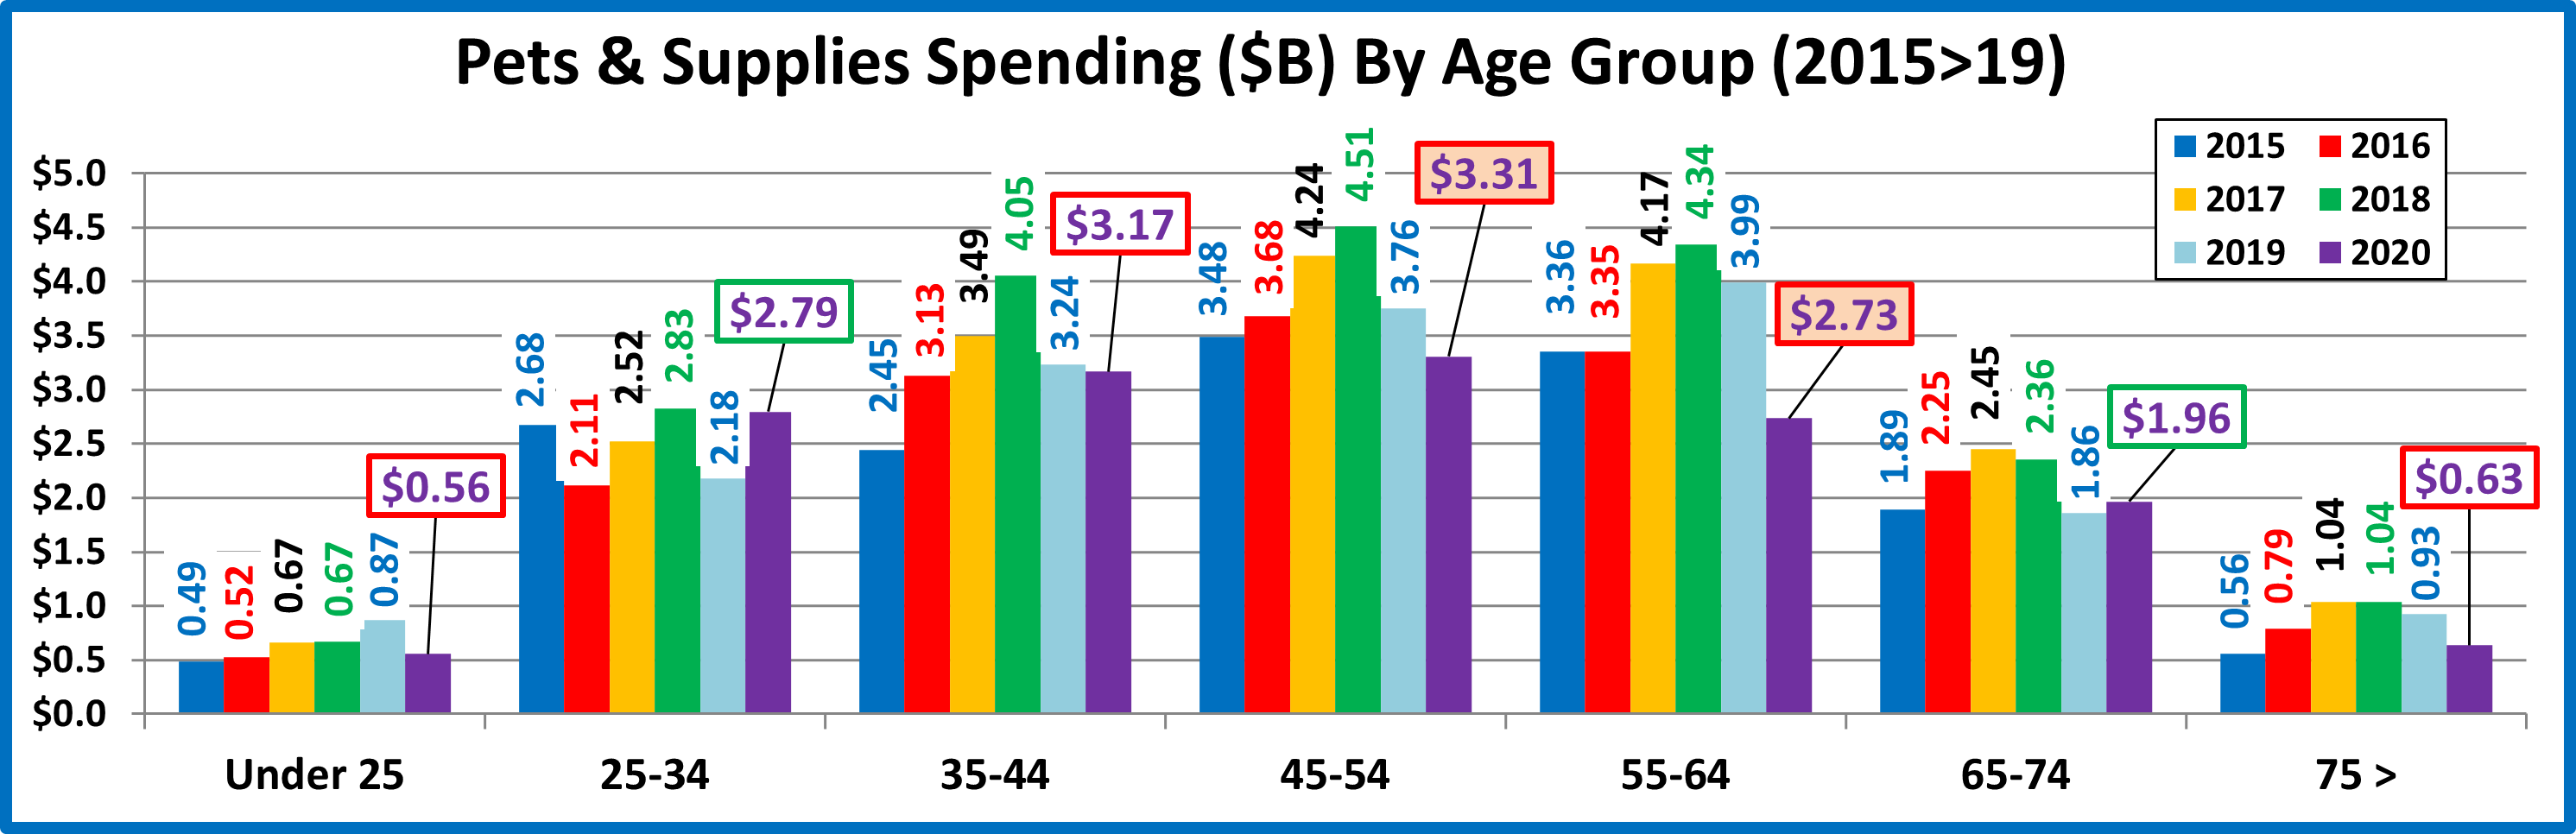
National: $115.52 per CU (-9.1%) – $15.16B – Down $1.65B (-9.8%).
It’s split, but simple. Young Millennials and old Boomers spent more. Everyone else spent less. Here are the details.
- 55>64 (19.1% of CU’s) $108.93 /CU (-33.0%) – $2.73B – Down $1.26B (-31.5%). Low Supplies prices in 2017 got them on the Supplies Band Wagon. When prices turned sharply up in the 2nd half of 2018 and 2019, spending stalled then dropped. Spending fell again in 2020 as 2.2% more CU’s spent 26.2% less on Supplies, 9.2% less often. Part of the cut back on Supplies was to help pay for a huge spending increase in Food as they traded $.
- 45>54 (17.2% of CU’s) $146.36 per CU (-13.2%) – $3.31B – Down $0.45B (-11.9%). Until 2019, this highest income age group had been the leader in Supplies spending since 2007. More CU’s (+1.5%) spent 6.8% less on supplies, 6.9% less often. They had a 12% drop but returned to the top $ spot, now battling the 35>44 group.
- 35>44 (17.0% of CU’s) $141.94 per CU (-2.1%) – $3.17B; Down $0.07B (-2.2%). This group is second in income and overall expenditures but also has the biggest families. After 3 strong years, the strong inflation drove the $ down in 2019. However, the Pandemic had little impact. 0.1% less CUs spent 5.5% more $, 7.2% less often.
- 25<34 (16.0% of CU’s) $133.17 per CU (+29.8%) – $2.80B; Up $0.62B (+28.3%). After trading Supplies $ for upgraded Food and Vet Care in 2016, these Millennials turned their attention back to Supplies. The rising prices hit them hard in 2019 but they reversed this in 2020 as 1.2% fewer CUs spent 30.4% more $, 0.5% less often.
- 65>74 (15.6% of CU’s) $96.07 per CU (+2.1%) – $1.96B – Up $0.11B (+5.8%). This older group is very price sensitive. When prices turned up in 2018, they immediately cut back on spending which continued into 2019. They came back in 2020 but not as strong as the 25>34 group. 3.7% more CUs spent 4.9% more, 2.7% less often
- 75> (11.2% of CU’s) $43.04 per CU (-31.4%) – $0.63B, Down $0.29B (-31.5%). This lowest income group is truly price sensitive. They began to cut back on spending in the 2nd half of 2018 and this behavior continued in 2019. Their spending was severely impacted by the Pandemic as 0.2% less CU’s spent 19.4% less, 14.9% less often.
- <25 (3.8% of CUs) $110.71/CU (-6.4%) $0.56B – Down $0.31B (-35.6%). 31.2% fewer CUs spent 8.8% less $, 2.6% more often. This group was fundamentally impacted by COVID as they lost 2.2M CUs, down 31.2%.
The impact of COVID was widespread but mixed. Only 2 disparate groups – 25>34 and 65>74 spent more.
Next, let’s take a look at some other key demographic “movers” in 2020 Pet Supplies Spending. The segments that are outlined in black “flipped” from 1st to last or vice versa from 2019. The red outline stayed the same.
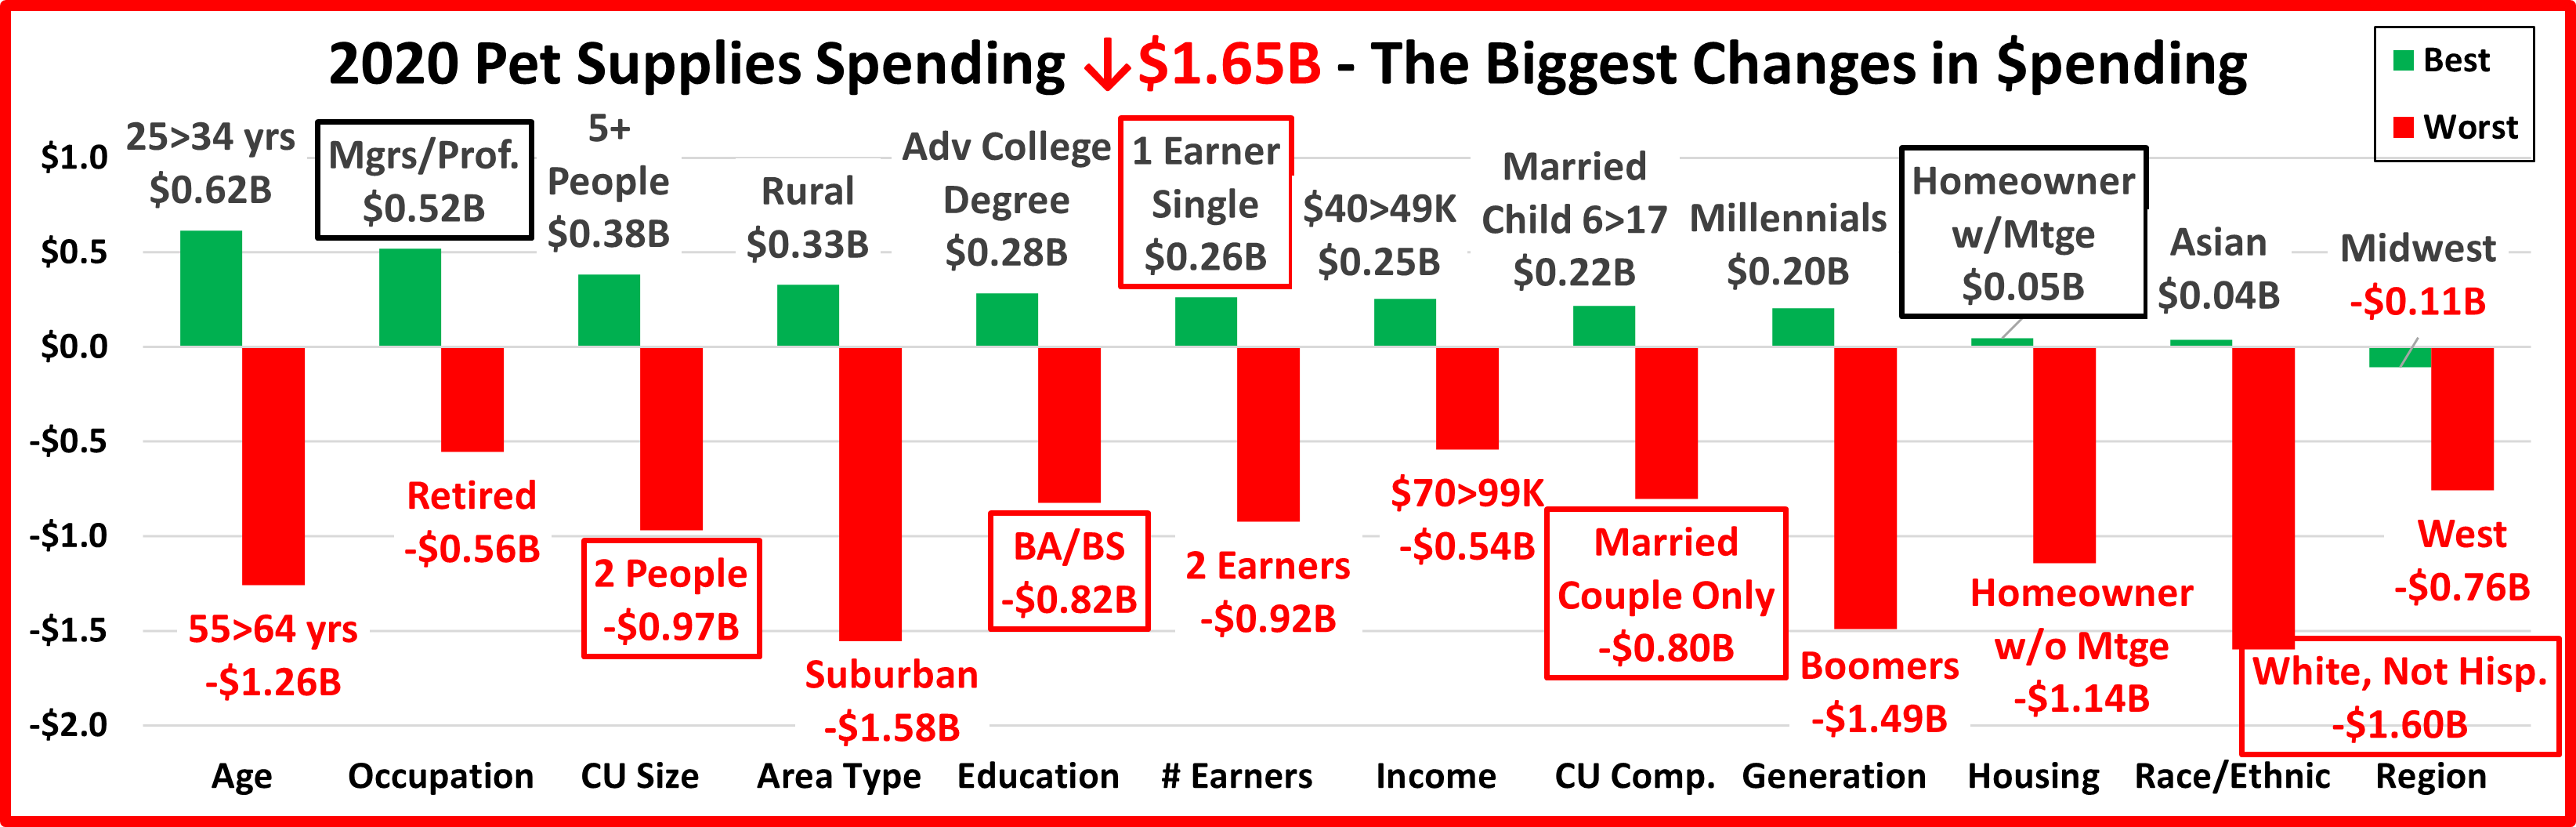
In 2019, in 9 of the 12 demographic categories all segments spent less on Supplies. In 2020 it was only 1. Also in 2019, 97% of 96 demographic segments spent less. In 2020 it was 81%. 2020 was bad but still an improvement over 2019.
Only 2 segments flipped from last to 1st as Managers/Professionals and Homeowners w/Mtge returned to their usual position at or near the top. 5 Segments held their position – 1 on top, 4 on the bottom. All of these are surprises as they are often in the opposite spot.
On the “winning” side there are a couple “usual suspects” – Mgrs/Prof & Adv. College Degree. The others are all somewhat surprising although Supplies has trended younger in recent years which would include Millennials & 25>34 yr olds. On the losing side, we already mentioned 4 surprises but there are a couple more – Suburban & 2 Earners.
Supplies is a discretionary segment, so it is more susceptible to market factors than the more needed segments. In fact, Supplies spending has decreased in 16 years since 1984. Since 2010, it has become very commoditized and price sensitive. 2 years of deflation drove spending up $5B. Then inflation hit and things turned around, -$2.98B. The 2020 Pandemic caused Pet Parents to focus on Pet Needs. This means that the more discretionary categories, Supplies & Services, lost ground. The overall decrease in Supplies was relatively small, under 10%, compared to the changes in other segments but it still shows the vulnerability of this more discretionary segment.

