2022 Retail Sales Revisited – The Impact of Runaway Inflation
Inflation continues to make headlines as the prices for many products have risen over 2021 at the highest rate in 40 years. In recent years, the year over year inflation rate has hovered at about 2%. That’s why the March inflation number of 8.5% over 2021 has gotten so much attention.
It got my attention too. I decided to look a little closer at the expenditure categories and the methodology used by the US Bureau of Labor Statistics to compute the CPI (Inflation). I am also enamored by the Monthly Retail Sales report produced by the Census Bureau. This is the most accurate and timely measurement of the sales in the U.S. Retail market. However, we must note that the data only comes from outlets classified as retailers or restaurants & bars. Outlets whose primary business is Services, from Movie Theaters to Hair Salons, are not included. They have their own report. The outlets in the Monthly Retail report are “all about” products. A few of these channels may provide a small number of services but in the overall scheme of things the $ are inconsequential. Pet Stores are one of the retail outlets included in the report and they offer Pet Services. However, according to the most recent Economic Census, Pet Services only account for 6% of Total Pet Stores’ sales. The vast majority of true Retail outlets offer no services.
So how is the CPI market basket divided between Commodities (Products) and Services? The relative importance of expenditures is validated from data gathered in the annual Consumer Expenditure Survey, which is managed by the US BLS but executed by Census Bureau personnel. The base relative importance is updated every 2 years in December of odd numbered years. It is revised monthly, but the base is the key starting point.
In December 2021 The Relative Importance was
Total CPI: 100; Services: 60.9; Commodities: 39.1
I was taken by surprise by these numbers. I had no idea that Services were 50% more important than Commodities in measuring inflation. Let’s look at the March 2022 year over year inflation numbers again:
Total CPI: +8.54%; Services: +5.12%; Commodities: +14.17%
Obviously, for those involved in the retail trade, inflation is significantly worse than even what is being trumpeted in the headlines. Much has been said about overall inflation being the worst in 40 years. I downloaded the CPI data for Commodities. They have monthly numbers going back to 1956. The 14.17% YOY inflation rate in March was the highest for any month in the entire 66-year database. Another thing is very clear. Just using the overall CPI rate for retail is not accurate. I researched commodities and it turns out that the All Commodities aggregate accurately reflects Total Retail. At the end of the report, I have a condensed listing of CPI expenditure categories so that you can check my reasoning.
But now let’s take a look at 2022 Total Retail Sales, including the 4 Major Groups – Restaurants, Auto, Gas Stations and Relevant Retail. We show the sales change from 2021 for each month and YTD.
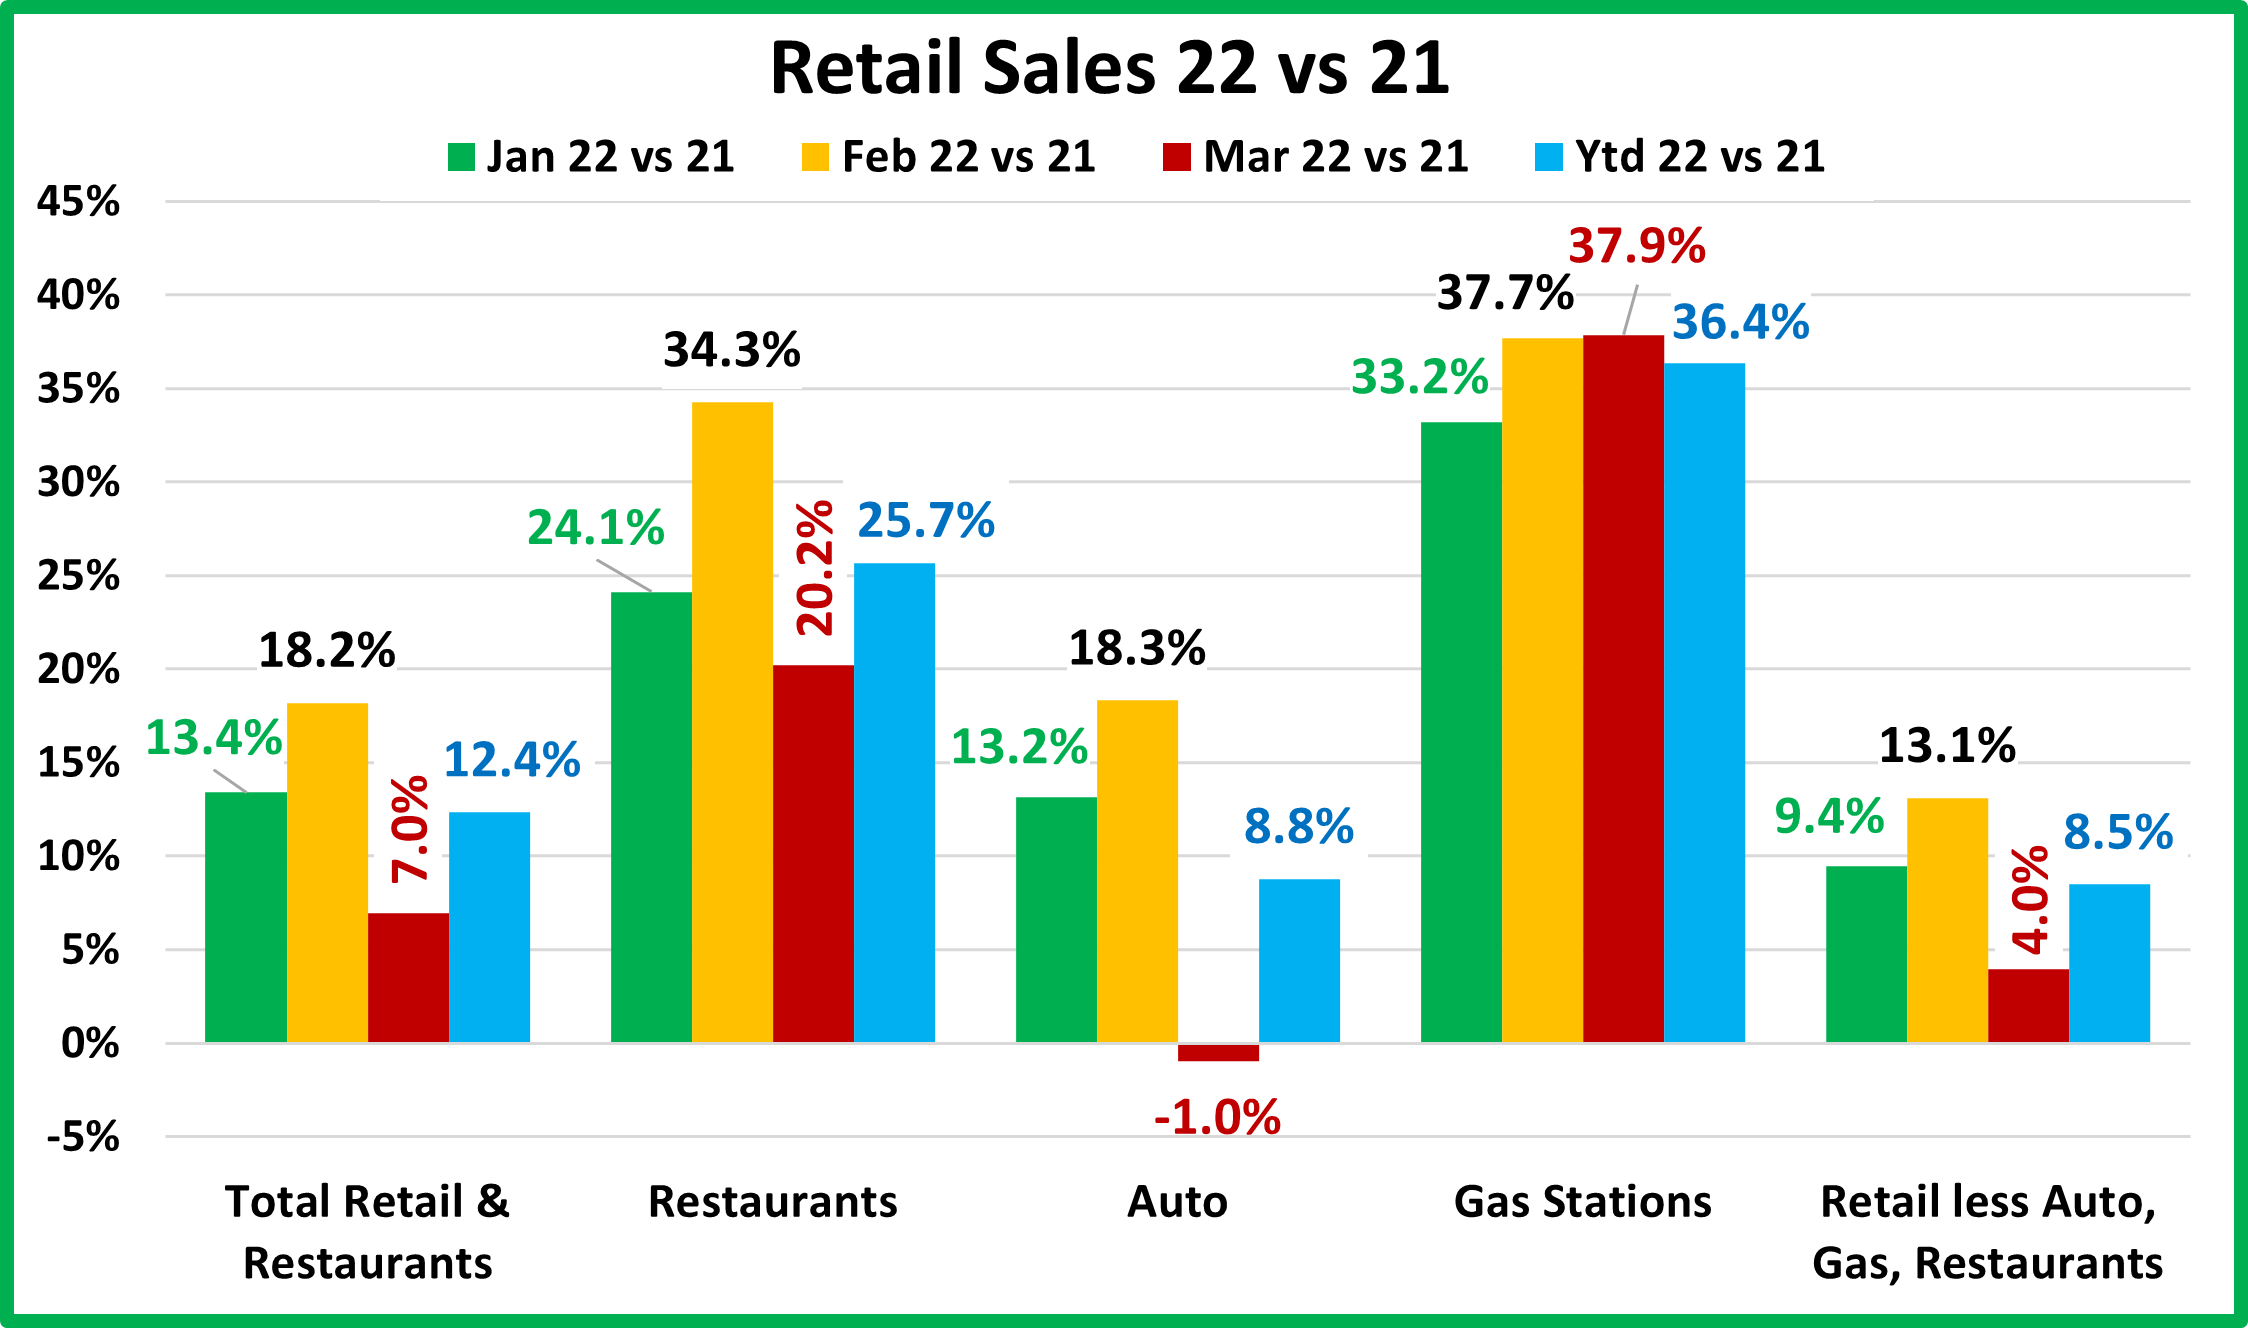
As we hear in all the news flashes. Despite inflation, sales are up. The gains by Gas Stations and Restaurants are spectacular but remember they were the hardest hit by the pandemic and recovery came late. You can also see that the overall increase slowed significantly in March. Gas Stations maintained their rate of increase but Auto actually had a slight decrease in Sales. The YTD numbers look good for all.
Now let’s see what inflation looks like so far this year.

Before we get into the numbers, let’s talk about the expenditure categories that I used. We talked about All Commodities being a match for Total Retail. There are also 2 existing indexes that match 2 of the big groups. Motor Vehicles & Parts is a perfect match for Auto and Gas Stations are all about Motor Fuel Sales. The other 2 aggregates were created by me with the detailed help, guidance and approval of a great person at the US BLS. For Restaurants, I aggregated Food & Alcohol away from home. For Relevant Retail I removed the categories linked to Restaurants, Auto and Gas Stations from the All Commodities Group.
The numbers are concerning. Inflation in the Services segment is high, but nothing compared to Auto & Gas. Relevant Retail is much better than All Commodities but about equal to the national numbers which are so scary. Now, let’s apply inflation to the sales numbers. This will give us a measurement of the amount of product sold, not just $.
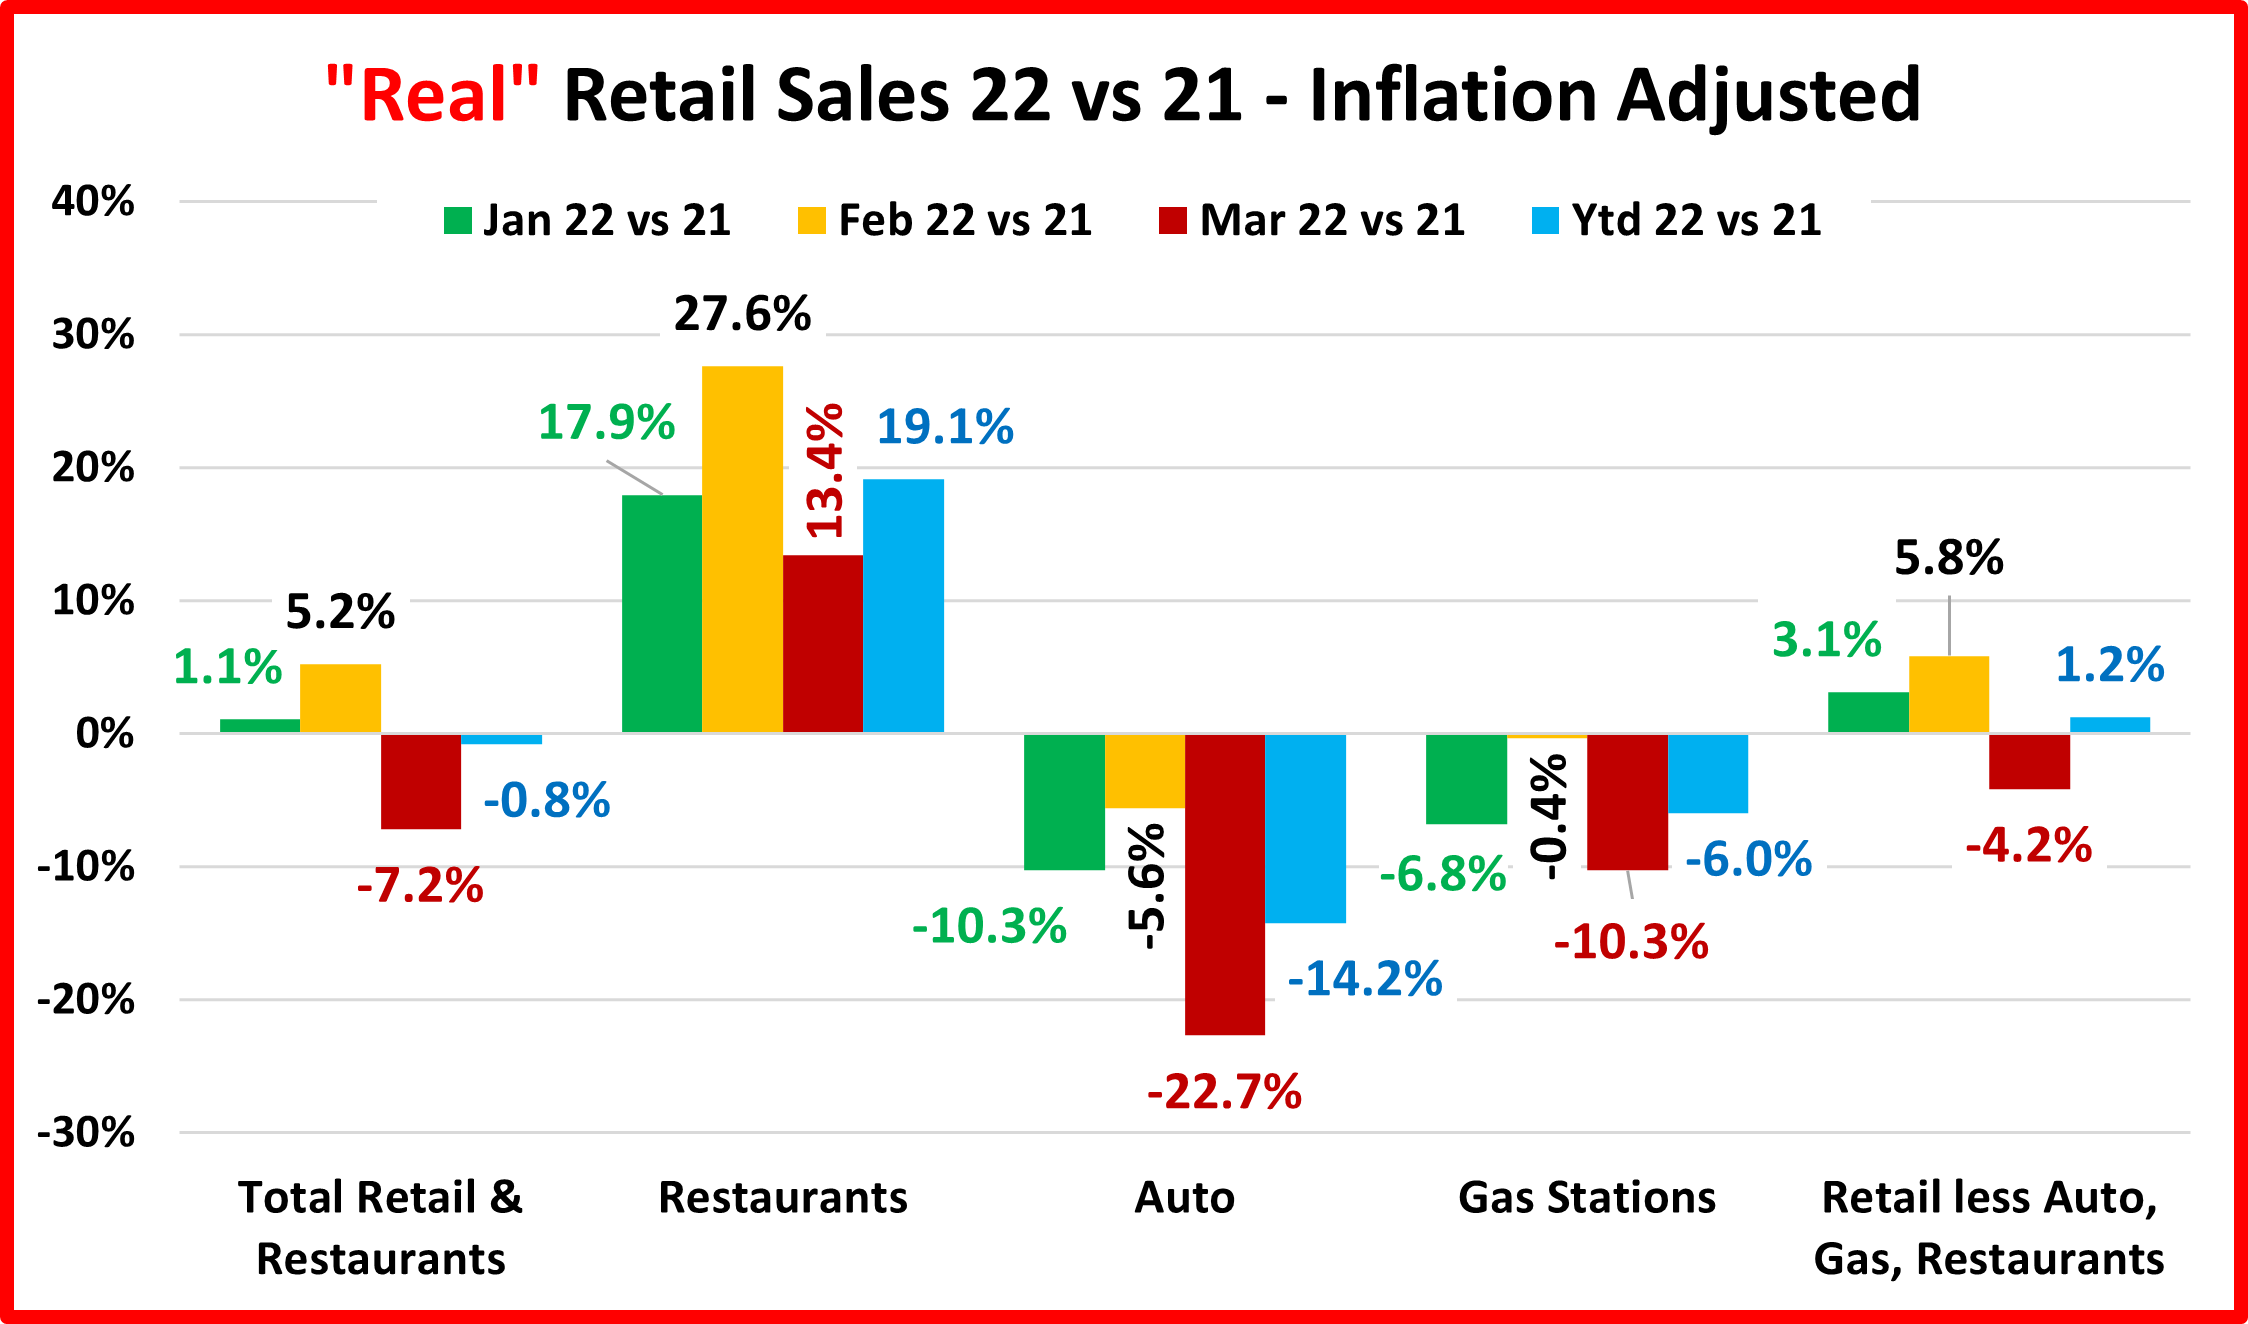
I can’t recall ever seeing such a radical difference. It’s hard to believe that we are talking about the same products being sold in the same outlets over the same period of time. March 2022 was the worst monthly Commodity inflation in history…or at least in the last 66 years. The impact is very clear across the board but anything to do with cars has been down in the amount sold every month this year. Restaurants is the only group doing well but they’re still recovering. For Relevant Retail, the March price explosion turned real sales negative for March and dropped the YTD sales increase down to +1.2%. March Real sales for Total U.S. Retail were also down but YTD actually turned negative too. I don’t know what to say but whatever that can be done, needs to be done … right now!
There is one faint glimmer of hope. In my research, I found that the months with the 3 worst average YOY Commodity inflation rates are March, February & January, in that order. An immediate turn around won’t happen but hopefully, the worst is over.
Now, as promised here is a condensed list of CPI Expenditure Categories. The highlighting shows how I matched the commodity categories with the big groups. If you look very closely, you will see fuel oil as a category is included in both Total & Relevant Retail. That might raise some questions. However, if you look at the NAICS codes for Retail Businesses, you’ll see that the company that delivers propane to your farm is classified as a Non-Store Retailer, just like internet businesses.
Take a look. Let me know if you see any expenditure categories that if aggregated, would be a better CPI match for an important retail channel.


