2020 U.S. Pet Spending by Generation – Boomers’ Spending Surges
In 2020 Americans spent $83.74B on our companion animals, 1.04% of $8.05 Trillion in total expenditures. Pet Spending was up $5.31B (+6.8%), a big change from the spending dip in 2019. There was 1 overriding factor affecting all spending, including pet in 2020 – the pandemic. Consumers focused on the necessary segments – Food and Veterinary, while the discretionary segments – Supplies and Services, suffered. Out of fear of shortages, Pet Parents binge bought Food early in the pandemic. On the negative side, closures caused Services to have a radical reduction in frequency.
In this report we will look at how the pandemic affected the Pet Spending for today’s most “in demand” demographic measurement – by Generation. In 2020, although Gen Z $ are often bundled with Millennials for comparison, we can now compare their annual spending vs the previous year. Using data from the US BLS Consumer Expenditure Survey we’ll look for answers.
We’ll start by defining the generations and looking at their share of U.S. Consumer Units (CUs are basically Households)
GENERATIONS DEFINED
Gen Z: Born after 1996
In 2020, Age under 24
Millennials: Born 1981 to 1996
In 2020, Age 24 to 39
Gen X: Born 1965 to 1980
In 2020, Age 40 to 55
Baby Boomers: Born 1946 to 1964
In 2020 Age 56 to 74
Silent/Greatest: Born before 1946
In 2020, Age 75+
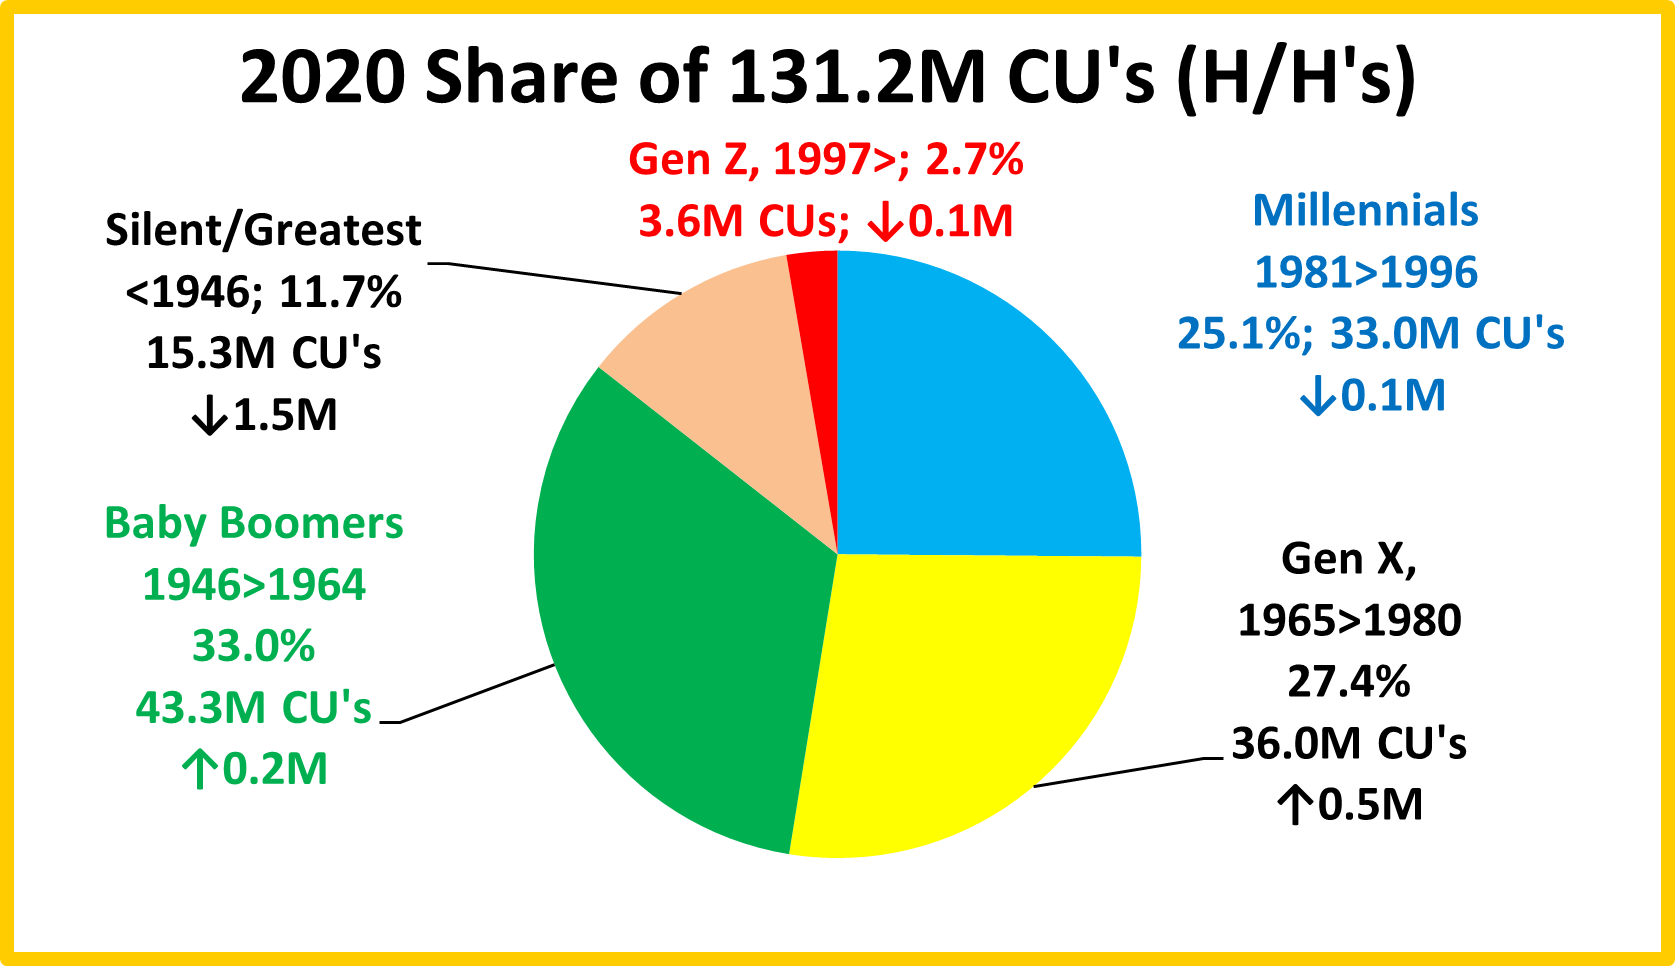
- Baby Boomers still have the largest number of CU’s at 43.3M and 33.0% of the total. They had a slight increase in 2020 but generally they have been losing ground. In fact, they have 1.8M fewer CU’s than in 2016.
- The Oldest Generations will continue to lose CUs primarily due to death or movement to permanent care facilities.
- Gen X has the second most CUs and gained ground in 2020.
- Millennials have the largest number of individuals, but they rank only third in the number of CU’s.
- Gen Z lost CUs as did Millennials. The pandemic caused many younger folks to move back home or group together.
Now let’s look at some key CU Characteristics
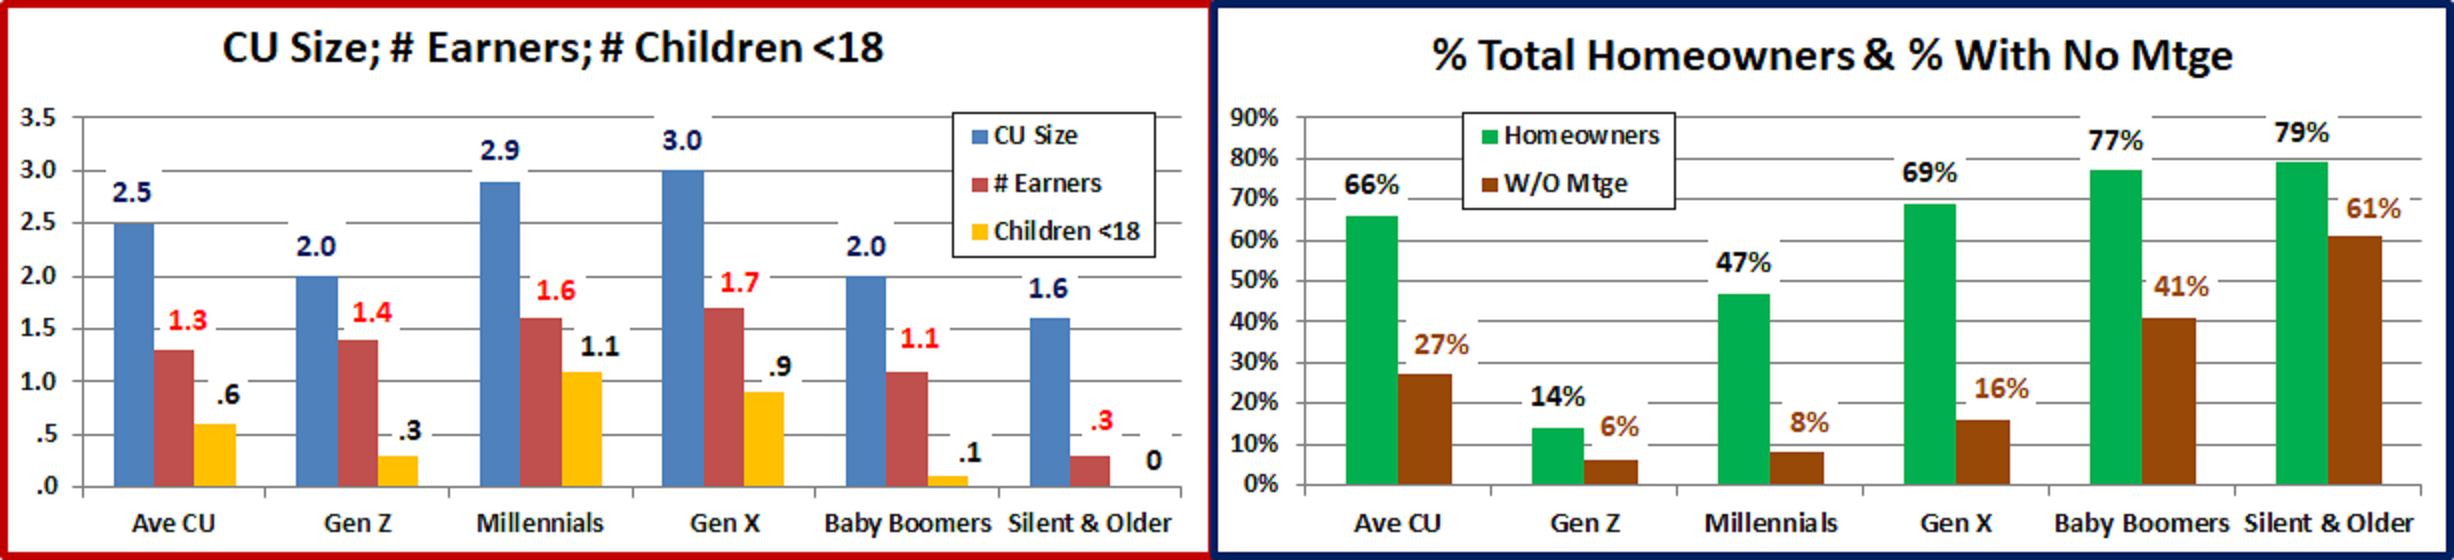
One significant change was the increase in homeownership. This was primarily driven by the Gen Xers and Millennials. Gen Xers still have the biggest CUs but now Millennials have the most children <18 per CU.
- CU Size – CUs with 2+ people account for 70.2% of all U.S. CUs (up from 69.8% in 2019) and 80.3% of pet $ (up from 78.2% primarily due to a huge spending lift by 4+ person CUs). Millennials are actively building their H/Hs. However, CU size, with all the related responsibilities, still peaks with the Gen Xers and then starts dropping. The Boomers are the last group with 2+ CUs but that will end soon. Gen Z joined the 2+ group for the 1st time in 2020.
- # Children < 18 – 27.7% of U.S. CU’s have children and they generate 38.4% of Pet Spending. CUs with children were the driving force in the increase in Pet spending. Married Couples with children spent $8.77B more and even single parents increased pet spending by $0.77B. All other groups spent less. The biggest decrease came from Married Couples with no children – down -$2.22B. “Unmarried Adults only” CUs, of 2 or more people were next to last with a decrease of -$1.43B. Singles had the biggest increase in 2019. In 2020, they spent -$0.55B less on their pets. Overall, there was no change in the # of children per CU in 2019 but there were changes within groups. Millennials took over the top spot while the number of children per CU for both Gen X and Boomers decreased. We should note that CU’s with the oldest child over 18 had the biggest Pet $ increase, +$8.77B. This group is often Baby Boomers.
- # Earners – Pet spending is usually tied to the number of earners in a CU. In 2020, 2 person, 2+ earner CUs still spent the most on their pets and had the biggest increase, +$5B (+11.8%). Generally, these are the younger generations, but the 55 to 64 year old Baby Boomers are also an important part of this group.
- Homeownership – Owning and controlling your own space has always been a major factor in increased Pet Ownership and spending. Driven by the younger groups, homeownership increased to 65.81% from 63.74%. However, the pet spending pattern was even more defined. Homeowners with no Mtges spent +$8.0B more on their pets. Homeowners with mortgages spent -$2.1B less on their pets while the Pet $ for Renters fell -$0.6B. We should note that the number of Baby Boomer Homeowners w/no Mtge grew from 38% to 41%. The homeowners share of Total Pet Spending grew from 81.4% to 83.3% due to those without a mortgage and was likely driven by Boomers.
- As expected, Gen Z are the most common renters in society. Homeownership by Millennials has moved up to 47% but it is still only 71% of the national average.
- Gen Xers have been above the national avg since 2018 and Homeownership continues to increase with age.
Next, we’ll compare the Generations to the National Avg.:
In Income, Total CU Spending, Total Pet Spending and the Pet Share of Total CU Spending
CU National Avg: Income – $84,352; Total CU Spending – $61,282; Total Pet Spending – $637.78; Pet Share – 1.04%
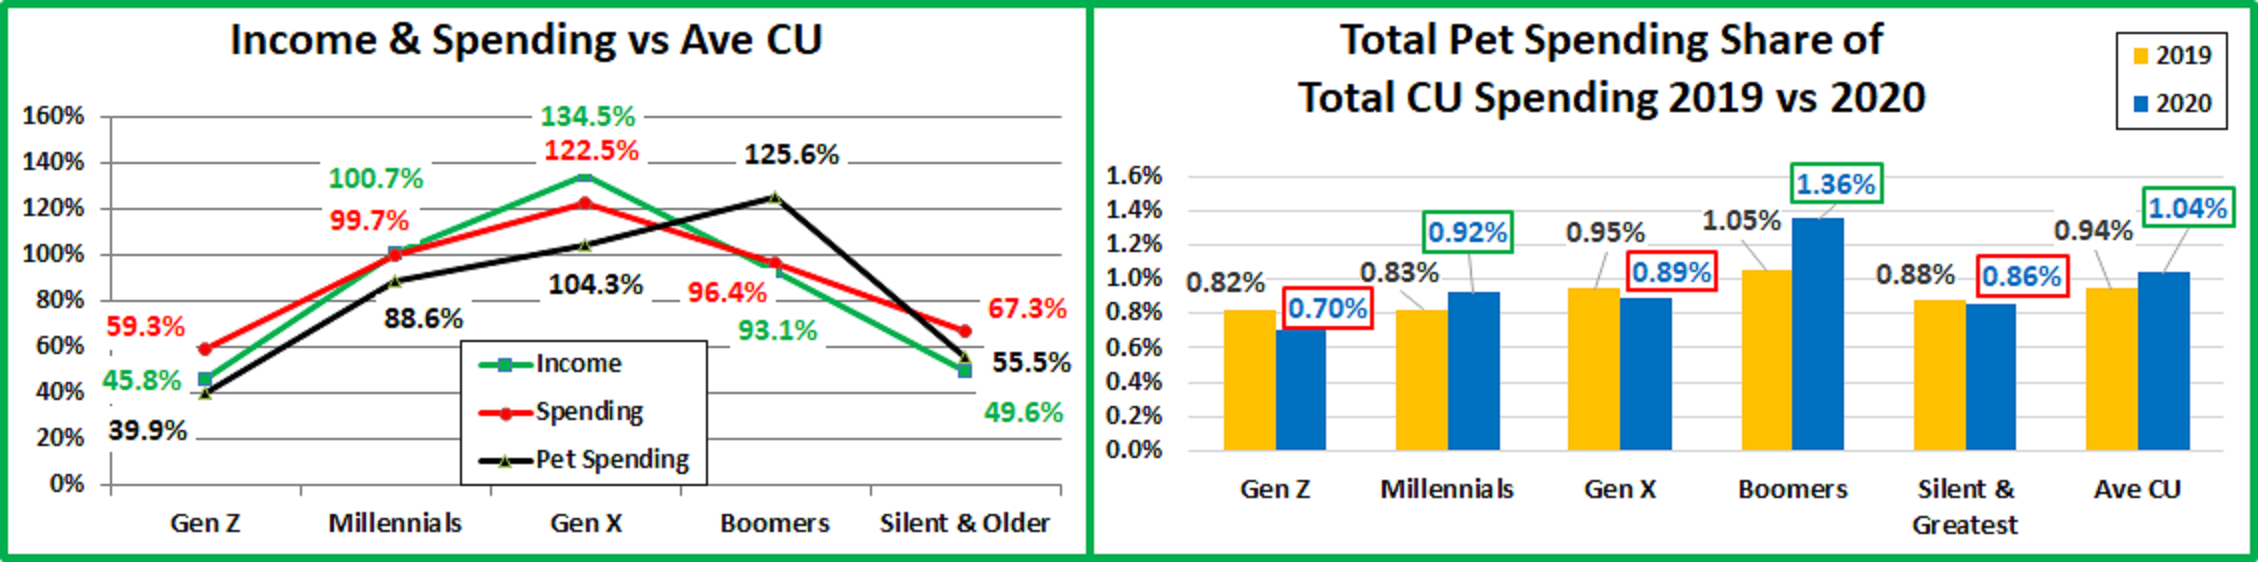
- Income – The Gen Xers are still at the top and their lead grew. The Boomers income plunged from 112% to 93% and they fell to 3rd place. Millennials’ income moved up to beat the national average and they are now #2. Income drops radically in the oldest group as they retire, and Gen Z is just getting started.
- Total Spending – The Gen Xers make the most and spend the most but it’s not out of line with their income. Millennials increased their spending so that it now equal to the national average. Like their income, Boomers’ spending fell below the national average. Thanks to a big lift in income in relation to spending, the oldest group and Gen Z are no longer deficit spending in relation to their after tax income. With strong increases in both Income and spending, the retail importance of Millennials is growing.
- Pet Spending – Again only 2 groups exceed the national average, but Boomers replaced Gen X in the top spot. Millennials are still 3rd but are 15% below Gen X and 30% below Boomers. The oldest and youngest groups trail.
- Pet Spending Share of Total Spending – The national number grew from 0.94% to 1.04%. The growth was driven by a 0.09% increase from Millennials and a huge 0.31% lift from Boomers. All other groups fell and Boomers are still the only group to spend more than 1% of their total expenditures on their pets. In 2018 every group spent at least 0.92% of their total CU spending on their pets. In 2019 this fell to 0.82% and in 2020 it was down to 0.70%.
Now, let’s look at Total Pet Spending by Generation in terms of market share as well as the actual annual $ spent for 2015 through 2020. The 2020 numbers are boxed in red (decrease) or green (increase) to note the change from 2019.

- Boomers are still the biggest force in Pet Spending and their share is again over 40% after falling to 36.6% in 2019.
- There are definite age-related long term patterns which are readily apparent in the bar graph. Spending in the oldest group is low and slowly falling. In contrast, the youngest group (combined Millennials & Gen Z) is the only one showing consistent year after year growth. Gen X had also been growing every year… until 2020. The Boomers have the biggest share but are on a rollercoaster ride because they are the most likely group to have a strong reaction to trends, especially in this era of super premium foods. With their tremendous buying power, this can cause major spending swings impacting the whole industry. In 2020 this was very apparent as they were the primary group that panic bought Pet Food out of fear of possible shortages due to the pandemic.
- In 2020, every other generation was up or down. Silent/Greatest: -$1.12B. Boomers: +$6.88B. Gen X: -$1.79B. Millennials: +$2.24B. Gen Z: -$0.14B.
- Boomers – Ave CU spent $800.78 (+$131.53); 2020 Total Pet spending = $34.85B, Up $6.11B (+21.3%)
- 2015>2020: Up $2.70B; They got back on the roller coaster as spending turned up and is now +8.4% from 2015.
- Gen X – Ave CU spent $665.22 (-$61.83); 2020 Total Pet Spending = $23.96B, Down $1.79B (-7.0%)
- 2015>2020: Up $5.70B; Their annual Pet spending growth since 2015 had been strong and consistent until 2020. They fell to #2 in Ave CU Pet spending and their $ increase since 2015 fell from $7.49B in 2019 to $5.70 in 2020.
- Millennials + Gen Z – Ave CU spent $533.80 (+$62.38); 2020 Total Pet Spending = $19.60B, Up $2.10B (+12.0%)
- 2015>2020: Up $9.87B; As the income and overall spending of Millennials grows, their pet spending has also grown every year since 2015. The “youngsters” have the biggest increase in $ of any group, $9.87B, +101%.
- Millennials Only – Ave CU spent $565.07 (+$71.46); 2020 Total Pet Spending= $18.67B, Up $2.24B (+13.7%)
- Gen Z Only – Ave CU spent $254.68 (-$25.41); 2020 Total Pet Spending= $0.93B, Down $0.14 (-13.4%)
- Silent + Greatest – Ave CU spent $354.20 (-$34.65); 2020 Total Pet Spending = $5.34B, Down $1.12B (-17.3%)
- 2015>2020: Down $2.27B; They still spend a relatively high amount on their pets, but age is becoming a factor.
Boomers returned to the top spot in Ave CU Total Pet Spending. Driven by Millennials, the youngest pet parents are still consistently increasing their annual spending which bodes well for the future.
Let’s look at the individual segments. First, Pet Food…
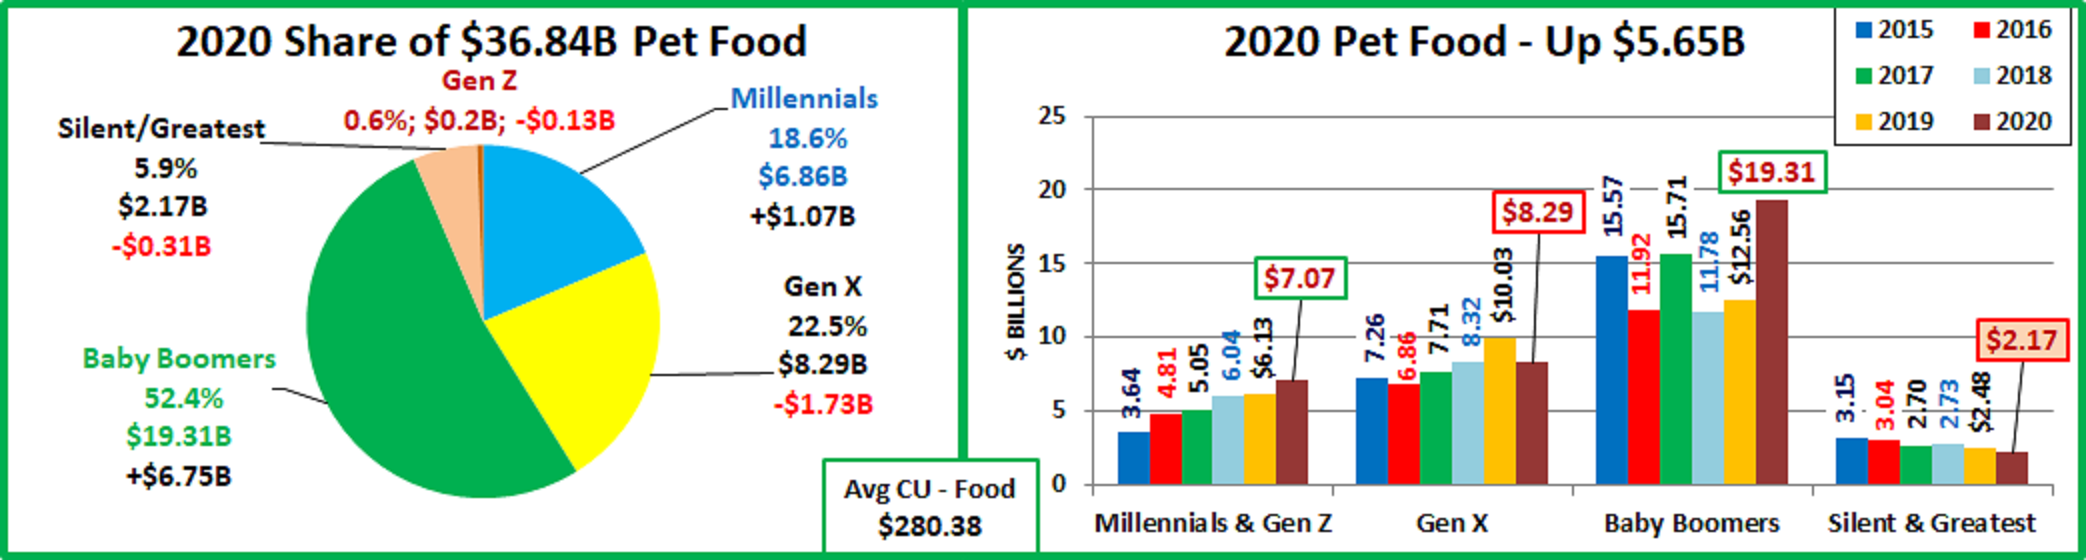
- The trendy nature of Pet Food is more pronounced for the Boomers. In the older generations, pet ownership is fading. The younger groups have generally had more consistent growth but Gen X spending fell sharply in 2020.
- Since 2014, Millennials’ have led the way in food trends, and they are the only group with an annual increase every year since 2015. The panic food buying in 2020 was more of an emotional reaction than a trend.
- Boomers – Ave CU spent $442.06 (+$147.55); 2020 Pet Food spending = $19.31, Up $6.75B (+53.7%)
- 2015>2020: Up $3.74B– Big reactions to every trend, from super premium to FDA warnings to fear of shortages.
- Gen X –Ave CU spent$230.36 (-$53.82); 2020 Pet Food spending =$8.29B,Down $1.73B (-17.3%)
- 2015>2020: Up $1.03B They reacted to the FDA warning by further upgrading their food. No pandemic panic buying for them. They value shopped.
- Millennials + Gen Z – Ave CU spent $191.02 (+$29.17); 2020 Pet Food Spending = $7.07B, Up $0.94B (+15.4%)
- 2015>2020: Up $3.43B They are the only group with increased spending every year since 2015. Their income is growing as is a commitment to their pets. They pioneer food upgrades and they too bought more just to be safe.
- Millennials Only – Ave CU spent $206.94 (+$35.39); 2020 Pet Food spending = $6.86B, Up $1.07B (+18.6%)
- Gen Z Only – Ave CU spent $52.97 (-$29.04); 2019 Pet Food spending = $0.20B, Down $0.13B (-39.7%)
- Silent/Greatest – Ave CU spent $147.57 (-$5.12); 2020 Pet Food spending = $2.17B, Down $0.31B (-12.5%)
- 2015>2020: Down $0.98B; They are committed to their pets, but COVID hit them hard and their CU #s are fading.
Pet Food Spending is driven by trends – new Super Premium Foods, FDA warnings and even fear of shortages due to COVID. Millennials lead the way in thoughtful changes, but Boomers lead in emotion. Now, on to Supplies Spending.
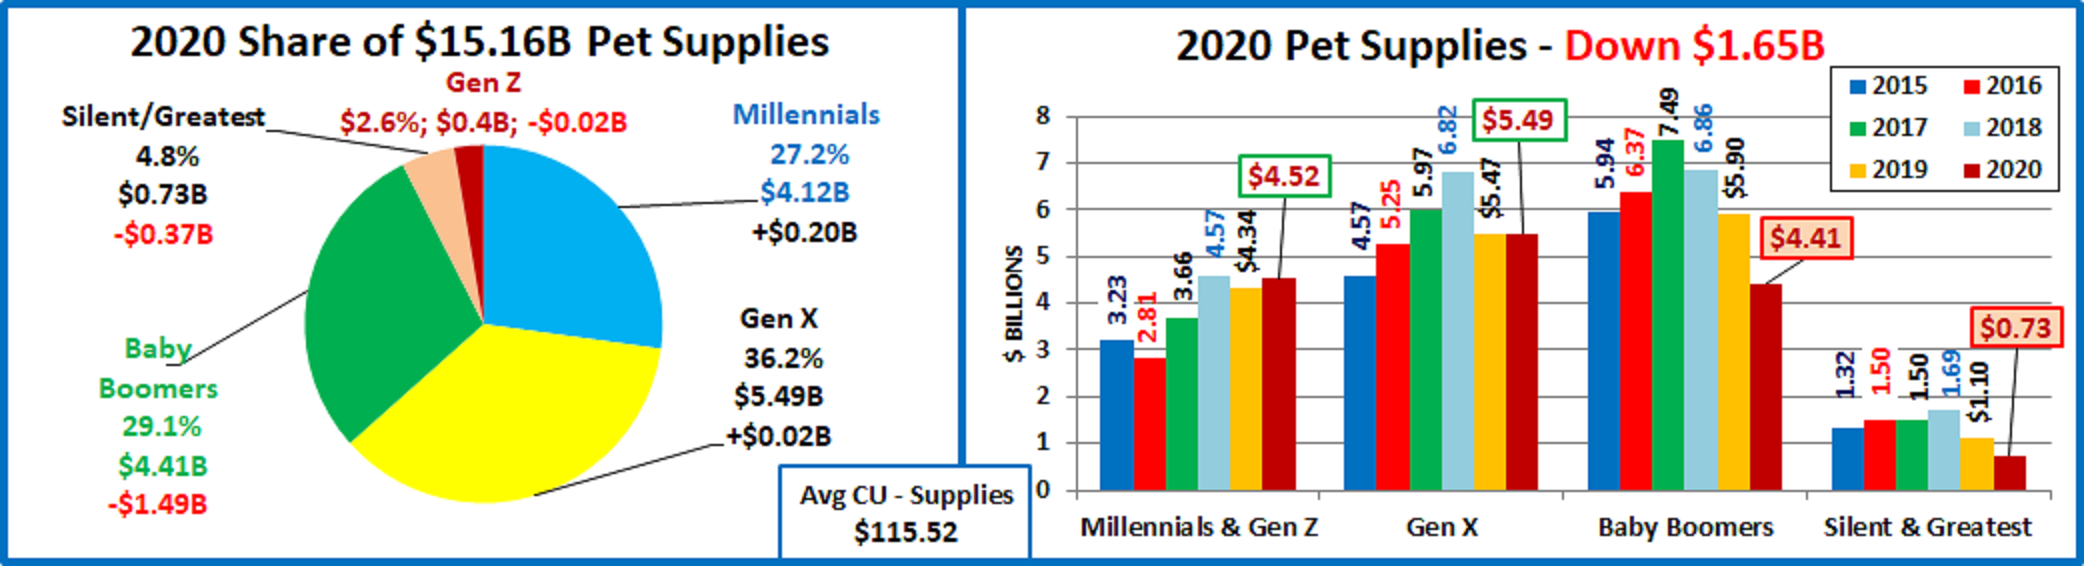
- Gen X took over the top spot in both CU spending and share as Boomer spending plummeted again. The younger groups dominate this segment as Gen Xers and Millennials/Gen Z together account for 66% of Supplies spending.
- Gen X – Ave CU spent $152.47 (-$1.70); 2020 Pet Supplies spending = $5.49B, Up $0.02B (+0.4%)
- 2015>2020: Up $0.92B; Gen Xers are again the leader in CU spending. They were affected by the new tariffs in 2019 but essentially held their ground in 2020 so that they now have the biggest share of Supplies $.
- Baby Boomers – Ave CU spent $101.85 (-$34.96); 2020 Pet Supplies spending = $4.41B, Down $1.49B (-25.3%)
- 2015>2020: Down $1.53B; Their 2019 spending was hit hard by tariffs. In 2020 they spent their Pet $ on Food!
- Millennials + Gen Z – Ave CU spent $123.76 (+$5.59); 2020 Pet Supplies spending = $4.52B, Up $0.18B (+4.2%)
- 2015>2020: Up $1.29B; Supplies are still Millennials’ best performing segment. They were the least impacted by the tariffs in 2019 and were the only group with any real growth in 2020.
- Millennials Only – Ave CU spent $125.05 (+$6.41); 2020 Pet Supplies spending = $4.12B, Up $0.20B (+5.2%)
- Gen Z Only – Ave CU spent $111.92 (-$2.09); 2020 Pet Supplies spending = $0.40B, Down $0.02B (-4.8%)
- Silent + Greatest – Ave CU spent $47.75 (-$17.38); 2020 Pet Supplies spending = $0.73B, Down $0.37B (-33.3%)
- 2015>2020: Down $0.59B; This $ conscious group was hit hard first by tariffs then by the pandemic.
In 2016 most Consumers value shopped for super premium food and spent some of their savings on Supplies. Supply prices dropped in 2017 and everyone under 72 spent more! Late 2018 saw added tariffs but only Boomers dialed back their purchases. In 2019 the sharply rising prices drove spending down in all groups. In 2020 Millennials and Gen X spent a little more while the older groups spent a lot less.
Next, we’ll turn our attention to the Service Segments. First, Non-Veterinary Pet Services
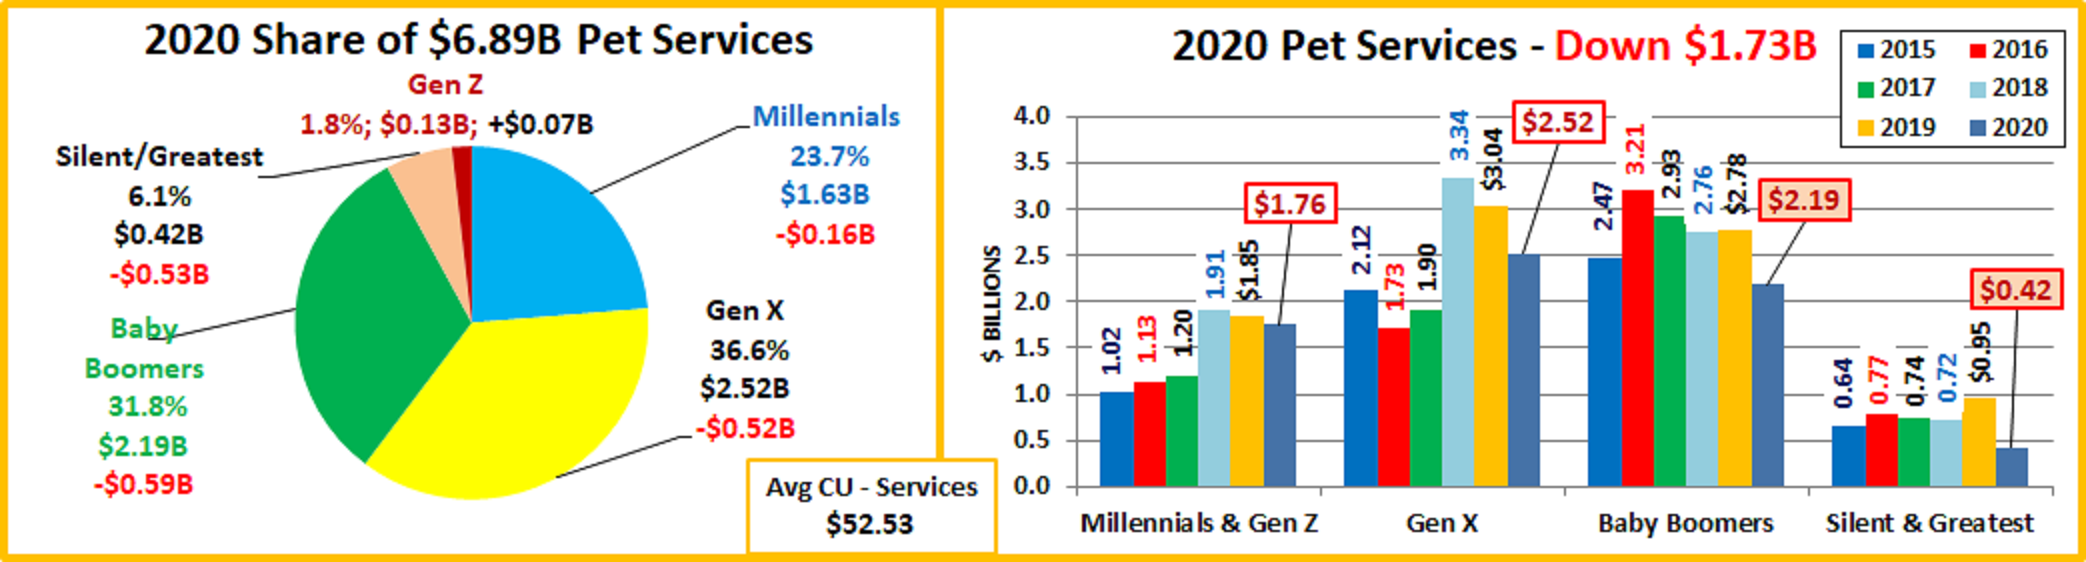
- Only Gen Z spent more. Gen X is still #1 in both CU spending and share. Gen X/Millennial/Gen Z share = 62.1%
- Gen X – Ave CU spent $69.98 (-$15.62); 2020 Pet Services spending = $2.52B, Down $0.52B (-17.0%)
- 2015>2020: Up $0.40B; As the #1 group, they were strongly impacted by the COVID related drop in frequency.
- Baby Boomers – Ave CU spent $50.60 (-$13.90); 2020 Pet Services spending = $2.19B, Down $0.59B (-21.3%)
- 2015>2020: Down $0.28B; Boomers had the biggest drop in $ as they focused on the needed segments.
- Millennials + Gen Z – Ave CU spent $48.09 (-$2.34); 2020 Pet Services spending = $1.76B, Down $0.09B (-5.1%)
- 2015>2020: Up $0.74B; They had the smallest decrease of any group and the biggest $ increase since 2015. In 2020 Gen Z actually got into the Services game for the first time.
- Millennials Only – Ave CU spent $49.52 (-$4.82); 2020 Pet Services spending = $1.63B, Down $0.16 (-9.1%)
- Gen Z – Ave CU spent $34.92 (+$19.45); 2020 Pet Services spending = $0.13B, Up $0.07B (+118.8%)
- Silent + Greatest – Ave CU spent $27.58 (-$28.80); 2020 Pet Services spending = $0.42B, Down $0.53B (-55.5%)
- 2015>2020: Down $0.22B; They definitely have the need but were the group most impacted by the pandemic.
This segment had slow annual growth until 2017 which saw a small drop in spending due to an extremely competitive environment. Consumers increased frequency but paid less. In 2018, the increased number of outlets really hit home, especially for the younger groups and spending exploded. 2019 brought another small decrease as Gen Xers and Millennials looked for and found a better deal. 2020 brought pandemic restrictions and closures. Frequency and $ fell.
Now, Veterinary Services

- Boomers are still the biggest spenders in this segment, but again they only lead Gen Xers in $ because of more CUs.
- The younger groups have a consistently growing commitment to this Pet Parenting responsibility. The combined Veterinary spending of Millennials/Gen Z and Gen Xers has increased $7.74B (+126%) since 2015.
- Boomers – Ave CU spent $206.27 (+$32.84); 2020 Veterinary spending= $8.93B, Up $1.45B (+19.4%)
- 2015>2020: Up $0.76B; In 2020, Boomers focused on needed segments – Food & Veterinary. They had the biggest increase in CU spending and in Veterinary $, +$1.45B
- Gen X – Ave CU spent $212.41 (+$9.31); 2020 Veterinary spending= $7.65B, Up $0.44B (+6.1%)
- 2015>2020: Up $3.34B; In 2016 their Veterinary spending exceeded the national CU Average. In 2018, they took over the top spot in CU spending. They are still #1 per CU and #2 in share as the Boomers had a bigger lift.
- Millennials + Gen Z– Ave CU spent $170.94 (+$29.96); 2020 Veterinary Spending $6.25B, Up $1.07B (+20.7%)
- 2015>2020: Up $4.40B; Their CU spending is up 165% since 2015. Veterinary has become a much bigger priority.
- Millennials Only – Ave CU spent $183.56 (+$34.48); 2020 Veterinary spending = $6.05B, Up $1.13B (+22.9%)
- Gen Z Only – Ave CU spent $54.87 (-$13.73); 2020 Veterinary spending = $0.20B, Down $0.06B (-22.5%)
- Silent + Greatest – Ave CU spent $131.30 (+$16.65); 2020 Veterinary spending $2.02B, Up $0.08B (+4.2%)
- 2015>2020: Down $0.76B; Their pets’ health is still a priority. Their CU increase only trails Millennials & Boomers.
Gen Xers and Millennials have consistently increased their commitment to Veterinary Services. In 2015, their share of Veterinary Spending was 36%. It is now 56% – a 56% increase. This is a big, fundamental change in spending behavior.
One last chart to compare the share of spending to the share of total CU’s to see who is “earning their share”

- Baby Boomers Performance – Total: 126.1%; Food: 158.8%; Supplies: 88.2 %; Services: 96.3%; Veterinary: 108.9%
- Boomers led the way in building the industry and are still the “top dogs” in $. They earn their share and are still the spending leader in Total Pet and the “needed” segments – Food & Veterinary. They are also the most emotional Pet Parents, so their spending is subject to radical swings like 2020’s panic, binge buying of Pet Food. They should hold the lead in Pet $ for several more years and be a major force for many more, but the Gen Xers and then Millennials are preparing to take their turn at the top.
- Gen X Performance – Total: 104.2%; Food: 82.0%; Supplies: 132.0%; Services: 133.2%; Veterinary: 112.2%
- After 2 years at the top Gen Xers fell to 2nd in performance. They earned their share in Total Pet and all industry segments but Food. Until 2020 they had increased their Total Pet Spending every year since 2015. Except for this year’s big dip in Food, their spending has become more balanced and their performance has improved. Gen Xers range in age from 40 to 55 so they are just entering the peak earning years. Expect their commitment and pet spending to continue to grow.
- Millennials Performance – Total: 88.8%; Food: 74.2%; Supplies: 108.2%; Services: 94.3%; Veterinary: 96.9%
- Millennials are now the only group to have increased their pet spending every year since 2015. Their spending is more evenly balanced, and performance has improved but their future as the Pet Parenting spending leaders is still a long way off. Their income, home ownership and pet spending are all increasing. They are educated and well connected. Indications are that they may lead the way in adopting new trends, especially in food. Their progress is good news, but in reality, their leadership is still more than a decade away.
- Silent/Greatest Performance – Total: 54.6%; Food: 50.4%; Supplies: 41.3%; Services: 52.5%; Veterinary: 69.3%
- Pet Parenting is more challenging in old age, but they remain committed. 0.86% of their total spending is on pets.
- Gen Z Performance – Total: 40.5%; Food: 20.1%; Supplies: 96.9%; Services: 66.5%; Veterinary: 29.0%
- They are just beginning so the numbers are low and progress is slow. However, they have “figured out” Supplies.
Baby Boomers are still the Pet $ leaders, but Gen Xers, followed by Millennials are ultimately the future of the industry. Both groups seem ready, willing and able to take their turn at the top. As these groups have risen, Pet Spending has become more balanced across the generations. This bodes well for the continued strong growth of the industry.

