2019 Pet Spending – A First Look!
The US BLS just released the data from their annual Consumer Expenditure Survey. I have almost completed building the detailed pet database from 35 separate files and have started the analysis, but I wanted to give you a brief first look.
In 2019 Total Pet Spending was $78.44B, down -$0.16B (-0.2%) from 2018. This is a very minor decrease following a huge $11.31B increase from 2016 to 2018.
Total Pet Spending is the sum of the individual segments. As we have seen so many times before they can have extremely different patterns. 2019 is no exception.
In this brief first look we will show you a graph of the recent spending history for Total Pet and then each individual segment. That should help put the 2019 numbers into perspective. After each graph, I will include a very brief comment. The detailed analysis will follow in future posts. I just thought that you should see the topline data as soon as possible. First, Total Pet…
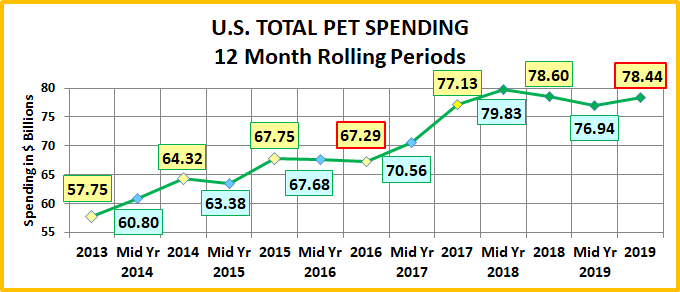
The $ growth has been strong since 2013 but we seem to have a new pattern emerging – 2 years up, followed by a small decrease. In 2016 the drop was -$0.46B and in 2019 it was -$0.16B. The $ peaked mid-year 2018 at $79.83B. We seemed to be on the verge of breaking the $80B barrier then came the FDA grain free dog food warning and tariffs on Supplies. However, it appears that a recovery is beginning in the second half of 2019. Now, let’s turn to the largest segment, Pet Food & Treats…
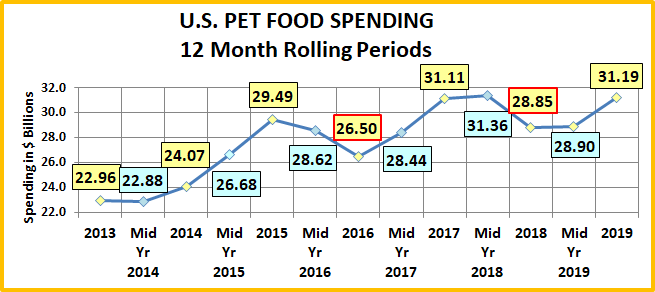
Pet Food spending has been on a roller coaster for a number of years, driven by successive product trends. Since 2003 Pet Food has consistently had 2 successive years of spending increases followed by a down or flat year. At mid-year 2018 it looked like 2018 was on track for a small but expected increase. However, the 2nd half changed all that. In July, the FDA issued a warning on grain free dog food. Spending fell $2.51B, driving sales down $2.26B for the year and breaking the pattern of the last 15 years. As the consumer fear died down, spending stabilized in the first half of 2019 then strongly recovered to “pre-warning” levels by the end of 2019. Now, we’ll look at Pets & Supplies…
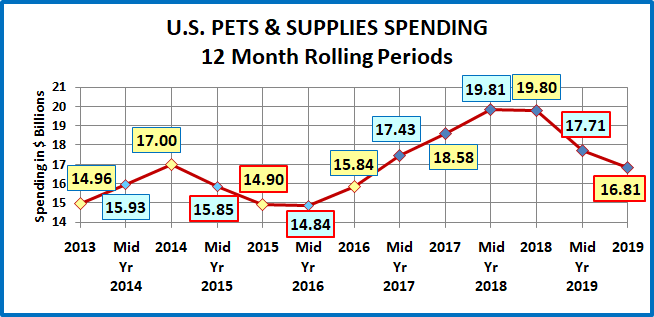
Since the Great Recession, Pet Supplies prices have generally been deflating as many categories have become commoditized. The segment is very price sensitive. Price deflation drives spending up while even a low inflation rate depresses sales. In the second half of 2018, in anticipation of new tariffs Pet Supplies prices began to rise. The tariffs were implemented in September and by yearend Supplies prices had risen 3.5%. Sales flattened in the second half of 2018 then plummeted -$2.98B in 2019 as prices continued to rise – up 5.7% from 2018 by yearend. By the end of 2019 Supplies had “given back” 60% of the $5B gained from mid-2016 to mid-2018. Now Non-Vet Services…
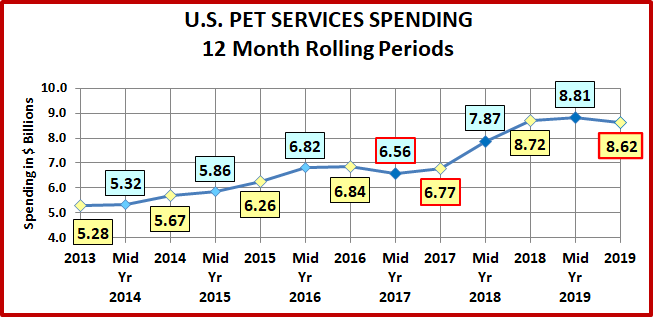
Pet Services is the smallest industry segment and has long been known for slow, but consistent growth. In the graph, you can see that this pattern was broken in 2017. The number of outlets offering Services began to increase sharply during this time and pricing became more competitive. At first this didn’t increase consumer usage of Services and Pet Parents were shopping for value. Apparently, this changed in 2018 and more consumers “got the message”. Spending increased by $1.95B. This is more than twice as big as the previous largest increase in the 34 years that the US BLS has been keeping records on this segment. In 2019 spending fell slightly -$0.10B but essentially held its ground at the new elevated level. Now, on to our final segment, Veterinary Services…
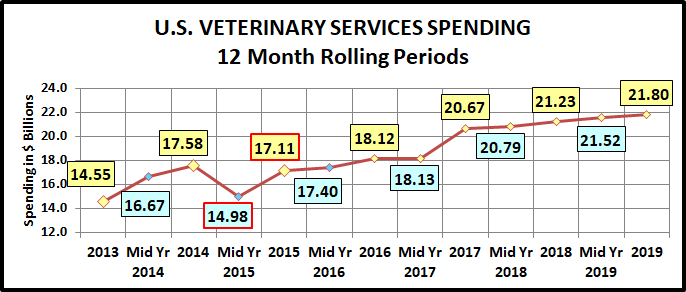
Except for 2015, Veterinary Services has grown consistently through the years. The problem has been a high inflation rate, which has slowed the frequency of consumer visits while increasing prices. The inflation rate slowed in recent years which spurred $3B in spending increases in 2016-2017. In 2018, Vet spending rose $0.56B (+2.7%). Prices were up 2.6% so the amount of Veterinary Services in 2018 was unchanged from 2017. In 2019 sales increased +$0.58B (+2.7%). Unfortunately, prices jumped 4.1% so that there was a net decrease in the amount of Veterinary Services in 2019.
Comments
From a historical perspective, the decrease in Total Pet Spending was the 11th in the 35 years since 1984. However, the industry has done pretty well despite an occasional drop. In 1984 Total Pet Spending was $9.56B. That means that it has grown 720% in 35 years – an annual growth rate of 6.2% – not too bad.
We should also note another situation that I addressed in a recent report – Racial/Ethnic disparities in the Pet Industry. The report cited 2018 data which showed that White, not Hispanics accounted for 86.3% of all Pet Spending. In 2019 the situation worsened as they now account for 87.6%. Here are the specifics:
-
- White, not Hispanic: $68.73B; Up $0.87B (+1.3%)
- Hispanic: $5.44B; Down $0.38B (-6.5%)
- Black/African American: $2.73B; Down $0.68B (-19.9%)
- Asian: $1.54B; Up $0.02B; (+1.6%)
One reason that the Industry had a negative year was that the increase by White, not Hispanics was not big enough to overcome the spending drop by Hispanics and Blacks. The decrease was especially large for Black Americans.
Yet more evidence that this problem should be addressed, for the benefit of everyone.
That wraps it up for this brief preview of Pet Spending in 2019. In future reports we will drill deeper and deeper into the data for each segment and ultimately Total Pet. Our goal will be to determine the who, what and why behind the numbers. We will look at spending from the perspective of 96 segments in 12 demographic categories and even include the frequency of purchase as a factor. Who is spending most of the money? Which groups had the biggest changes in spending – up or down. What are the best performing demographic segments?
Even with an occasional “bump in the road” the Pet Industry is solid, but it is also complex. You have to look beneath the surface numbers to find out what is truly happening. Stay tuned for detailed, analytical updates.

