
2019 Pet Food Spending was $31.19B – Where did it come from…?
As we continue to drill ever deeper into the demographic Pet spending data from the US BLS, we have now reached the level of individual Industry segments. We will start with Pet Food, the largest and arguably most influential of all. We have previously noted the trendy nature of Pet Food Spending. In 2018 we broke a pattern which began in 1997 – 2 years up then spending goes flat or turns downward for a year. We expected a small increase in 2018 but what we got was a $2.27B decrease (-7.3%). This was due to the reaction to the unexpected FDA warning on grain free dog food. A pattern of over 20 years was broken by 1 statement. The grain free warning lost some credibility and spending rebounded in 2019, +$2.35B (+7.1%). Let’s take a closer look.
First, we’ll see which groups were most responsible for the bulk of Pet Food spending and the $2.35B lift. The first chart details the biggest pet food spenders for each of 10 demographic categories. It shows their share of CU’s, share of pet Food spending and their spending performance (Share of spending/share of CU’s). All groups are the same as Total Pet and Pet Products. The categories are presented in the order that reflects their share of Total Pet Spending. This highlights the differences in importance. In Pet Food spending, Education was less important while Marriage matters more. Also, while Income is still the highest performing demographic characteristic, it carries a little less weight in Food spending. Another big difference is that Total Pet had 6 groups performing at or above 120%. Pet Food had only 5. This indicates that Pet Food spending and Pet ownership is spread more evenly across demographic segments. Pet Products also had only 5 groups over 120% which shows the influence of the Pet Food Segment which in 2019 accounted for 65% of Pet Products $ and 40% of Total Pet Spending.
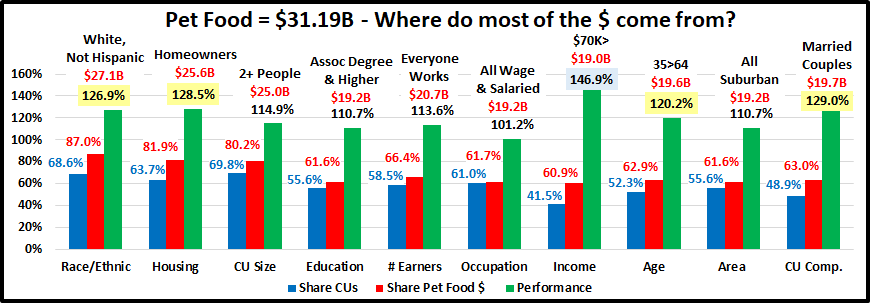
- Race/Ethnic – White, not Hispanic (87.0%) – up from 83.2%. This large group accounts for the vast majority of spending in every segment. They gained in share and their performance increased to 126.9% from 120.5%, but this category still ranks #4 in terms of importance in Pet Food Spending demographic characteristics. While Hispanics, African Americans and Asian American account for 31.4% of U.S. CU’s, they spend only 13% of Pet Food $. This is down from 17% last year. All minorities spent less on Pet Food in 2019, -$0.78B, a stark contrast to the $3.13B increase by White, Not Hispanic CUs.
- Housing – Homeowners (81.9%) – up from 76.8%. Homeownership is a huge factor in pet ownership and more pet spending and it became even more important in 2019. They gained over 5% in share and their performance grew from 121.0% to 128.5%. Homeownership remained 3rd in terms of importance for increased pet Food spending. It was a good year for Homeowners, with or without a mortgage and a bad year for renters.
- # in CU – 2+ people (80.2%) – down from 80.3%.The share of market for 2+ CU’s is now only over 80% for Pet Food. Last year they had 80+% in all but Services. While their share fell slightly performance grew from 113.8% to 114.9%. This happened because the 2019 $ were produced by 360K fewer CUs. (over 1M fewer 2 person CUs). 3 Person households took over as the performance leader and now in the 2+ group, only 2 & 3 person CU’s perform over 100%. 2+ Person CUs are still the 6th most important group in Pet Food $ but Singles are growing in numbers and $.
- Education – Associates Degree or Higher (61.6%) – down from 62.8%. Education lost a little importance in Pet Food Spending. The performance of higher education fell from 115.2% to 110.7%. All groups with at least a High School Diploma spent more. However, HS Grads with no degree of any kind (Assoc/BA/BS) spent $1.84B more.
- # Earners – “Everyone Works” (66.4%) – up from 58.2%. There was a big increase from last year and their performance also grew from 100.7% to 113.6%. Income matters most in Pet Food Spending and the # of Earners also became more important.
- Occupation – All Wage & Salary Earners (61.7%) – up from 60.4% – All wage & salary workers, both Blue & White Collar increased spending. Only Retirees spent less. This drove the performance of All Wage & Salary earners up from 98.9% to 101.2%. This big group is again earning their share in Pet Food Spending.
- Income – Over $70K (60.9%) – up from 55.6%. Their performance rating also grew significantly from 137.8% to 146.9%. CU income remains the single most important factor in increased Pet Food Spending. The dividing line was $40K. All groups <$40K spent less. All over $40K spent more. The gain in share and performance was driven by a $2.97B increase in spending by $70K>. Pet ownership is common across all income levels but in 2019 higher income became even more important in Pet Food Spending.
- Age – 35>64 (62.9%) – up from 59.6%. The performance of the group grew from 112.7% to 120.2% so the “Age” category rejoined the 120+% club at #5. Only the <25 group spent less on Pet Food. However, a $2B increase drove the big lift in share and performance by the 35>64 year olds.
- Area – Suburban (61.6%) up from 60.1%. Their performance grew from 108.4% to 110.7. All Suburban areas spent more but the gains were driven by a $1.61B increase by Suburbs 2500>, along with -$0.17B drop by Center City.
- CU Composition – Married Couples (63.0%) – up from 61.3%. They gained in share and their performance grew from 123.5% to 129.0%, so they stayed in 2nd place. Only Married couples with an oldest child 6>17 spent less.
The big spenders for Pet Food are the same as those for Total Pet and Pet Products and in the past they generally had a lower market share and performance. That was not always true in 2019. Pet Food Spending grew $2.35B and 8 of the 10 big groups gained in both share and performance. Pet Food spending became a little less balanced in many demographic categories.
Now, we’ll look at 2019’s best and worst performing Pet Food spending segments in each category.
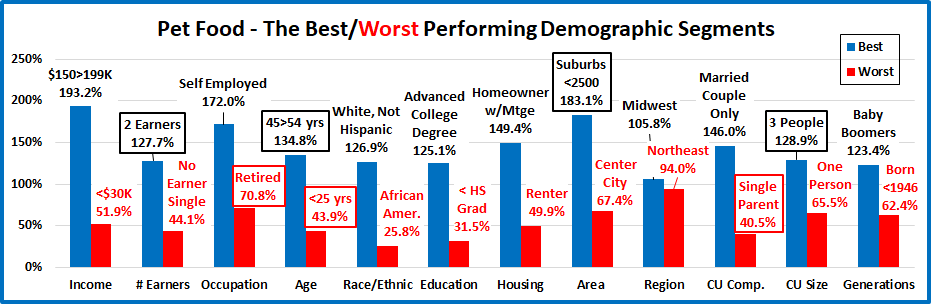
Even as we drill down to the Industry segment level, many of the best and worst performers are the ones that we would expect. In Pet Food spending, there are 7 that are different from 2018, which is 2 more than for Total Pet but the same as Pet Products. 9 of 12 winners are the same as Pet Products and 10 of the losers match. This demonstrates the impact that the Food spending increase had on overall Pet Products. Changes from 2018 are “boxed”. We should note:
- Income is important in every segment but the “need” segments, Food and Veterinary are the only ones in which the winner is not $200K+. Also, all income groups above $40K perform at 92+% in Food, by far the best of any segment.
- # Earners – 2 Earner CU’s took the top spot as the number of Earners became more important.
- CU Size – With a 25% increase in spending, 3 Person CUs edged out the usual winner, 2 Person.
- Occupation – After a good 2018, Retirees returned to the bottom.
- Generation – The Boomers remain the perennial best performers in Pet Food, but Gen X is closing the gap.
- Age – The 45>54 yr olds replaced the 55>64-yr olds on top and the <25 group returned to the bottom.
- CU Composition – Married, Couples Only won for the 5th straight year and Single Parents fell to a very low bottom.
- Area – Rural CUs increased spending and performance, but it wasn’t enough to hold off the <2500 Suburbs.
It’s time to “Show you the money”. Here are segments with the biggest $ changes in Pet Food Spending.
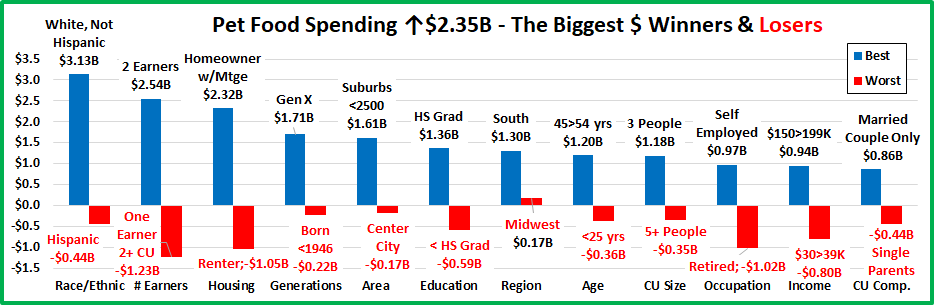
There are 4 repeats from 2018 and only 5 of the 24 segments (21%) flipped from 1st to last or vice versa. That’s considerably calmer than 2018 when there was only 1 repeat and 71% flipped. The only true surprise winner was High School Grads. The South flipped from last to first but even more importantly, all regions spent more on Pet Food. This indicates that the Food rebound was geographically widespread across America. Here are the specifics:
- Race/Ethnic – A dual flip as the rebound in Pet Food spending was only for the White group…
- Winner – White, Not Hispanic – Pet Food Spending: $27.14B; Up $3.13B (+13.0%) 2018: Hispanic
- Loser – Hispanic – Pet Food Spending: $2.30B; Down $0.44B (-16.1%) 2018: White, Not Hispanic
- Comment – The U.S. is slowly becoming more racially/ethnically diverse but White, Not Hispanic is still by far the biggest spender in every Pet Industry Segment. In 2018 Whites had their smallest share in Food, 83.2%. In 2019 all minorities spent less on Food and the White share of spending jumped to 87%, the highest in 7 years.
- # Earners – Income grew in importance as did the # of Earners.
- Winner – 2 Earners – Pet Food Spending: $12.98B; Up $2.54B (+24.4%) 2018: No Earner, Single
- Loser – 1 Earner, 2+ CU – Pet Food Spending: $5.90B; Down $1.23B (-17.2%) 2018: 1 Earner, 2+ CU
- Comment – 1 Earner, 2+ CUs stayed at the bottom. Everyone Works CUs of all sizes spent $3.92B more while all others spent -$1.57B less.
- Housing – Renters flipped from first to last.
- Winner – Homeowners w/Mtge – Food: $17.35B; Up $2.32B (+15.5%) 2018: Renters
- Loser – Renters – Food: $5.64B; Down $1.05B (-15.7%) 2018: Homeowners w/o Mtge
- Comment – Homeowners with and without mortgages spent $3.4B more and Renters spent -$1.05B less. This is a more expected result in this category.
- Generation – Gen X edged out the Boomers for the win.
- Winner – Gen X – Pet Food Spending: $10.03B; Up $1.71B (+20.5%) 2018: Millennials
- Loser – Born <1946 – Pet Food Spending: $2.48B; Down $0.22B (-8.1%) 2018: Boomers
- Comment – Only the oldest group spent less. Gen X dominated in a segment usually ruled by Boomer behavior.
- Area Type – Winner and Loser are new but not surprising.
- Winner – Suburbs <2500 – Pet Food Spending: $5.99B; Up $1.61B (+36.7%) 2018: Suburbs 2500>
- Loser – Center City – Pet Food Spending: $7.63B; Down $0.17B (-2.2%) 2018: Rural
- Comment – Center City spent less. Everyone else spent more. This reflects the results of the Housing category.
- Education – A new and surprising winner, HS Grads and a new loser, <HS Grads which is not much of a surprise.
- Winner – HS Grads – Food Spending: $5.27B; Up $1.36B (+34.9%) 2018: Associates Degree
- Loser – <HS Grad – Food Spending: $0.56B; Down $0.59B (-51.2%) 2018: HS Grad w/some College
- Comment – Every education level except those without a High School Diploma spent more. One possibly is that this group had a delayed reaction to the 2018 FDA warning.
- Region – Last year every region spent less. This year they all spent more – a second consecutive flip.
- Winner – South – Pet Food Spending: $12.03B; Up $1.30B (+12.1%) 2018: West
- Loser – Midwest – Pet Food Spending: $7.02B; Up $0.17B (+2.5%) 2018: South
- Comment – The South flipped from the bottom to the top. The fact that the spending behavior of all regions has been the same for 3 consecutive years shows the universality of recent trends in Pet Food.
- Age – The winner and loser are new but not surprising.
- Winner – 45>54 yrs – Pet Food Spending: $7.09B; Up $1.20B (+20.4%) 2018: 65>74 yrs
- Loser – <25 yrs – Pet Food Spending: $0.76B; Down $0.36B (-32.4%) 2018: 55>64 yrs
- Comment: The highest income 45>54-yr olds moved to the top but all groups but <25 spent more. The decrease by the youngest group was substantial, but not surprising after an +80% increase last year.
- # in CU – 3 People CUs continued their strong growth and won for the second consecutive year.
- Winner – 3 People – Pet Food Spending: $5.85B; Up $1.18B (+25.3%) 2018: 3 People
- Loser – 5+ People – Pet Food Spending: $2.46B; Down $0.35B (-12.4%) 2018: 2 People
- Comment: In 2018 only 3 person CU’s and singles increased Food spending. In 2019 only the largest, 5+ person CUs spent less. We are increasingly moving up from the previously magic “2” number, which probably reflects the growing strength of the younger groups, even in the Food segment.
- Occupation – Self-Employed held their winning position.
- Winner – Self-Employed– Pet Food Spending: $3.38B; Up $0.97B (+40.1%) 2018: Self-Employed
- Loser – Retired – Pet Food Spending: $4.66B; Down $1.02B (-18.0%) 2018: Blue Collar Workers
- Comment – Retirees were the only big group to spend less on Pet Food. Blue Collar Service workers spent a little less too, but the total Blue Collar worker group spent $0.41B more on Food. Overall, the “bosses” – Managers, Professionals and Self-Employed spent +$1.83B more, which was 78% of the total increase.
- Income – The $150>199K group won again.
- Winner – $150 to $199K – Pet Food Spending: $3.77B; Up $0.94B (+33.4%) 2018: $150 to $199K
- Loser – $30 to $39K – Pet Food Spending: $4.04B; Down $0.80B (-27.8%) 2018: $50 to $69K
- Comment – Only the groups below $40K spent less on Food in 2019. However, the increases didn’t become significant until income reached $70K or more which increased the income disparity in Food spending.
- CU Composition – Married Couple Only flipped from last to first and remain the performance leader.
- Winner – Married, Couple Only – Food: $9.92B; Up $0.86B (+9.5%) 2018: Married, Oldest Child <6
- Loser – Single Parents – Food: $0.61B; Down $0.44B (-41.6%) 2018: Married, Couple Only
- Comment – Married, Couple Only returned to the top, no surprise. In 2018 Married, Oldest Child 6>17 and Single Parents spent more on Food. In 2019 they were the only segments to spend less. Although Married CUs with children spent $0.74B more, the bulk of the increase, $2.0B (85%) came from all adult CUs – Singles, married or unmarried – just no kids.
We’ve now seen the “winners” and “losers” in terms of increase/decrease in Pet Food Spending $ for 12 Demographic Categories. The results reinforce just how widespread the spending rebound to the 2018 FDA warning was. Most of America remains firmly committed to high quality Pet Food. However, super premium Food comes with super premium prices, so income has grown in importance in Pet Food spending. I suspect that the internet and value shopping will become even more important in this segment. We have identified the winning segments in performance and $ increase but they were not alone. Not every good performer can be a winner. Some “hidden” segments should also be recognized for performance. They don’t win an award, but they get…
HONORABLE MENTION
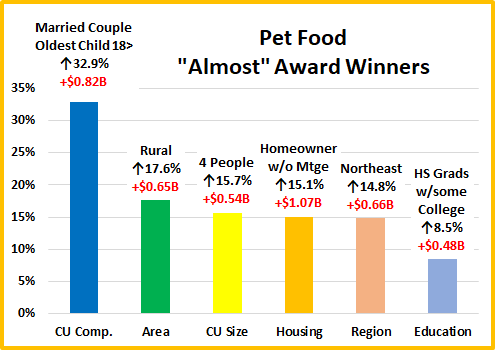
Married Couples, Oldest Child 18> came in second to Couples Only by just $0.04B. They are generally older and may soon be a couple only. Rural finished 2nd to the Small Suburbs and together areas <2500 in population spent $2.26B more on Food. 4 Person CUs narrowly beat 2 People for the 2nd biggest increase. All Homeowners spent more and those with no mortgage finished 2nd despite having a $1B increase. All regions spent more but the Northeast finished 2nd despite being the worst performer at 94%. High School Grads with no College were the winners but those who had some College courses finished second. This combined performance helped reduce the importance of higher education to increased Pet Food spending. The lift was widespread as 75% of 96 demographic segments spent more.
Summary
Pet Food has been ruled by trends over the years. The drop in 2018 due to the FDA grain free warning broke a pattern of 2 years up followed by 1 year of flat or declining sales which had been going on since 1997. This trendy nature increased with the first significant move to premium foods in 2004. The Melamine crisis in 2007 intensified the pattern and resulted in a series of “waves” which became a tsunami with the introduction of Super Premium Foods.
The 25 to 34 yr old Millennials were the first to “get on board” with Super Premium in the second half of 2014. In 2015 a substantial portion of consumers began to upgrade to this new trend. The result was a $5.4B spending increase. These consumers were generally more educated, often worked as managers or were self-employed and had higher incomes. One negative was that they often paid for the upgrade by spending less in other segments. In 2016 the anticipated drop in spending happened. The “upgraded” group began value shopping for their new food and found great deals online and in some stores. They spent some of the $3.0B “saved” Food dollars in other segments but not enough to make up for the drop in Food. Total Pet Spending was down $0.46B. In 2017 we were ready for a new “wave”. Thanks to a very price competitive market, what we got was a deeper penetration of Super Premium foods. This group of upgraders was mostly middle-income, not college educated and often Blue-collars workers. Most also were in the 55>64 year old age group. The result was a $4.6B increase but this time there was no trading $ with other segments.
In 2018 we were “due” a small annual increase in Pet Food and spending in the first half was up $0.25B. Then the bottom dropped out as spending fell $2.51B in the second half in reaction to the FDA warning on grain free dog food. It turned out that the big decrease in pet food spending came directly from the groups who had fueled the big 2017 increase. This turmoil was illustrated by the fact that 71% of the demographic groups with the biggest change in Pet Food $ switched from first to last or vice versa from their position in 2017.
That brought us to 2019. The impact of the FDA warning faded as there was little evidence to back it up. Pet Parents either returned to Super Premium or in some cases chose even higher priced options. Premium supplements $ also grew as the health and wellbeing of their Pet Children remained the number 1 priority. Pet Food $ grew $2.35B with less turmoil and 72 of 96 (75%) demographic segments spending more. Higher Education became a little less important but income and income related categories – from # Earners to Race/Ethnicity mattered more. Overall, Pet Food Spending became a little less demographically balanced in 2019, reversing a previous trend. Indications are that the 2020 Pandemic, with stay at home protocols, caused consumers to place an even greater focus on their pets and that Pet Food Spending increased, but by whom? A 2020 lift was likely again driven by income. We’ll have to wait and see.
Finally – 2019’s “Ultimate” Pet Food Spending CU is 3 people – a married couple, with 1 child over 18. They are 45>54 years old and White, but not of Hispanic origin. At least one has an advanced college degree and they both work in their own business. They earn $150>$200K but still have a mortgage on their house in a small suburb in the Midwest. By the way, they just barely edged out their neighbors, a Married Couple Only.

