Petflation 2022 – September Update: Prices increase to +11.0% above 2021
Inflation continues to make headlines. There have been year over year increases in the monthly Consumer Price Index (CPI) larger than we have seen in decades. September prices rose 0.2% from August, and the CPI was still up +8.2% vs 2021, but down from +8.3% last month. Food at Home (groceries) prices continue to surge, up 13.0% over 2021. That’s 7 straight months of double-digit YOY monthly percentage increases. These are the first 10+% increases since 1981. As we have seen in recent years, even minor price changes can affect consumer pet spending, especially in the discretionary pet segments, so we will continue to publish monthly reports to track petflation as it evolves in the marketplace.
Total Pet prices were 4.1% higher in December 2021 than in December 2020, while the overall CPI was up 7.0%. The gap narrowed as Petflation accelerated and reached 96.7% of the national rate in June. National inflation has slowed since July but Petflation has increased, passing the National rate in July and is +11.0% in September, 34.5% higher than the national rate of 8.2%. We need to look a little deeper into the numbers. This and future reports will include:
- A rolling 24 month tracking of the CPI for all pet segments and the national CPI. The base number will be pre-pandemic December 2019 in this and future reports, which will facilitate comparisons.
- Monthly comparisons of 22 vs 21 which will include Pet Segments and relevant Human spending categories. Plus
- CPI change from the previous month
- Inflation changes for recent years (20>21, 19>20, 18>19)
- Total Inflation for the current month in 2022 vs 2019
- Average annual Year Over Year inflation rate from 2019 to 2022
- YTD comparisons
- YTD numbers for the monthly comparisons #2>4 above
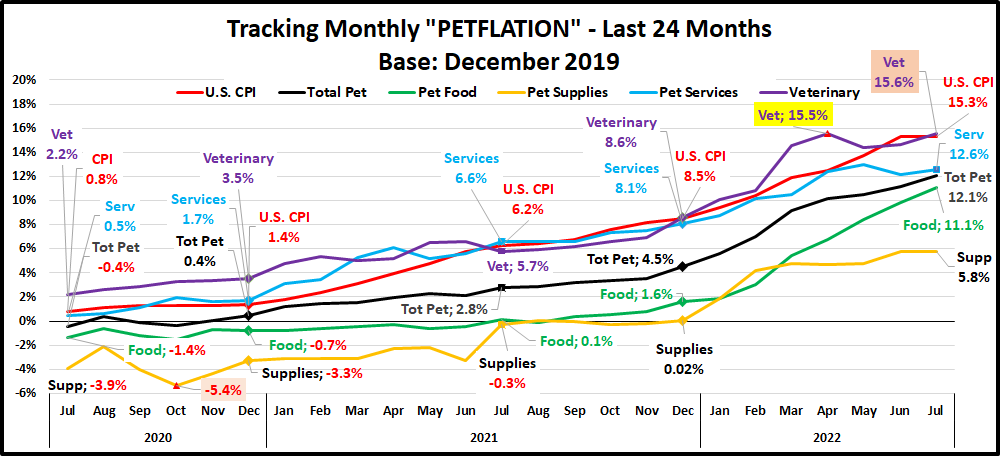
In our first graph we will track the monthly change in prices for the 24 months from September 2020 to September 2022. We will use December 2019 as a base number so we can track the progress from pre-pandemic times through an eventual recovery. Inflation is a complex issue. This chart is designed to give you a visual image of the flow of pricing. You can see the similarities and differences in patterns between segments and compare them to the overall U.S. CPI. The current numbers plus those from 12 and 24 months earlier are included as are the year-end numbers for 2020 & 2021.This will give you some key waypoints for comparisons. (Note: Some key peaks and valleys are also highlighted.)
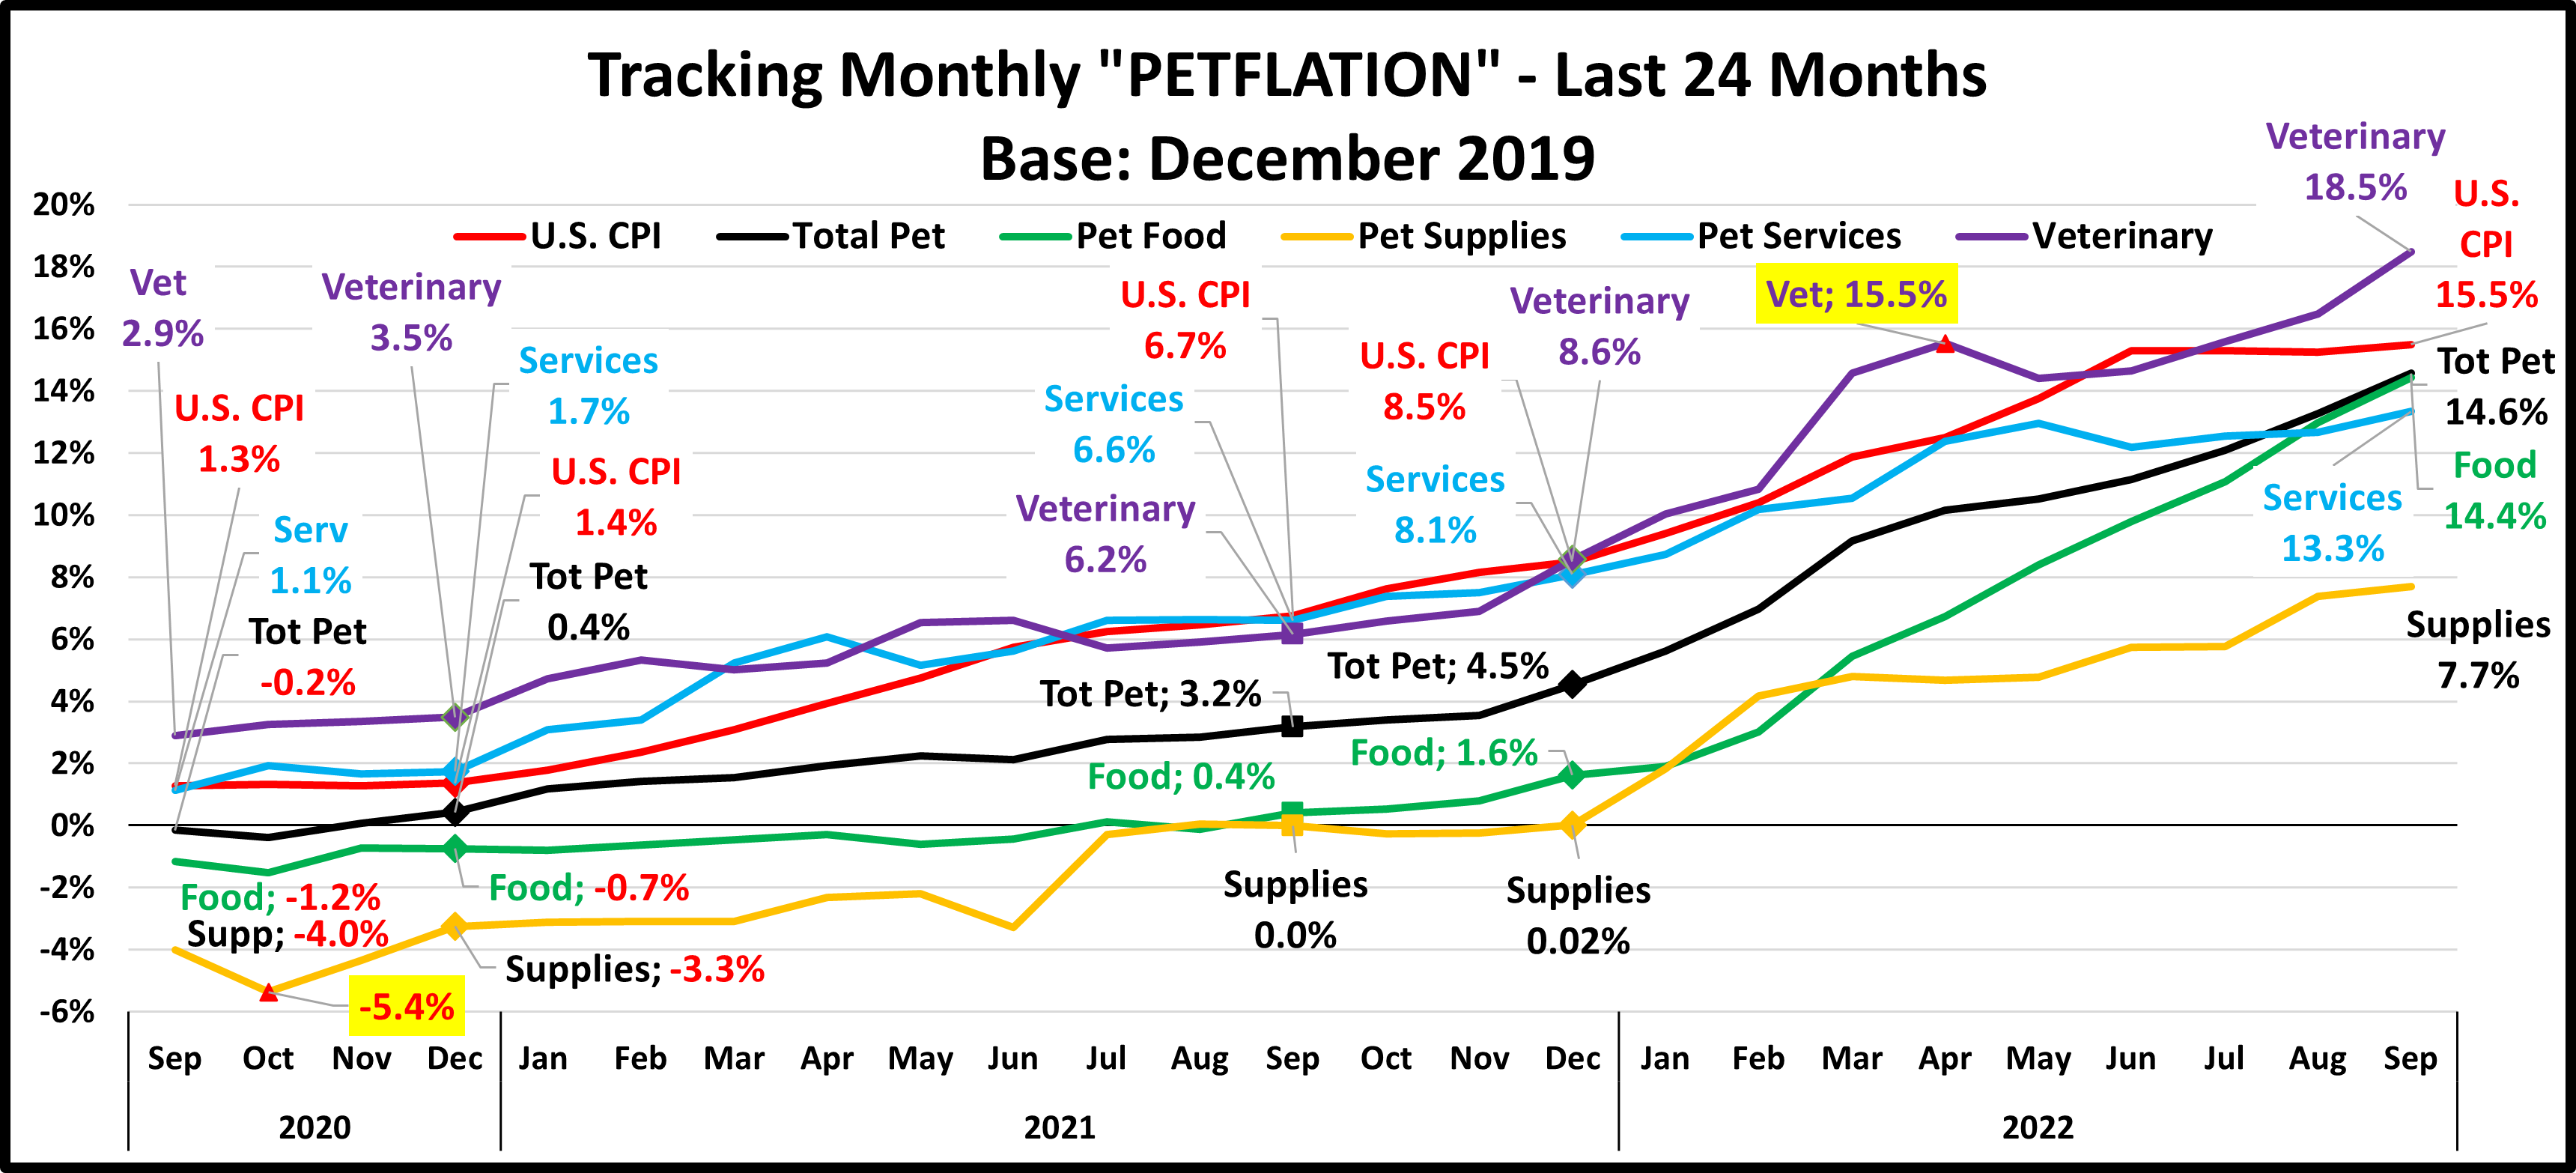
The pandemic hit home in early 2020. In September, the national CPI was only +1.3% and Pet prices were down -0.2%. There are 2 different patterns between the Services and the Products segments. Veterinary and Services prices generally inflated after mid-2020, similar to the overall CPI. Food and Supplies prices generally deflated until late 2021. After that time, Petflation took off. Pet Food prices consistently increased but the other segments had mixed patterns until July, when prices in all segments increased. In August & September Petflation accelerated, especially in Food & Veterinary.
- U.S. CPI – The inflation rate was below 2% through 2020. It turned up in January 2021 and continued to grow until flattening out in Jul/Aug 2022. 44% of the overall 15.5% increase since 2019 happened from Jan>June 2022.
- Pet Food – Prices stayed generally below December 2019 levels from April 2020 to September 2021, when they turned up. There was a sharp increase in December but 89% of the 14.4% increase has happened since January.
- Pet Supplies – Supplies prices were high in December 2019 due to the added tariffs. They then had a “deflated” roller coaster ride until mid-2021 when they returned to December 2019 prices and essentially stayed there until 2022 when they turned sharply up reaching a new all-time pricing high in January, beating the 2009 record. Prices plateaued from February> May but turned up in June. The CPI flattened in July but turned up in Aug/Sept.
- Pet Services – Normally inflation is 2+%. Perhaps due to closures, prices increased at a lower rate in 2020. In 2021 consumer demand increased but there were fewer outlets. Inflation grew in 2021 with the biggest lift in Jan>Apr. Inflation was stronger in 2022 but it got on a rollercoaster in March then turned up July>September.
- Veterinary – Inflation has been generally consistent in Veterinary. Prices began rising in March 2020 and increased through 2021. Then a pricing surge began in December which pushed them past the overall CPI. In May prices fell and stabilized in June. Then strong increases in July>September again put them above the National CPI.
- Total Pet – The blending of the different segment patterns made the Pet Industry appear calm. That ended in December 2021 as prices surged in all. After mixed up and downs, in Jul>Sep inflation grew in all segments.
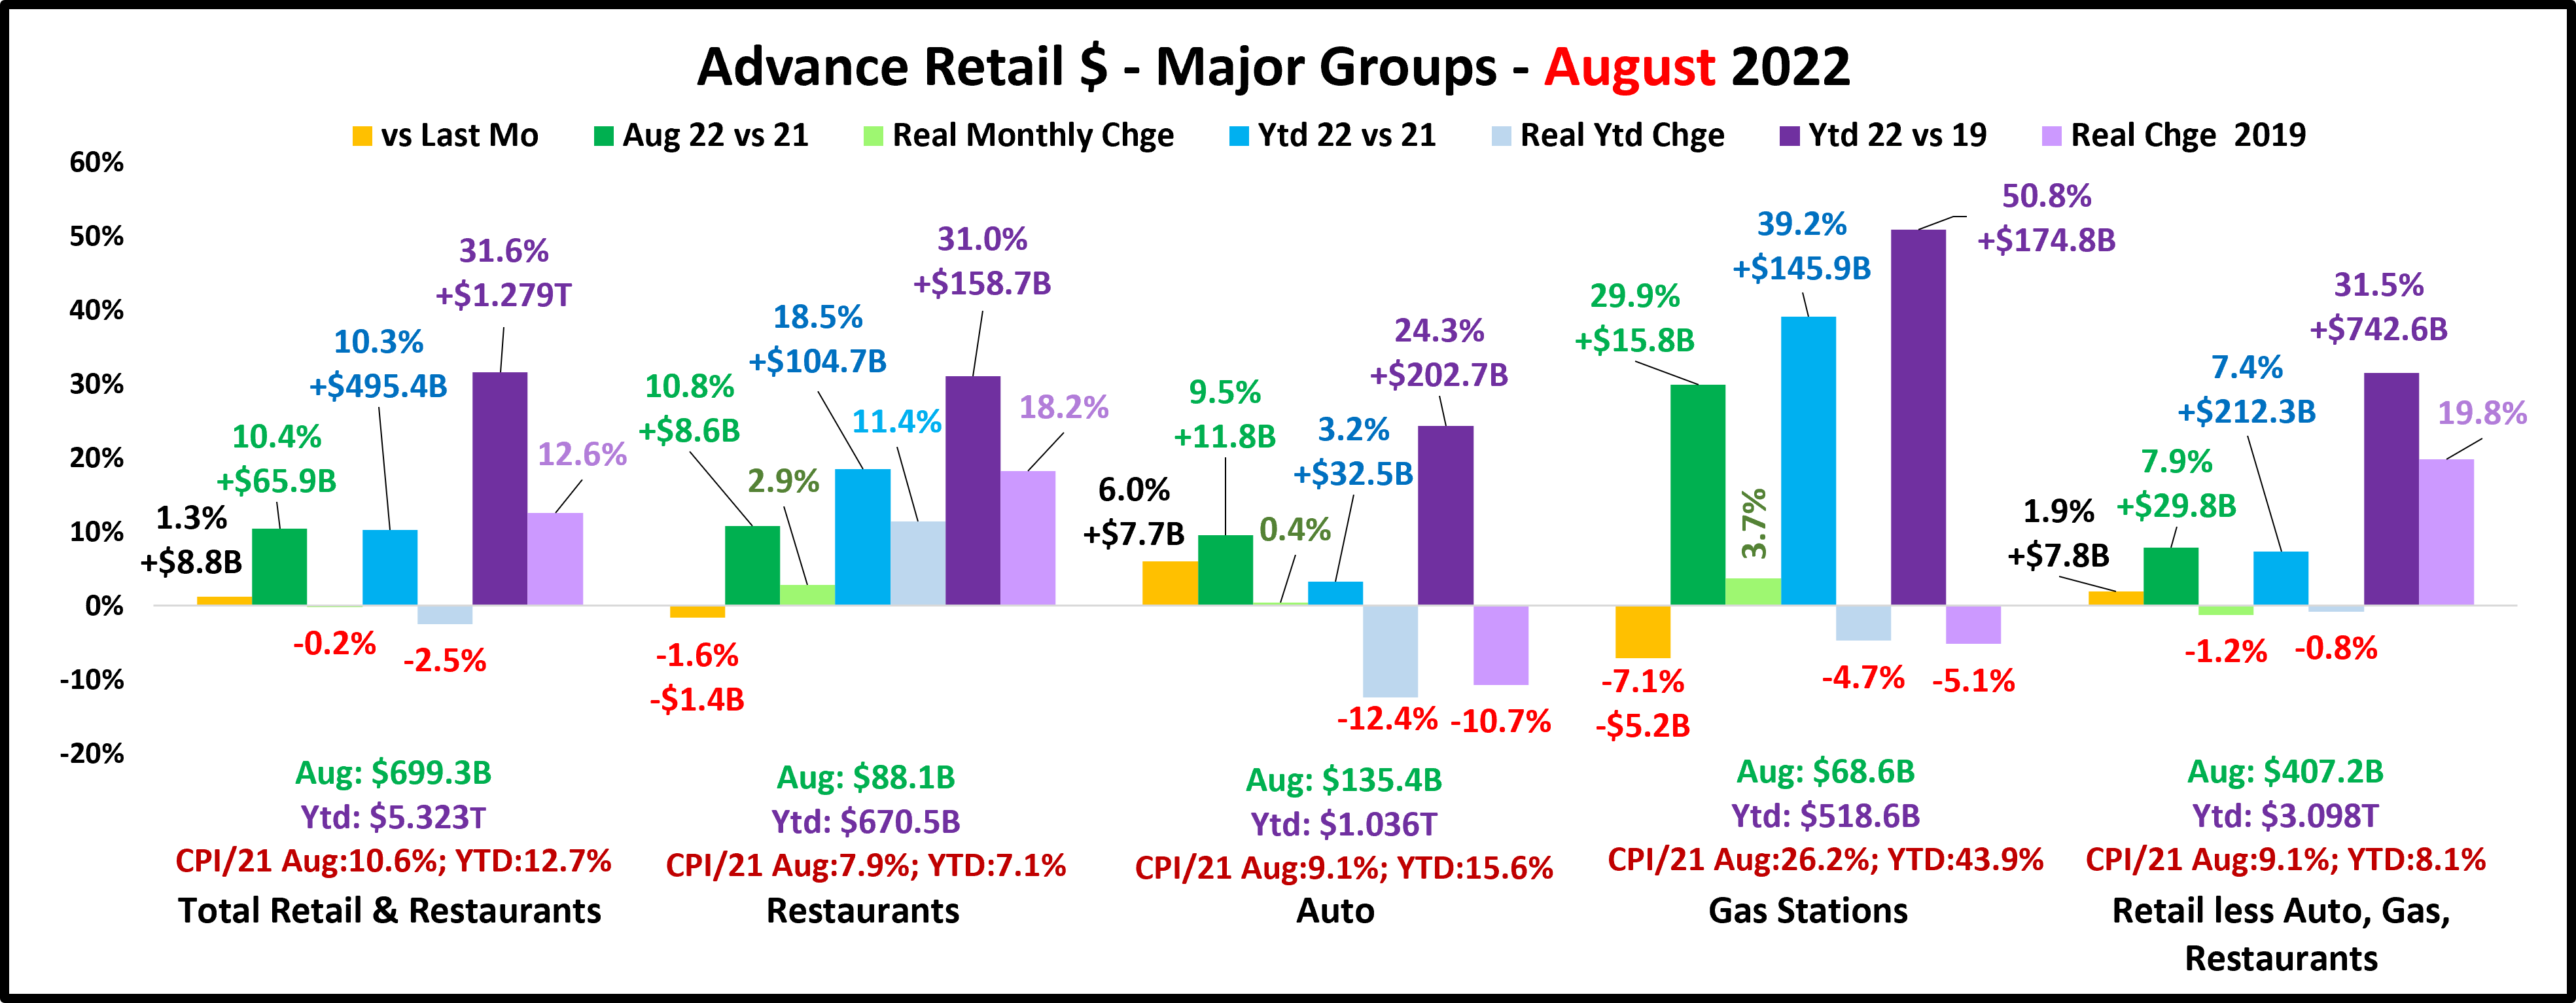
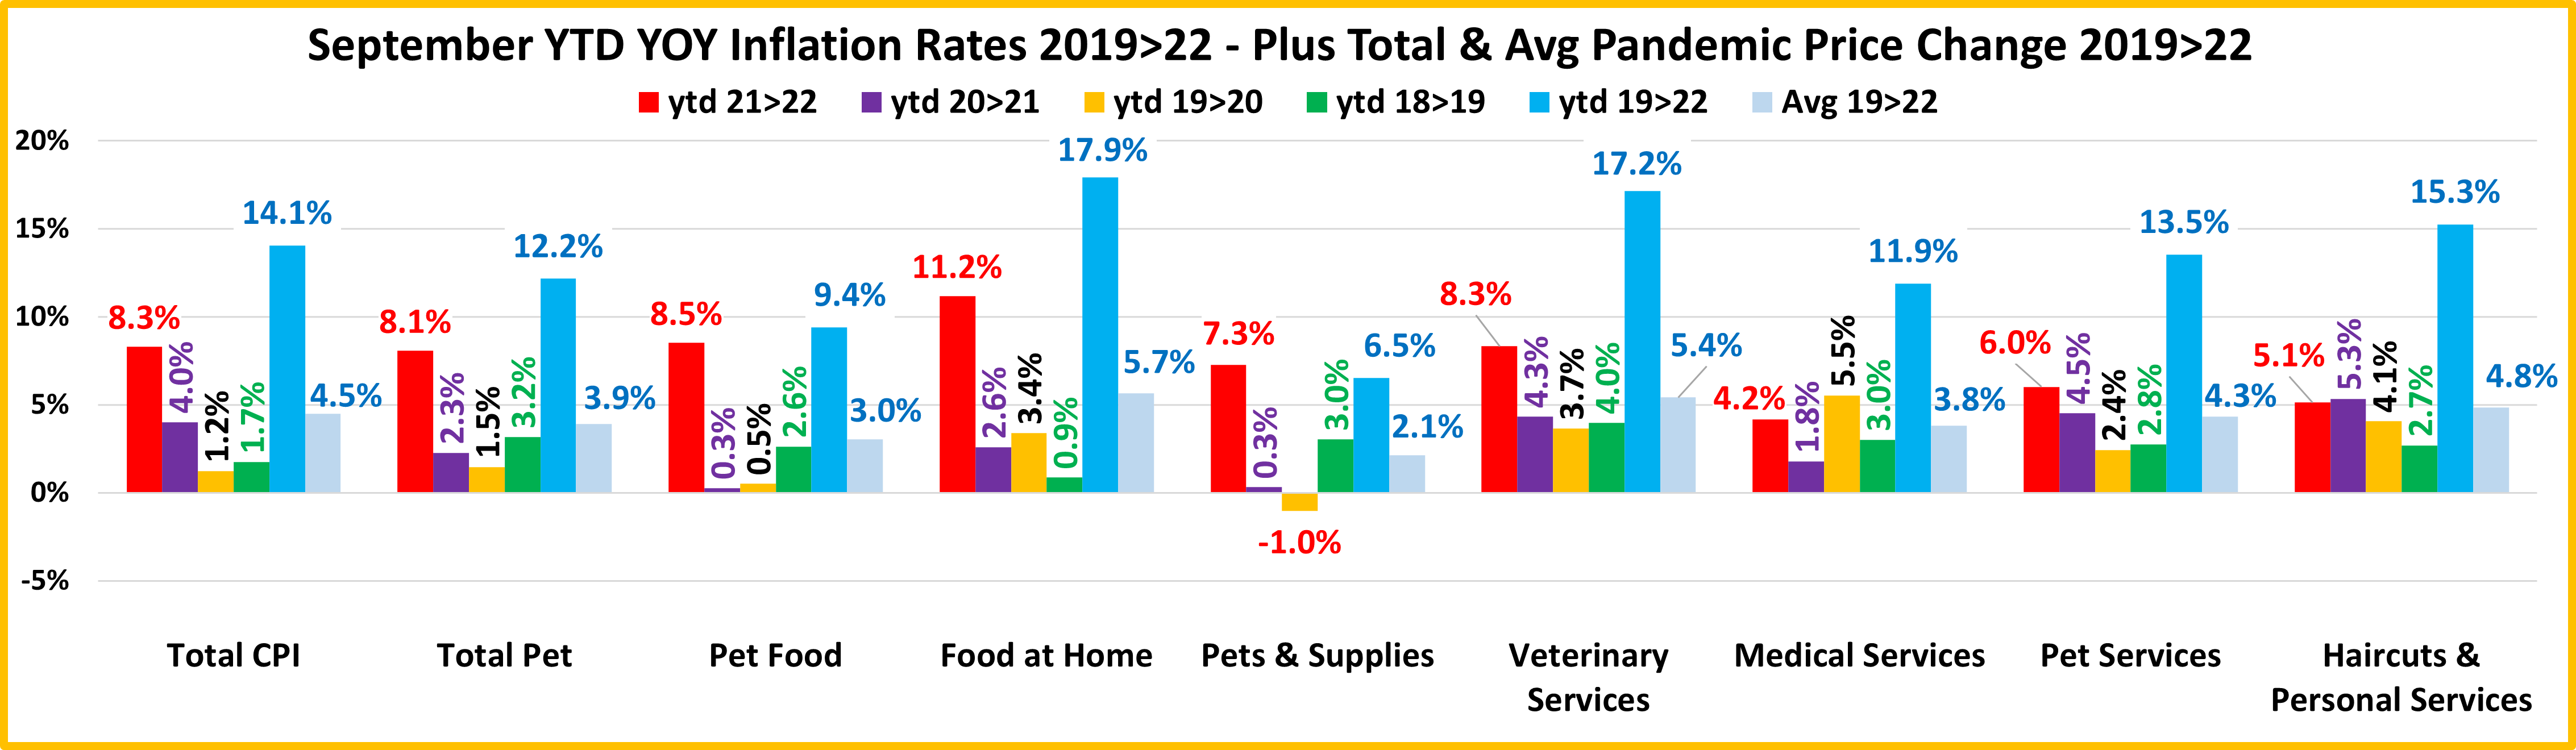
Next, we’ll turn our attention to the Year over Year inflation rate change for September and compare it to last month, last year and to previous years. We’ve added some human categories to put the pet numbers into perspective.

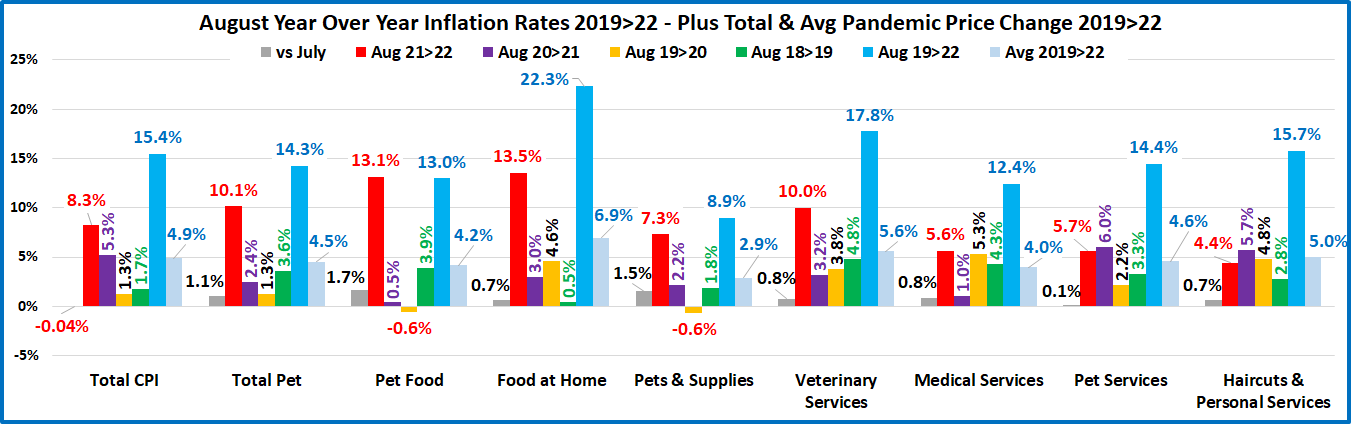
Overall, Prices were up 0.2% vs August but were up 8.2% vs September 2021. The Grocery increase is now 13.0% which is a big negative but there is another area of concern. Only 3 of 9 categories had increases over 1% from last month, but they are all “Pet”. The National CPI rate is slowing but Petflation, especially in Food & Veterinary, is getting worse.
- U.S. CPI– Prices are up 0.2% from August. The YOY increase is +8.2%, down from the 9.1% peak in June. The targeted inflation rate is <2% so we are still 4 times higher than the “target”. However, a 3rd slight decline is a good start.
- Pet Food– Prices are +1.3% vs August and 14.0% vs Sep 21. They also exceeded the Food at Home inflation rate for the 1st time. The YOY increase is being measured against a time when prices were at 2019 levels, but that increase is over 4 times the pre-pandemic 3.3% increase from 2018 to 2019.
- Food at Home – Prices are up 0.6% from June. The increase from 2021 is 13.0%, down slightly from 13.5% last month. Inflation for this category since 2019 is the highest on the chart and is 47% more than the national CPI.
- Pets & Supplies – Prices only grew 0.3% from August but set a new record high. They fell from to 2nd to 3rd in terms of monthly increase over 2021 for industry segments and still have the lowest increase since 2019.
- Veterinary Services – September prices grew 1.7% from August. They are +11.6% from 2021 and trail only Food in the Pet Industry. They also remain 2nd in the increase since 2019 with 19.7% compared to Food at home at 22.9%.
- Medical Services – Prices sharply increased at the start of the pandemic in 2020 but then inflation slowed and fell to a low rate in 2021. In 2022 prices are turning sharply up again, +48% vs the pre-pandemic 2018>19 rate.
- Pet Services – Inflation slowed in 2020 but began to grow in 2021/22. Prices are +0.6% from August and +6.3% vs 2021. Prices hit a new record high in September, passing the previous record set in May.
- Haircuts & Other Personal Services – Prices are +0.3% from Aug. and +5.1% from 2021. They are +16.0% since 2019.
- Total Pet – Petflation is strong, 3+ times the rate of last year and is 34.5% ahead of the National CPI. All segments increased prices in September, but inflation is primarily being driven by Food & Veterinary. Inflation can cause reduced purchase frequency in Supplies, Services and Veterinary. Super Premium Food has been generally immune as consumers are used to paying a lot and it is needed every day. We’ll see if consumers are willing to pay the new high prices for food and buy the more discretionary products/services at the same frequency as they did in the past.
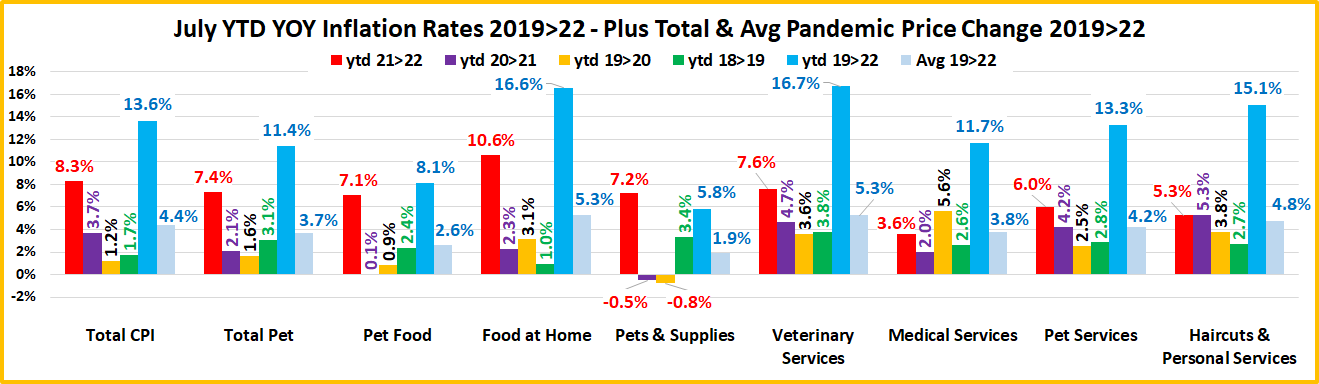
Now here’s a look at Year-to-Date numbers. How does 2022 compare to previous years…so far?
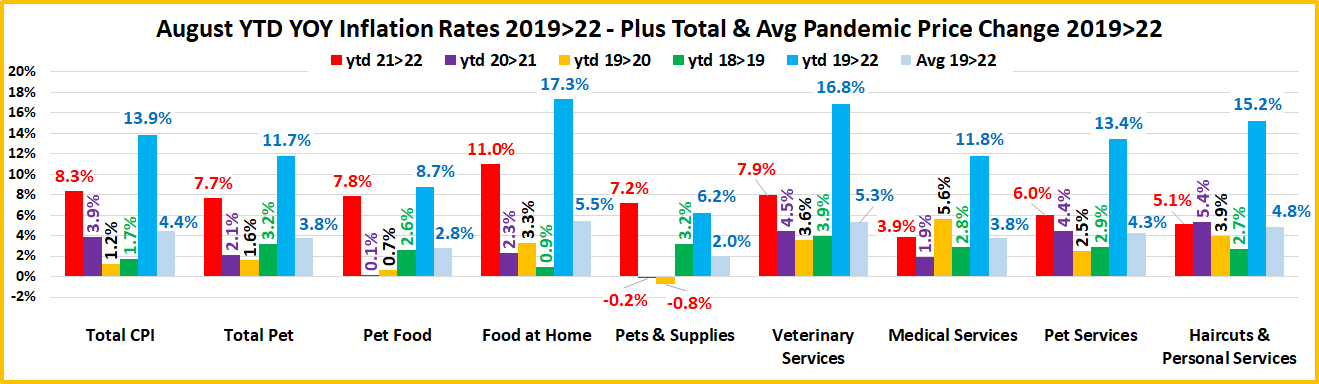
The increase from 2021 to 2022 is the biggest for 7 of 9 categories. The average annual increase since 2019 is 3.8% or more for all but Pet Food & Pet Supplies. This is largely due to deflation in the 1st half of 2021.
- U.S. CPI – The current increase is still almost double the average increase from 2019>2022, but almost 4 times the average annual increase from 2018>2021. Inflation is a big problem that started recently.
- Pet Food – Inflation is growing stronger, especially after deflation in the 1st half of 2021 kept YTD prices low.
- Food at Home – The 2022 YTD inflation beat the U.S. CPI by 27%. You can see the impact of supply chain issues.
- Pets & Pet Supplies – Prices have been at record levels since January. Although the 2021>22 increase is being measured against a “flat” 2021, it is significant and just slightly behind Food & veterinary in the Pet Industry.
- Veterinary Services – Trails only Food at Home in inflation since 2019 and is the only segment on the chart with a 3+% inflation rate each year throughout the pandemic and recovery. No matter what, just charge more.
- Medical Services – Prices went up significantly at the beginning of the pandemic, but inflation slowed in 2021. In 2022 there is another pricing surge as the inflation rate is 40% higher than pre-pandemic 2018>19.
- Pet Services – February & May set records for the biggest year over year monthly increases in history. Prices began to grow again in July, reaching a record high in September. The current September YTD increase of 6.0% is the largest in history. Demand has grown for Pet Services while the availability has decreased, a formula for inflation.
- Haircuts & Personal Services – The services segments, essential & non-essential were hit hardest by the pandemic. After a small decrease in March, prices turned up again. The YTD rate is just behind 2020>21 but still 89% more than 2018>19. Consumers are paying 15% more than in 2019. This usually reduces the purchase frequency.
- Total Pet – We have seen basically two different inflation patterns. After 2019, Prices in the Services segments continued to increase, and the rate accelerated as we moved into 2021. The product segments – Food and Supplies, were on a different path. They generally deflated in 2020 and didn’t return to 2019 levels until mid-year 2021. Food prices began a slow increase, but Supplies remained stable until we neared yearend. In 2022, everything changed as Food and Supplies prices turned sharply up. Food prices continued to climb. Supplies pricing stabilized then grew in Jun>Sep. The Services segments have had some ups & downs, but both are inflating now. The net was a September YTD Petflation increase vs 2021 of 8.1%, 97.6% of the high 8.3% National rate. It was only 72.5% back in March.
Petflation is growing stronger. Will it impact spending? Let’s put it into perspective. The 8.1% current YTD increase in Total Pet is still below the 8.9% record set in 2009 but 5+ times more than the 1.5% avg since then. Pet spending continues to move to higher income groups, but the impact of inflation varies by segment. Supplies is the most affected as many categories are price sensitive. Super Premium Food has become widespread because the perceived value has grown. Higher prices generally just push people to value shop. Veterinary prices have strongly inflated for years, resulting in a reduction in visit frequency. Spending in the Services segment is driven by higher incomes, so inflation is less impactful. We’ll just have to wait and see the overall impact on Pet Spending of the continued strong Petflation.