U.S. Pet Services Spending (Non-Vet) $7.84B (↓$0.97B): 2020 Mid-Year Update
The US BLS released their Mid-Year Update of the Consumer Expenditure Survey covering the period from 7/1/2019 to 6/30/2020. In our analysis of Pet Supplies Spending, we saw the drop in spending sparked by tariffs had now reach 18 months. However, Pet Food Spending turned up, first in the 2nd half of 2019, as it recovered from the FDA warning on grain free dog food. Then it had a huge lift in the 1st half of 2020 as many Pet Parents “panic” bought food due to the onset of the pandemic. Now we turn our attention to Pet Services. The Mid-year numbers show that spending in this segment was $7.84B, down $0.97B (-11.0%) from the previous year. Up until 2018, this segment was known for consistent, small growth. In 2018, increased outlets and competitive prices brought on a wave of new users and spending increased +$1.95B. Spending remained near this new high normal until we reached 2020. March closures due to the pandemic drove spending down $0.78B in the first half so that Pet Services spending returned to the Mid-Year 2018 level. This deserves a closer look. First, we’ll review recent Services spending history since 2014.
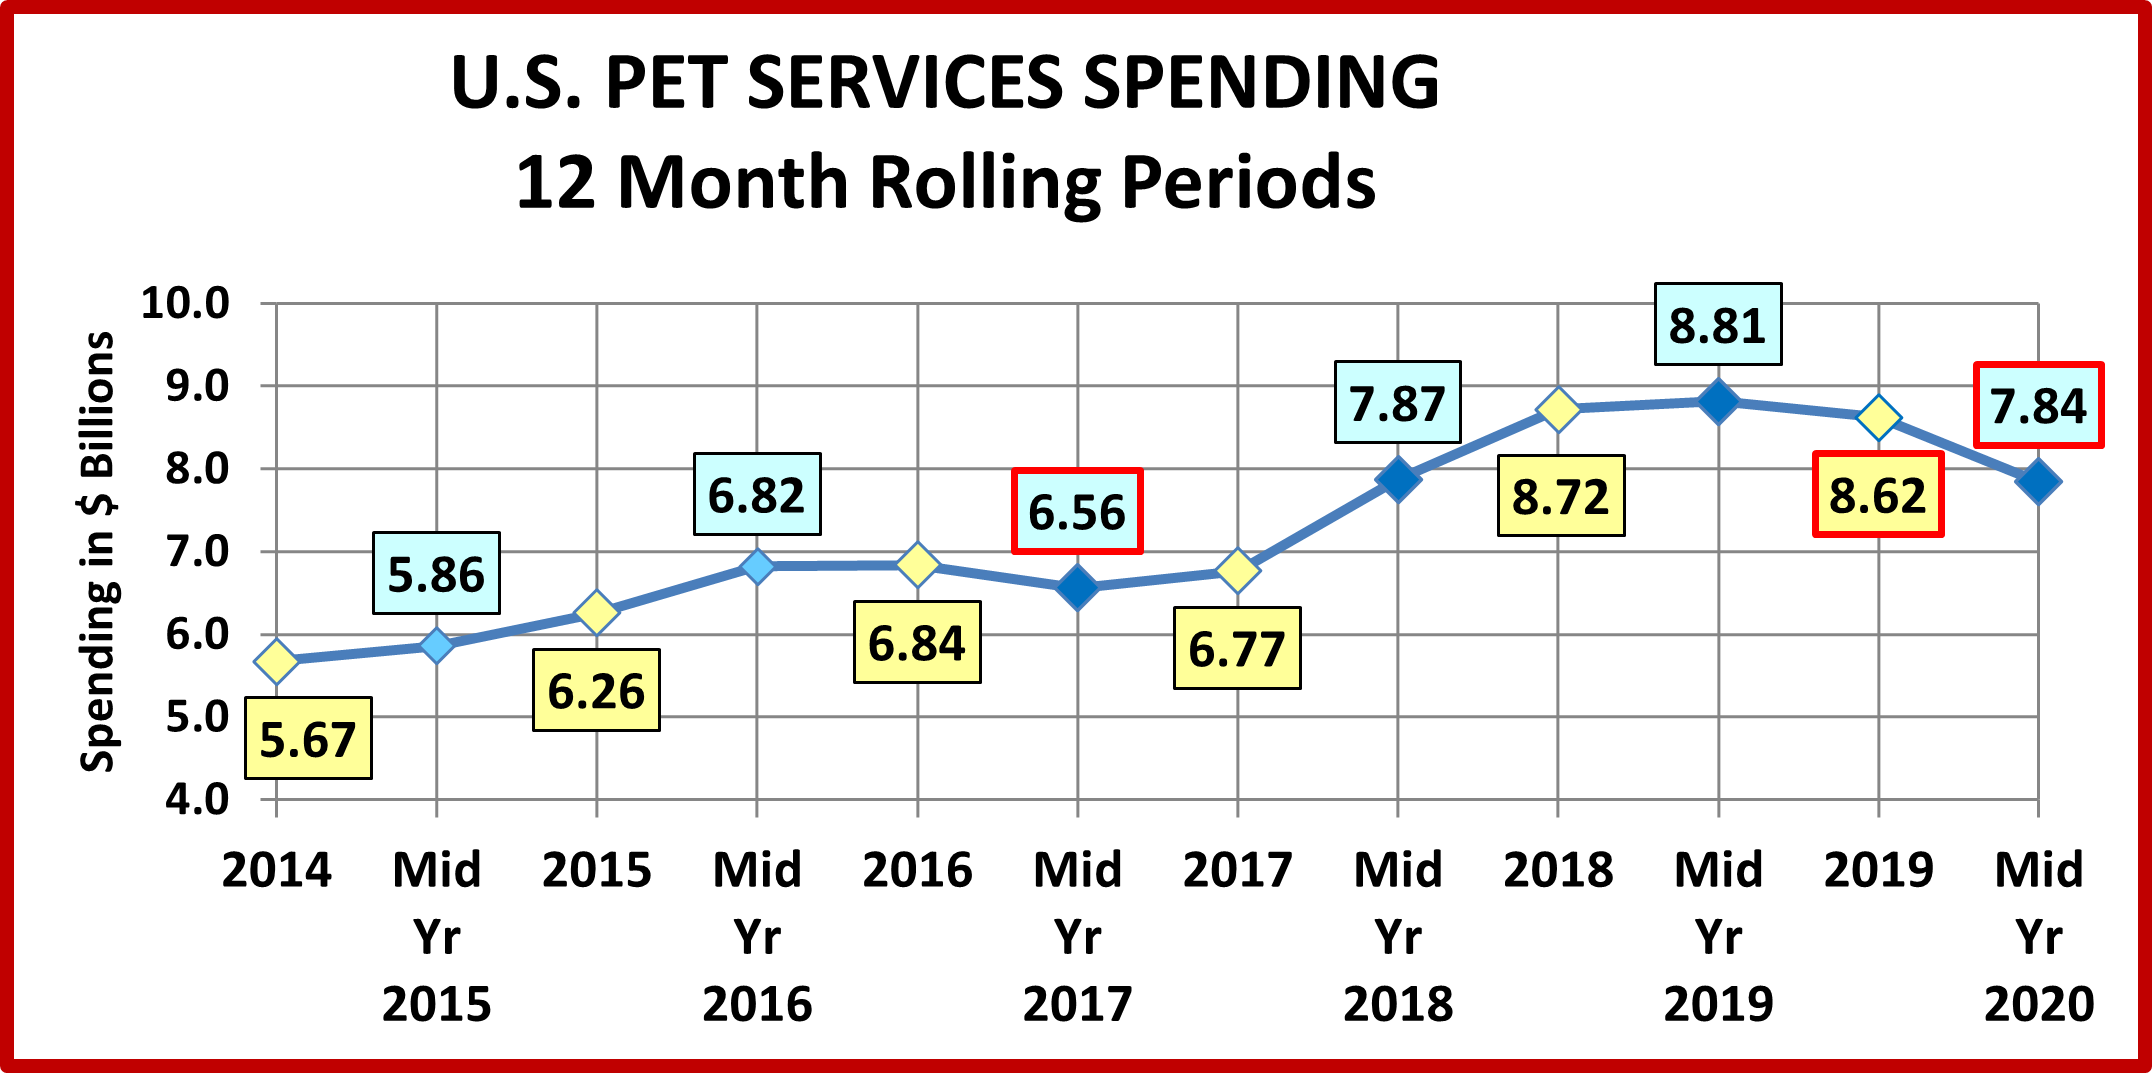
Here are the 2020 Mid-Year Specifics:
Mid-Year 2020: $7.84B; ↓$0.97B (-11.0%) vs Mid-Yr 2019
- Jul > Dec 2019: ↓$0.19B
- Jan > Jun 2020: ↓$0.78B
Pet Services is by far the smallest industry segment. However, except for 2010 and 2011, the period immediately following the Great Recession, it had consistent annual growth from 2000 through 2016. Spending in Food and Supplies have been on a roller coaster ride during that period. Services Spending more than tripled from 2000 to 2016, with an average annual growth rate of 7.6%. Spending in the Services Segment is the most discretionary in the industry and is more strongly skewed towards higher income households. Prior to the great recession, the inflation rate averaged 3.9% with no negative impact. The recession affected every industry segment, including Services. Consumers became more value conscious, especially in terms of discretionary spending. Services saw a slight drop in spending in both 2010 and 2011, but then the inflation rate fell to the 2+% range and the segment returned to more “normal” spending behavior. In mid-2016 inflation dropped below 2% and continued down to 1.1% by the end of 2017. This was primarily due to increased competition from free standing businesses but also an increase in the number of Pet Stores and Veterinary Clinics offering pet services. While prices still went up slightly, there were deals to be had and consumers shopped for the best price. There was no decrease in purchase frequency. Consumers just paid less so spending fell slightly. In the 2nd half of 2017 spending turned up again. More Consumers began to take advantage of the value and convenience of the increased number of outlets offering Services. This deeper market penetration caused Services Spending to take off in 2018, up $1.95B, by far the biggest annual increase in history. Prices turned up again in the first half of 2019, increasing 2.8% from 2018. However, Services spending inched up $0.09B. In the 2nd half of 2019 Value shopping again came to the forefront as spending fell -$0.19B. Then came 2020 and the pandemic. Many of these nonessential businesses were forced to close and spending fell -$0.78B to $7.84B, the same as Mid-Year 2018.
Let’s take a closer look at some spending demographics – Age and Income.
The graphs that follow we compare spending for the 12 months ending 6/30/20 to the previous 12 months. The graphs also include the 2019 yearend $, so you can see spending changes in the 2nd half of 2019 and the 1st half of 2020.
The first graph is for Income, the single most important factor in increased Pet Spending, especially in Services.
Here’s how you get the change for each half using the Over $70K group as an example:
Mid-yr Total Spending Change: $6.02B – $6.43B = Down -$0.41B (Note green outline = increase; red outline = decrease)
- 2nd half of 2019: Subtract Mid-19 ($6.43B) from Total 2019 ($6.47B) = Spending was up $0.04B in 2nd half of 2019.
- 1st half of 2020: Subtract Total 2019 ($6.47B) from Mid-20 ($6.02B) = Spending was down -$0.45B in 1st half of 2020.

- We again added an Over/Under $100 measurement. You see how Services Spending is skewed towards higher incomes. The halfway spending point is probably about $125K so 20% of CUs spend 50% of Services $. $70K+ had a slight uptick in the 2nd half of 2019 due to $50>$150K. All other big groups trended down in both halves.
- The two individual groups below $50K declined in both halves. The $30>$50K had the biggest drops and finished down -$0.41B (-41.4%). They gave back most of a 47% increase a year earlier from a spending surge by Retirees.
- The middle income $50 to $100K showed the least impact of any group. Spending by the $50>$70K was virtually unchanged in both halves. The $70>$100K group had a small lift in the 2nd half of 2019 and showed almost no impact due to the pandemic so they were the only group to finish positive for the year, +$0.11B (+9.8%).
- The two over $100K groups had the biggest pandemic impact in $, -$0.44B but for the year they actually gained slightly in share of Services $, moving up to 61.0% from 60.2%.
- Income is the single biggest factor in choosing the discretionary convenience of Pet Services and it appears that the start of the pandemic has made it even stronger.
Now, Services’ Spending by Age Group.

- There are a multitude of spending patterns, and none are tied specifically to young or old.
- Last year the 55>64 yr old Boomers had the only overall decrease. This year the 25>34 year olds had the only increase. It was minor and their spending was flat in the 1st half of 2020. Overall, it was quite a turnaround.
- The 45>64 and 75+ groups had the same pattern with a lift in the last half of 2019, followed by a drop in the first half of 2020. The 35>44 yr and 65>74 groups were down in both halves, but the Gen Xers were down -$0.58B, -32%.
- The continuing decrease by the 35>44 group is significant . They are now down -$0.75B (-37.5%) from 2018’s $2B.
Now let’s look at what is happening in Pet Services spending at the start of 2020 across the whole range of demographics. In our final chart we will list the biggest $ moves, up and down by individual segments in 11 demographic categories. Remember, the pandemic drop in the 1st half of 2020 was -$0.78B, a big change from +$0.09B in 2019.
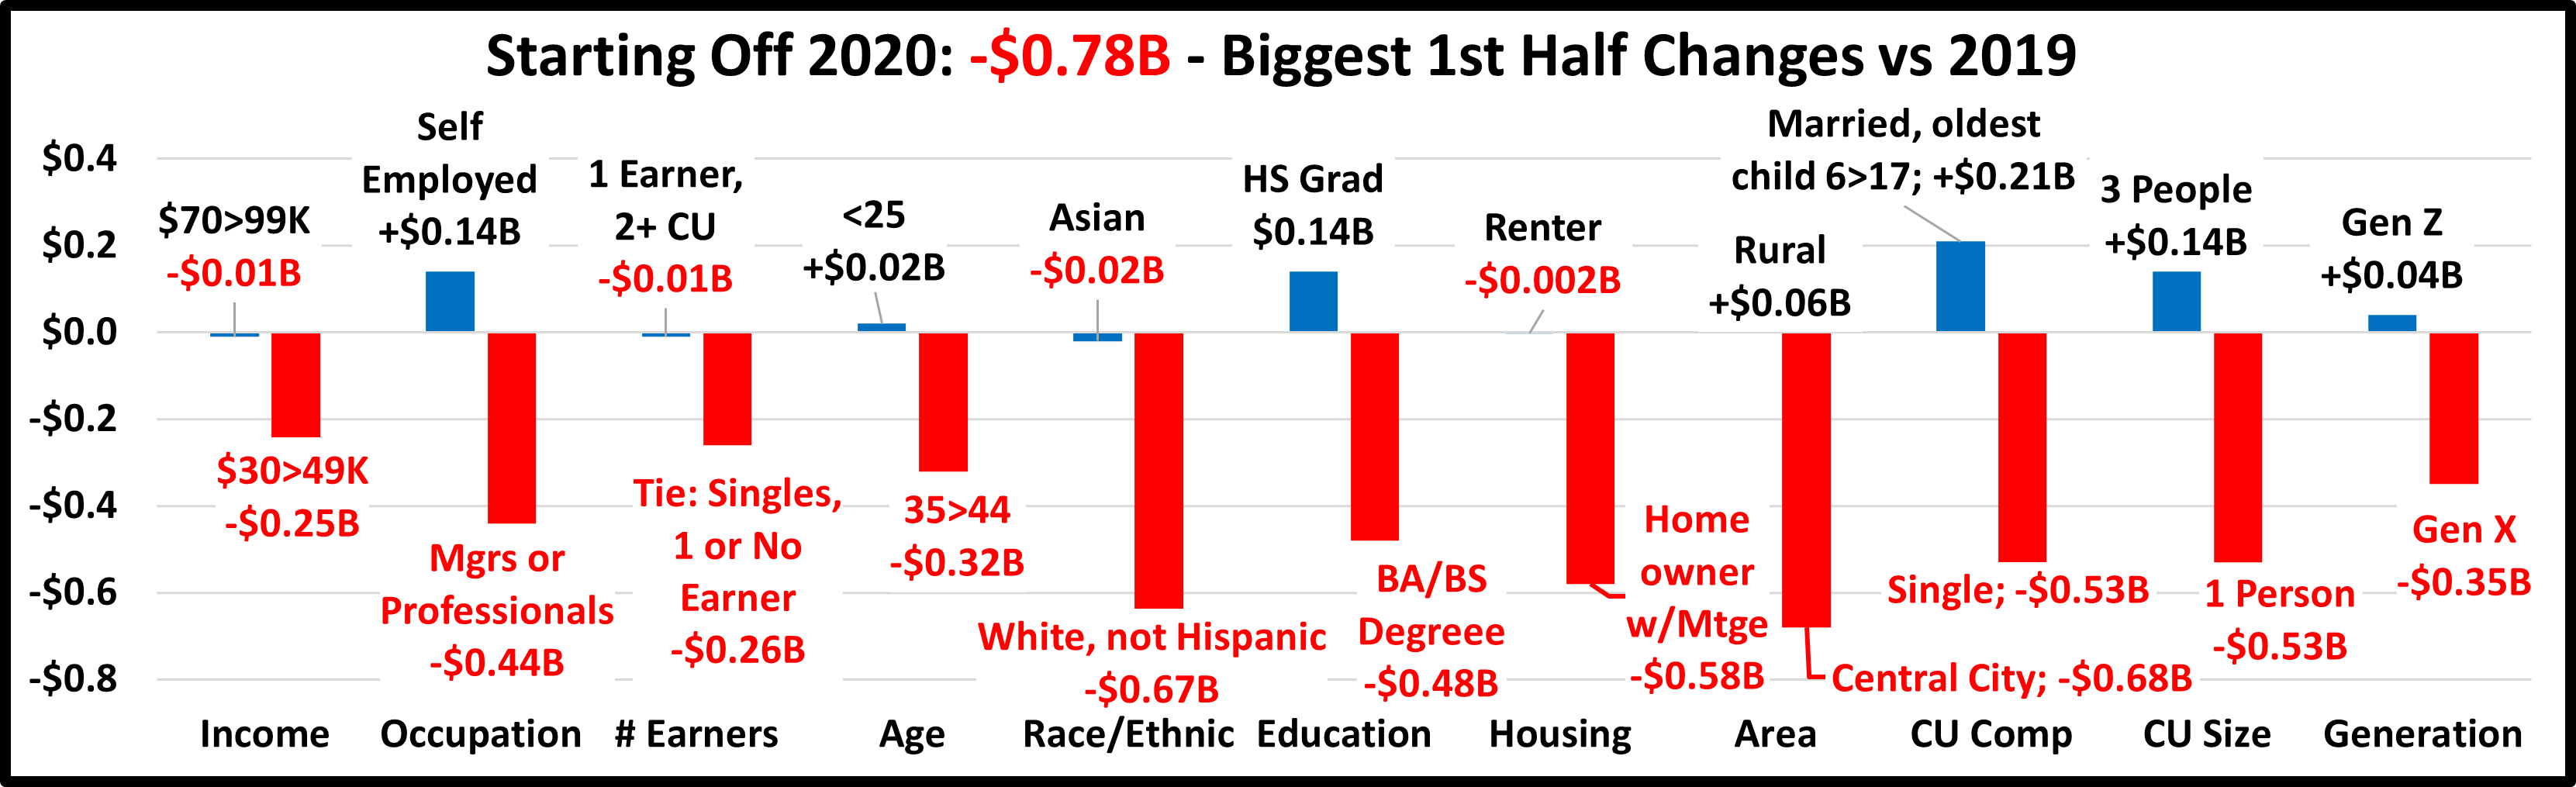
Obviously, 2020 has not started out well, due to pandemic closures. In 4 of the 11 categories, all segments spent less on Services. Also, the $ changes from the losers are overwhelming larger than the positives of the winners. The -$0.78B decrease in Pet Services came from 72 of 82 demographic segments (88%) spending less. The negative impact of the pandemic on the Services segment was extremely widespread.
There is only one usual winner – Self Employed and one usual loser – Singles. However, there are many surprises:
Winners:
- Under 25 yrs
- High School Grads
- Rural
- Gen Z
Losers:
- Mgrs/Professionals
- BA/BS Degree
- Homeowners w/Mtge
- Gen X
Like the Supplies segment, the younger groups are providing the only positives. However, the groups are much more defined. We also should note than while the <25 group had the only 1st half lift by any age group, the 25>34 year olds had the only Mid-Yr 12 month lift for any age group and held their Services spending ground in the 1st half of 2020.
The 1st half 2020 positives are coming from specific groups of the youngest Americans, – <25 yrs old, Gen Z (mostly singles) and young, small families – 3 people, Oldest Child 6>17. 4 person CUs also increased spending in 2020 and Millennials were only down slightly -$0.01B. The importance of the younger groups continues to grow as the Baby Boomers must ultimately “pass the torch”.
In 2018 the Services segment reached a new level of prominence in the Pet Industry. In 2019 spending dropped slightly. Then came the pandemic and spending fell sharply. How did we get to this point and what comes next?
We have noted that by 2017 the number of outlets offering Pet Services had radically increased. This created a highly competitive market and the inflation rate dropped to near record lows. Value conscious consumers saw that deals were available, and they took advantage of the situation. However, they didn’t increase the frequency of purchase. They just paid less. This drove overall Pet Services spending down in the 1st half of 2017. The segment started to recover in the 2nd half but not enough to prevent the first annual decrease in Pet Services spending since 2011. However, it was a start. In 2018, more consumers started to recognize the convenience offered by more outlets. The latest big food upgrade was also winding down. The result was that Services started a deeper penetration into the market, especially in the younger groups. The < 45 groups spent $1.47B more on Services in 2018, 74% of the total $1.95B increase in the segment. After such a big lift, a slight downturn in 2019 was not unexpected and it happened, -$0.1B. Then came 2020. Many Services outlets were deemed nonessential and forced to close due to the pandemic. Services Spending fell -$0.78B.
What will happen in the 2nd half of 2020? There was no national mandate so re-openings were dependent upon local decisions. It’s likely that we will see a further decline. One thing hasn’t changed. Pet Services have become an important option that is exercised by an increasing number of Pet Parents. Now, in 2021 America has “opened up”. The Services segment should rebound strongly. We’ll get the full year 2020 data in September and the 1st half of 2021 in May 2022.

