U.S. PET FOOD SPENDING $31.56B (↓$6.40B): MID-YEAR 2021 UPDATE
The pandemic had a huge impact on consumers. They stayed home and focused on needs, rather than wants. This behavior was very evident in the Pet Industry as the “needed” segments – Food and Veterinary Services, had big $ increases while the spending in the more discretionary segments – Supplies and Non-Vet Services fell. There were other factors that amplified these differences. Services outlets were often deemed non-essential, so they were subject to widespread restrictions and closures. Food had a completely different path. During the early stages of the pandemic, consumers often binge bought essential products to have a backup supply in case there were outages. This behavior applied to Pet Food, which is the only absolutely essential Pet Industry Segment. The result was a $6.8B increase in spending over the 1st half of 2019. It should be noted that Pet Food spending was down in the 1st half of 2019 because the segment was still feeling the impact of the “untrue” FDA warning on grain free dog food. However, the lift was still the biggest year over year increase in history.
Pet Parents maintained this extra supply of pet food throughout the balance of 2020. As we moved into 2021, there were still some outlets that were suffering but most channels had recovered, and the overall Retail Market was prospering. This caused a change in Pet Food spending. Pet Parents obviously didn’t binge again and, in a few situations, even had their pets start to “eat down” the extra supply of food to return to their previous level of home “inventory”. They also increasingly moved to internet purchasing with regular deliveries. As a result, Pet Food Spending fell -$6.4B (-16.9%) in the 12 month period ending 6/30/21 over the previous year and -$5.3B vs the 1st 6 months of 2020.
As you know, the pandemic also caused problems in information gathering for the data collected by the US BLS for the annual Consumer Expenditure Survey (CEX), especially in the Diary method which is used for Pet Food. Those were resolved in 2020 and everything returned to a “new normal”.
Now, let’s get started with our Pet Food spending update for Mid-Year 2021. Pet Food (& Treat) Annual Spending was $31.56B, down -$6.40B (-16.9%). The following charts and observations were prepared from calculations based upon data from the current CEX report and earlier ones. The first chart will help put the $31.56B into historical perspective and truly show you the roller coaster ride that continues in Pet Food Spending.
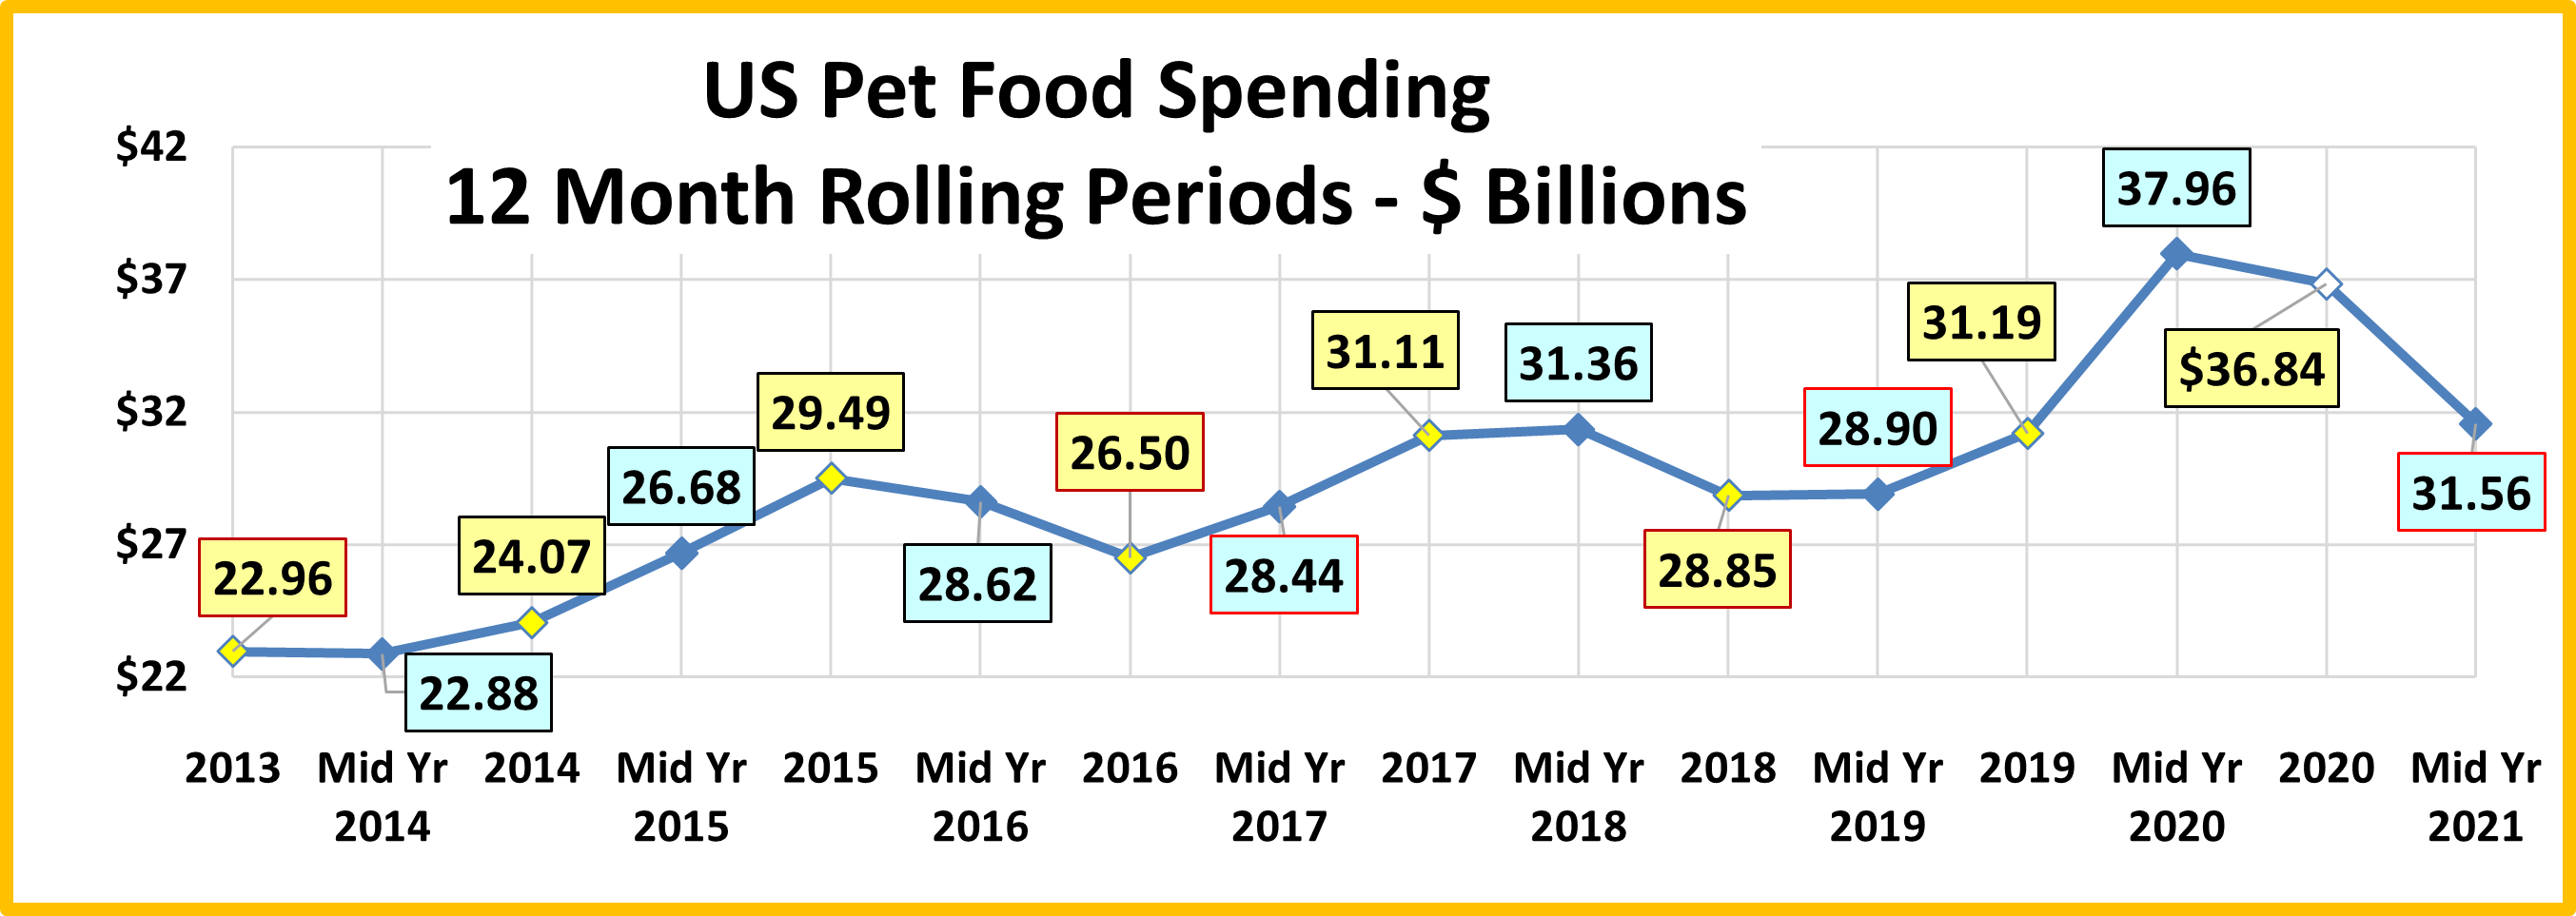
Here are the current numbers:
Mid 2021: $31.56B; ↓$6.40B (-16.9%) from Mid-2019. The net -$6.40B in Mid 2021 came from:
◦ Jul>Dec 2020: Down $1.12B from 2019. ◦ Jan>Jun 2021: Down $5.29B from 2020.
Historical research has shown that Pet Food spending has been on a roller coaster since 2000, with 2 years up, followed by a flat or even declining year. This up and down “ride” has been driven by a succession of Food trends. The most recent were “Natural” in 2011 and “Super Premium” in 2014. Another factor was added in 2013 – deflation. As consumers opted for higher quality, more expensive pet food, competition became more intense, with the Internet now becoming a key player. 2013 was a definitely a game changer for this segment as it began an extended period of deflation which continued through 2018. Midway through 2018, Pet Food prices were still 2.3% lower than in 2013.
The spending drops in 2013 and 2016 were driven by pet parents value shopping for their recently upgraded pet food. As it turns out, 2014 brought out yet another new factor in Pet Food spending. For over 30 years Baby Boomers have been the leaders in the Pet Food, both in spending and in adopting new products. They still spend the most, but it turns out that the 25>34 year old Millennials led the movement to Super Premium in late 2014. The older groups, especially Boomers followed in 2015 and spending rose $5.4B. At the same time, the Pet Food spending of the 25>34 yr olds dropped. At first, we thought they had rolled back their upgrade. However, it turns out they were leading the way in another element of the trend to Super Premium – value shopping. The Boomers once again followed their lead and spending fell -$2.99B in 2016. For consumers, the Super Premium upgrade movement consisted of 3 stages:
- Trial – The consumer considers the benefits vs the high price and decides to try it out. Usually from a retail outlet.
- Commitment – After a period of time, the consumer is satisfied and is committed to the food.
- Value Shop – After commitment, the “driver” is to find a cheaper price! – The Internet, Mass Market, Private label
This brought us to 2017. Time for a new “must have” trend. That didn’t happen but the competitive pricing situation brought about another change. Recent food trends have been driven by the higher income and higher education demographics. However, the “value” of Super Premium was established and now more “available”. Blue Collar workers led a new wave of spending, +$4.6B, as Super Premium more deeply penetrated the market. After the big lift in 2017, 2018 started off slowly, +$0.25B. Then came the FDA warning on grain free dog food. Many of the recent Super Premium converts immediately rolled back their upgrade and spending fell -$2.51B. This 2018 decrease broke a 20 year spending pattern. In the 1st half of 2019, Pet Food spending remained stable at the new lower level. In the second half of 2019 we started to see a recovery from the overreaction to the FDA warning and spending increased by $2.3B. Then came 2020. The recovery was continuing but a new outside influence was added which had a massive impact on U.S. consumers – the COVID-19 pandemic. In March nonessential businesses were closed. This also produced a wave of panic buying in some truly essential product categories. In the Pet Industry there is only 1 truly essential category – Pet Food. Coupled with the FDA “recovery” and the ongoing movement to Super Premium, this produced an incredible $6.76B lift in Pet Food Spending in the 1st half of 2020. Spending fell in the 2nd half of 2020 and plummeted in the 1st half of 2021. Pet Parents didn’t binge again and some even began using up the stockpile that they panic bought in the early days of COVID.
Let’s look at Pet Food spending by the 2 most popular demographic measures – income & age group. They both show the current and previous 12 months $ as well as 2019 and 2020 yearend. This will allow you to track the spending changes between halves and to see where we started, in pre-pandemic yearend 2019. The first graph is Income, which has been shown to be the single most important factor in increased Pet Spending.
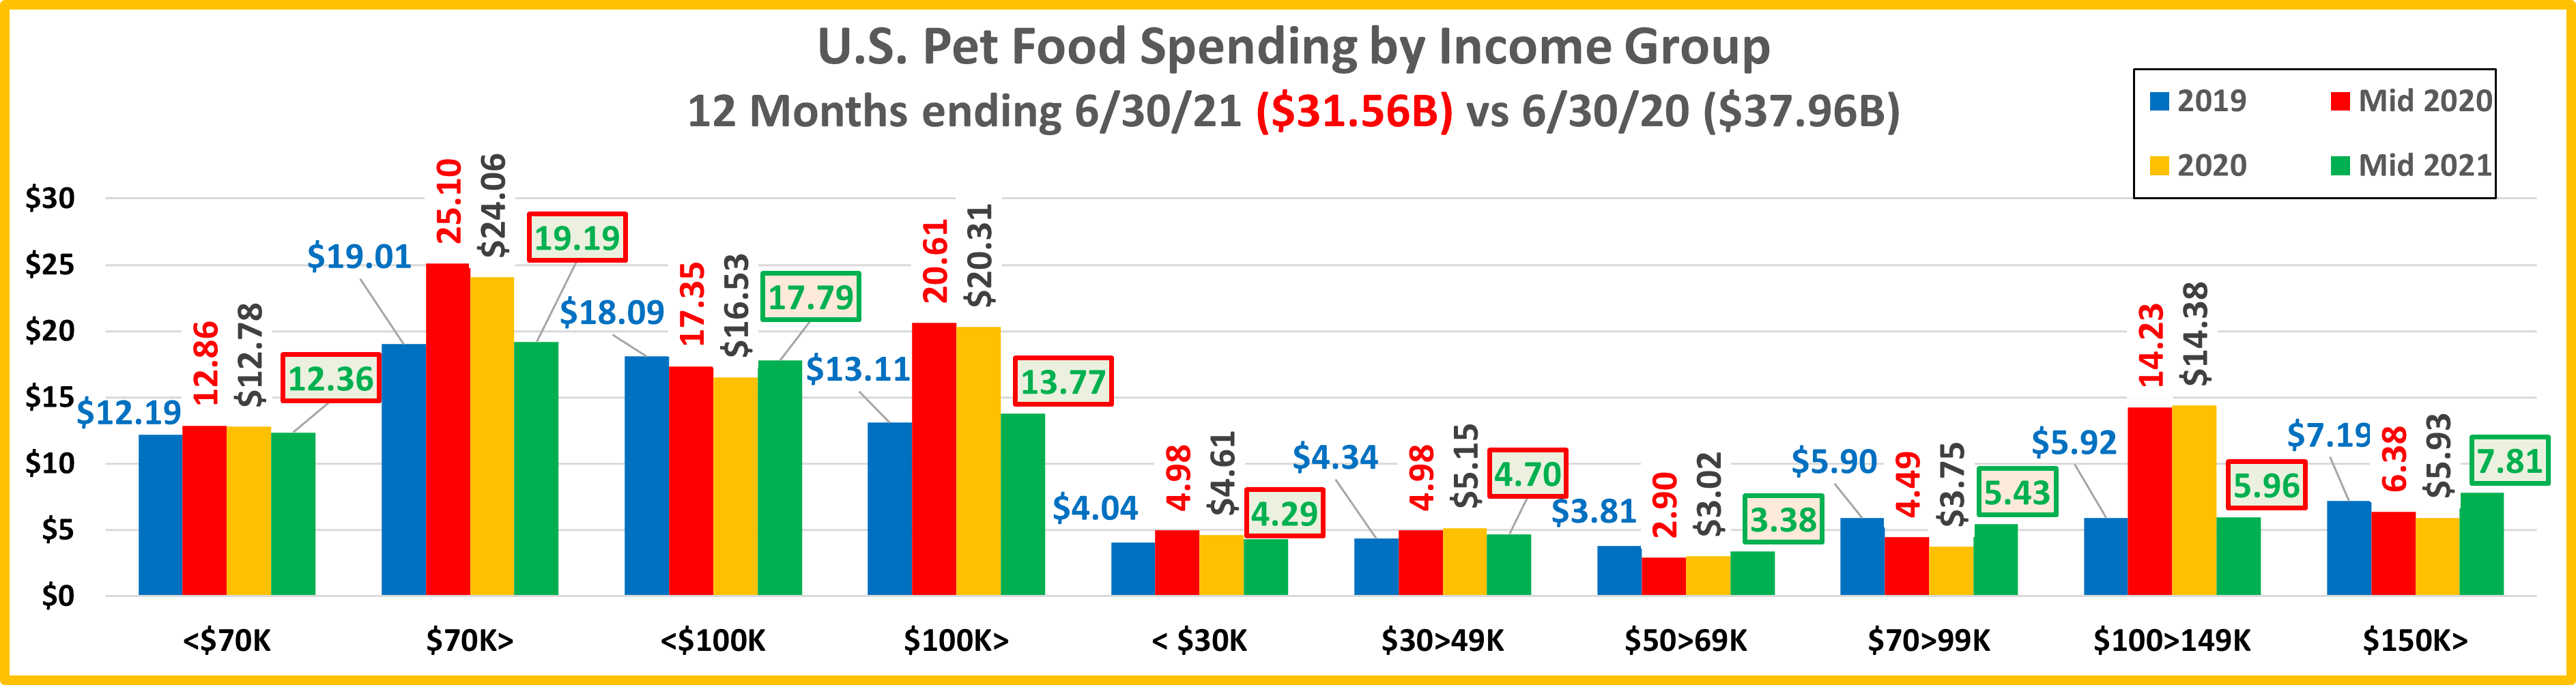
Here’s how you get the change for each half of the 20>21 mid-yr numbers using the under $100K group as an example:
- <$100K Mid-yr Total Spending Change: $17.79B – $17.35B = Up $0.44B (green outline = increase; red outline = decrease)
- 2nd half of 2020: Subtract Mid-20 ($17.35) from Total 2020 ($16.53B) = Spending was down $.82B in 2nd half of 2020.
- 1st half of 2021: Subtract Total 2020 ($16.53B) from Mid-21 ($17.79B) = Spending was up $1.26B in 1st half of 2021.
Note: The green/pink fill in the 20/21 numbers indicates if they are up/down vs Yearend 2019.
- We see 2 distinct spending patterns in the individual groups. The <$50K and the especially the $100>149K groups both binge bought Food in the pandemic so there was a steep spending drop in 2021. The middle income $50>99K and over $150K groups cut spending in the pandemic then began recovery in 2021.
- Perhaps the most obvious fact is the spending disparity due to income. Prior to the Super Premium era, $70K was the “halfway point” in Pet Food spending. In 2013 the under $70K group accounted for 67.8% of CUs and 51.3% of Pet Food spending. Due to the rise of Super Premium, they lost the lead in 2015 as $70K> spent 50.8% of Pet Food $. In 2020, the binge buying of Pet Food by $100>150K pushed the $100K> group to the top at 55.1%. Then the big drop in 2021 flipped $70K> back into the lead at 60.8%. The halfway point in Pet Food spending is still high but is again below $100K.
- < $70K > Surprisingly, the Pet Food spending patterns for both groups are the same, but the changes are more pronounced in the higher income group because they had the $ to finance more binge buying. Both show a 2020 COVID lift and a 2021 drop. Also, both groups returned to a spending level above 2019 yearend $.
- < $100K > The spending patterns of these 2 groups are different in every way. Spending for the <$100K group fell during 2020 then bounced back in 2021 but is slightly below 2019. The $100K> massively binge bought in 2020 so there was a huge decrease in the 1st half of 2021 but they still finished slightly ahead of 2019 $. Both are being driven by a pattern of one subgroup. For the <$100K group it is $50>99K income. For $100K> it is $100>149K.
- < $50K Both the <$30K and $30>49K have a pattern like the $100>149K but the binge buying was limited due to lower income. However, both did finish the 1st half of 2021 slightly ahead of 2019. While income is the most important factor in Pet Food Spending, it is not the only factor.
- $50 > $100K – This income group was the most negatively affected by the pandemic. Spending dropped in 2020 for both the $50>69K and $70>99K groups. They bounced back a little in 2021 but didn’t reach the 2019 level. They are under financial pressure in normal times. COVID undoubtedly made things even tougher. The drops and even the failure to return to 2019 $ were probably largely due to value shopping, especially on the internet. However, some CUs may have downgraded their Food. The biggest swings occurred in the middle income $70>99K group.
- $100K>149K – High income is increasingly becoming “where it’s at” in Pet Spending. In the 1st half of 2020 spending went through the roof. This group drove virtually all of the binge buying of Super Premium Foods. That also made them responsible for most of the current big drop. They did end up slightly above 2019 $.
- $150K > Their Pet Food spending also fell in 2020. It was most likely due to value shopping and moving to the internet as a primary source. Their spending came back strong in 2021, 10% above 2019. It’s likely that they broadened the range of food & treats purchased and may have upgraded to even more expensive food.
Now let’s look at Pet Food spending by Age Group.
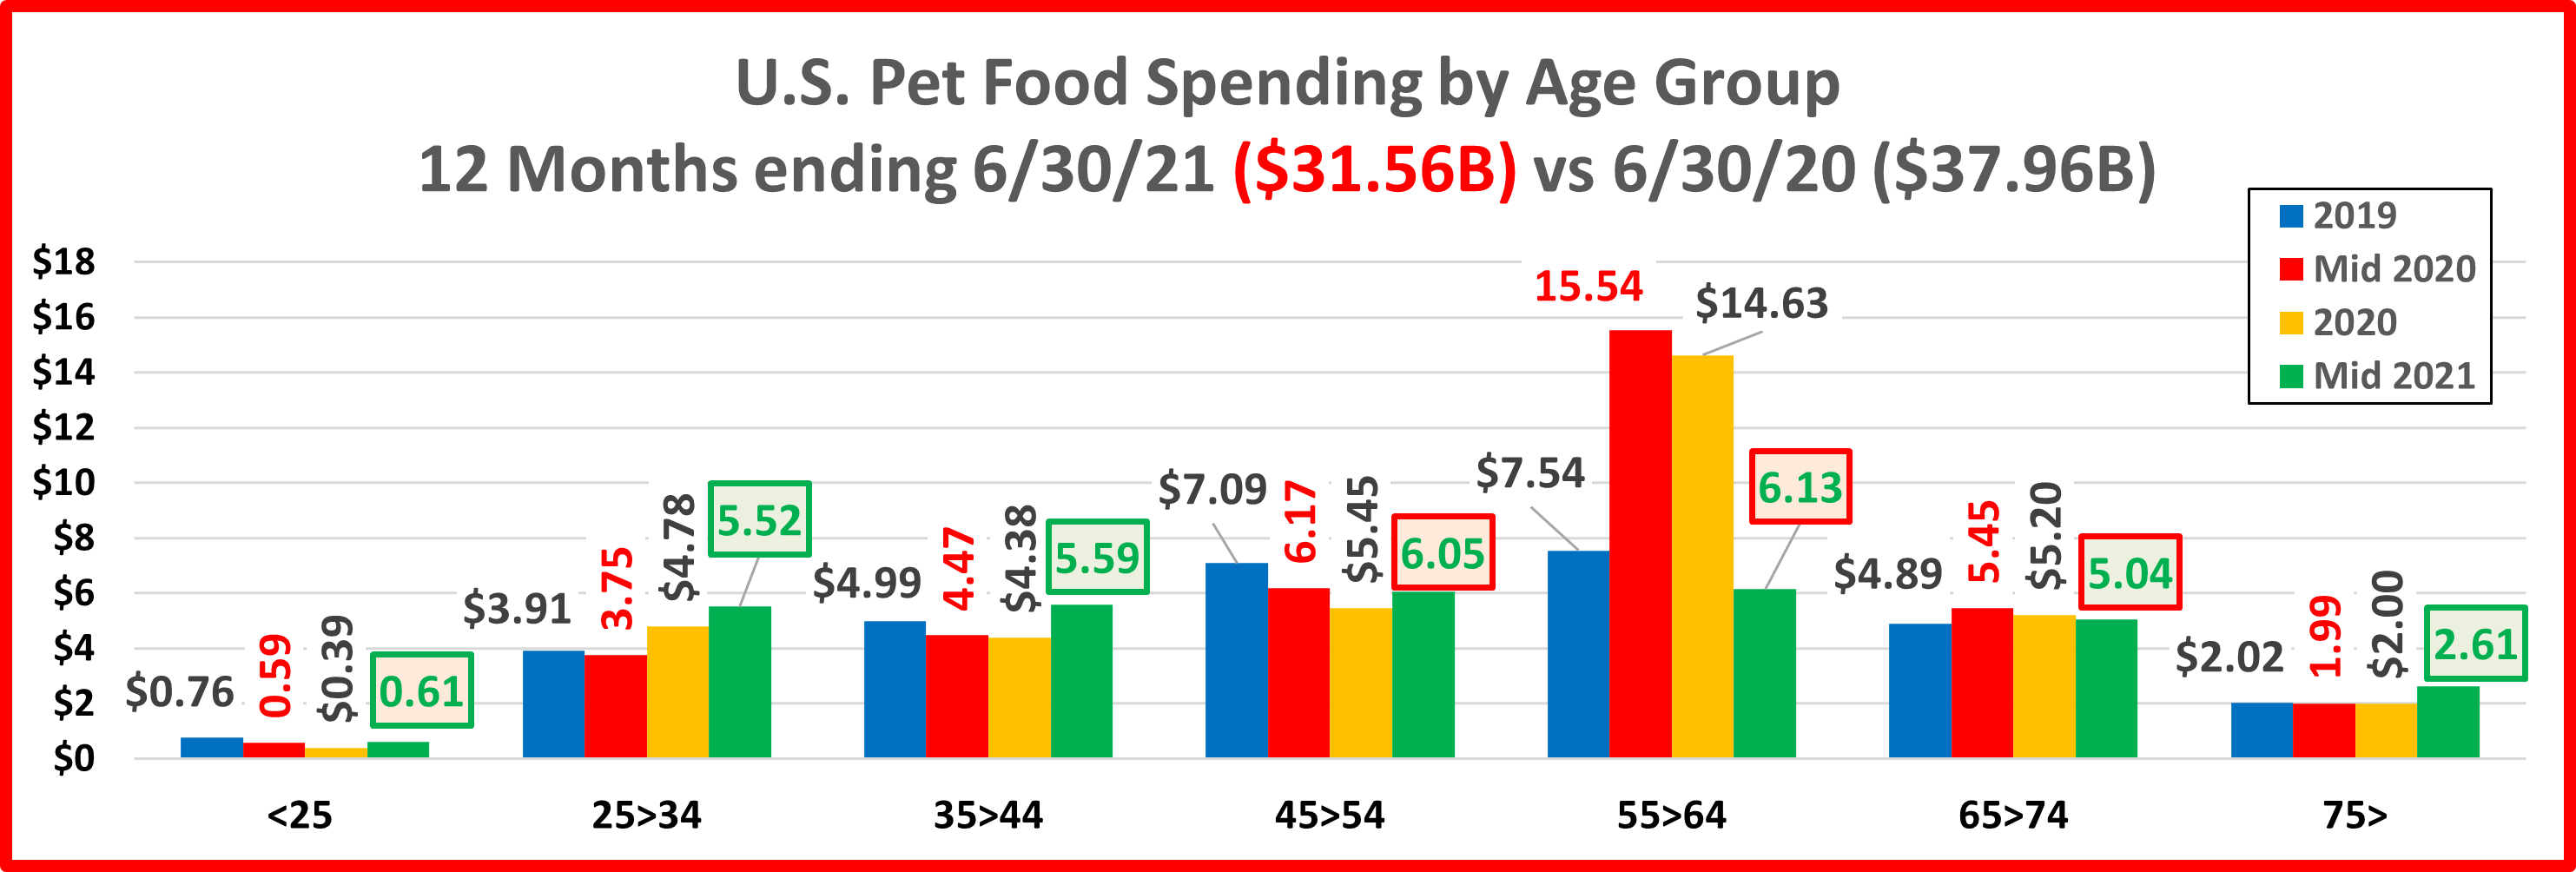
- Each group had a unique pattern but there is one basic difference. 55>74 binge bought Food. Everyone else didn’t.
- < 25 – Their spending fell in 2020 but then bounced back in 2021 but not to the 2019 level. The pandemic had a unique impact on them. The number of CUs fell by 2.1M in 2020 as many moved back home with their parents taking their pets with them. In 2021, 1.2M set up a separate H/H again but that’s still significantly less than pre-pandemic. Their movement also helped enhance the spending lift & drop by the 55>64 yr-olds.
- 25>34 – No binge buying. They value shopped but likely upgraded their food and even added pets to their family which produced the only steady growth since mid-year 2020.
- 35 > 44 – Their spending drop in 2020 was probably due to increased value shopping, especially on the internet. When things truly opened up in 2021, they opened their wallets and spending exceeded 2019 $ by 12%.
- 45 > 54 and – They have the highest income, so their spending pattern is somewhat unusual. Their Pet Food spending continued to drop throughout 2020. It turned up in 2021 but was still 15% below 2019. They are an unlikely group to downgrade. They probably focused on savings and convenience and turned to the internet.
- 55>64 – This group is mostly Boomers, the most emotional Pet Parents. Binge buying food was an emotional response to the pandemic. They have the highest income of any Boomer group so they had the will and means to drive the binge. The movement of their children to & from home also contributed. Ultimately, they are now down 19% from 2019.
- 65 > 74 – This group is mostly Boomers but with lower income. Their pattern has similar ups and downs to the 55>64 yr-olds but with far smaller swings. There is one difference. Their 2021 numbers exceed 2019.
- 75> – COVID had virtually no impact on spending. They are committed pet parents as they had a 30% $ lift over 2019.
That gives us the “big picture” for our 2021 Mid-year update of Pet Food spending. Now we’ll take a closer look at the start of 2021. However, rather than compare it to 1st half of 2020 to see the big negative swings, we’ll compare it to the 1st half of 2019 and document the biggest changes since then. This will show how close that we are to a “normal” year.
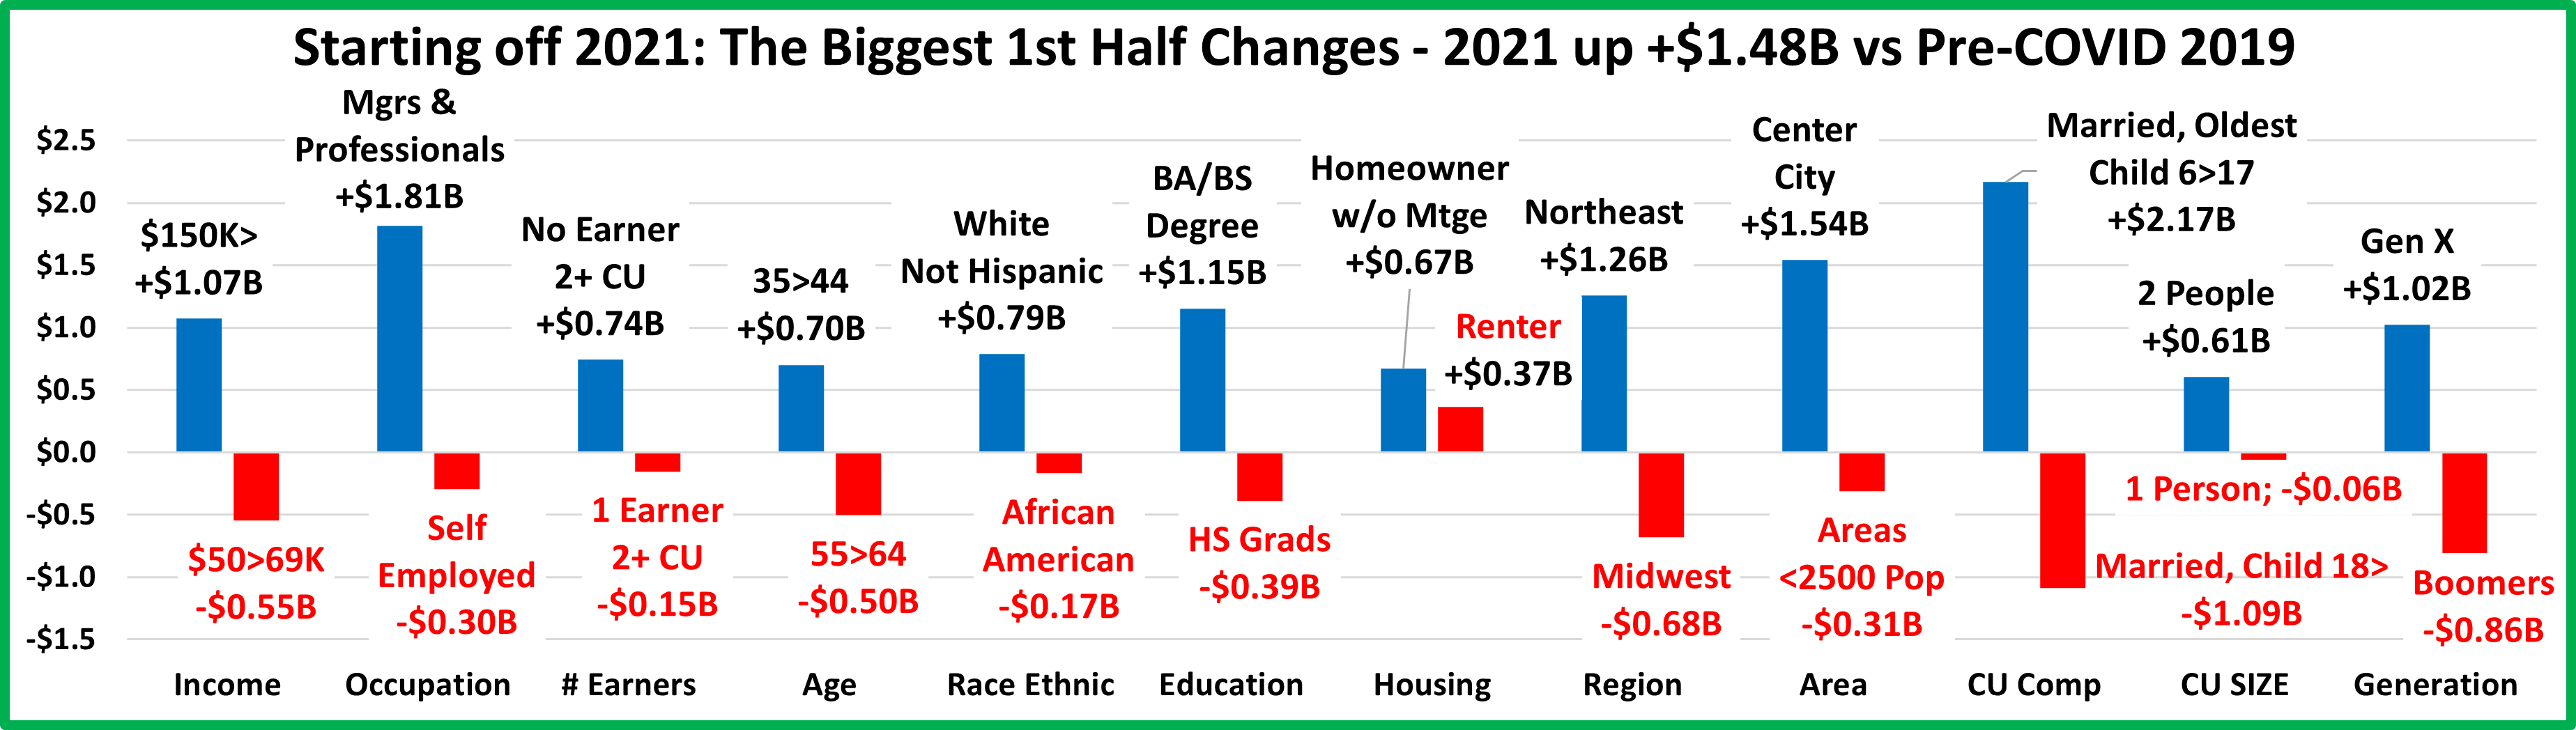
The first thing that you notice is that the biggest increases are generally much larger than the biggest increases. We should also note that all Housing segments spent more in 2021 than in 2019.
- There are a number of usual winners, like $150K>, Managers, White, Not Hispanic, BA/BS, 2 People and Gen X. There are also some surprises like No Earner 2+ CUs, Center City and the Northeast.
- When we look at the losers we see a few familiar names, African Americans, HS Grads & Singles. However, five of the big losers binge bought Food in 2020 so naturally they had a huge drop in 2021. They are Self-employed, 55>64, Areas <2500, Married, Oldest Child 18> and Boomers. They haven’t recovered as yet. Perhaps they will in the 2nd half.
- It’s a good sign that despite the 2 radical swings we are still $1.5B ahead of the time before the pandemic turmoil began in 2020 and continued into early 2021.
The spending drop was huge in the 1st half, but not unexpected. The huge lift in Pet Food $ in the 1st half of 2020 was an emotional reaction to the pandemic. The retail inventory of many “necessary” items like toilet paper and hand sanitizers was wiped out. Consumers wanted to ensure that they had them at home in case of supply chain issues. In the Pet Industry, there is no more necessary product than Pet Food. The lives of our Pet Children depend on it. With the widespread commitment to Super Premium Food, buying a safety stock produced a huge lift in $. It was clearly an emotional reaction. When it comes to emotion related to pets, there is one group that leads the way, Baby Boomers. In the 90s, they were the 1st group to be defined as Pet Parents and they have increasingly personified their Pet Children ever since. The huge lift was amplified by additional demographic factors. A high income of $100>149K drove the lift. The 55>64 yr-old Boomers have the highest income of their group. This gave them the means to buy the extra Food. Areas <2500 population generally have more pets but fewer retail outlets. This would increase their fear of product shortages. However, the pandemic increasingly came under control in 2021, bringing a desire to return to a new normal. No binge buying. Some began a return to more normal levels of backup, and many arranged regular deliveries. All of these contrbuted to the big drop in Pet Food spending in the 1st half of 2021. I expect a strong lift in the 2nd half. We’ll get the data in September.

