“Petflation” 2022 – February Update – Inflation Surges in All Segments
Inflation continues to make headlines. There have been year over year increases in the monthly Consumer Price Index (CPI) larger than we have seen in decades. Just recently it was announced that Food at Home (groceries) prices were up 8.6% over 2021, the biggest increase since 10.7% in 1981. This month’s huge increase is only in 4th place with 2nd place going to 1979, +13.9% and the top spot going to 1974, +22.3%. By the way, the average interest rate for a 30 year fixed rate mortgage in 1981 was 16.6%. As bad as things look right now, they can get much worse. As we have seen in recent years, even minor price fluctuations can affect consumer pet spending, especially in the more discretionary segments. With that in mind, we will initiate monthly reports to track petflation as it evolves in the marketplace.
Total Pet Products & Services prices were 4.1% higher in December 2021 than in December 2020. That’s high, but still much better than the overall CPI increase of 7.0%. We’ll start tracking 2022 in greater detail. Each report will include:
- A rolling 24 month tracking of the CPI for all pet segments and the national CPI. The base number will be pre-pandemic December 2019 in this and future reports, which will facilitate comparisons.
- Monthly comparisons of 22 vs 21 which will include Pet Segments and relevant Human spending categories. Plus
- CPI change from the previous month
- Inflation changes for recent years (20>21, 19>20, 18>19
- Total Inflation for the current month in 2022 vs 2019
- Average annual Year Over Year inflation rate from 2019 to 2022
- YTD comparisons
- YTD numbers for the monthly comparisons #2>4 above
In our first graph we will track the monthly change in prices for the 24 months from February 2020 to February 2022. We will use the December 2019 as a base number in this and future reports so we can track the progress from pre-pandemic times through an eventual recovery. Inflation is a complex issue. This chart is designed to give you a visual image of the flow of pricing. You can see the similarities and differences in patterns between segments and compare them to the overall U.S. CPI. The current numbers plus those from 12 and 24 months earlier are included as are the yr-end numbers for 2020 & 2021.This will give you some key waypoints for comparisons.

You immediately see a distinct difference in patterns between the 2 Services segments and the 2 Products segments. While there were some dips and differences, Veterinary and Services prices generally inflated during the whole 2-year period with an accelerated rate in 2021, a pattern similar to the overall CPI. Food and Supplies were generally deflated
below December 2019 prices until mid-year 2021. At that time, Food turned slowly up and Supplies returned to 2019 levels. In December inflation accelerated for all segments but Supplies, which turned sharply up in 2022. In the 1st two months of 2022 inflation rates continue to grow nationally and for all pet segments. Here are some things to note:
- U.S. CPI – The inflation rate was below 2% through 2020. It turned up in January 2021 and continued to grow stronger through February 2022. 87% of the overall 10.4% increase since 2019 occurred in the last 14 months.
- Pet Food – Prices stayed generally below December 2019 levels from April 2020 to September 2021, when they turned up. There was a sharp increase in December which has grown larger through February.
- Pet Supplies – Remember that Supplies prices were high in December 2019 due to the added tariffs. They had a “deflated” roller coaster ride until mid-2021 when they returned to December 2019 prices and essentially stayed there until 2022 when they turned sharply up reaching a new all-time pricing high in January, then again in February, breaking the old record which was set way back in September 2009.
- Pet Services – A normal inflation rate is about 2+%. Despite or maybe because of closures, price increased at a lower rate in 2020. In 2021 consumer demand increased but there were fewer outlets. Prices increased strongly in 2021 with the biggest lifts coming in the 2nd and 4th In 2022, inflation has grown even stronger.
- Veterinary – Inflation has always been something that you can count on in Veterinary Services. Prices were flat in February 2020 (amazing) but began moving up in March and grew consistently through the 2021 recovery. A pricing surge that started in December allowed them to beat the overall CPI with an inflation rate of +10.8%.
- Total Pet – You can see that the blending of the segment patterns made the Pet Industry look very price calm compared to the overall market. That ended in December 2021 as prices surged up in all segments.
Next, we’ll turn our attention to the headlines, which largely focus on the Year over Year inflation rate change for the month. We’ll do a little “catch up” as this report will show comparisons for both January and February. We’re also going to look a little deeper to see how the recent numbers compare to the past, including:
- Vs last month
- 21>22
- 20>21
- 19>20
- 18>19
- Tot 19>22
- Avg 19>22
We also included some “human” categories that can be compared to a pet segment. First, a look at January!

The inflation rate from January 2021 was large and growing significantly for all pet segments. We should also note that it is getting significantly worse as prices were up over 1% from December for 6 of 9 categories.
- U.S. CPI – Through the pandemic and early recovery, inflation remained at or near normal levels. In 2021 and now 2022, inflation accelerated, resulting in increases not seen in decades.
- Pet Food – Inflation is the lowest in this segment and only about 1/3 the rate of human groceries. Note the every other year up/down pattern. Because of the size of the Food segment, you see a similar pattern in Total Pet. The 2.7% lift is small vs 2021 but it is larger because it is going against deflated numbers in 2021.
- Food at Home – You can see the low pre-pandemic inflation rate (normal) which turned sharply up in the pandemic and continues to accelerate. It is now 10 times higher than “normal”. It is largely being driven by shortages due to supply chain problems.
- Pet Supplies – Prices surged in January to a new all-time record high. (beating Sept 2009). However, we should put this increase into perspective as it comes vs a period of strong deflation
- Veterinary – Veterinary inflation had slowed before the pandemic, but it returned to more normal high levels. It is high and growing so much that the increase since 2019 is 27% greater than that of the national CPI.
- Medical Services – Inflation spiked in 2020 but has returned to a more normal rate, well below Veterinary.
- Pet Services – With closures and consumers’ DIY attitude in the pandemic, demand slowed as did inflation. That ended in 2021 as prices started up again. In January, the price increase vs 2021 was the biggest of any pet segment.
- Haircuts & Personal Services – Inflation was consistent pre-pandemic. It has grown about 50% in 2021 and 2022.
- Total Pet – Pre-pandemic, Total Pet inflation was above the national average. The deflation in the products segments drove the inflation rate for Total Pet down. However, all segments have now turned sharply up so the inflation rate is 4 times higher than it was just 1 year ago.
We have seen that prices increased strongly in January vs December producing year over year numbers that are now concerning in the Pet Industry as well as the overall market. Let’s look at February.
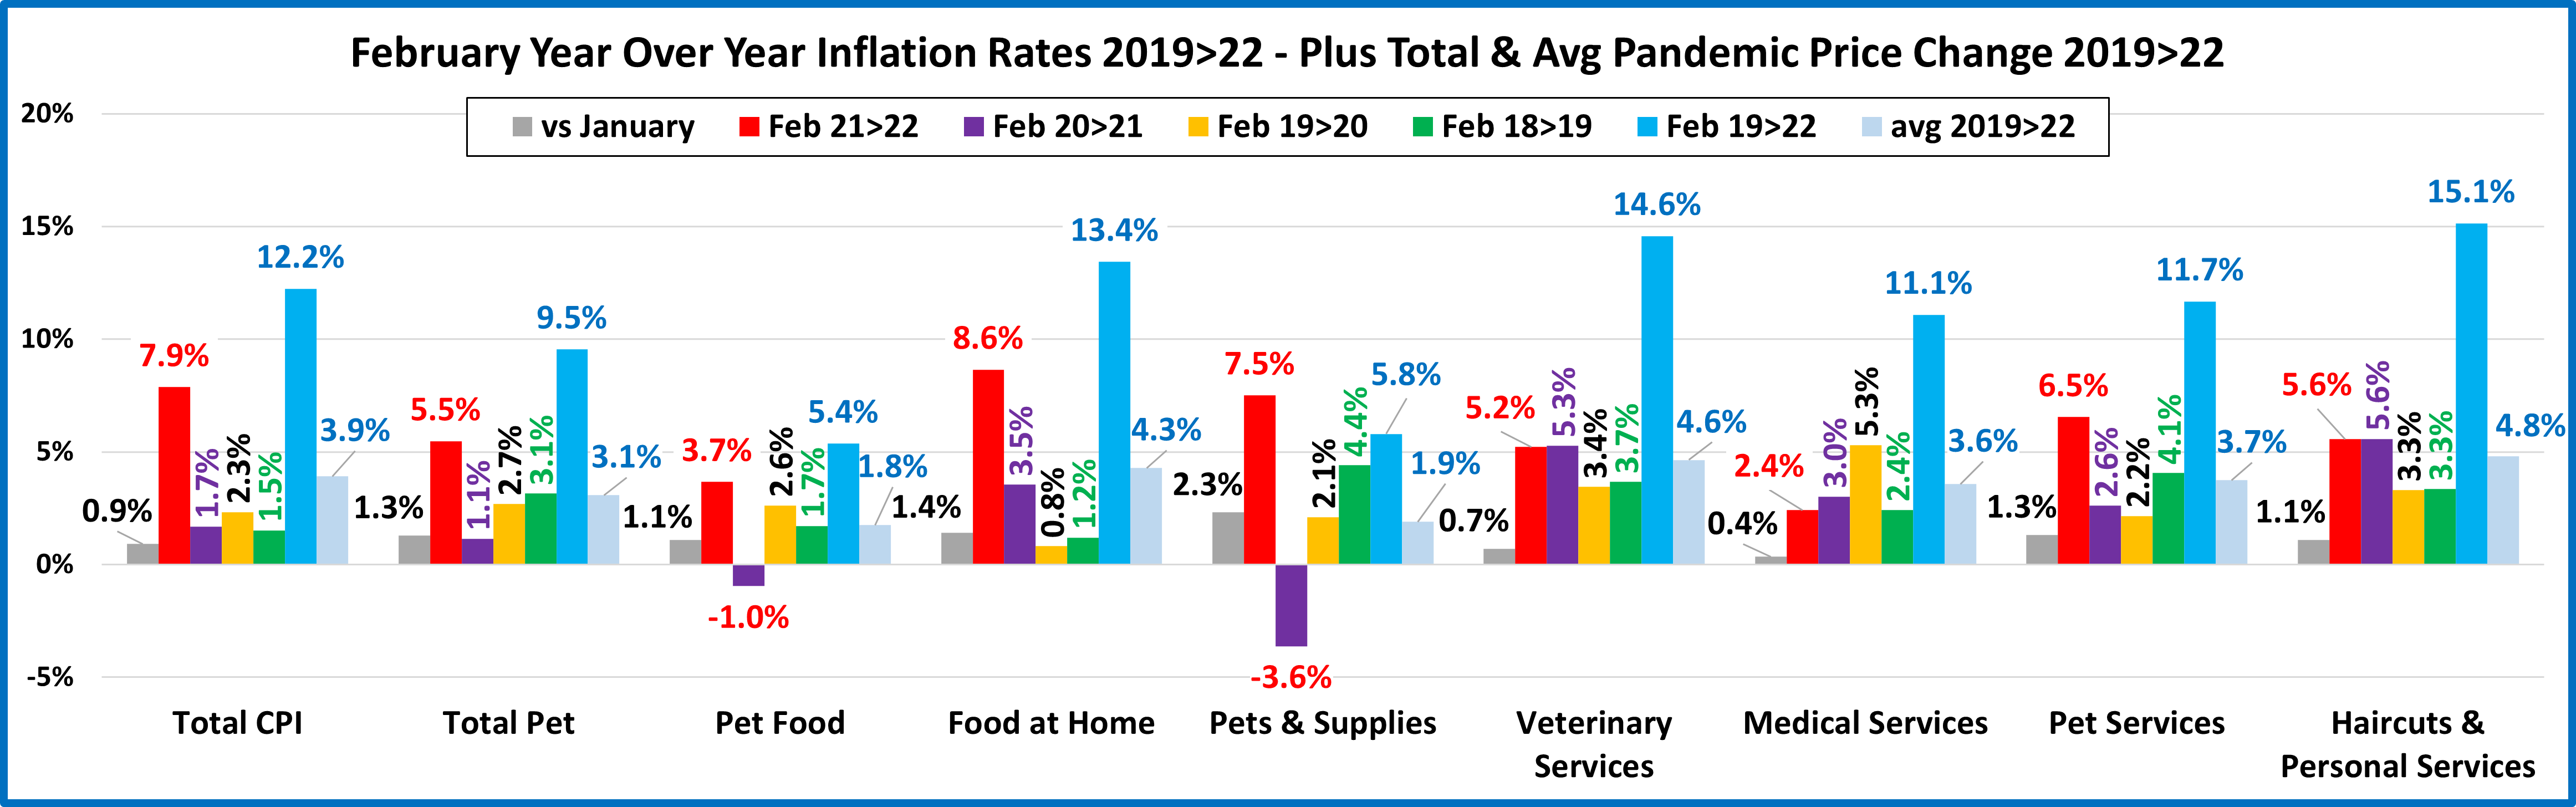
As you can see, a bad situation in January, got even worse in February. Prices vs February 2021 were up 7.9% overall with the Grocery increase being the largest since 1981. Again 6 of 9 categories had price increases over 1% from last month, and the increases were generally larger than the January over December increases.
- U.S. CPI – Prices are up 0.9% since January. The targeted inflation rate is less than 2%. In February, prices were up 7.9%, basically 4 times higher than the “targeted” rate.
- Pet Food – Prices are up 1.1% vs January and 3.7% vs February 2021. Granted, they are being measured against a deflationary year, but that increase is more than double the pre-pandemic increase from 2018 to 2019.
- Food at Home – As we said earlier, the year over year increase in February is the largest since 10.7% in 1981 but only 40% of the 22.3% increase in 1974. Things are bad but could get a lot worse. The inflation for this category since 2019 has now increased 10% more than the national CPI.
- Pets & Supplies – Prices were up 2.3% from their record in January, setting a new record. February prices are being compared to deflated prices in 2021 but the increase is still high, only trailing Food at Home and the national CPI.
- Veterinary Services – February 2020 was still pre-pandemic. You can see that inflation then was at more normal levels, about twice the national CPI. It then increased to a new higher level and stayed there. However, in February it fell to 2nd place in the overall increase since 2019 as it now trails Haircuts and Other Personal services.
- Medical Services – Prices sharply increased in pre-pandemic February 2020 but then inflation slowed and has returned to a more normal rate in 2020. Prices were up 0.4% from January, the smallest increase for any category.
- Pet Services – While inflation slowed during the pandemic and early recovery, it is spiking now – Up 1.3% from January and 6.5% from 2021, the biggest increase in history and almost triple the rate of the previous 2 years.
- Haircuts & Other Personal Services – This category is obviously important to consumers and they will pay the price.
- Total Pet – The inflation rate is getting larger and is now 5 times the rate of last year. Only Food is keeping it down as it gets closer to the national CPI rate of increase. Inflation has caused problems in the past by reducing the frequency of purchase in Supplies, Services and Veterinary. Super Premium Food is generally immune as consumers are used to paying big bucks and it is needed every day. We’ll see if consumers are still willing to pay the higher prices for more discretionary products and services at the same frequency as they did in the past.
Now we’ll use the same chart format to look at Year to Date numbers – what does January + February add up to and how does 2022 compare to previous years…so far?

The strong current increase in inflation seen in January and February is reflected in YTD numbers. The increase from 2021 to 2022 is the biggest for 7 of 9 categories. The average annual increase since 2019 is over 3% for all but Pet Food & Pet Supplies. This is due to deflation in 2021.
- U.S. CPI – The current increase is double the average increase from 2019>2022, but over 4 times the average increase from 2018>2021. Inflation is a big problem that started recently.
- Pet Food – Inflation is growing stronger, especially after deflation in 2021.
- Food at Home – Thanks to February, the 2022 YTD increase in prices surpassed that of the overall CPI. You can clearly see how supply chain issues have grown more impactful on prices.
- Pets & Pet Supplies – Prices have strongly turned up since the beginning of the year, breaking their all-time record set 13 years earlier. Although this year’s increase is being measured against a deflationary 2021, it is very significant and in 3rd place, trailing only Food at Home and the national CPI.
- Veterinary Services – This chart clearly shows that the inflation rate has consistently grown each year throughout the pandemic and recovery. Regardless of the circumstances, just charge more.
- Medical Services – Prices went up significantly just before the pandemic, but the rate has slowed since and is now essentially returned to pre-pandemic levels.
- Pet Services – February 2022 was the largest year over year monthly increase in history and now has helped produce a YTD increase that is 2nd only to 6.6% in 2009. Demand has grown for Pet Services while the availability has decreased, a formula for inflation.
- Haircuts & Personal Services – The services segments, essential and non-essential were hit hardest by the pandemic. Now as consumers move closer to their normal patterns of spending, the segment is not prepared so the increased demand is driving prices up at an astounding rate.
- Total Pet – When we first looked at the pandemic impact on Petflation. We saw basically two different patterns. Prices in the Services segments continued to increase, and the rate accelerated as we moved into 2021. The product segments – Food and Supplies, were on a different path. They generally deflated in 2020 and didn’t return to 2019 levels until mid-year 2021. Food prices began a slow increase, but Supplies remained stable until we neared yearend. In 2022, everything changed as Food and Supplies prices turned sharply up. Supplies had the biggest YTD increase of any segment. This change in Products, in conjunction with the strong inflation rate in both Services segments has pushed Total Petflation ever closer to the extraordinarily high rates in the overall market.
Inflation is radically increasing in the Pet Industry. Will it impact spending? Let’s put it into perspective. The 4.9% YTD increase in Total Pet is far below the 10.3% record set in 2009 but over 3 times larger than the 1.5% average since then.
Although pet spending is increasingly moving to higher income groups, the impact of inflation varies by segment. Supplies has been impacted the most. Many categories are commoditized and very price sensitive. The move to high priced Super Premium Food has become widespread because the perceived value has grown so higher prices just push people to value shop. Veterinary prices have strongly inflated for years. The result has been a reduction in visit frequency. Spending in the Services segment has taken off in recent years, but it is driven by higher incomes because of its convenience so inflation is less impactful. We’ll continue to monitor the situation but we’ll just have to wait and see the impact of the latest surge in Petflation.

