Inflation: A Historic Look – 1992 > 2022
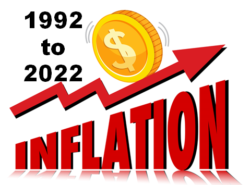
There is no doubt that the current inflation wave is big news with rates higher than we have seen in decades. Through a series of graphs, we hope to put the current situation into a better perspective. We will track the change in CPI of a few key, major expenditure groups over the last 30 years – from 1992 to 2022, then show the evolving impact on Total Retail and a major Pet Relevant channel. In our 1st chart we will compare the CPI change of the 2 biggest groups – Commodities and Services so that we can better appreciate their influence on the National CPI.
We will show the specifics for certain years including: every 10 years, the great recession, and the pandemic. There are also some data highlights: light blue = deflation, red = the highest annual inflation rate; pink = 2nd highest rate; yellow = 3rd highest rate.
In what may be a surprise to many of you, the Services segment leads the way in Inflation. They also have the biggest share of the CPI index, 60%, + or minus 4%, every year from 1992 to 2022. We should note that mortgage payments/rent (a service expenditure) accounts for 1/3 of the total CPI number. This is major part of the budget for most households, but changes occur less frequently since the price is generally determined by mortgages or leases.
- Services – There were no deflationary years for Services. Prices just kept increasing. They had doubled by 2017 (25 yrs) and had increased by 139% in 2022, which produced an annual average inflation rate of +2.9%. The 3 biggest increases occurred in: 2022 = +6.2% (No surprise); 2001 = +4.1%; 2006 = 3.8%. Inflation did slow a little during the great recession 2009>11 and actually fell below 1% to +0.8% in 2010. We have a similar pattern for Services in the Pet Industry. The CPI for Veterinary and Non-Vet Services has been tracked since 1997. Prices for both segments have increased every year but at a higher rate than for National Services. Non-Vet Services = +3.3%; Veterinary = +4.7%.
- Commodities – These are products. They have a wide range – from Food at Restaurants to gasoline to groceries. You can see that the pricing is much more volatile for this group. They have increased by 71% since 1992 for an annual average increase of +1.8%, 38% below Services. Prices have also deflated in 5 years, with the biggest drop -3.3% in 2015. The second biggest drop, -2.9% occurred in 2009 in the heart of the Great Recession, but they quickly recovered. A very significant trend started in 2013 as prices stabilized then fell in 2015. They essentially remained at this lower level until the beginning of the Pandemic Pricing surge in 2021. This surge produced the 2 highest annual inflation rates for this group: 2022 = +10.9%; 2021 = +7.8%.
- National CPI – In 2022, prices reached double the level of 1992, with an average annual inflation rate of +2.5%. While inflation in Commodities segments, like Groceries and Gasoline get far more publicity, the Services group has slightly more influence over the National numbers. However, big changes in any large segment, like Gasoline or Groceries can definitely have an impact. The size and consistent inflation of Services has driven the National CPI up every year but 2009, -0.4%. The 2 biggest increases occurred in 2022 = +8.0%; 2021 = +4.7%. However, because of the frequency of purchases, inflation in Commodities is more noticeable. Let’s take a closer look.
The next graph compares 30 years of Commodity inflation to one of its subcategories – Pet Products. While the CPIs for individual Pet Industry Segments have only been tracked since 1997, the pricing of Pet Products (Pets, Food & Supplies) has been recorded since 1977. The US BLS recognized that Pets were an important part of U.S. Households long before there were any major Pet chains, SuperStores or even “Pet Parents”. Remember, in 1992 and earlier most pet products were purchased in Grocery stores. According to the Economic Census, this didn’t change until 1997.

As you can see the inflation patterns for Commodities and Pet Products were basically the same until 2008. Both turned up in 2008, but the Pet Products lift was the biggest single year increase from 1992>22 for Pet Products, +9.19%. This was followed by a +7.2% increase in 2009. Prices rose 17% in 2 years. In reaction to the Recession, Commodities prices fell -2.9% in 2009 and Pet Products fell -1.0% in 2010. Both recovered quickly and prices essentially flattened out for Commodities until 2021 and Pet Products until 2022. There was some minor turmoil as most of the deflationary years for both occurred during this “flat” period – Pet Products (4 of 6) and Commodities (3 of 5). For both the highest inflation occurred in 2022 – Pet Products (+9.18%) and Commodities (+10.9%). Commodities prices increased +19.6% from 2020 to 2022. While Pet Products still has the bigger cumulative increase at +74%, Commodities, at 71%, significantly narrowed the gap. Except for the timing of their big 2 year “lift” these 2 groups have a very similar pricing pattern.
Now let’s look at the impact of inflation on sales. Price Inflation can reduce the amount of product sold. At the very least it reduces the “real” amount of a sales increase. Consumers get less for their money. In our next graph we will track the sales for Total Retail from 1992 to 2022. We will factor inflation into the numbers to show the “real” increase in product sold over the years. We are using the All Commodities CPI in our calculations. It’s an accurate representation. The Census Bureau defines a retail outlet as one whose primary business is the sale of products to consumers. This ranges from restaurants to gas stations to department stores. Note: The outlet may also sell services but not a significant amount.

Actual Total Retail Sales quadrupled in 30 years from $2T to 8T. There were only 2 years when they declined 2008 & 2009, which was due to the onset of the Great Recession (Pink highlights). The market recovered in 2011. It took a total of 4 years to get back to 2007 Sales numbers. (Black Outline). It took 13 years for sales to double from $2T to $4T and another 13 to reach $6T. However, the Pandemic Recovery in 2021 & 2022 pushed the market from $6T to $8T in just 4 years. $1.9T of the lift occurred from 2020>2022 with $1.2T occurring in 2021 and $0.7T in 2022. These are the 2 largest annual increases from 1992>22. The average annual increase for Total Retail $ over 30 years was +4.8%.
The Commodities CPI increased by 71% in 30 years, an average annual inflation rate of +1.8%. Prices deflated in 5 years with the biggest drop, -3.3% occurring in 2015. The biggest lifts prior to the Pandemic period occurred in 2008, +4.3% and 2011, +5.3%. After the 2011 increase prices remained close to the +45% cumulative level until the big lifts in 2021 (+7.8%) and 2022 (+10.9%). Commodity Prices rose 19.6% in just 2 years. The biggest prior 2 year increase was +8.3% in 2010>11. The current lift is more than twice as large and must impact retail sales.
“Real” Total Retail Sales increased 136% from 1992 to 2022, an average annual increase of 2.9%. They declined in 3 years. The 2008 & 2009 declines mirrored the drops in Actual Sales but 2022 was different. Due to +10.9% inflation, Cumulative real sales declined despite a +9.1% increase in actual sales. There are other examples of the impact of inflation. Actual Sales recovered from the 2008>09 drops in 4 years. For real sales it took 2 years longer. Also, Actual Sales doubled in 13 years. It took 25 years for Real Sales. Finally, the goal is to always have over 50% of the cumulative actual sales increase to be real. This was true in Total Retail for 25 of 30 years. The percentage was below 50% from 2011>14 but hit bottom at 45% in 2022. Real sales is a measure of the amount of product sold. High inflation can negatively affect consumer spending. At first, they spend more but get less. If it continues, it can lead to a drop in spending.
Now, we’ll turn to the data that you’ve all been waiting for – the impact of Pet Products inflation on Pet Store Sales.

As you can see, this graph is different from the others. The primary reason is that monthly and annual sales data for Pet Store $ales is still not reported by the Census Bureau even though their own numbers from the Economic Census show that Pet Store sales exceed the amount sold by at least 6 other channels that are reported monthly. The data reported is from the Economic Census which occurs every 5 years. We will have the 2022 numbers in the Fall of 2024. To give you a 30 year look I gathered data going back to 1987. The data is plotted by Total Sales $ for the reporting years rather than by % of increase from 1987. The Real Sales $ were computed by factoring in cumulative Pet Products inflation from 1987. The US BLS has been gathering this CPI data monthly since 1977. This is a good CPI match as even with the growth of Services, Pets & Pet Products accounted for 93+% of Pet Store Sales in 2017, according to the Economic Census. The % shown next to the “real” $ reflects the amount of the Actual cumulative $ increase that is real.
The growth is beyond spectacular. From 1987 to 2017, Actual $ales increased by $17B, (1250%) with an average annual increase of +9.1%. This spectacular growth was due to a number of factors – the creation and growth of Pet Chains and SuperStores, the transition from Pet Owners to Pet Parents, Baby Boomers moving into their higher income years and the increasing personalization of our Pet Children. Real Sales growth was +9B, (660%) with an annual growth rate of +7.0% – still amazing! About the only negative to be found is in the definite drop in the percentage of actual growth that is real. In the 90s it was above 70%. It fell into the 60+% range at the start of the Millennium but since 2012 it has dropped into the low 50s. This was primarily driven by extreme inflation from 2006>09, +21%. Prices deflated -1.2% from 2012>17 which caused the slight increase in % so there is no doubt that inflation has a real retail impact. That leaves us to wonder what will happen in 2022. We already know the CPI facts. Pet Product Prices only increased +3.8% from 2017>21 but then jumped +9.2% in 2022 and are now double what they were in 1987. We look forward to getting the Sales data. A first “peak” will come from the mid-year 2022 Consumer Expenditure Survey which will be released shortly.

