2021 U.S. VETERINARY SERVICES SPENDING $32.67B…UP ↑$7.82B
Veterinary Services is the 2nd largest segment in the Pet Industry. For years, high inflation has been a problem in the segment. Spending grew 24.0% from 2014>2019. Prices rose 17.4%, an avg of 3.3%. This caused a reduction of visit frequency and only 28% of the growth was “real” (avg annual growth +1.3%). In late 2020 & 2021, COVID focused Pet Parents on their “children’s” needs, including Veterinary Services. In 2021 Veterinary Spending reached $32.67B, up $7.82B (+31.5%) from 2020. Inflation was high at 4.2% but 87% of the growth was real. In this report, we’ll take a closer look at the demographics behind the 2021 numbers. (Note: All 2021 numbers in this report come from or are calculated by using data from the US BLS Consumer Expenditure Interview Survey, rather than their Diary report. The low frequency of Veterinary Visits is still generating an exceptionally high variation on the data collected by the Diary method. Interview seems to be a more logical and accurate way to track Veterinary Service Expenditures.)
Let’s get started. Veterinary Spending per CU in 2021 was $244.51 up 29.1% from $189.35 in 2020. (Note: A 2021 Pet CU (68%) Spent $359.57) More specifically, the increase in Veterinary spending came as a result of:
- 1.8% more CU’s
- Spending 11.9% more $
- 15.4% more often
We’ll take a closer look. But first, the chart below gives an overview of recent Veterinary Spending.
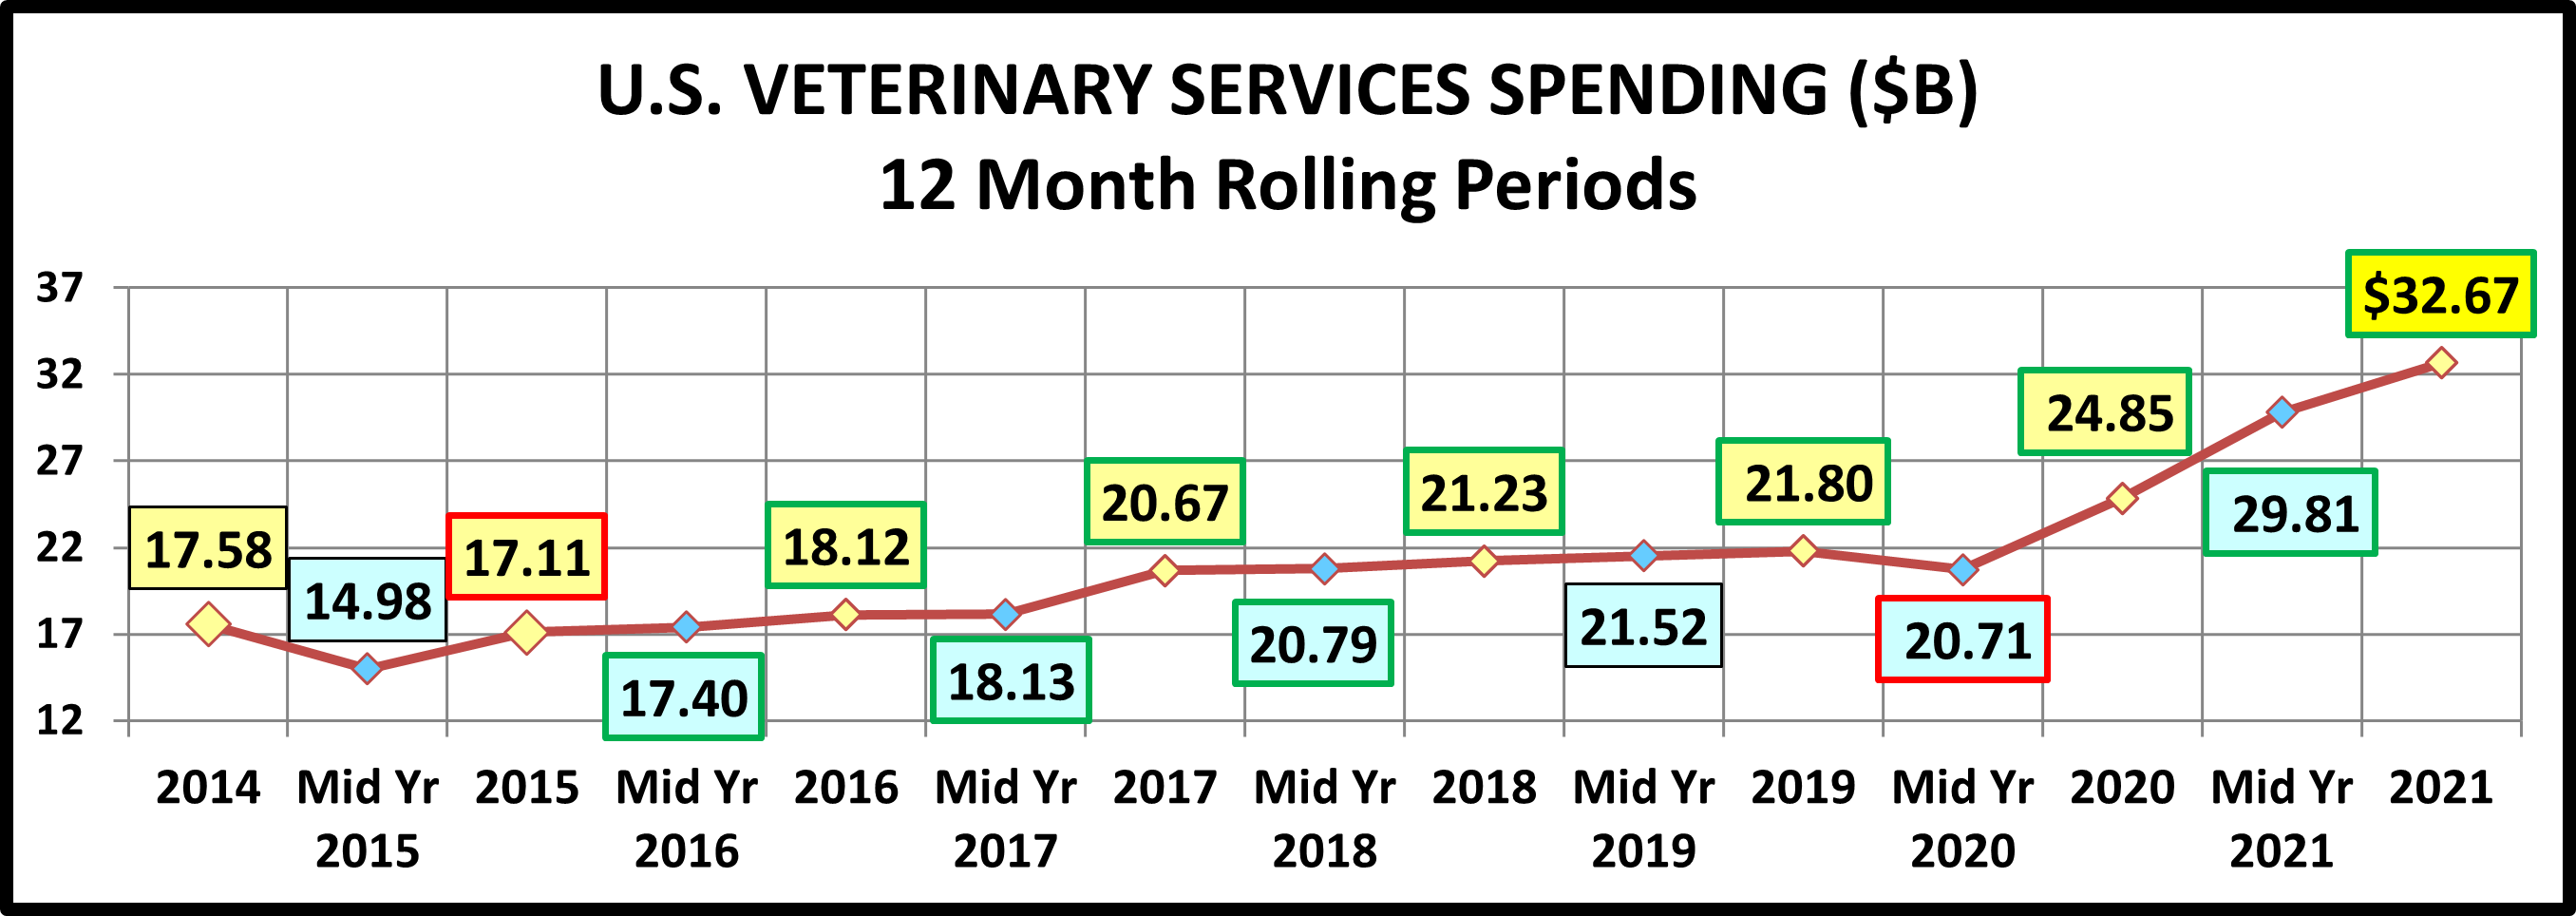
The big drop in the first half of 2015 coincided with the upgrade to Super Premium Foods – Trading $. Then consumers began value shopping for Premium Foods and the savings freed up $ for Veterinary Services. Spending began to climb until it flattened out at the beginning of 2017. In 2017, inflation slowed markedly in the second half and spending took off. In 2018 prices turned up again and consumers essentially held their ground through 2019. The initial reaction to COVID in 2020 was a drop in spending but the “need focused” consumers then drove a huge increase through 2021.
Now, let’s look at Veterinary spending by some specific demographics. First, here is a chart by Income Group
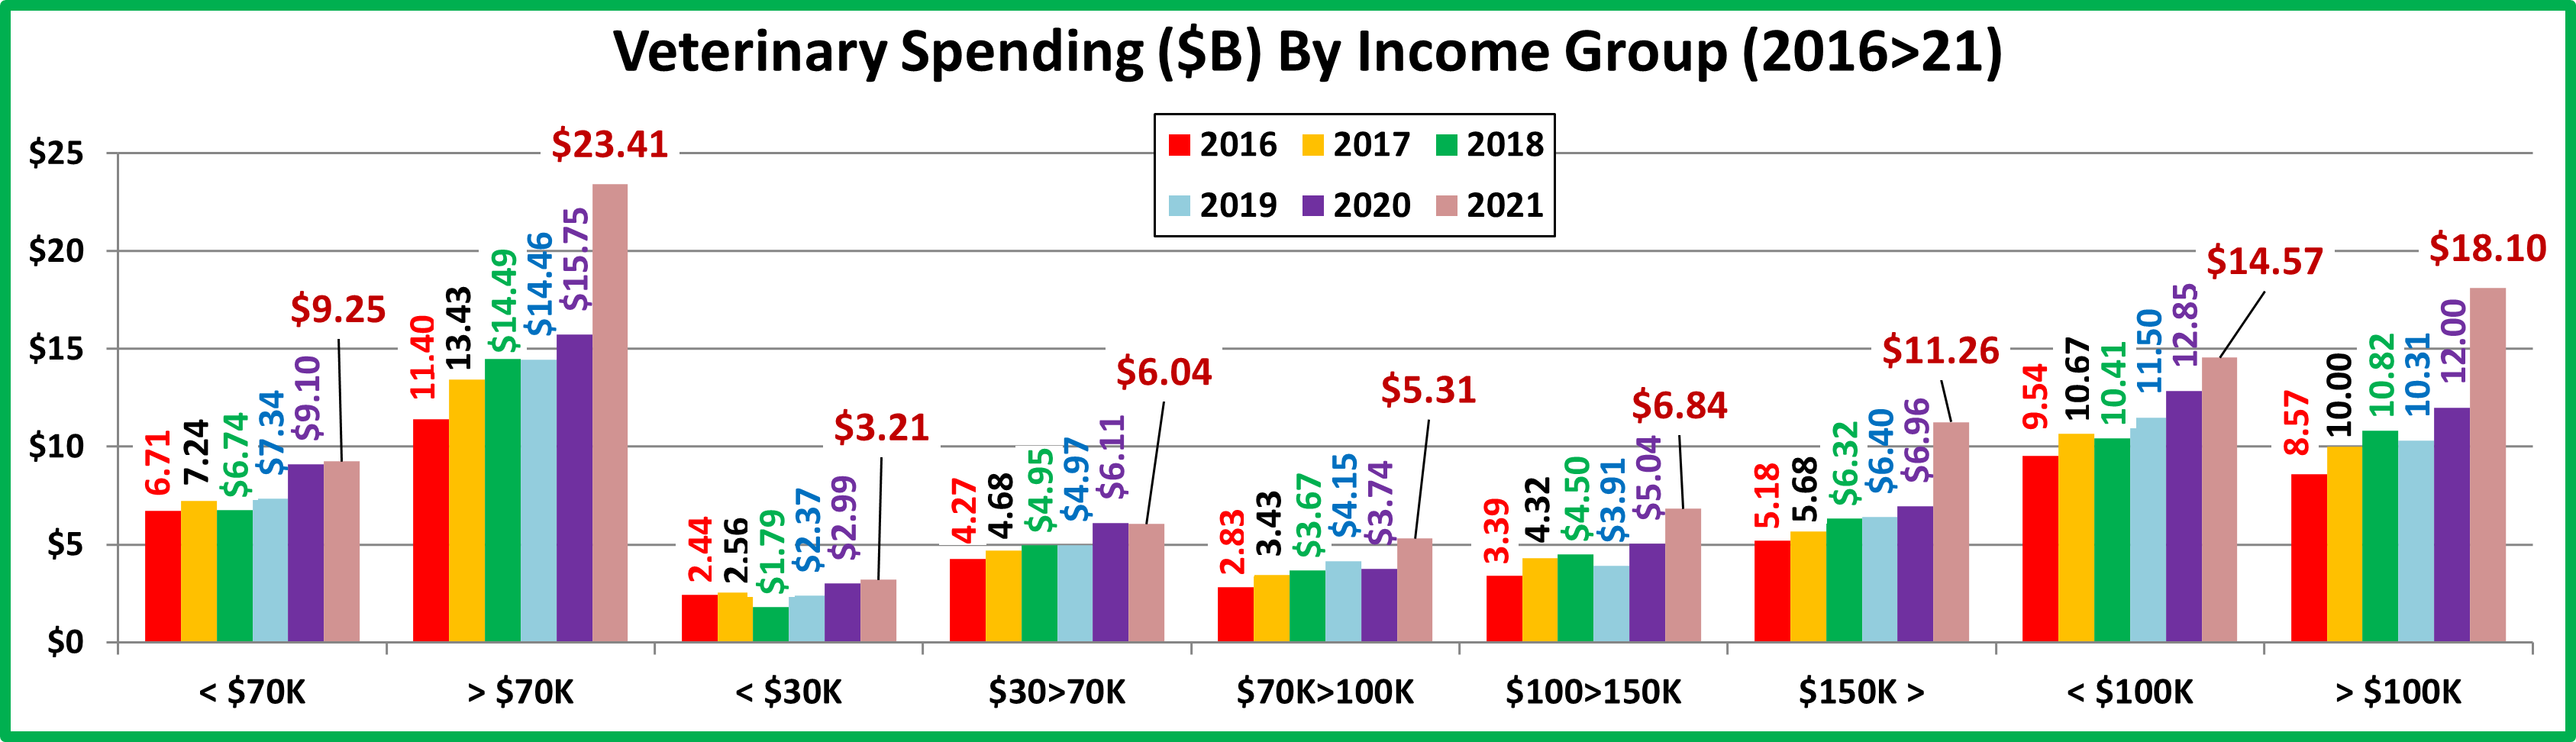
Veterinary Spending has become even more strongly driven by income. Spending by the <$70 group was essentially flat and $30>70K actually spent less. By far the biggest lift, +$4.3B, came from $150K> group. The 50/50 spending break point in $ also grew significantly from $96K in 2020 to $113K in 2021, an 18% increase.
National: $244.51 per CU (+29.1%) – $32.67B – Up $7.82B (+31.5%)
- Over $150K (15.8% of CUs) – $534.38/CU (+42.3%) $11.26B, Up $4.30B (+61.8%) This highest income group is the biggest Veterinary Spender as 15.8% of CUs generated 34.5% of 2021 $ and 55% of the increase from 2020.
- $100>150K (14.2% of CUs) – $360.90/CU (+34.9%) $6.84B, Up $1.80B (+35.6%) Spending by this middle/upper income group slowed in 2019 due to inflation, but it took off in 2020>21 as they reacted strongly to their pet needs.
- $70K>100K (14.8% of CUs) – $268.25/CU (+41.0%) $5.31B, Up $1.57B (+41.9%) Spending grew steadily from 2016>19. In 2020 pandemic monetary pressures caused them to spend less but they had a strong rebound in 2021.
- $30K>70K (29.7% of CUs) – $152.41/CU (+1.8%) $6.04B, Down $0.07B (-1.1%) From 2016 to 2020 their spending pattern was remarkably similar to the big spending $150K+ group. That changed in 2021 as they were the only group to spend less in Vet $ while $150K> had the biggest lift. They also fell from 2nd to 3rd in total Veterinary spending.
- Under $30K (25.5% of CUs) $94.06/CU (+4.9%) $3.21B, Up $0.21B (+7.2%) This group is very price sensitive. Except for a big spending dip in 2018, they have slowly but consistently increased Veterinary spending. They are now 32% ahead of their 2016 Veterinary Services $, although 56% of the increase was due to inflation.
Now, here is Veterinary Spending by Age Group
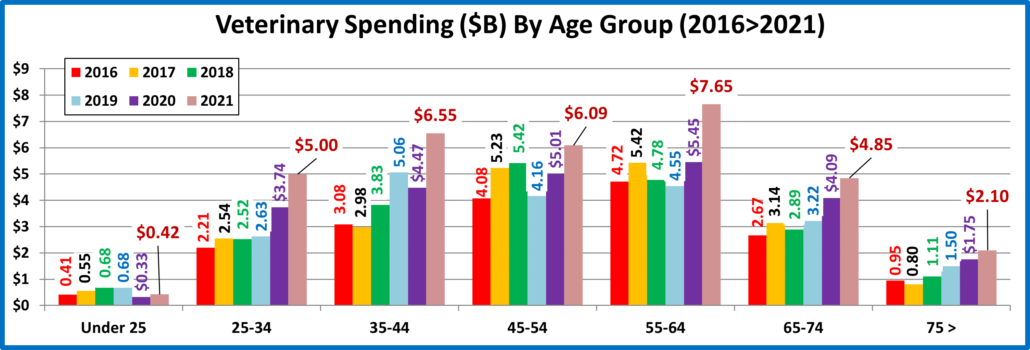
Every group spent more but the biggest lifts came from the 55>64 & 35>44 groups. Both spent $2+B more than in 2020.
National: $244.51 per CU (+29.1%) – $32.67B – Up $7.82B (+31.5%)
- <25 (4.9% of CUs) – $63.90/CU (-2.2%) – $0.42B – Up $0.09B (+28.2%) The biggest factor in the lift by this youngest group was that they moved out of their parents homes. 31.1% more CUs spent 2.5% more $ …4.6% less often.
- 25>34 (15.7% of CUs) – $237.68/CU (+33.5%) – $5.00B – Up $1.26B (+33.7%) The commitment of these Millennials to their pets is growing. After being stable from 2017>19, the pandemic caused Veterinary spending to take off In 2020 and the lift continued in 2021 due to increased frequency. 0.2% more CUs spent 4.2% more $ …28.2% more often.
- 35>44 (17.2% of CUs) – $285.97/CU (+42.6%) – $6.55B – Up $2.08B (+46.5%) In 2019, these mostly Gen Xers radically increased their spending and became #1 in Veterinary $. In 2020 spending decreased and they fell to 3rd place. In 2021 they had the biggest % increase and moved up to #2. 2.8% more CUs spent 16.0% more $ …22.9% more often
- 45>54 (16.7% of CUs) – $273.46/CU (+23.4%) – $6.09B – Up $1.08B (+21.6%) This group has the highest income, but value is important. In 2017, the slowed inflation caused them to spend significantly more money. In 2018, prices turned up and continued to inflate in 2019. Spending dropped precipitously to their 2016 level and they lost the top spot in Veterinary $. 2020 brought a big spending lift which continued into 2021. However, their 2021 increase didn’t match the 35>44 & 54>64 groups so they fell to #3. 1.5% fewer CUs spent 16.3% more $…6.1% more often
- 55>64 (18.5% of CUs) – $309.26/CU (+42.4%) – $7.65B – Up $2.20B (+40.4%) This group was the leader in Veterinary Spending prior to 2015. In 2015 they upgraded to Super Premium Food and Vet Spending fell. In 2016 inflation slowed and they regained the top spot. In 2018 Veterinary prices began to strongly inflate again. Their spending fell and continued down into 2019. In 2020 their frequency fell but they spent a lot more, so they moved back to the top in Veterinary Spending. They maintained this position in 2021 due to a more balanced increase in both the amount and frequency of purchases. 1.4% fewer CUs spent 22.8% more $ …15.9% more often
- 65>74 (16.1% of CUs) – $225.67/CU (+12.7%) – $4.85B – Up $0.75B (+18.4%) This group is growing and is now all Boomers so they are committed to their pets. In 2020 their visit frequency fell due to the pandemic, but they spent 37% more $. In 2021 they spent 5% less but much more often. 5.1% more CUs spent 5.1% less $ …18.8% more often
- 75> (10.9% of CUs) – $144.36/CU (+21.4%) – $2.10B – Up $0.34B (+19.6%) This group of oldest Pet Parents has a strong commitment to their pets – in 2015 a $1B increase in Veterinary Spending. In 2016, they upgraded their food. In 2017 they increased spending in Food, Supplies and Services. In 2018, they turned their attention back to Veterinary and their spending has grown every year. Although the pandemic hit them hard, they still took care of their pets with increased Veterinary spending through 2021. 1.4% fewer CUs spent 14.3% more $…6.2% more often
Now, let’s take a look at some other key demographic “movers” behind the 2021 Veterinary Spending numbers.
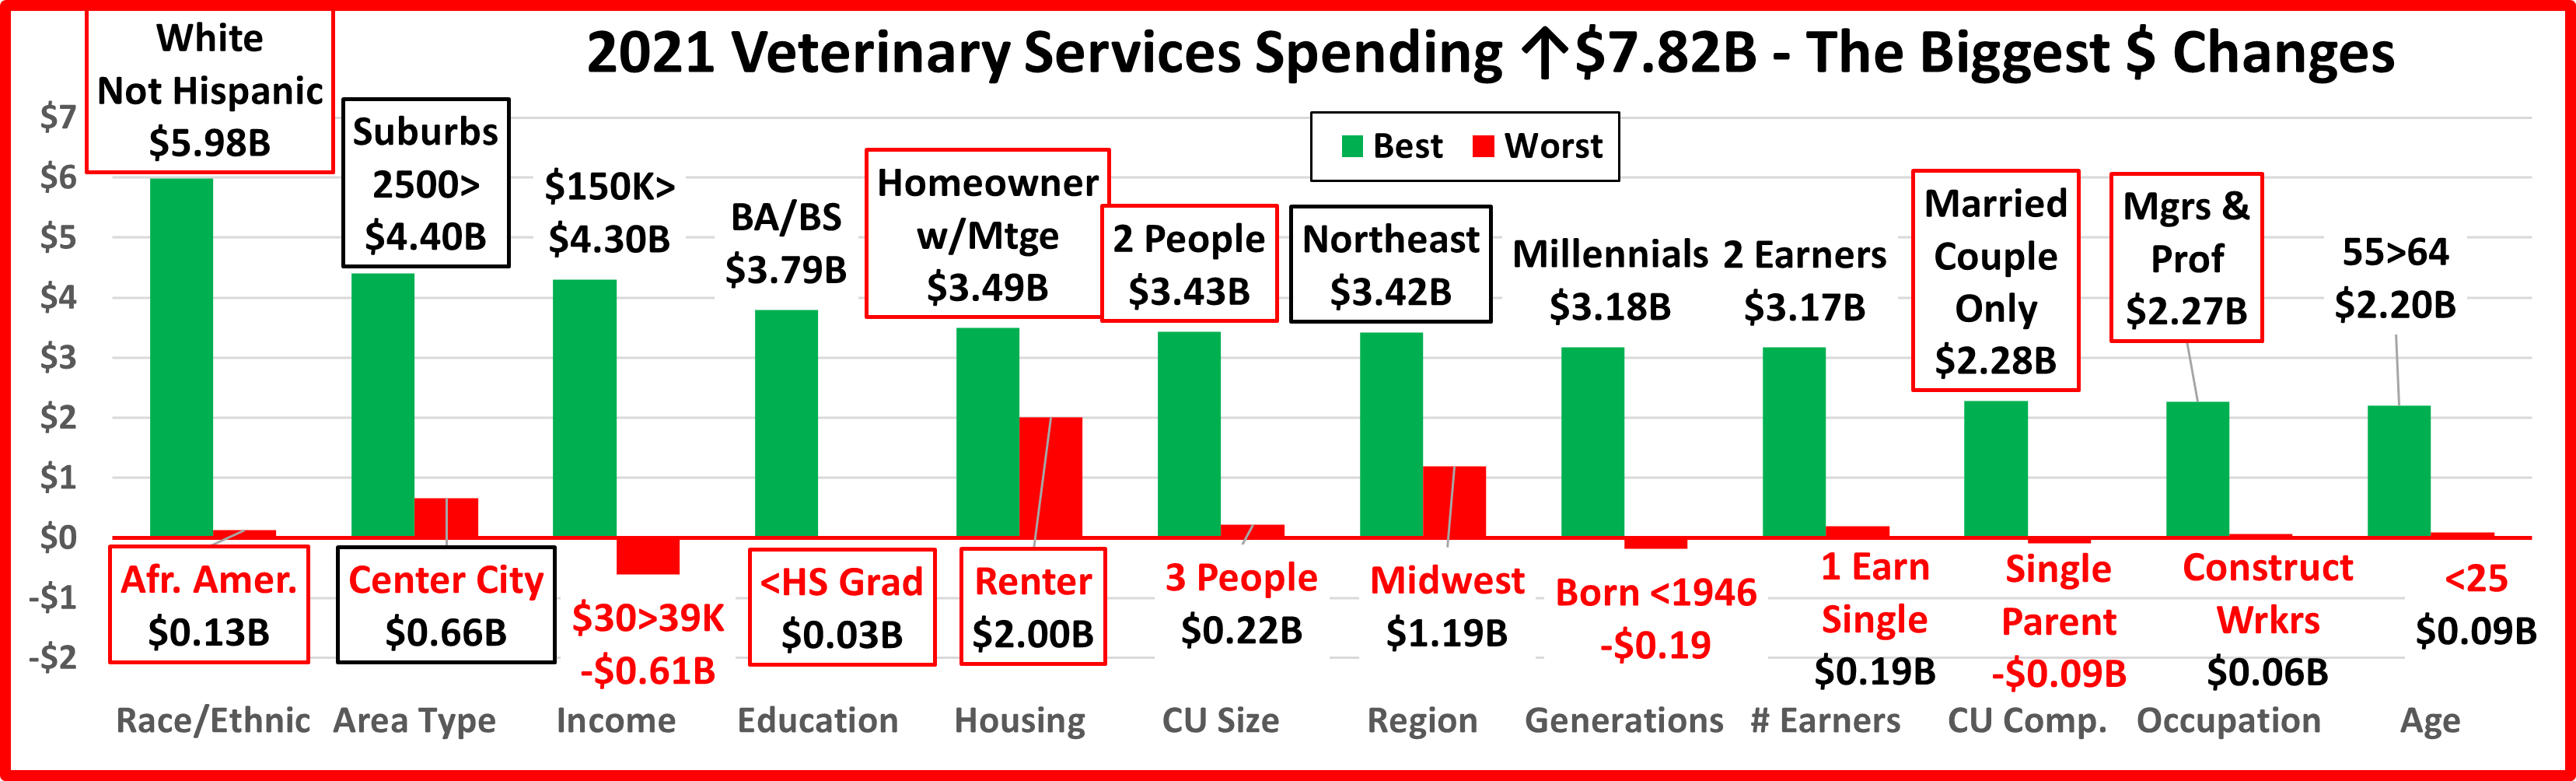
Veterinary spending increased by $7.82B (+31.5%) in 2021. Even with a high 4.2% inflation rate, 87% of the growth was real. 2021 had widespread positivity. 90 of 96 demographic segments (93.8%) spent more on Veterinary Services while only 6 segments spent less. In 9 categories all segments spent more. There was also less turmoil as only 3 flipped from first to last or vice versa while 8 segments maintained their position from 2020.
Virtually all of the “winners” are often found at the top. The only one that is somewhat of a surprise is Millennials, but in recent years they have become more concerned about Veterinary care for their Pet “children”. Their income exceeded the national average for the 1st time in 2020 and continues to grow so they are more able to afford the ever inflating cost of Veterinary Services.
There are also no big surprises in the “losers” group. The surprise is, and it’s a big one, that 9 of the 12 “losers” earned their spot at the bottom because they had the smallest spending increase in their category. That is very real proof of just how great 2021 was for the Veterinary Segment.
In our earlier analysis we saw that the increase was widespread across Income and Age groups. All age groups spent more and only 1 income group, $30>69K spent less and it was only -1.1%. In fact, the drop by the $30>69K group was driven by those with an income from $30>49K. The $50>69K segment had a 42% spending increase. The lift was widespread beyond Age and Income. In 9 categories all segments spent more. Besides the income category only Generations and CU composition had any segments that spent less on Veterinary Services. The segments were Single Parents and the Silent/Greatest Generations. This is not a surprise as both have low incomes and high life pressures
In recent years there had been a strong youth movement in Veterinary Spending from the <45 crowd. That changed in 2020 as the 45> groups accounted for 94% of the segment’s $3B increase. In 2021 the older crowd held on but their share of the record $7.8B increase fell to 56% – a little more balanced.
Generations is still the most popular demographic measurement. Baby Boomers fueled the growth of the Pet Industry and are still the leaders in Food and Veterinary $. However, in 2021 big increases in Services and Supplies pushed Gen X to the top in Total Pet $. Boomers have led the way in Veterinary $ for years but their lead is narrowing. As recently as 2017 their Veterinary spending was greater than all of the younger generations combined. In 2021 the younger groups spent 72% more than the Boomers. Boomers will remain a force in the industry for years to come. but the “torch” is slowly but surely being passed as Veterinary and Total Pet spending becomes demographically widespread.

