2023 U.S. PET SUPPLIES SPENDING $23.02B…Up ↑$1.08B
Total Pet spending grew to $117.60B in 2023, up $14.89B (+14.5%) from 2022. After a record $8.75B (+57%) increase in 2021 the Supplies segment fell $1.86B in 2022. They started to recover in 2023, up $1.08B (+4.9%) to $23.02B. (Note: All numbers in this report come from or are calculated by using data from the US BLS Consumer Expenditure Surveys)
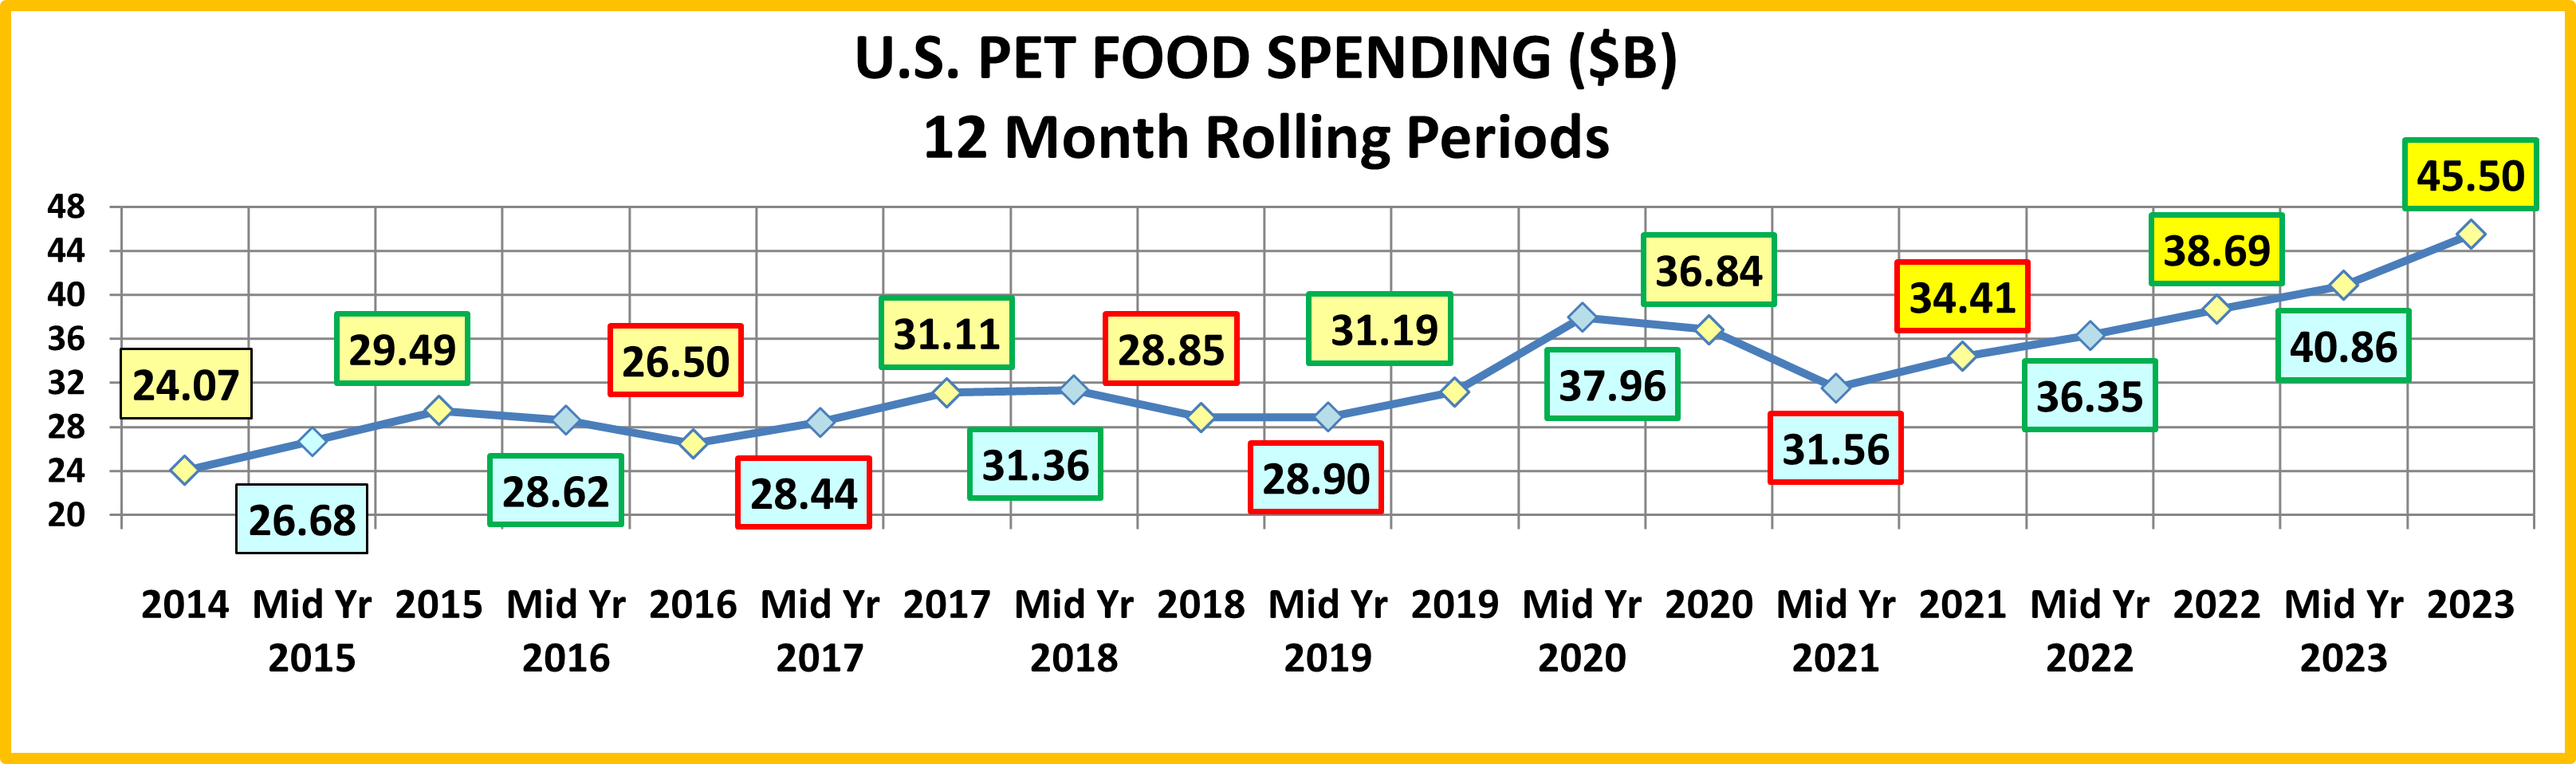
Supplies Spending fell -$4.6B 2018>20 due to Tarifflation and COVID. In 2021, Pet Parents caught up. Spending turned up in the 1st half then skyrocketed in the 2nd half. In 2022, it plateaued in the 1st half then fell sharply in the 2nd half. 2023 had a 1st half lift & a 2nd half drop. We’ll drill down into the data to determine what & who was drove the lift in Spending.
In 2023, the average household spent $171.08 on Supplies, up 4.5% from $163.64 in 2022. (Note: A 2023 Pet CU (68%) Spent $251.59) This doesn’t exactly match the 4.9% total $ increase. Here are the specific details:
- 0.3% more CU’s
- Spent 1.5% less $
- 6.1% more often
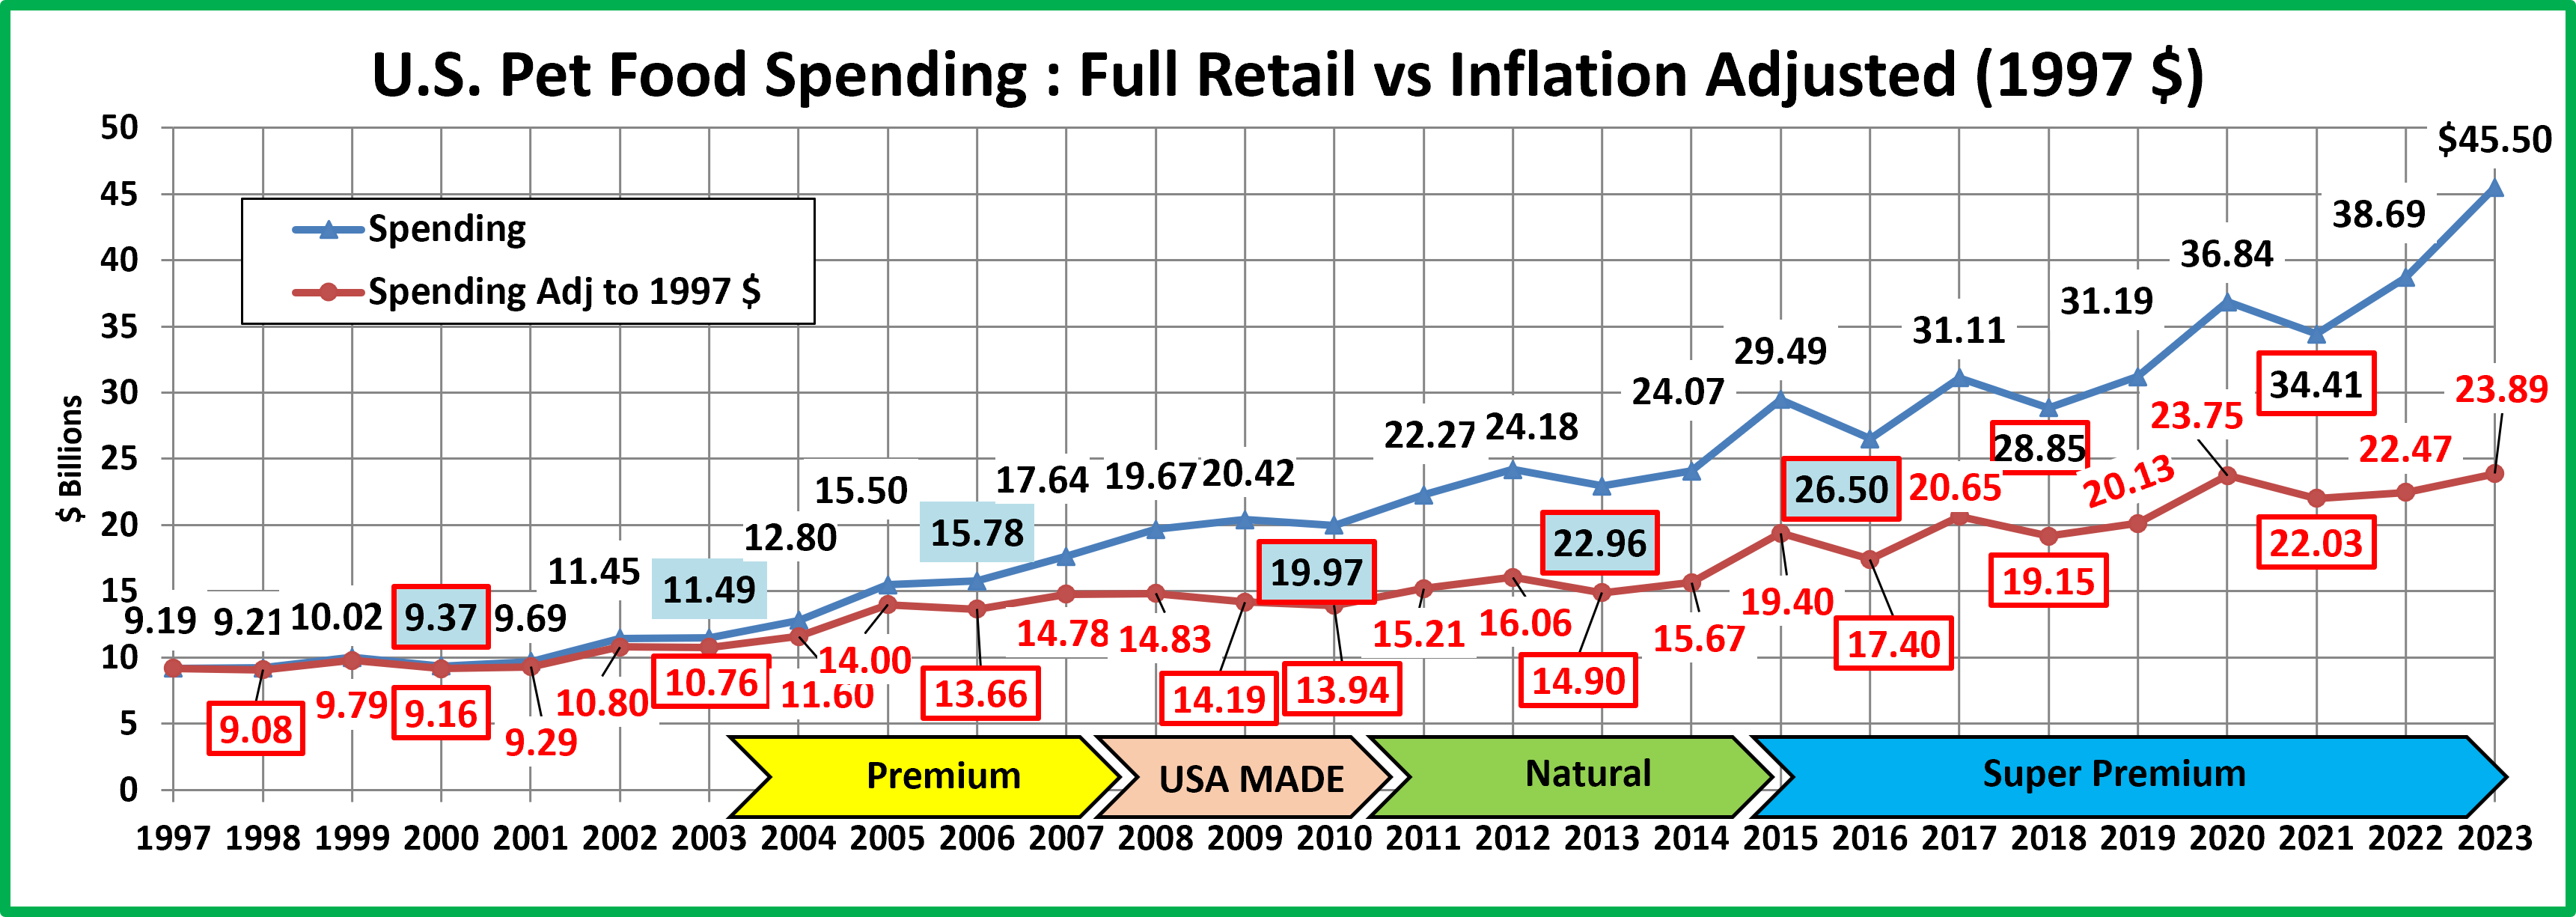
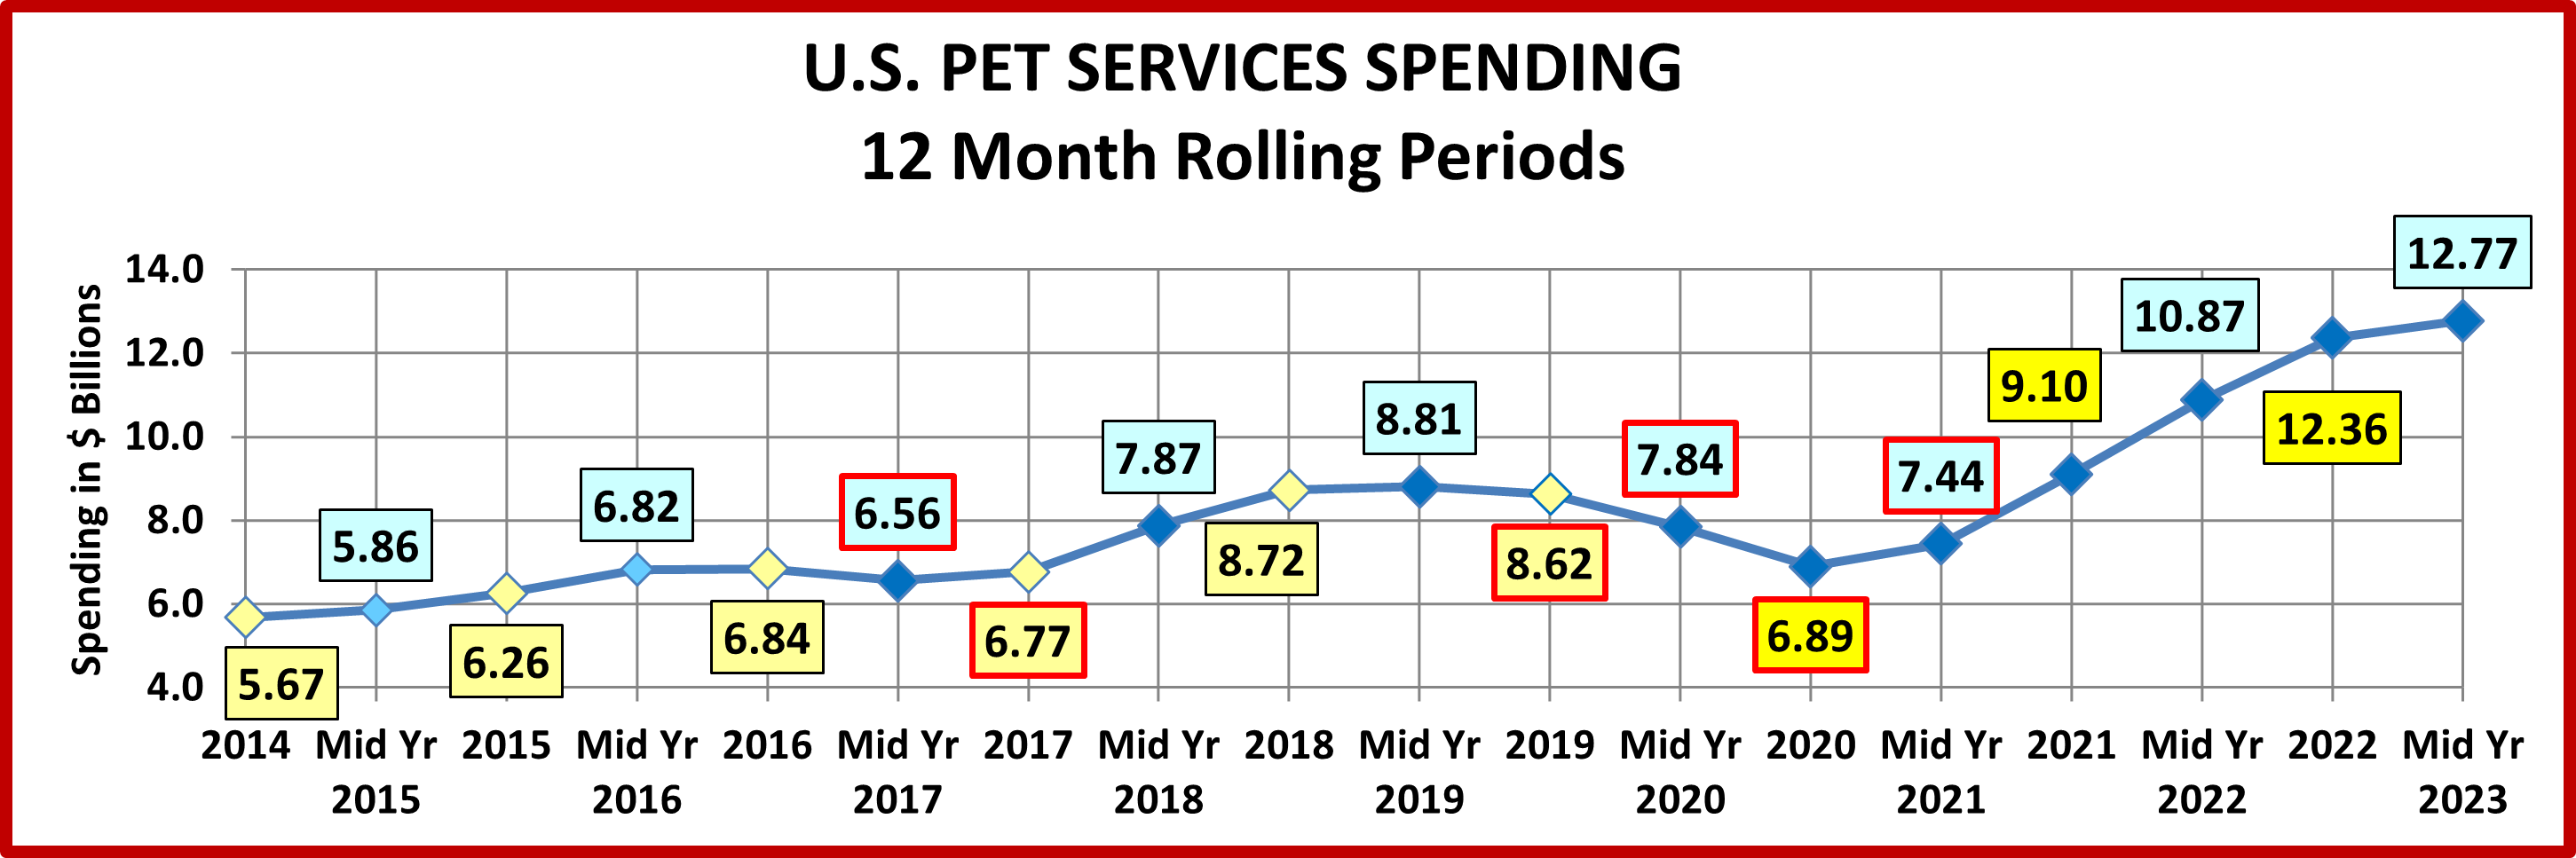
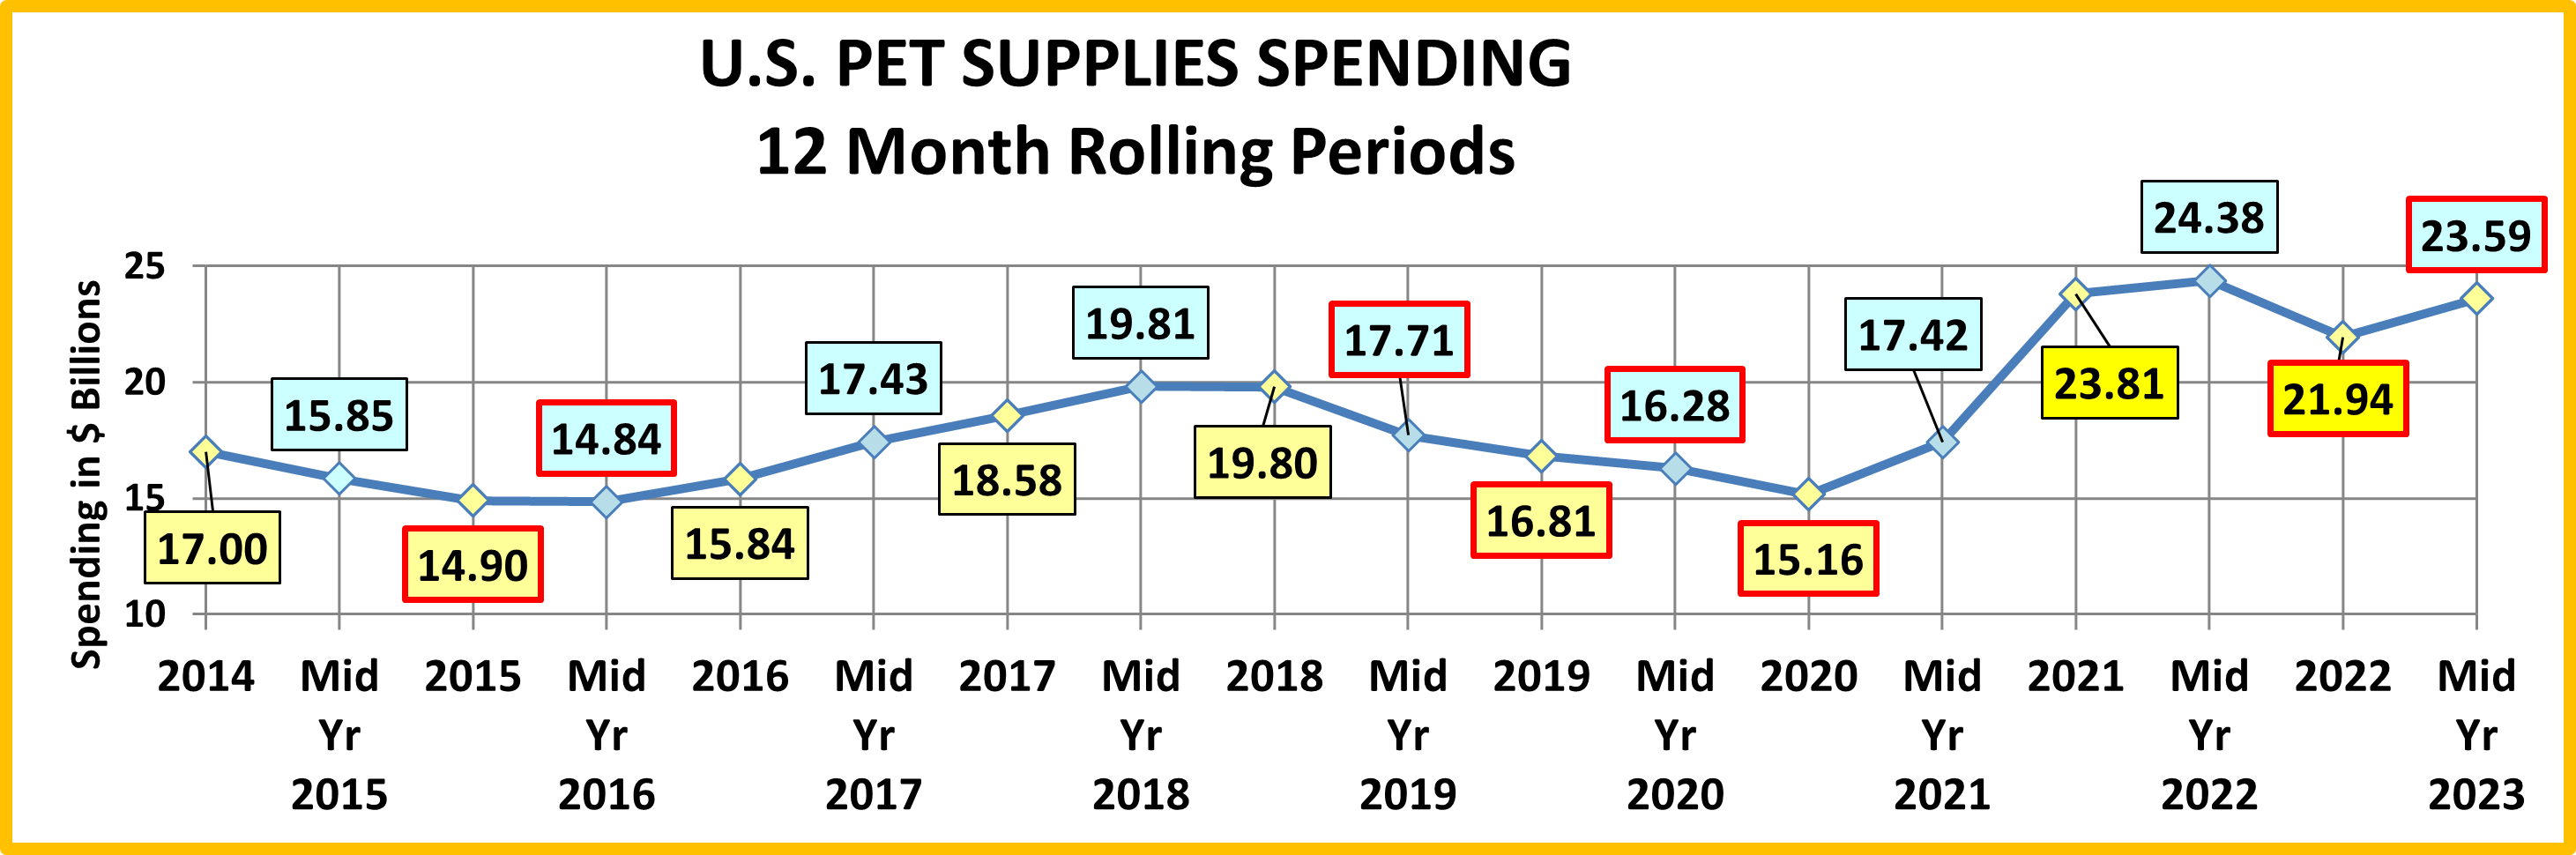
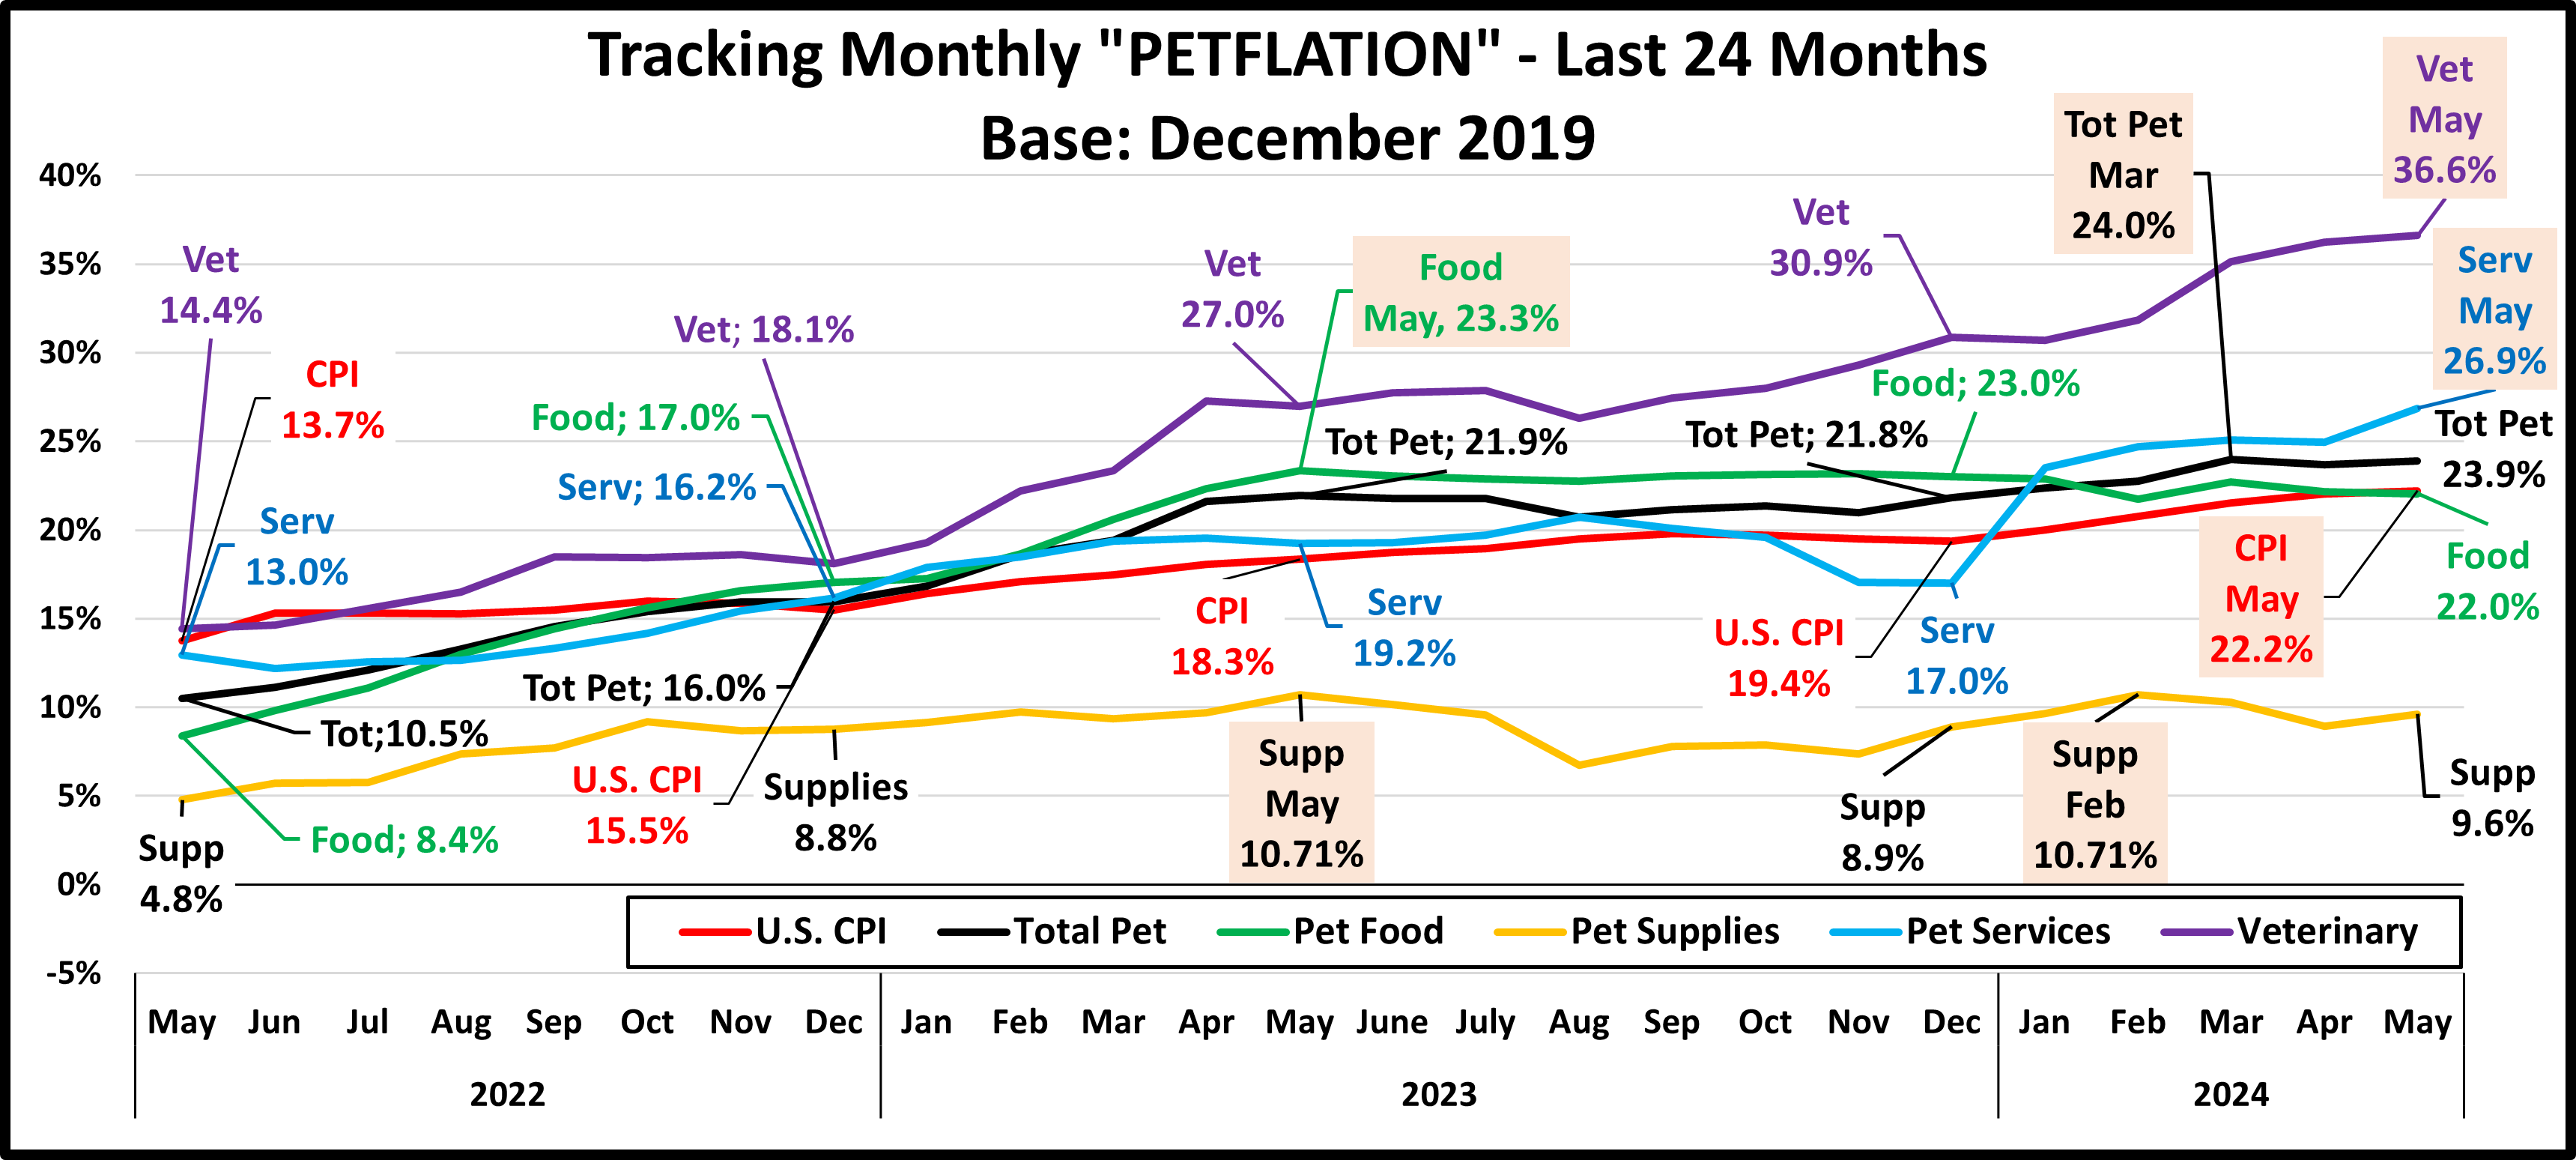
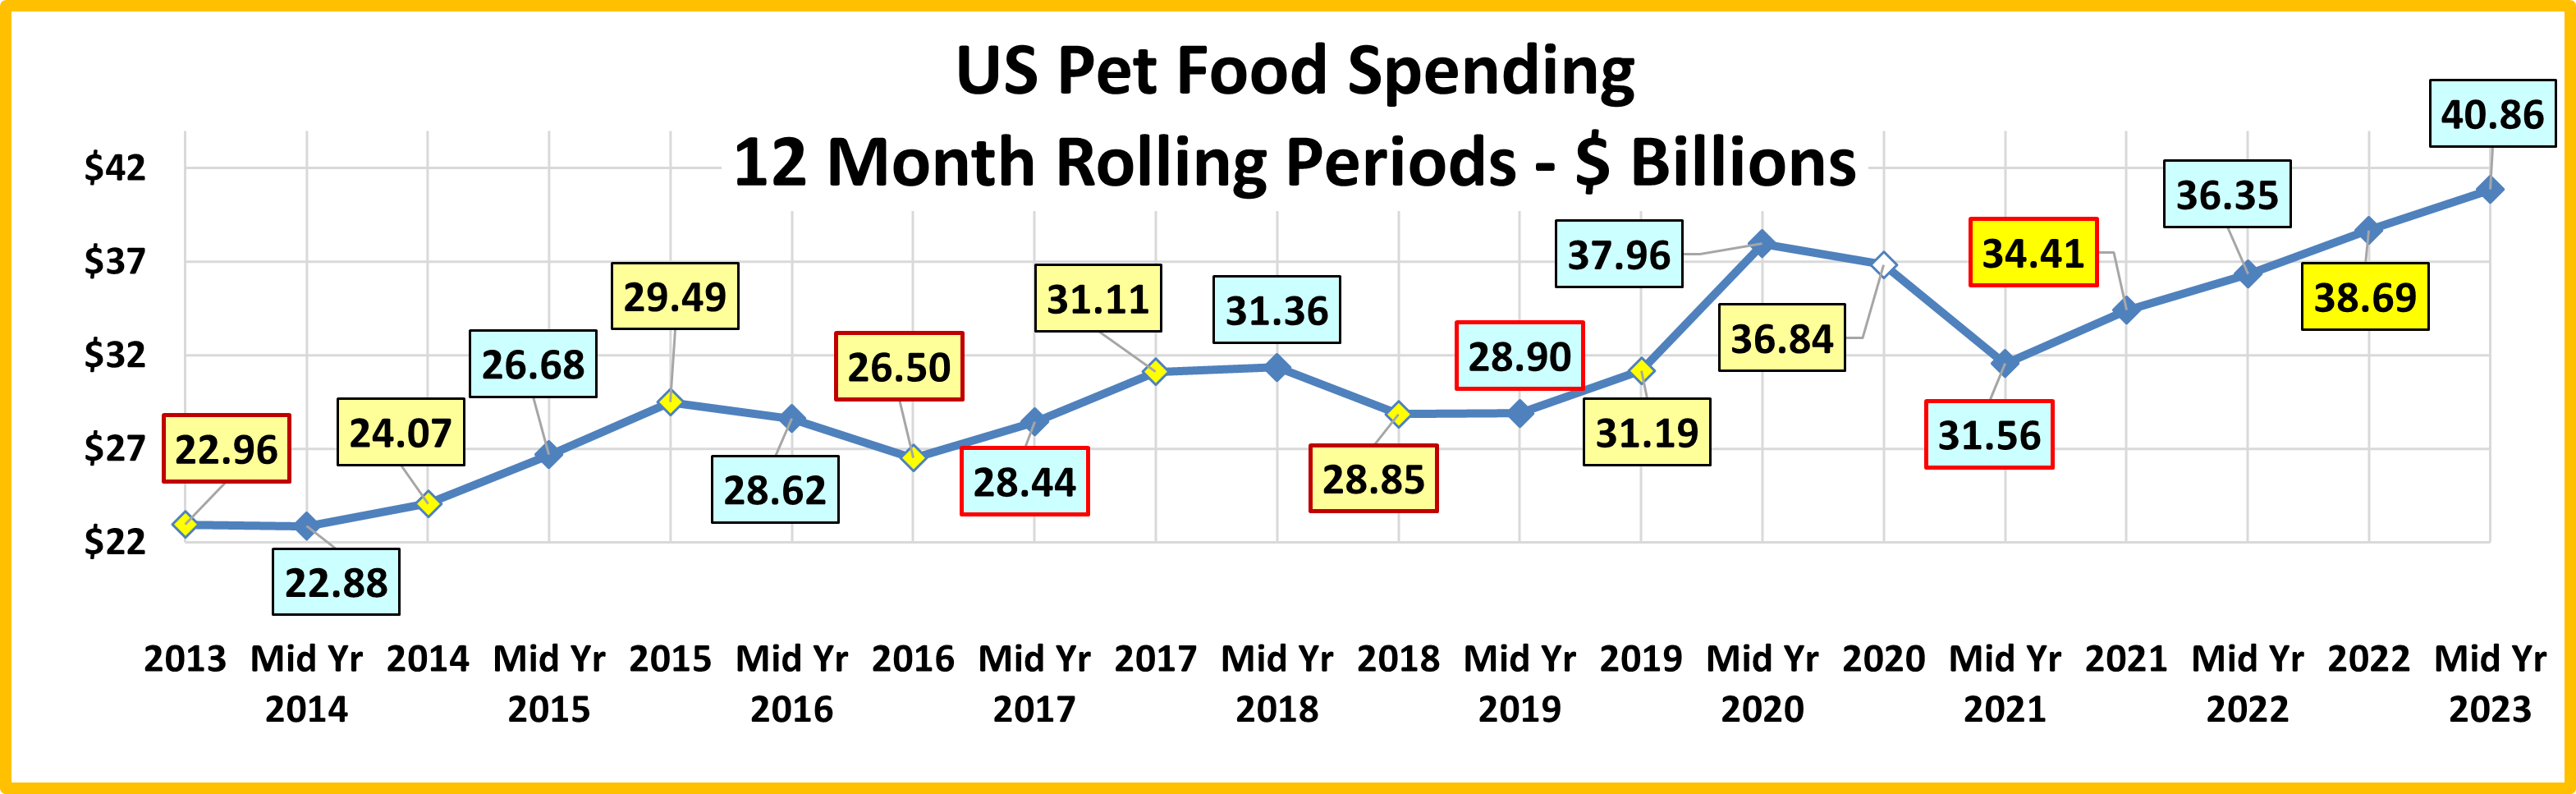
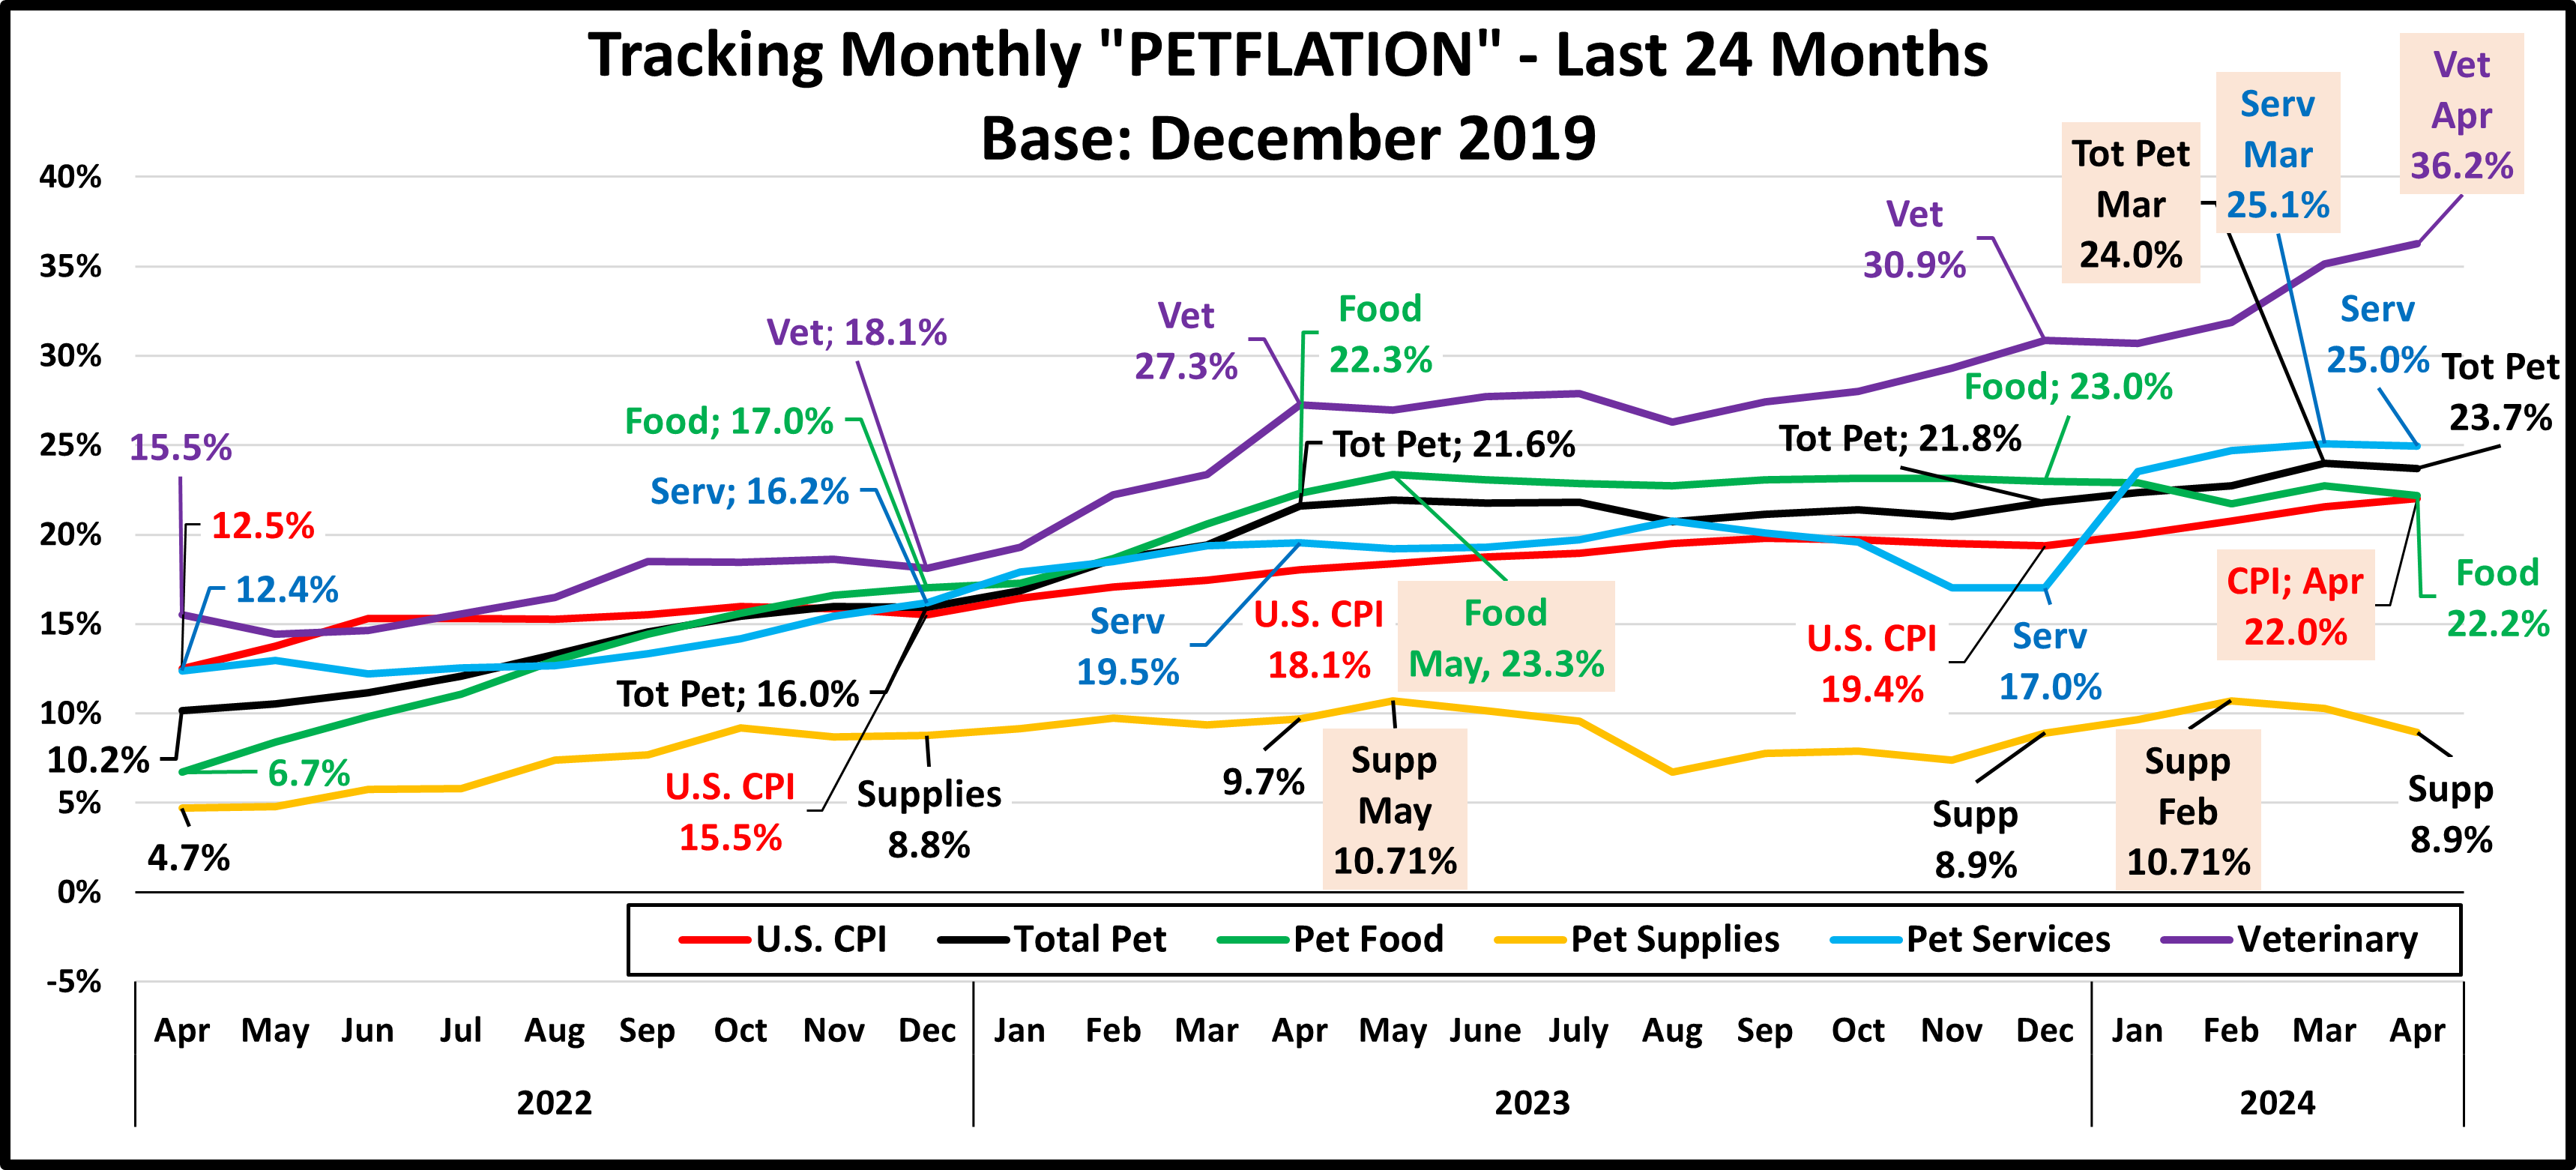
Let’s start with a visual overview. The chart below shows recent Supplies spending history.

Since the great recession, spending in the Supplies segment has been driven by price. Although many supplies are needed by Pet Parents, when they are bought and how much you spend is often discretionary. When prices fall, consumers are more likely to buy more. When they go up, consumers spend less and/or buy less frequently.
2014 was the third consecutive year of deflation in Supplies as prices reached a level not seen since 2007. Consumers responded with a spending increase of over $2B. Prices stabilized and then moved up in 2015.
In 2015 we saw how the discretionary aspect of the Supplies segment can impact spending in another way. Consumers spent $5.4B for a food upgrade and cut back on Supplies – swapping $. Consumers spent 4.1% less, but they bought 10% less often. That drop in purchase frequency drove $1.6B (78%) of the $2.1B decrease in Supplies spending.
In 2016, supplies’ prices flattened out and consumers value shopped for their upgraded food. Supplies spending stabilized and began to increase in the second half. In 2017 supplies prices deflated, reaching a new post-recession low. The consumers responded with a $2.74B increase in Supplies spending that was widespread across demographic segments. An important factor in the lift was an increase in purchase frequency which was within 5% of the 2014 rate.
In 2018 prices started to move up in April and rapidly increased later in the year due to the impact of new tariffs. By December, Supplies prices were 3.3% higher than a year ago. This explains the initial growth and pull back in spending.
In 2019 we saw the full impact of the tariffs. Prices continued to increase. By yearend they were up 5.7% from the Spring of 2018 and spending plummeted -$2.98B. The major factor in the drop was a 13.1% decrease in purchasing frequency.
2020 brought the pandemic. Prices deflated but with retail restrictions and the consumers’ focus on needed items, both the amount spent and frequency of purchase of Supplies fell.
In 2021 the recovery began with a strong lift in the 1st half that reached record levels in the 2nd half. Pet parents bought all the supplies that they had been putting off for 2 years – the biggest lift in history. 2021 spending ended up where it was headed in 2018 before being “derailed” by outside influences. In 2022 inflation took off, especially in the 2nd half. Spending plateaued then fell -$2.44B in the 2nd half. In the 1st half of 2023 spending increased, primarily because of inflation. In the 2nd half inflation fell to 0.1%, but prices were still high so spending dropped.
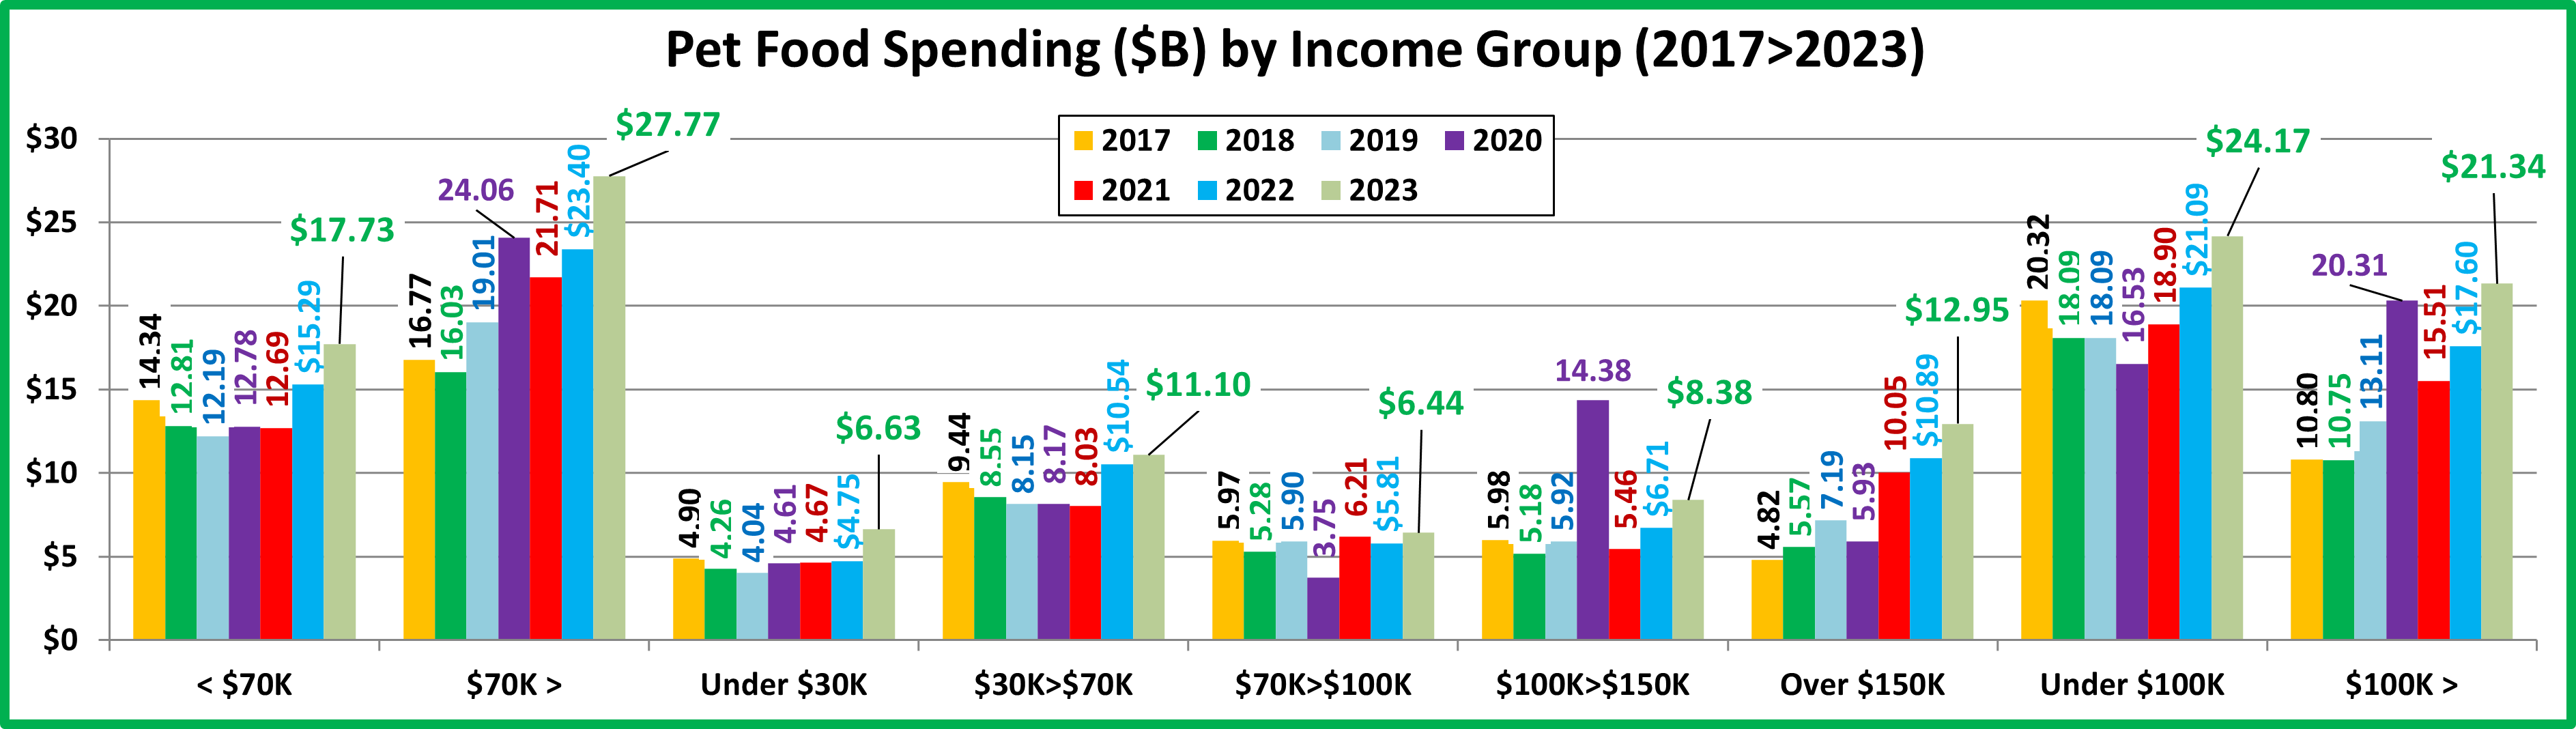
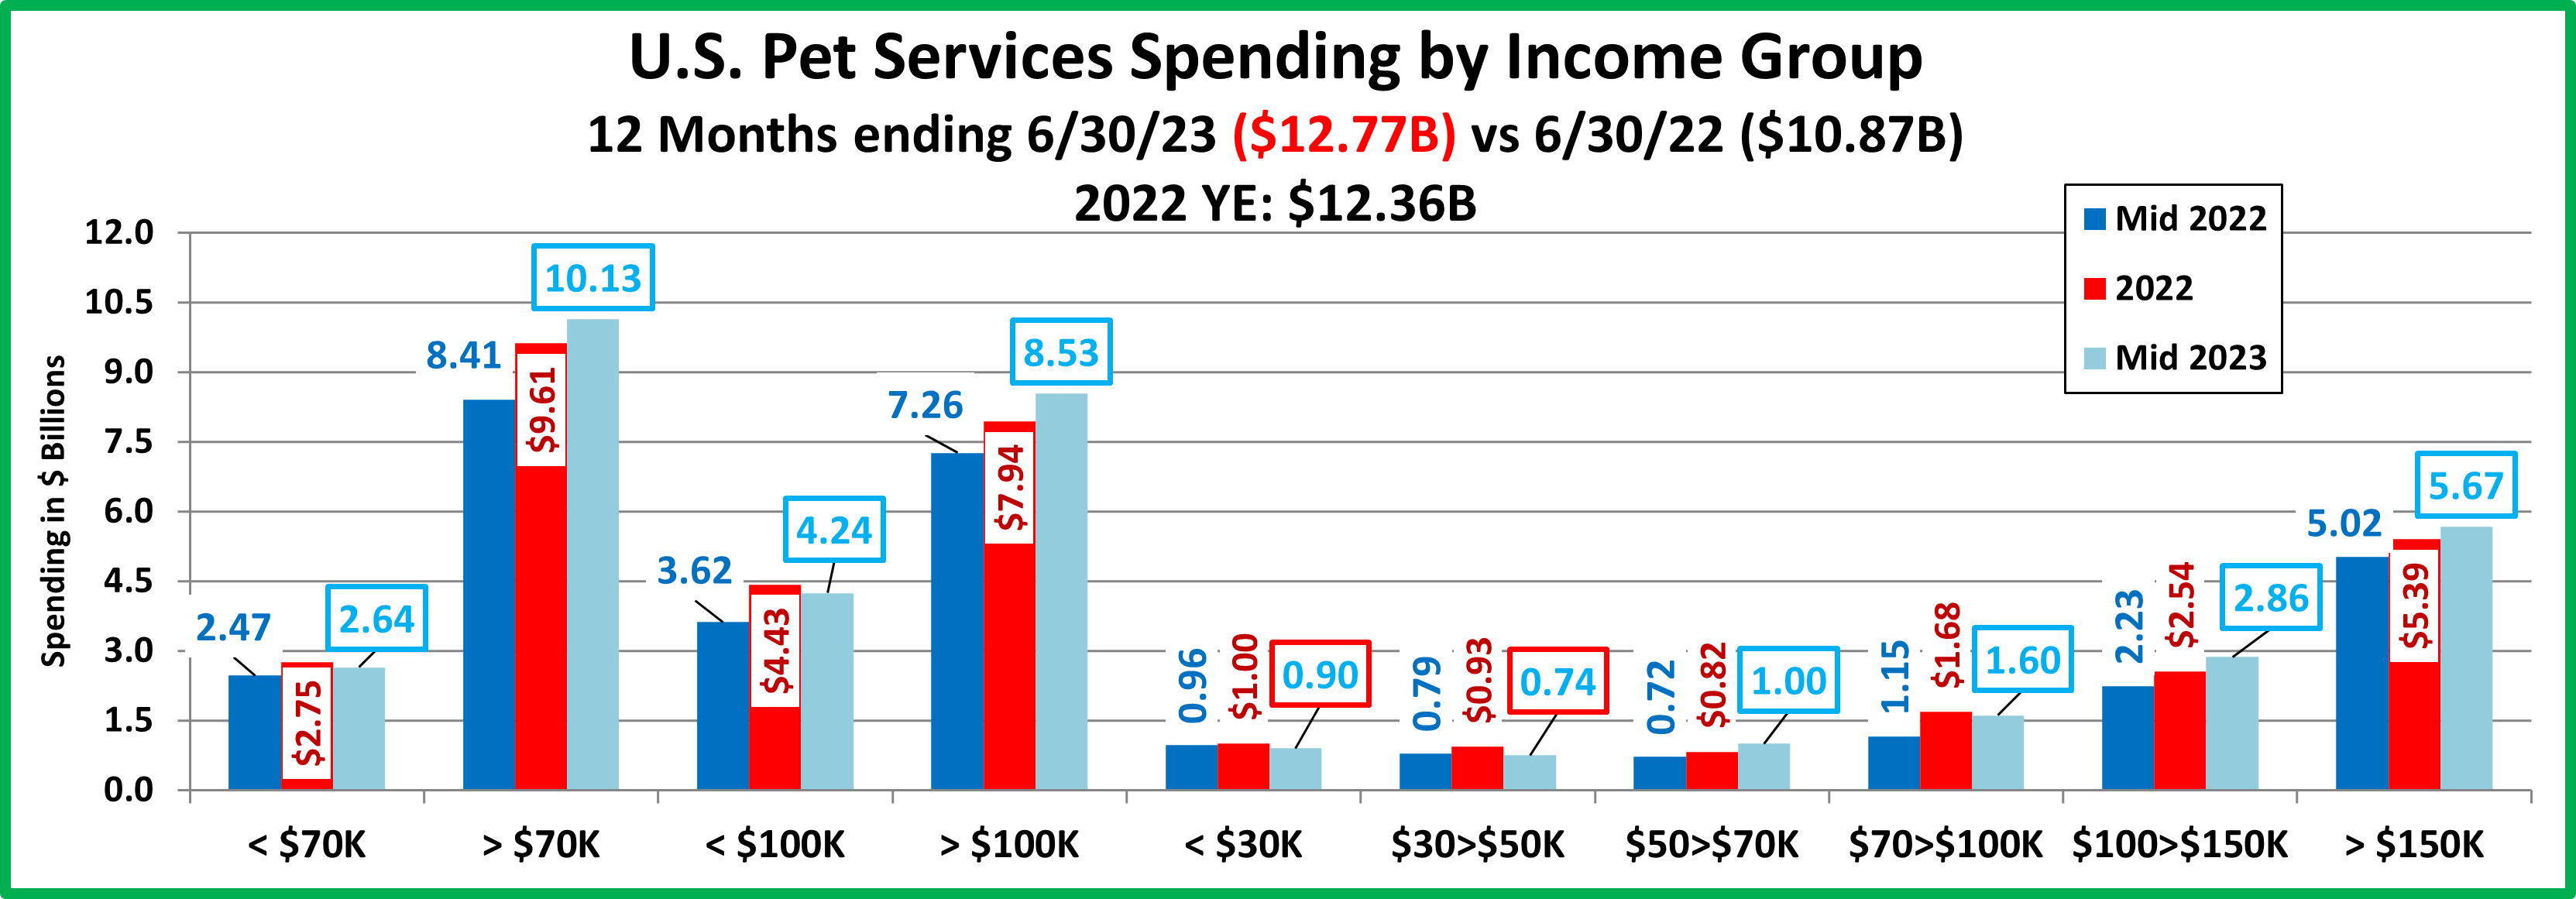
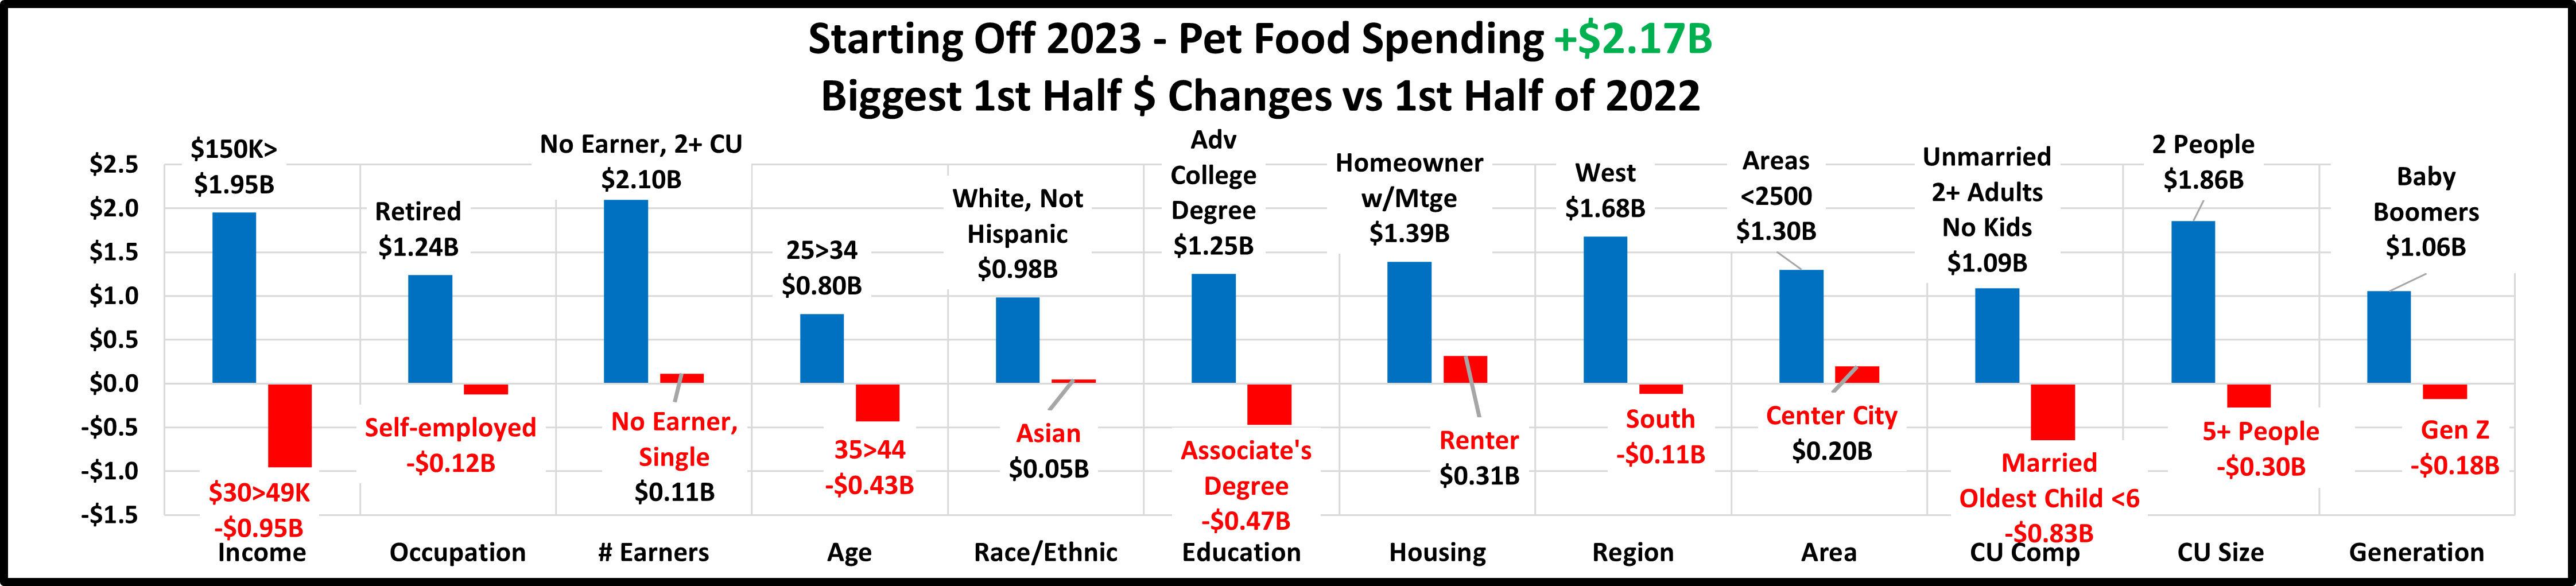
That gives us an overview of the recent spending history. Now let’s look at some specifics regarding the “who” behind the 2023 lift. First, we’ll look at spending by income level, the most influential demographic in Pet Spending.

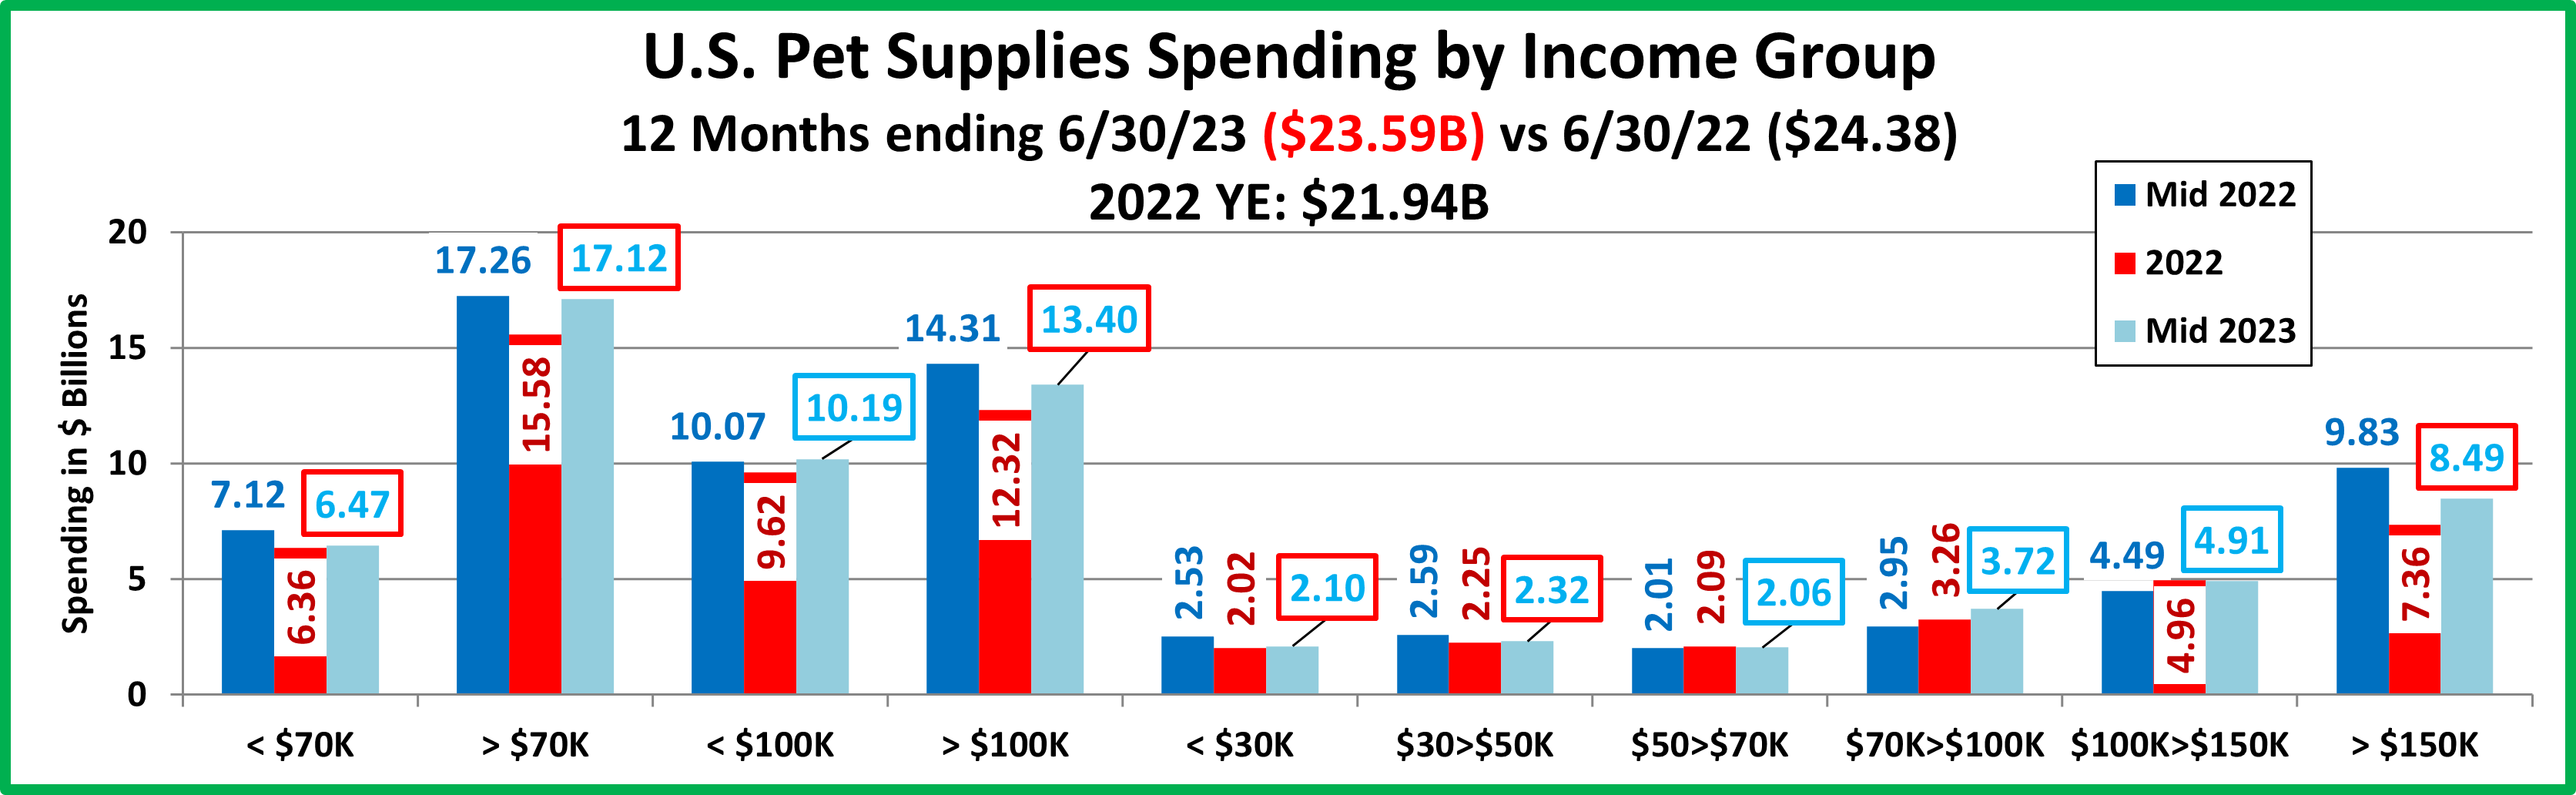
National: $171.08 per CU (+4.5%) – $23.02B – Up $1.08B (+4.9%).
Only the <$30 & $100>150K income groups spent less but the 50/50 $ divide moved up to $117K from $114K.
- <$30K (21.3% of CUs)- $68.33 per CU (+7.7%); $1.95B– Down $0.07B (-3.4%). This group is very price sensitive, but they still need Supplies. Their Total Supplies $ only fell because they have 10.4% fewer CUs.
- $30K>70K (28.3% of CUs)- $117.82 per CU (+5.3%); $4.48B – Up $0.14 (+3.2%). This big, lower income group matches both the national spending pattern and that of the $150K+ group. 2019 Tarifflation and 2022 inflation had big impacts. Despite fewer CUs, spending grew. Until 2019 they were the leader in Supplies $. Now, they rank 3rd.
- $70>$100K (14.1% of CUs) – $180.19 per CU (+4.7%); $3.41B – Up $0.15B (+4.7%). This group had consistent spending until 2020 hit them hard. They rebounded strong in 21 and spending even grew slightly in both 22 & 23.
- $100K>$150K (16.6% of CUs) – $214.74 per CU (-10.0%); $4.81B – ↓$0.15B (-3.0%). This group had the 2nd biggest COVID drop. In 21 they had the 2nd biggest recovery. In 22, they had the only significant lift but their $ fell 3% in 23.
- $150K> (19.8% of CUs) – $314.49 per CU (+1.2%); $8.36B – Up $1.00B (+13.6%). This highest income group had the biggest $ drop in 22, which is not surprising after a $4.6B lift in 21. In 23 they provided 93% of the Supplies lift. This came from 12.3% more CUs. BTW, the $150>200K group was again the driver as $200K> spent -3.2% less per CU.
With high prices, income matters. While $30>100K spent a little more, almost all of the overall lift came from $150K>.
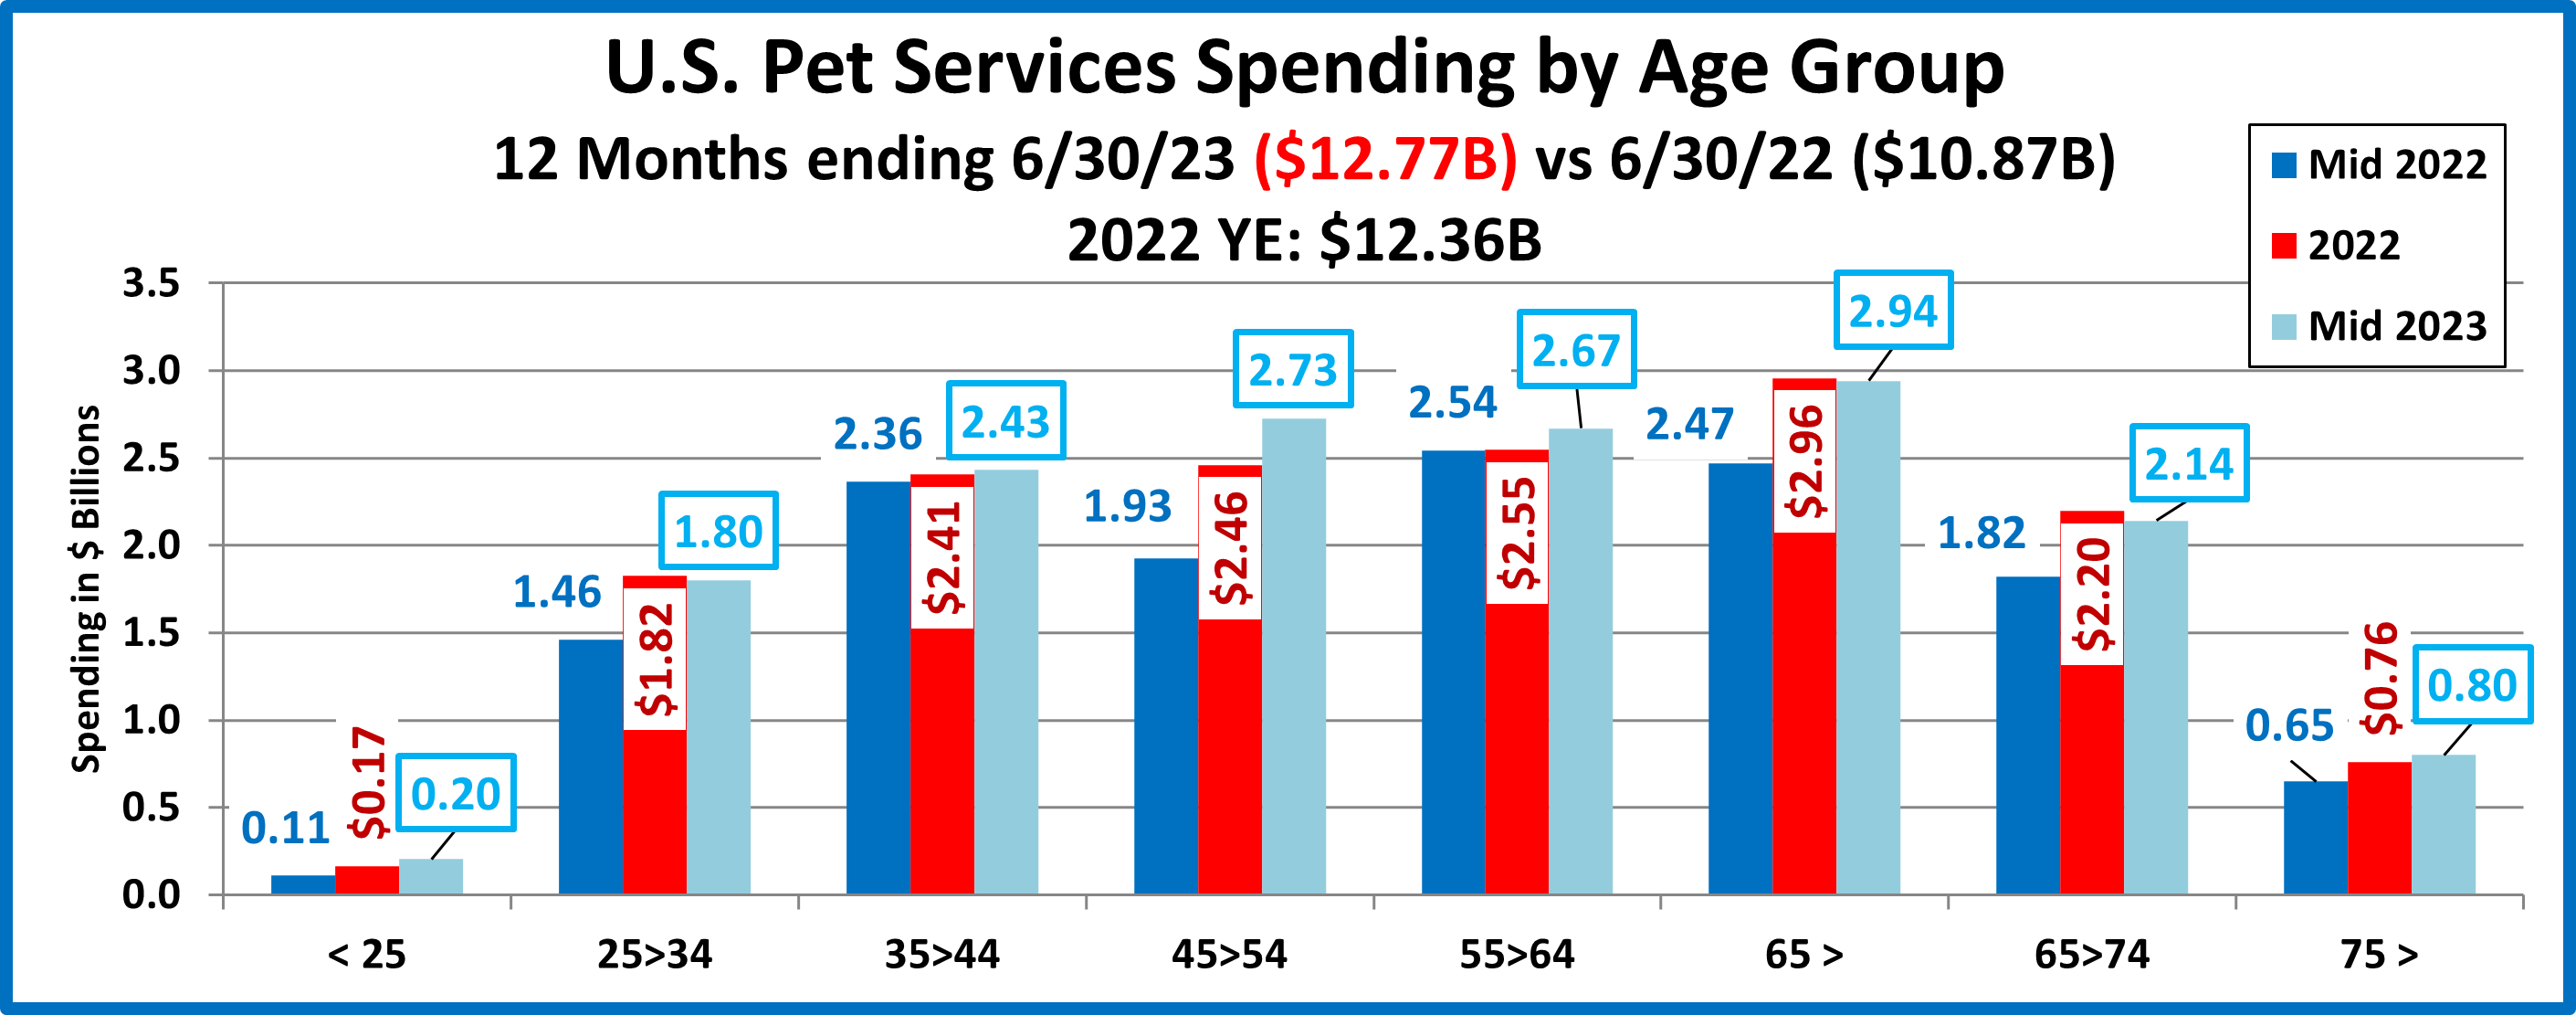
Now, we’ll look at spending by Age Group.

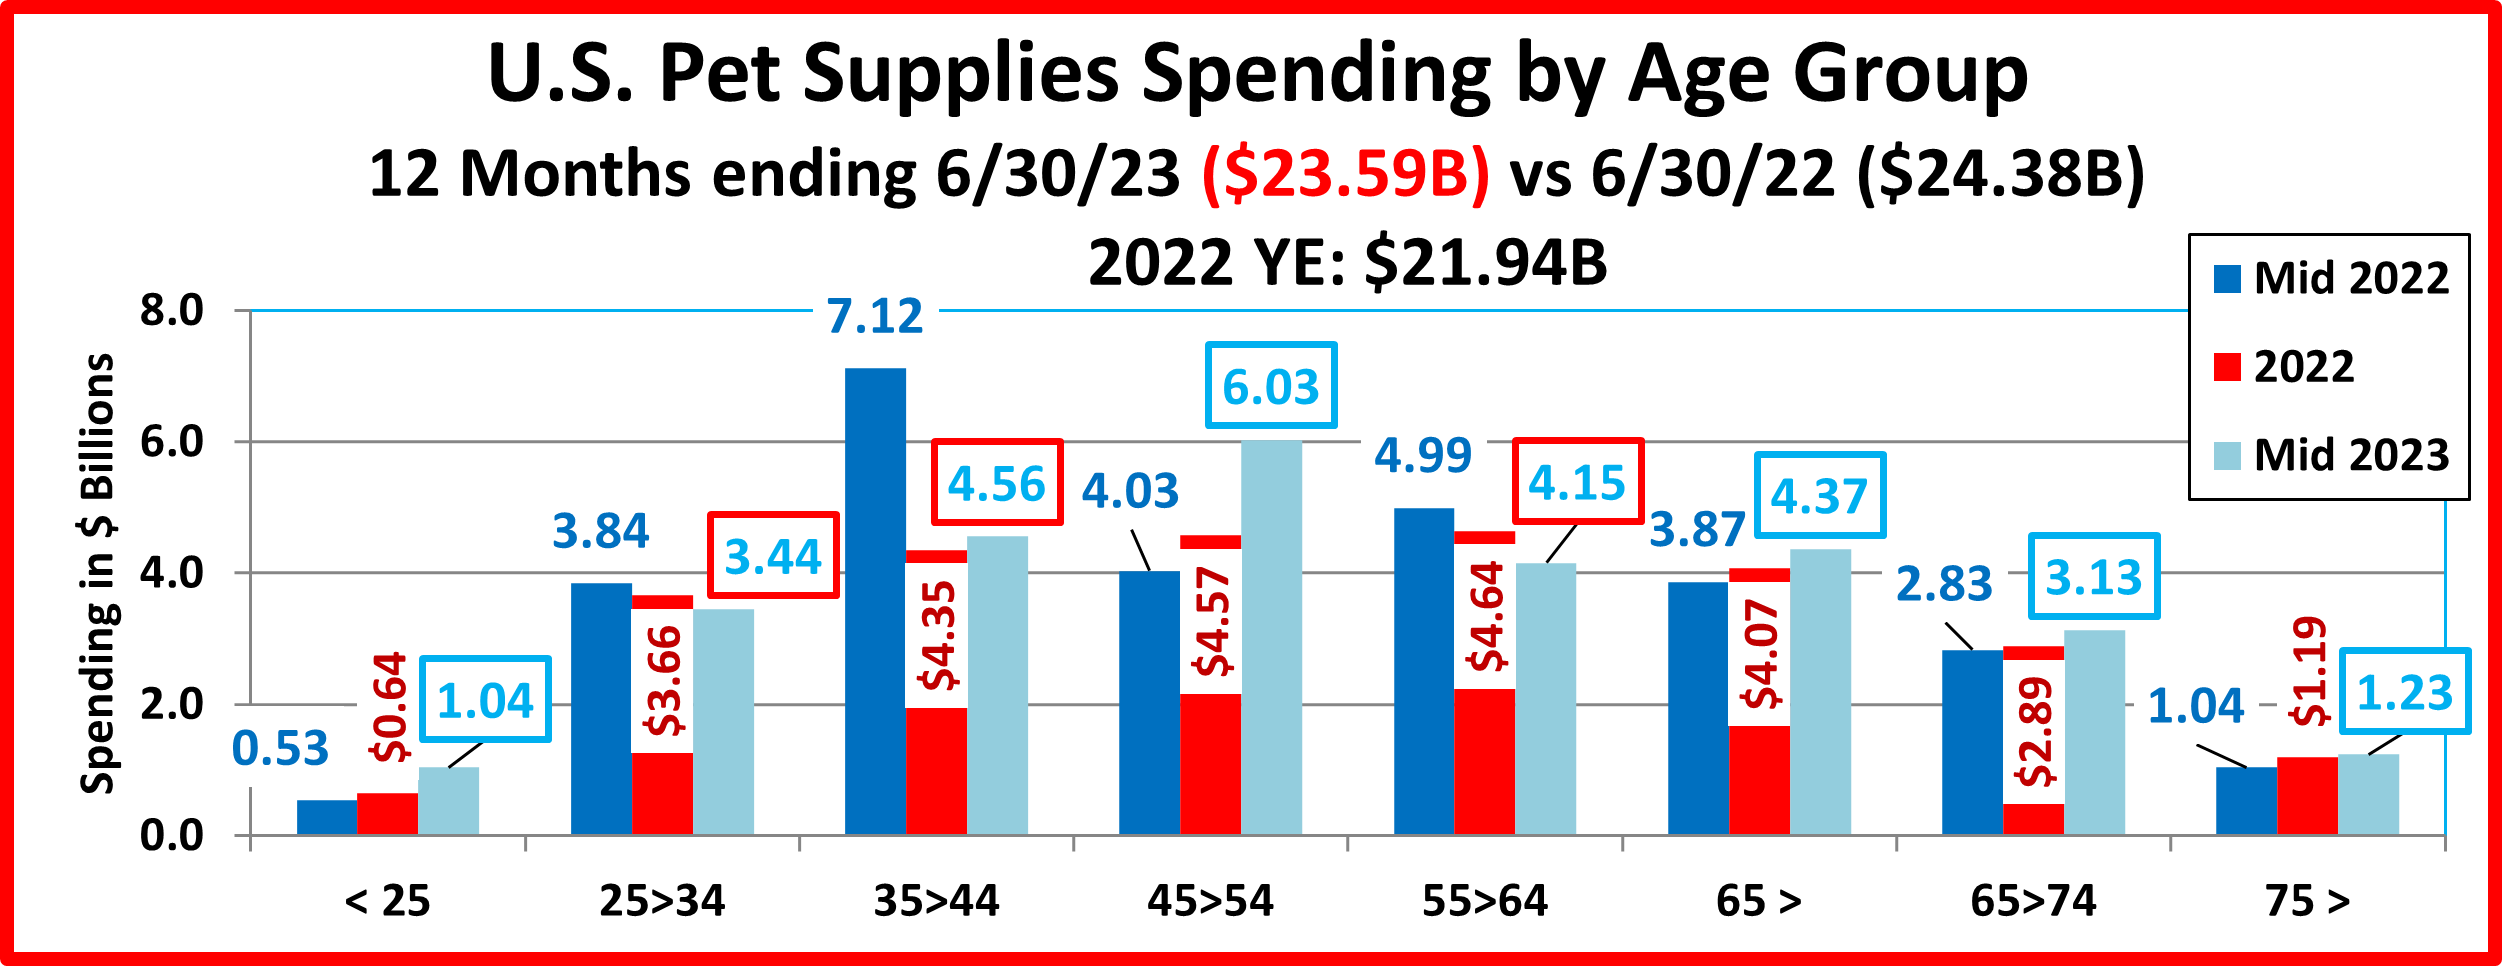
National: $171.08 per CU (+4.5%) – $23.02B – Up $1.08B (+4.9%)
2023 was an age group spending rollercoaster. Under 25: ↑; 25>34:↓; 35>54: ↑; 55>64: ↓; 65>74:↑; 75>: ↓
- 45>54 (16.9% of CUs) $237.89 per CU (+18.1%); $5.41B – Up $0.84B (+18.3%). From 2007>2018 this highest income group was the leader in Supplies spending. They had a pandemic drop but strong growth in 21 & 22. The lift continued in 2023 as 0.1% more CU’s spent 19.8% more, 1.5% less often. They moved up from #2 to #1.
- 35>44 (17.5% of CUs) $189.19 per CU (-0.9%); $4.47B – Up $0.11B (+2.6%) They are 2nd in income and expenditures. Strong inflation drove their $ down in 2019 but COVID had little impact. Spending took off in 21, fell in 22 then grew slightly in 23 as 3.5% more CUs spent 6.1% less $, 5.6% more often. They are #2, up from #3
- 55>64 (17.8% of CUs) $183.28 /CU (-3.6%); $4.39B – ↓ $0.26B (-5.6%). Tarriflation caused a spending drop in 2019. Spending fell in 2020 as they binge bought pet food. They had a strong recovery in 21. Growth slowed in 22 then $ fell in 23 as 2.1% less CUs spent 12.9% less on Supplies, 10.7% more often. They fell from #1 to #3.
- 25<34 (15.7% of CUs) $165.46 per CU (-5.5%); $3.49B – Down $0.17B (-4.7%). After trading Supplies $ for upgraded Food and Vet Care in 2016, these Millennials turned their attention back to Supplies. Tarriflation hit them hard in 2019 but they actually increased spending in the pandemic. The lift grew even stronger in 2021 but then spending fell slightly in 2022 and again in 2023 as 0.9% more CUs spent 1.0% less $, 4.6% less often.
- 65>74 (16.0% of CUs) $145.29 per CU (+9.4%); $3.14B – Up $0.25B (+8.7%). This older group is very price sensitive so rising prices caused them to cut back on spending in 2019. Like the 25>34 yr-olds, they also increased spending in 2020 and spending soared in 2021. However, unlike the 25>34 yr-olds and despite high prices, their spending grew in 2022 and again in 2023 as 0.7% less CUs spent 2.2% more, 7.1% more often.
- 75> (11.6% of CUs) $70.27 per CU (-9.8%); $1.10B – Down $0.09B (-7.8%). This low-income group is price sensitive but they are committed to their pets. Their spending was severely impacted by the Pandemic. They had a strong recovery in 21 & 22 but their $ fell in 23 as 2.2% more CU’s spent 23.6% less, 18.1% more often.
- <25 (4.5% of CUs) $172.54/CU (+69.3%) $1.04B- Up $0.40B (+63.1%). Many moved in with other adults or got married. Many also added Pets to their CU. In 2023 3.7% less CUs spent 1.2% less $, 71.5% more often.
Supplies spending was on an age roller-coaster in 2023 with no clear pattern but the 45>54 group drove most of the lift.
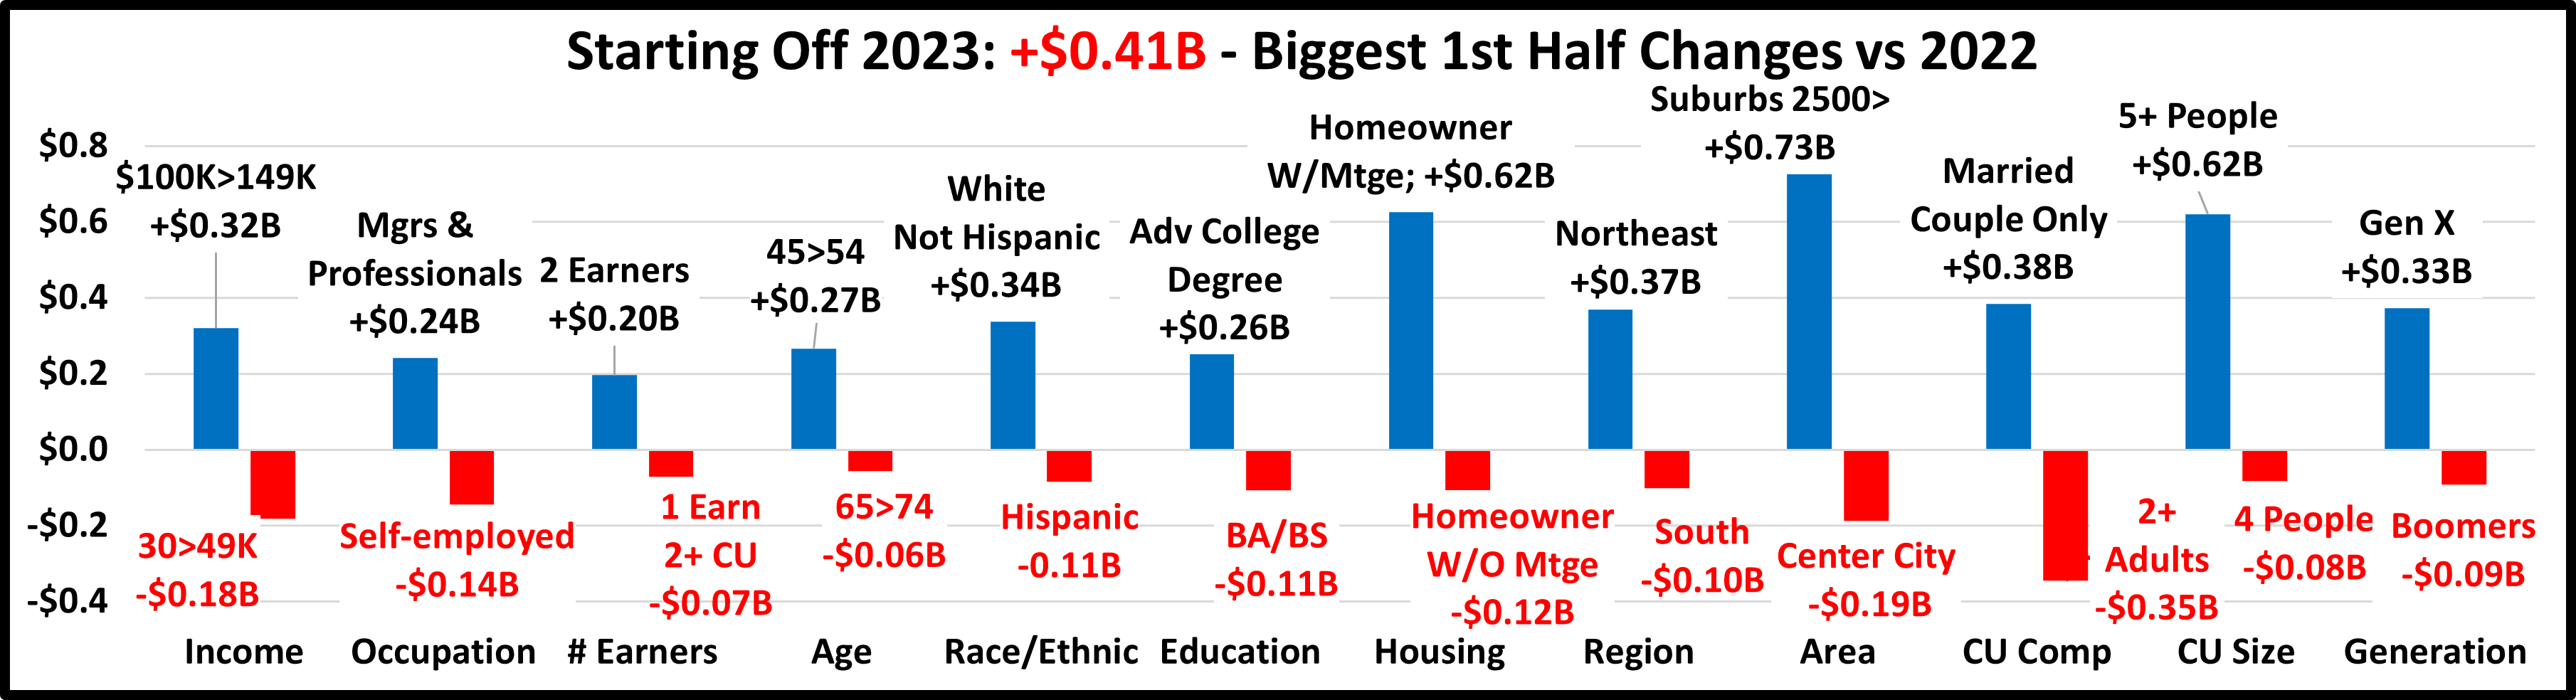
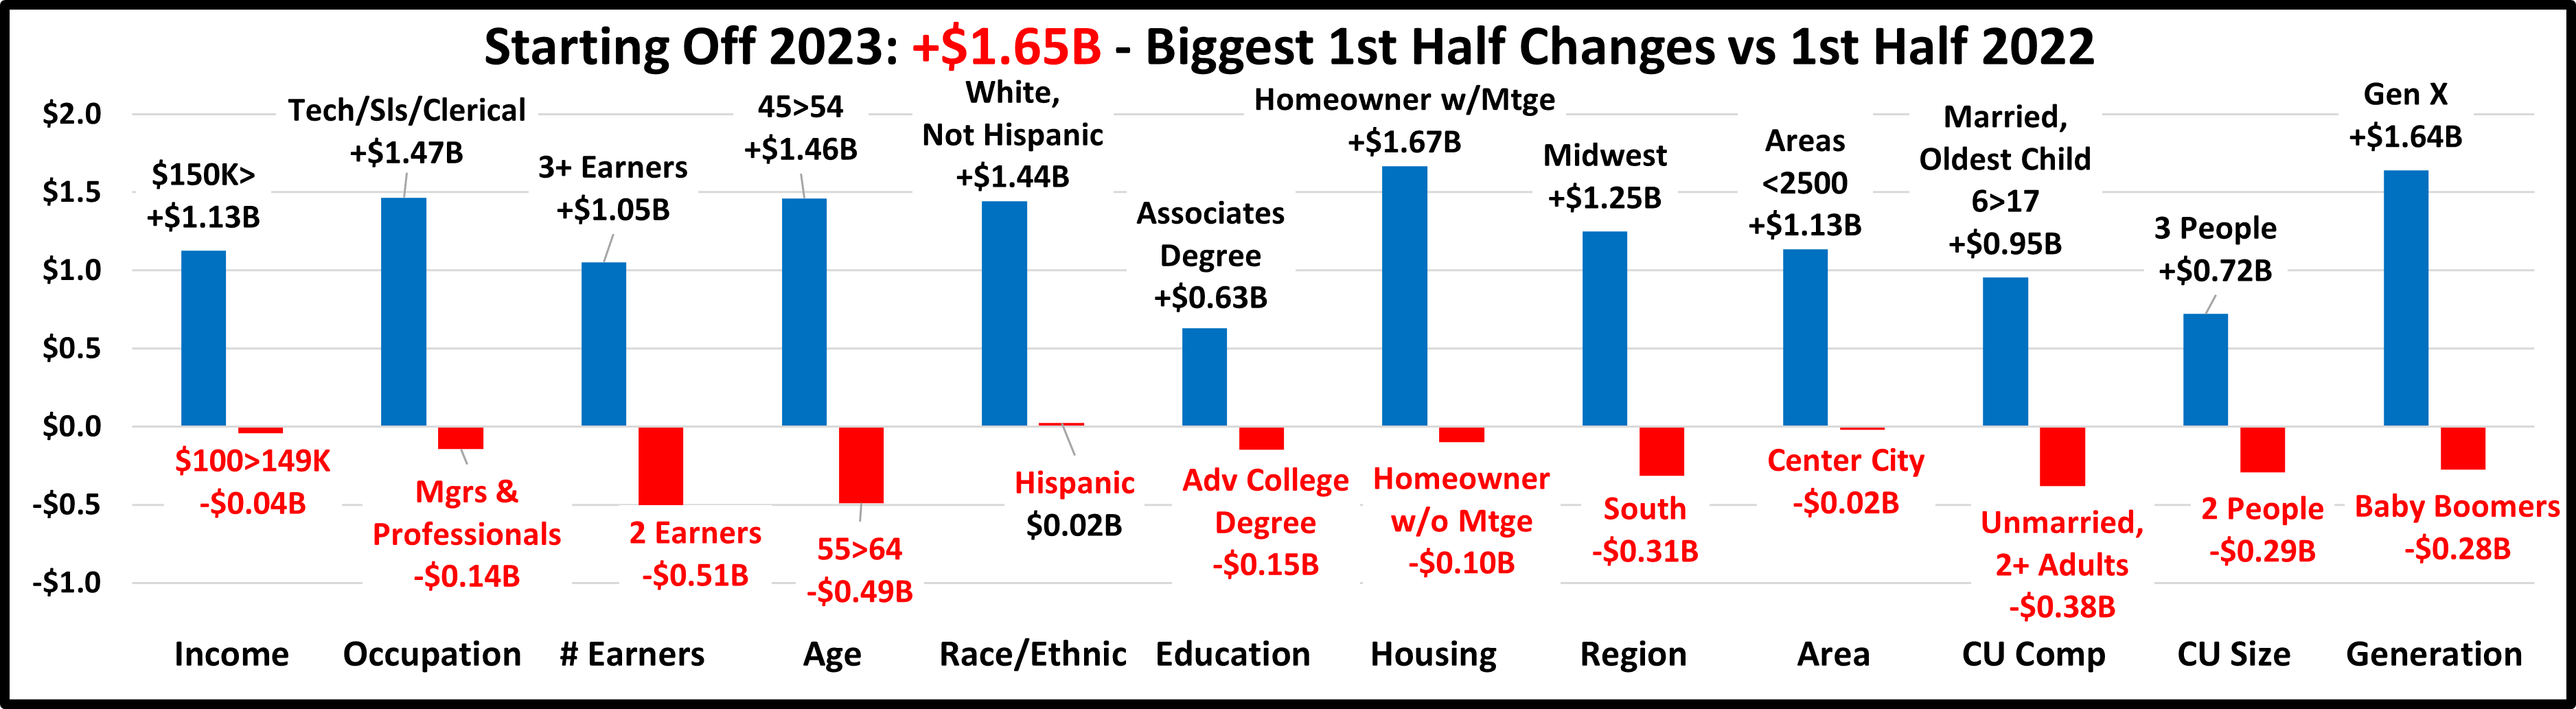
Next, let’s take a look at some other key demographic “movers” in 2023 Pet Supplies Spending. The segments that are outlined in black “flipped” from 1st to last or vice versa from 2022. The red outline stayed the same.

In 2023, even with only a small increase, 65.6% of segments still spent more. In 2022 it was 52%. There was 1 Category – Housing, in which all spent more. That didn’t happen in 2022. In 2023 there were 9 “flips” and 5 that held their spot. In 2022 there were 15 “flips” and 1 “holdover”. 2023 was clearly better and more stable than 2022.
5 winners are the “usual suspects”: • White, Not Hisp. • $150>199K • Gen X • 45>54 yr-olds • Homeown w/Mtge
5 are very surprising: • Tech/Sls/Cler • Rural • 1 Earner, Single • Singles • HS Grad w/Some College
Among the losers, most often show up here. There are only 2 big repeat surprises: • 2 Earners • Adv. College Degree
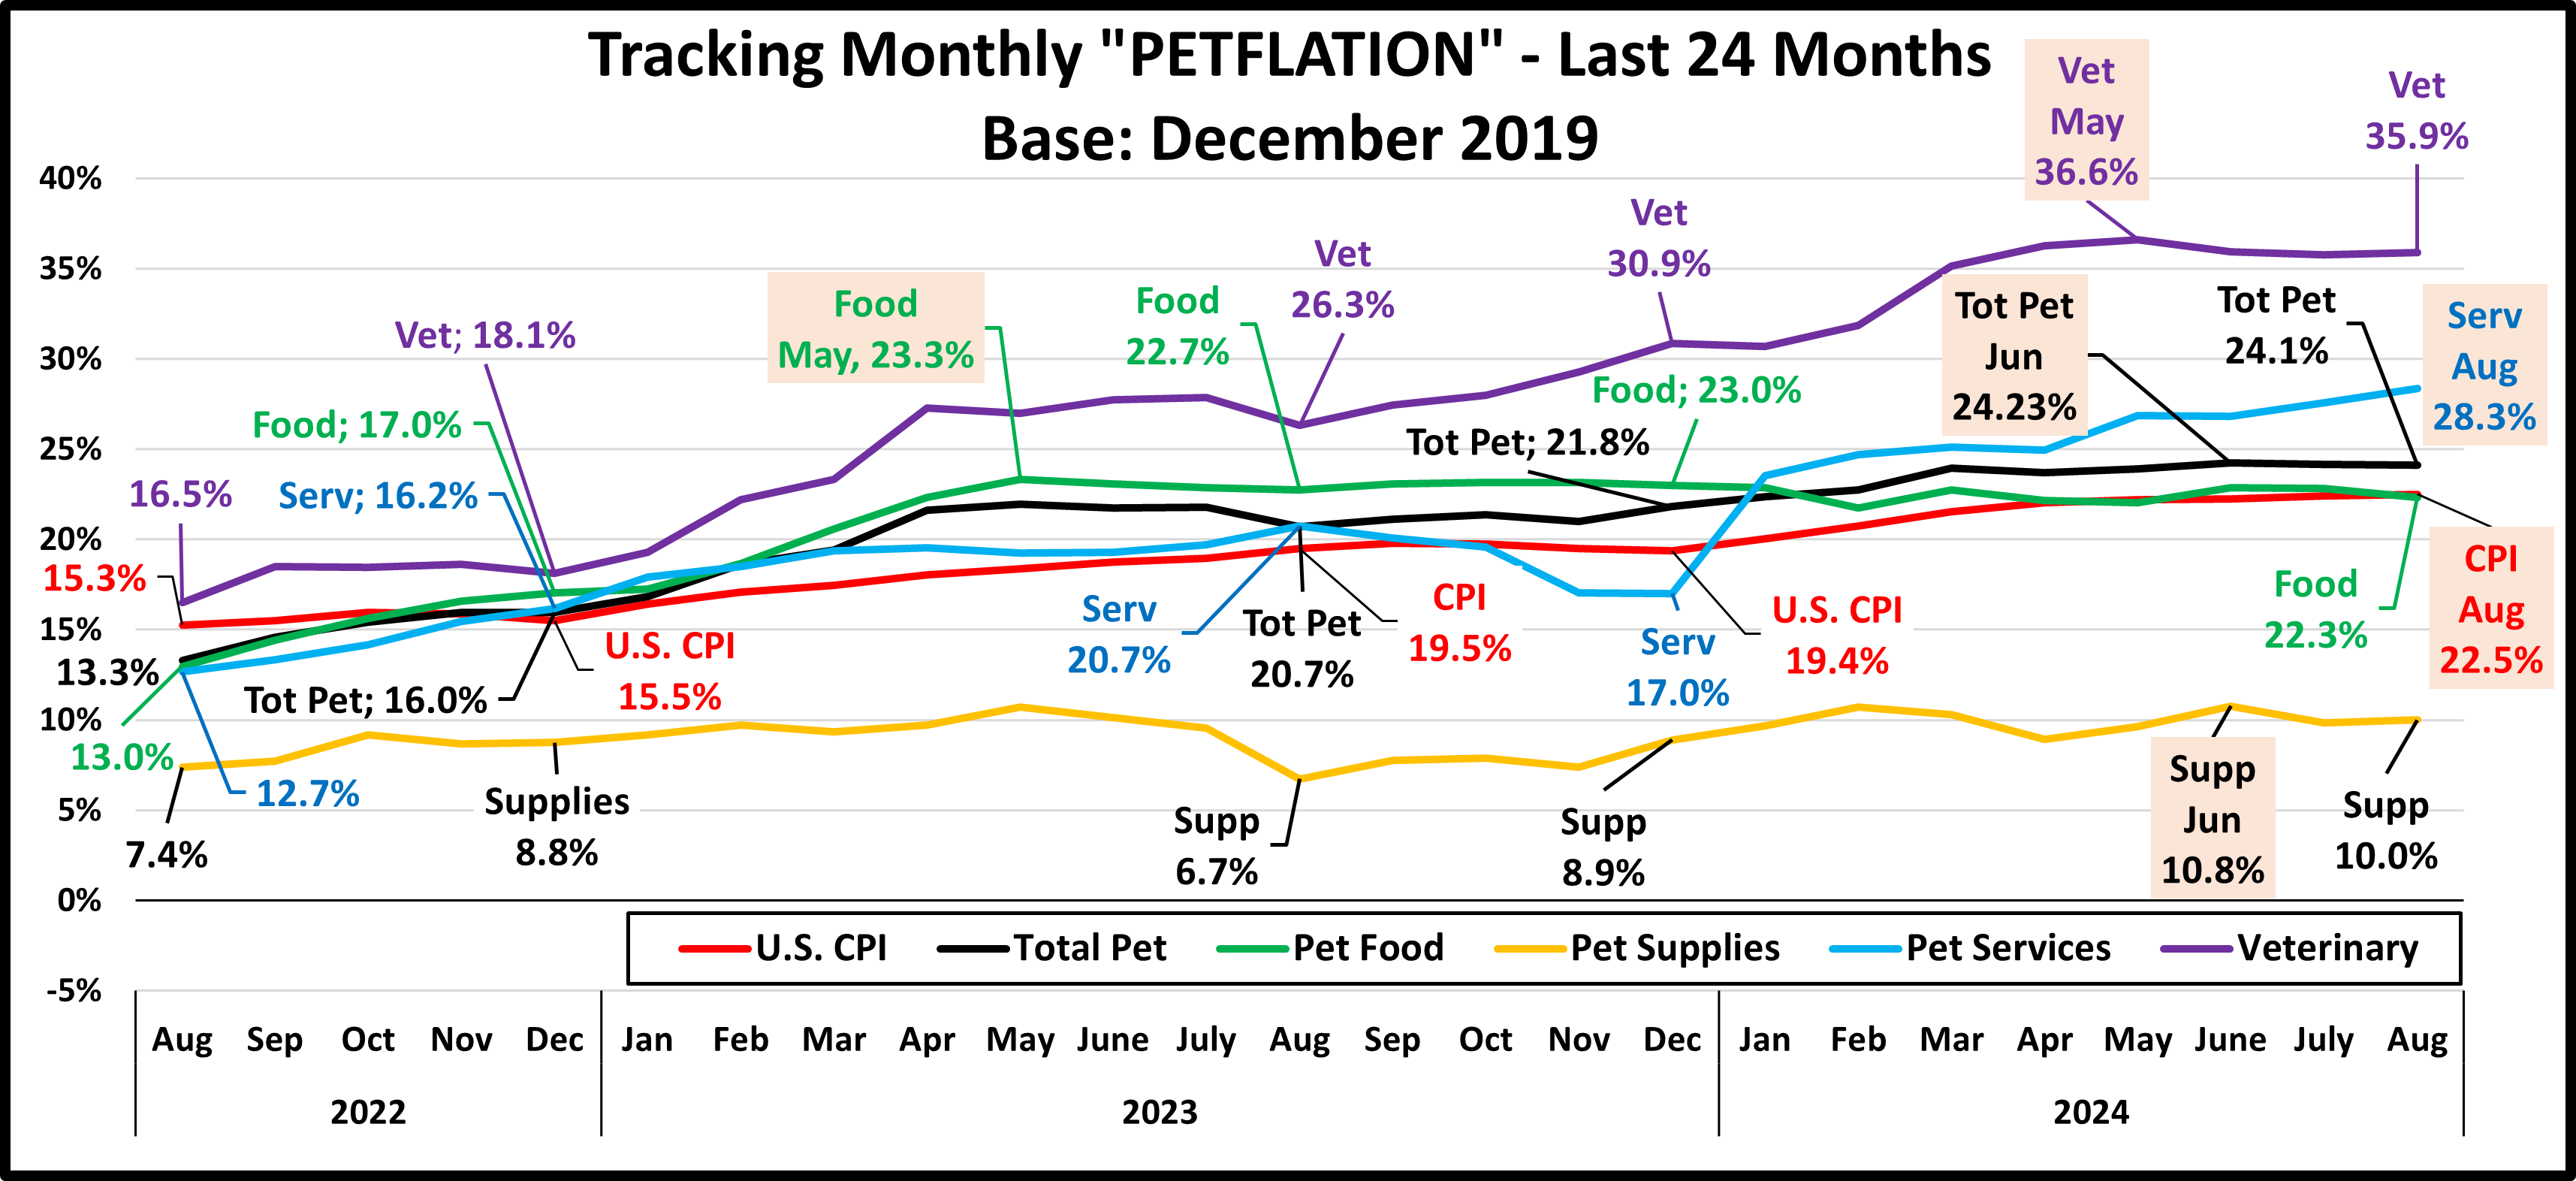
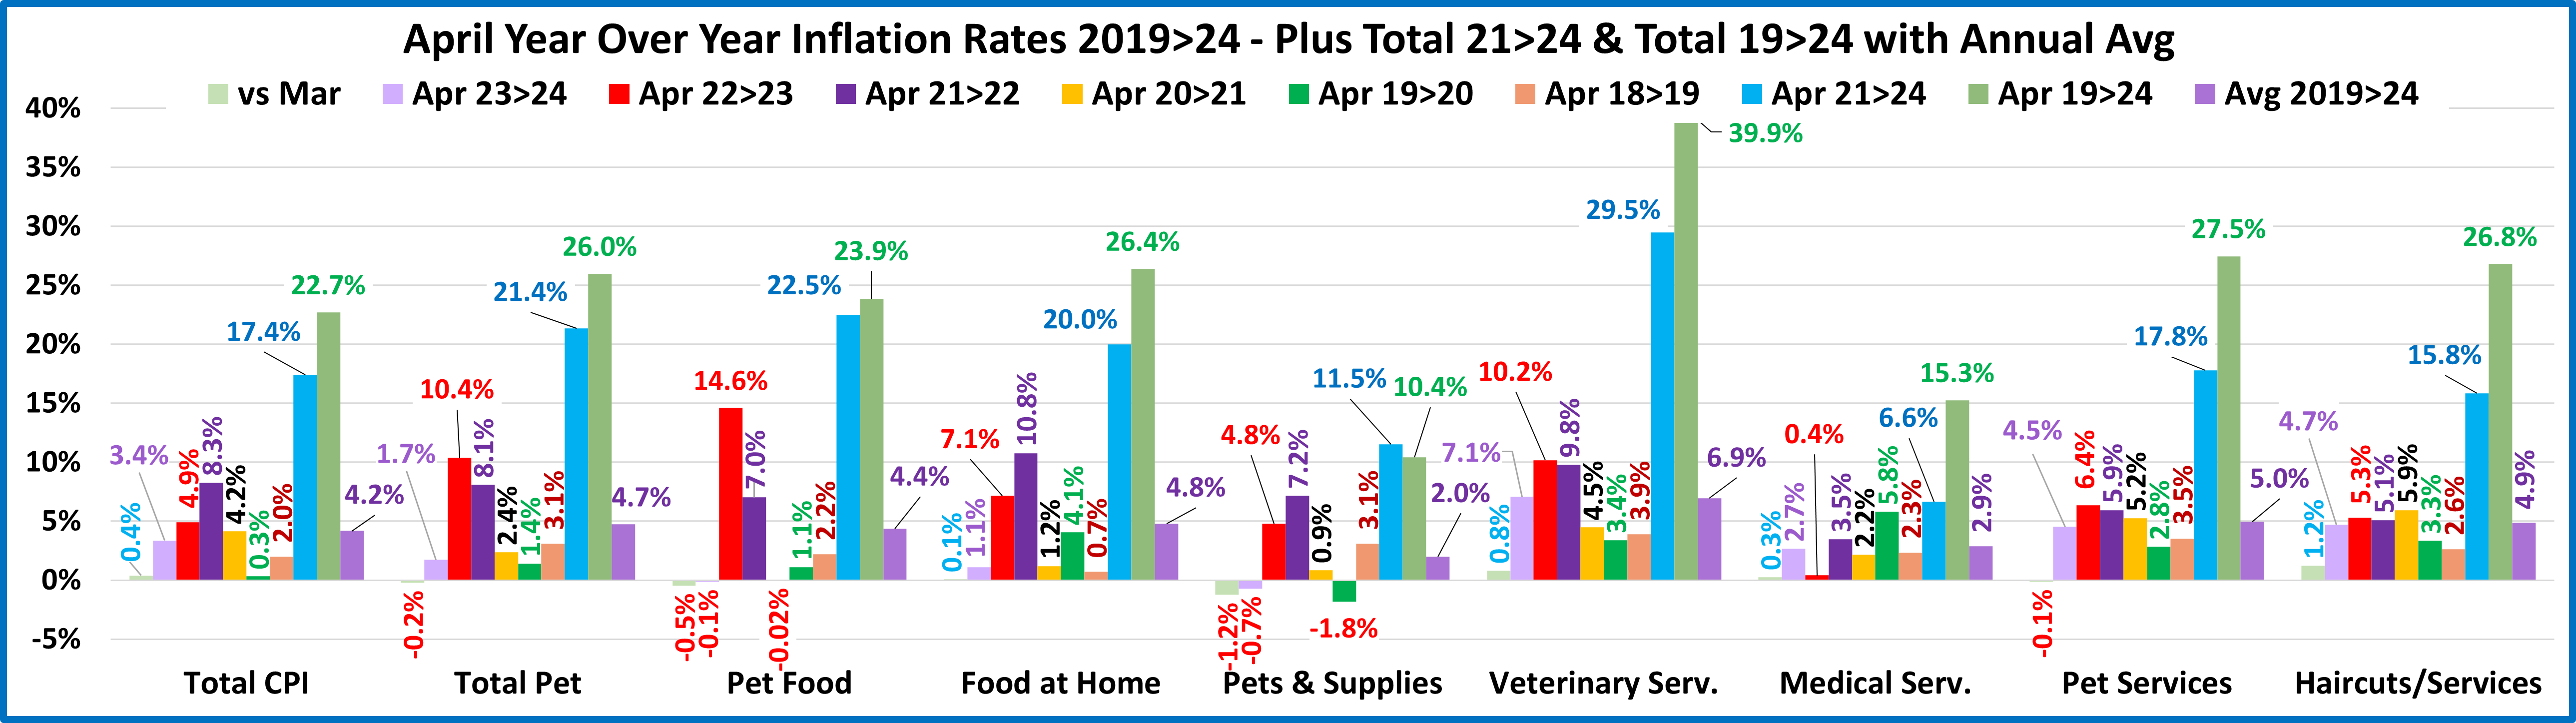
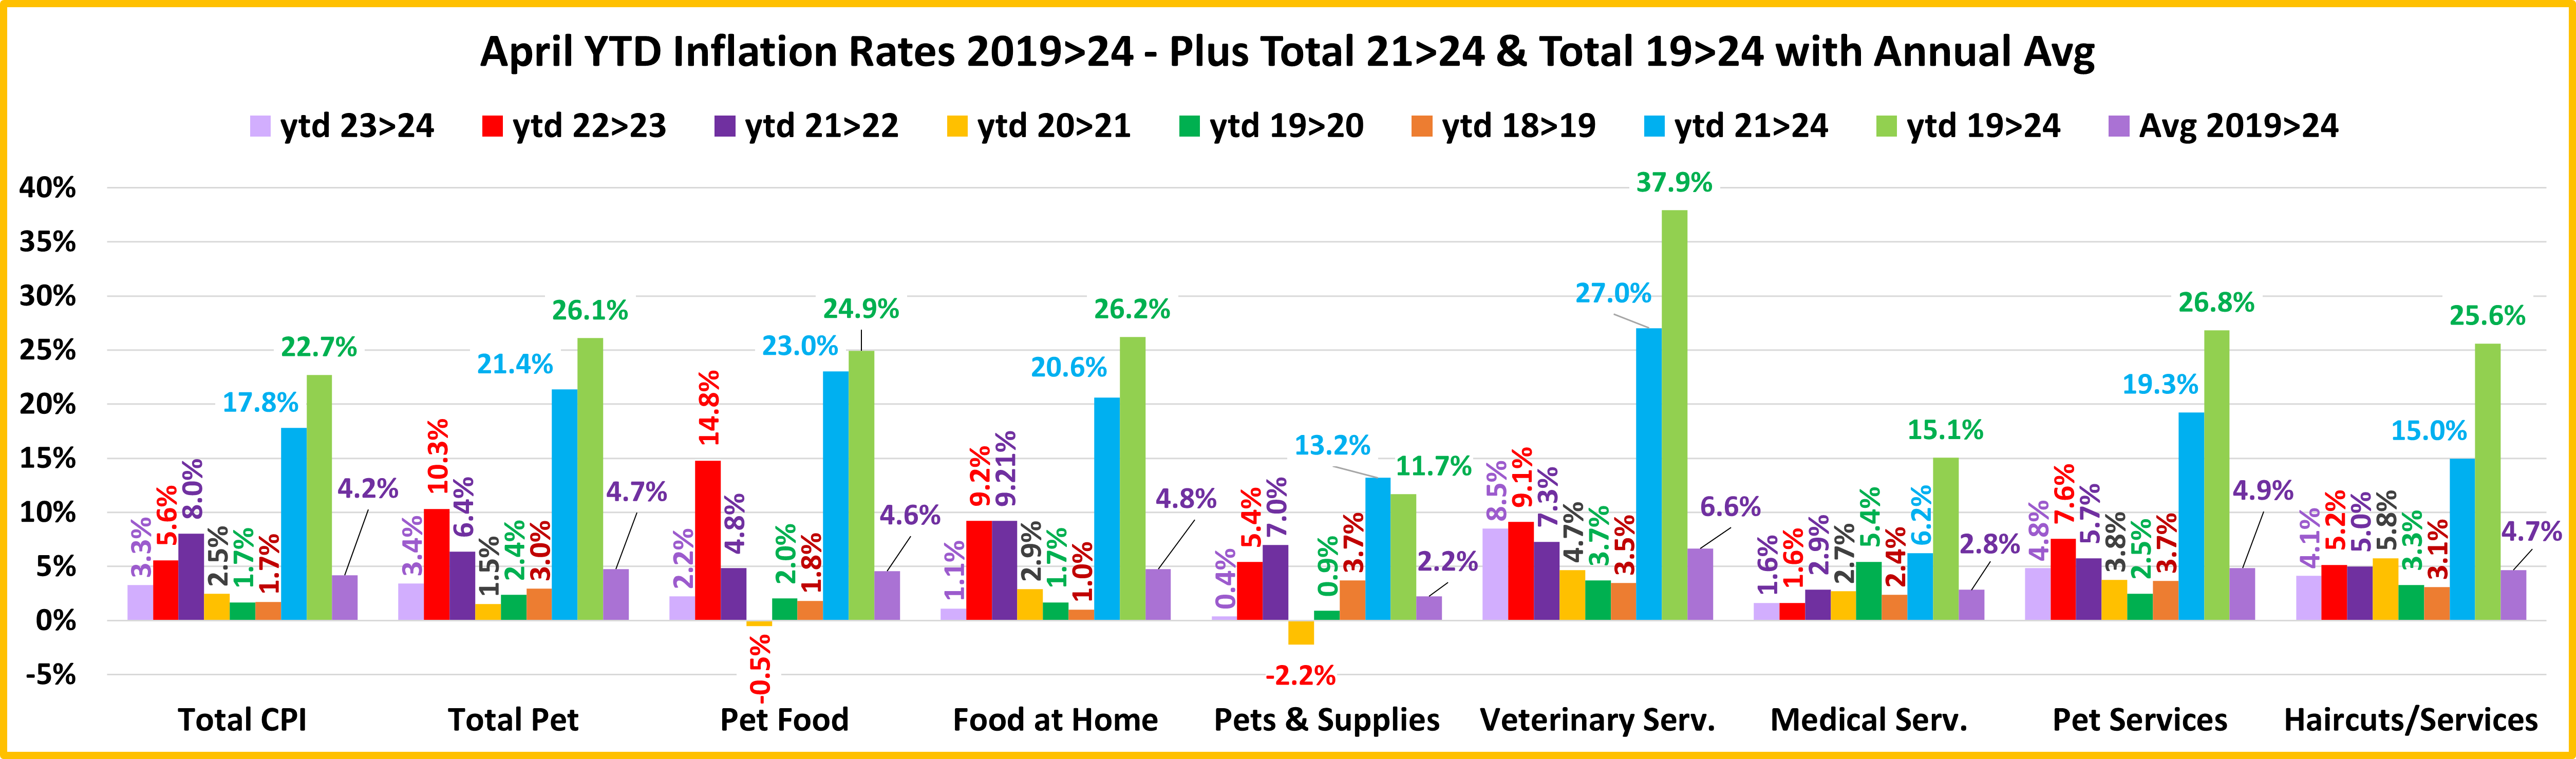
After the post pandemic binge buy in 2021, Supplies spending fell $1.86B (-7.8%) in 2022. This was not surprising after the record $8.65B lift. It is very similar to the binge/bust pattern in Pet Food that occurred a year earlier. Although spending fell by $1.9B, 52% of 96 demographic segments spent more on Supplies. In 2023 spending grew $1.08B (+4.9%) as 65.6% of demographics spent more. There is a key factor to be considered to put 2022>23 Supplies spending in a better perspective. Many Supplies categories have been commoditized, so the segment has been very susceptible to price changes. Prices fell 2016>18 and spending grew by $5B. Prices rose in 2018/19 and spending fell -$4.6B. In 2022 the inflation rate was 7.7%. That means that the amount of Supplies purchased in 2022 was “really” -14.4%, almost double the actual $ drop. In 2023 Supplies spending grew by $1.08B (+4.9%). Annual inflation was 2.6% so the “real” lift was +2.3%. Inflation in the 1st half of 23 was 5.2% and spending was +$1.65B. In the 2nd half the CPI fell to 0.1% but spending was -$0.57B. That is the opposite of what we would expect. Supplies spending is definitely more discretionary, but many products are needed for a better life – both for Pets and Pet Parents. As Supplies spending moves more towards higher incomes, perhaps Pet Parents are becoming less price sensitive in this segment. We’ll see what happens in 2024.