2023 Pet Food Spending was $45.50B – Where did it come from…?
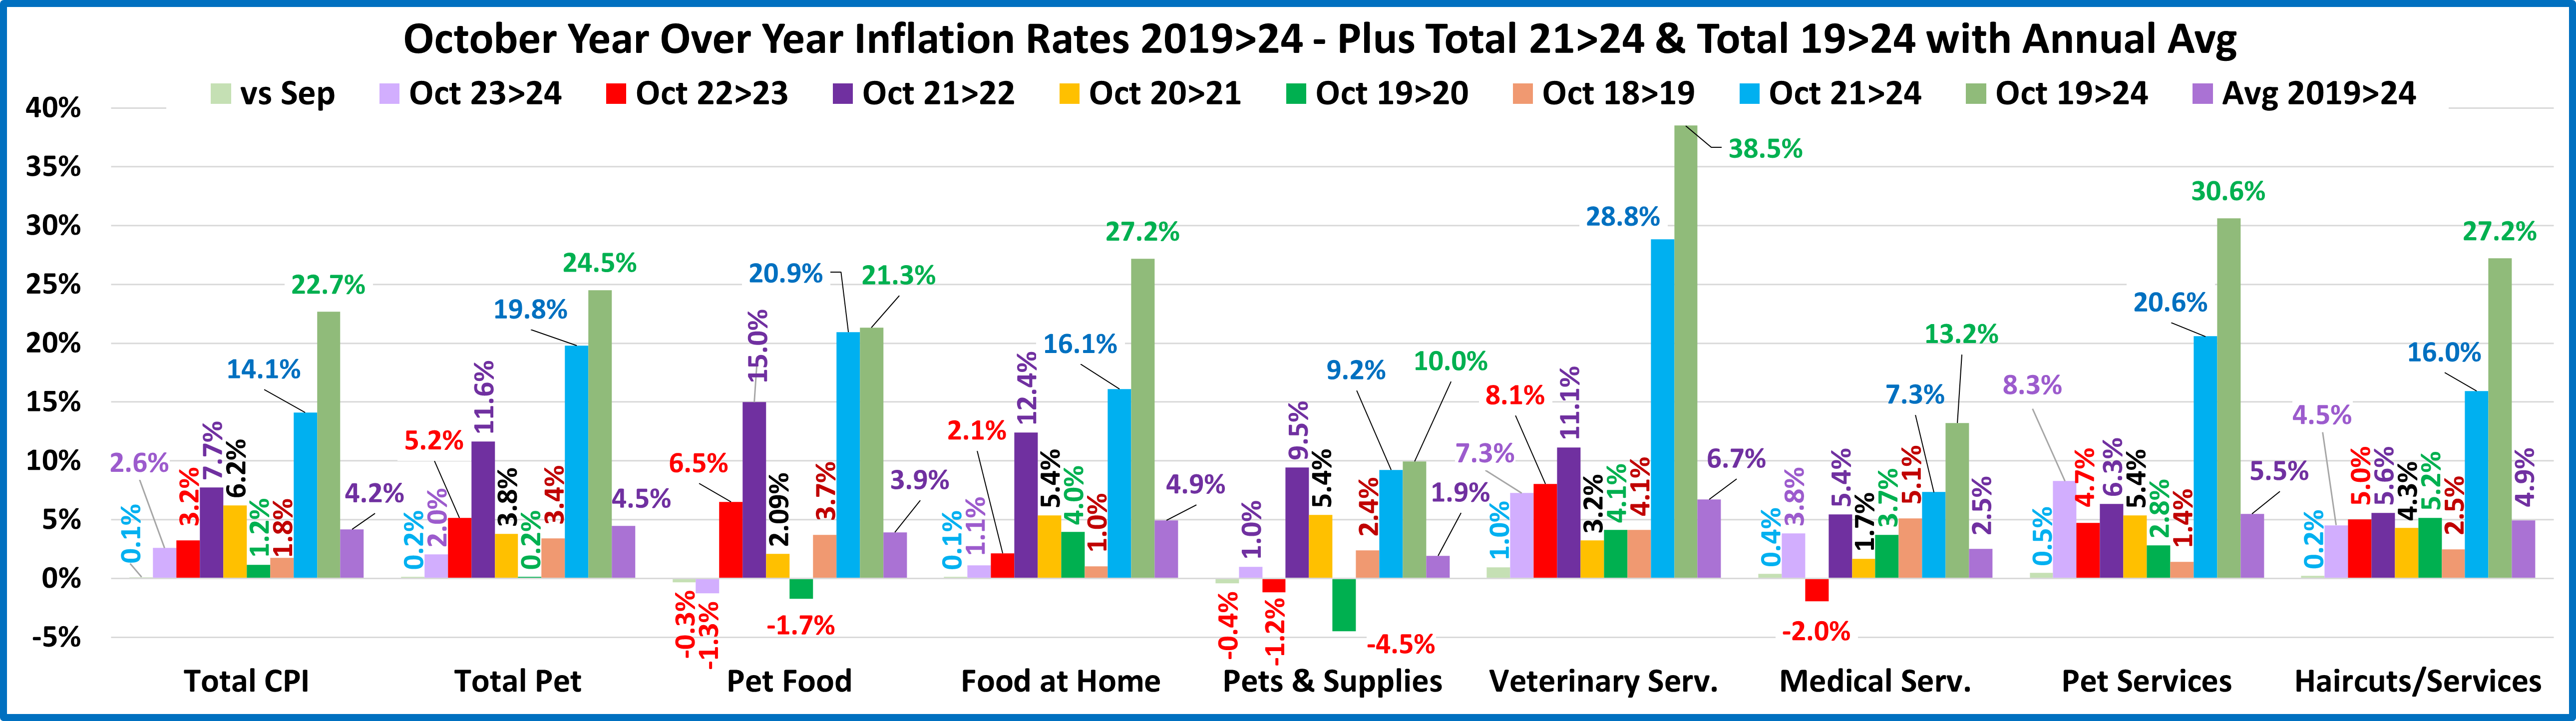
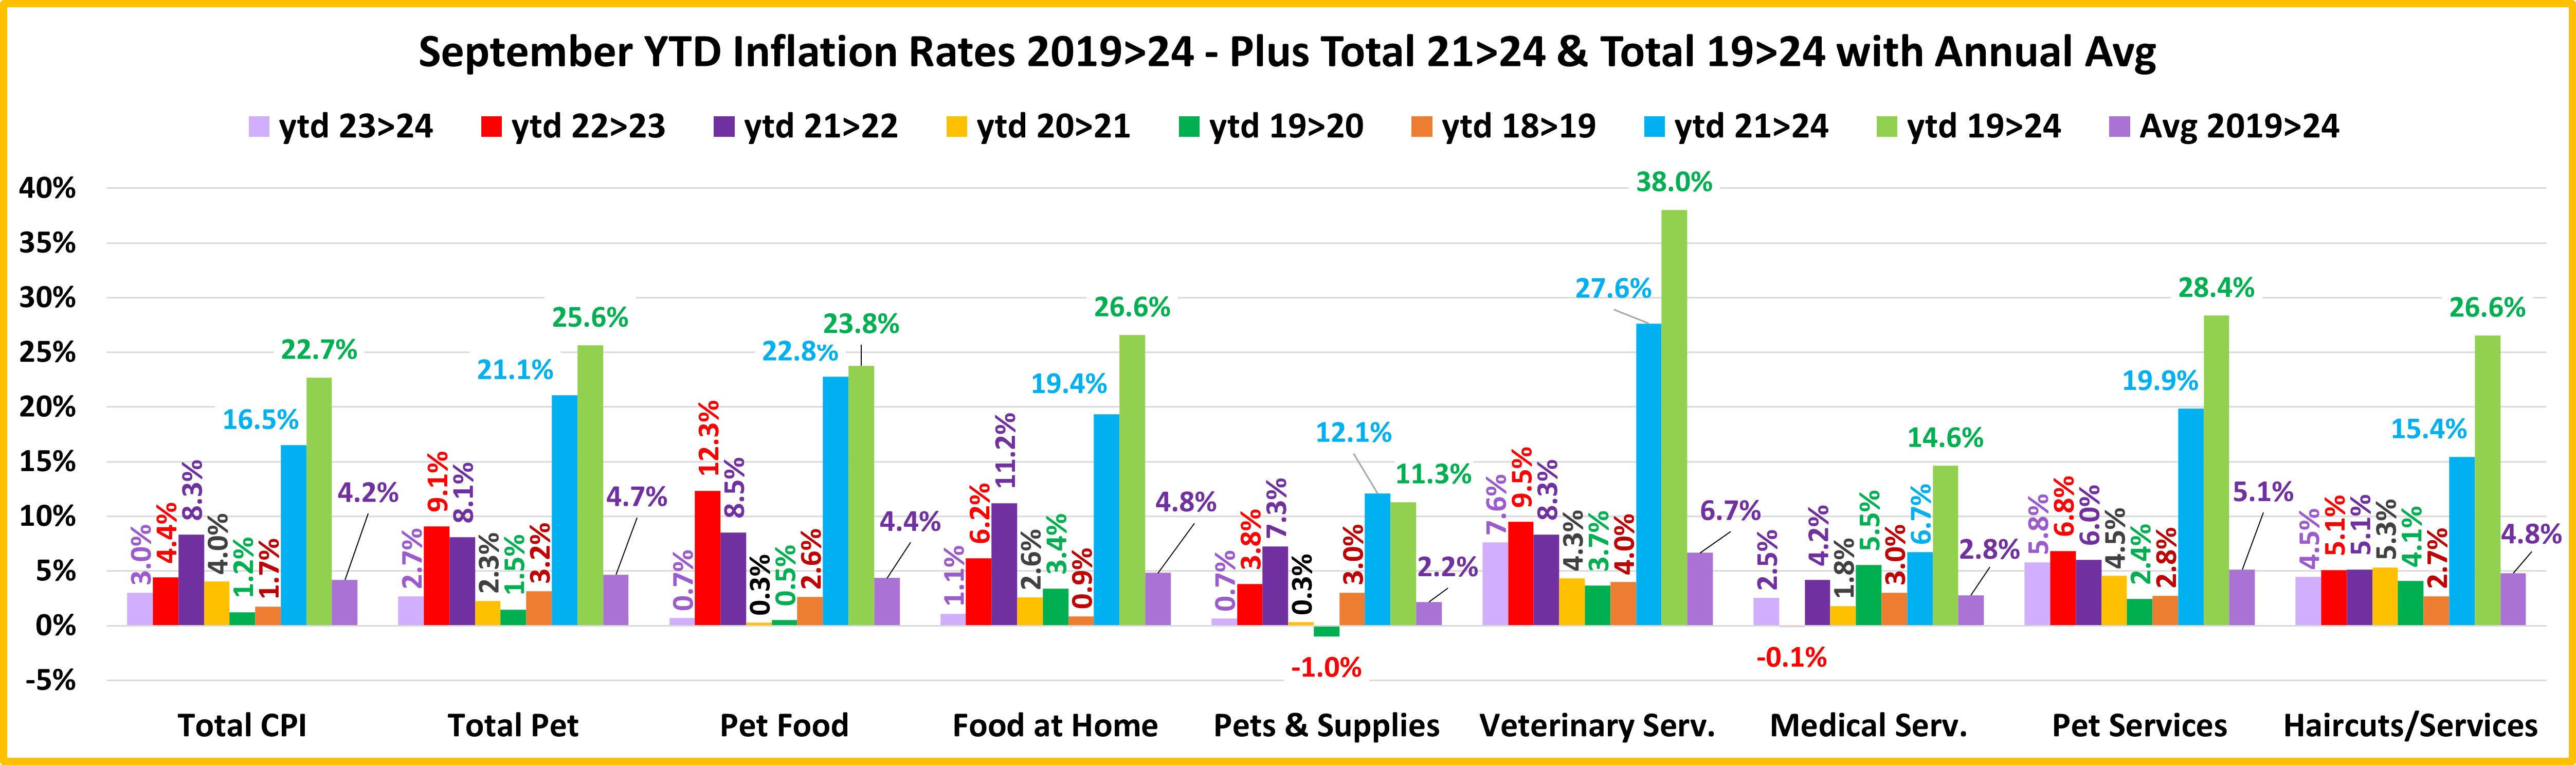
As we continue to drill ever deeper into the demographic Pet spending data from the US BLS, we have now reached the level of individual Industry segments. We will start with Pet Food, the largest and arguably most influential of all. We have noted the trendy nature of Pet Food Spending. In 2018 we broke a 20 year pattern – 2 years up then spending goes flat or turns down. We expected a small increase in 2018 but we got a $2.27B decrease. This was due to the reaction to the FDA warning on grain free dog food. The warning lost credibility and spending rebounded in 2019, +$2.35B. In 2020 the market was hit by a bigger outside influence – the pandemic. In Pet Food, it created a wave of panic buying, resulting in a $5.65B lift. The panic buying was over so spending fell -$2.44B in 2021. In 2022 spending returned to more “normal” behavior with a strong $4.29B, +12.5% increase to $38.69B. In 2023, spending skyrocketed with a record $6.81B (+17.6%) lift and reached $45.5B. Note: With 10.6% inflation, the lift was really only 6.3%. Let’s take a closer look.
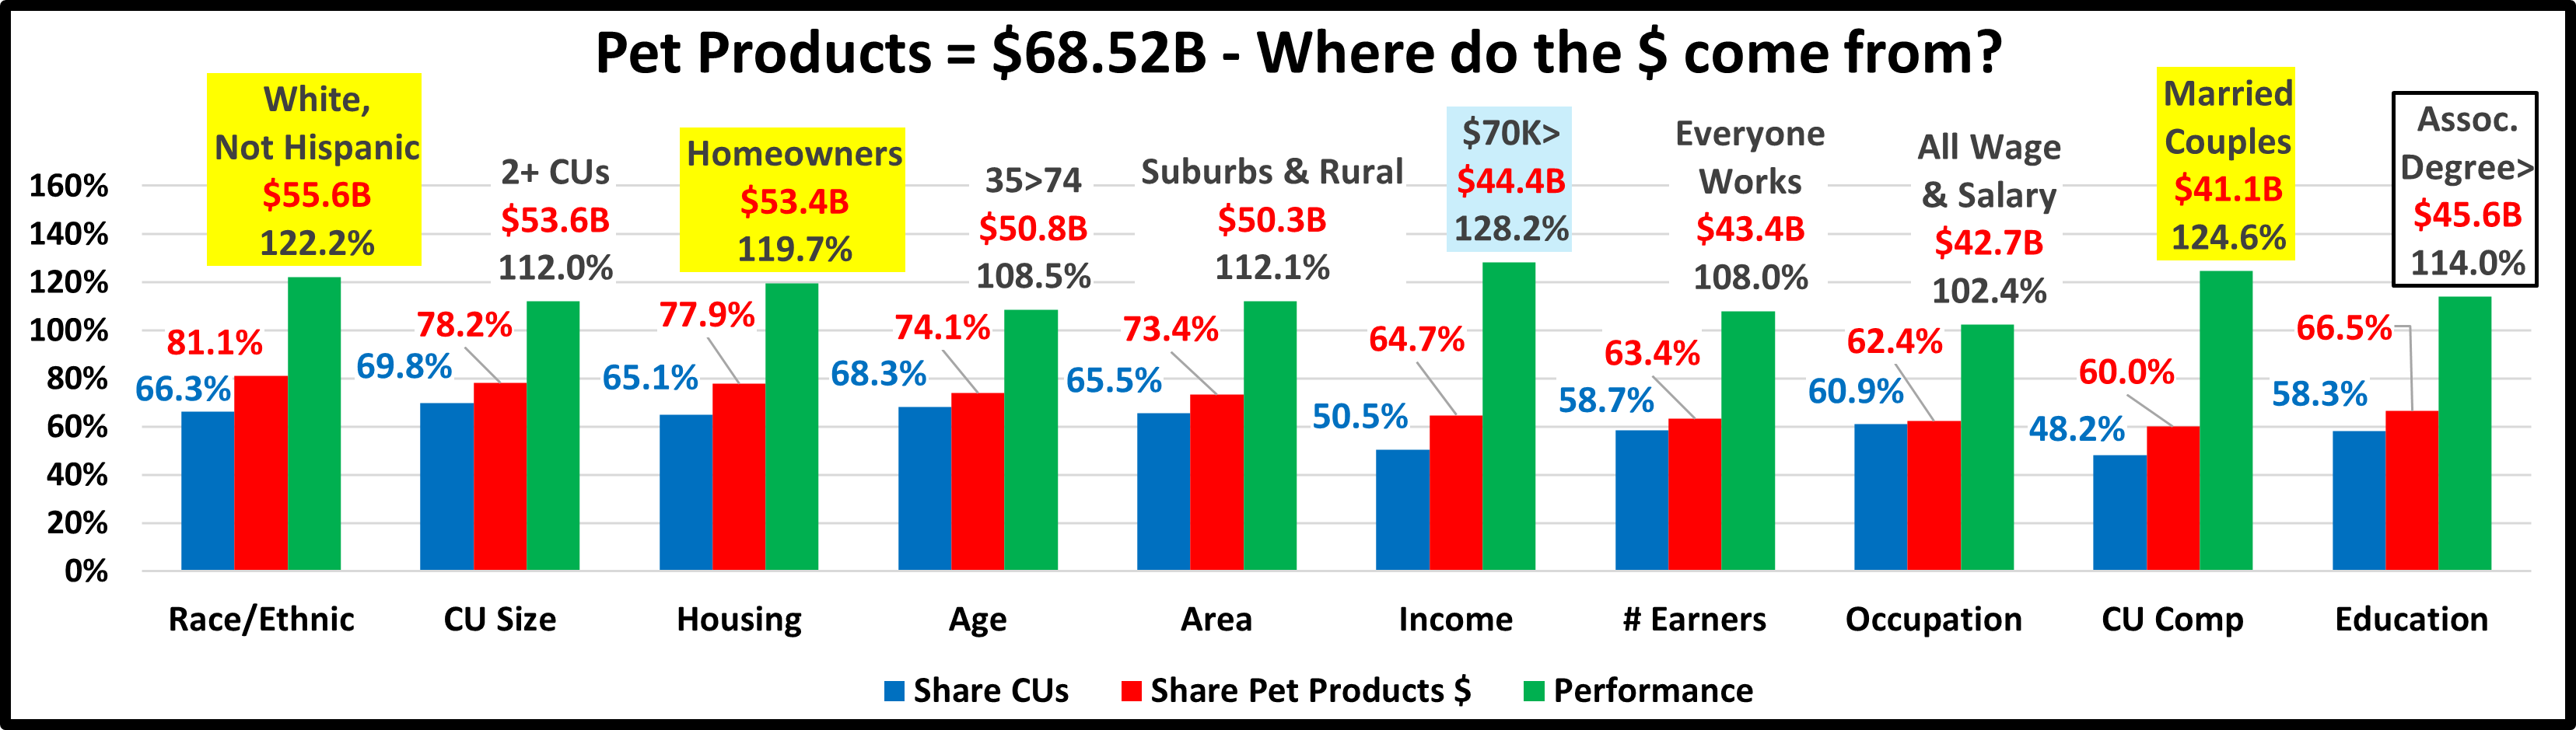
First, we’ll see which groups were most responsible for the bulk of Pet Food spending and the $6.81B increase. The first chart details the biggest pet food spenders for each of 10 demographic categories. It shows their share of CU’s, share of pet Food spending and their spending performance (Share of spending/share of CU’s). All but Education are the same as Total Pet. It was expanded to reach the 60% goal, which was unreachable for Food in 3 categories. The categories are presented in the order that reflects their share of Total Pet Spending. The big difference is that $70K> income has the smallest share of Food $. This difference is magnified in performance. Being Married is the most important factor in Food spending. In Total Pet and other segments, Income is the most important. Food spending is also more balanced than Total Pet Spending. This is evident by the fact that the Performance of only 3 groups exceeds 120%. In Total Pet there were 5 and Pet Products had 4. In 2023, Pet Food accounted for 66.4% of Pet Products $ and 38.7% of Total Pet, up from 63.8% and 37.7% in 2022. Pet Food is the largest segment but its importance to the Pet Industry is still growing.
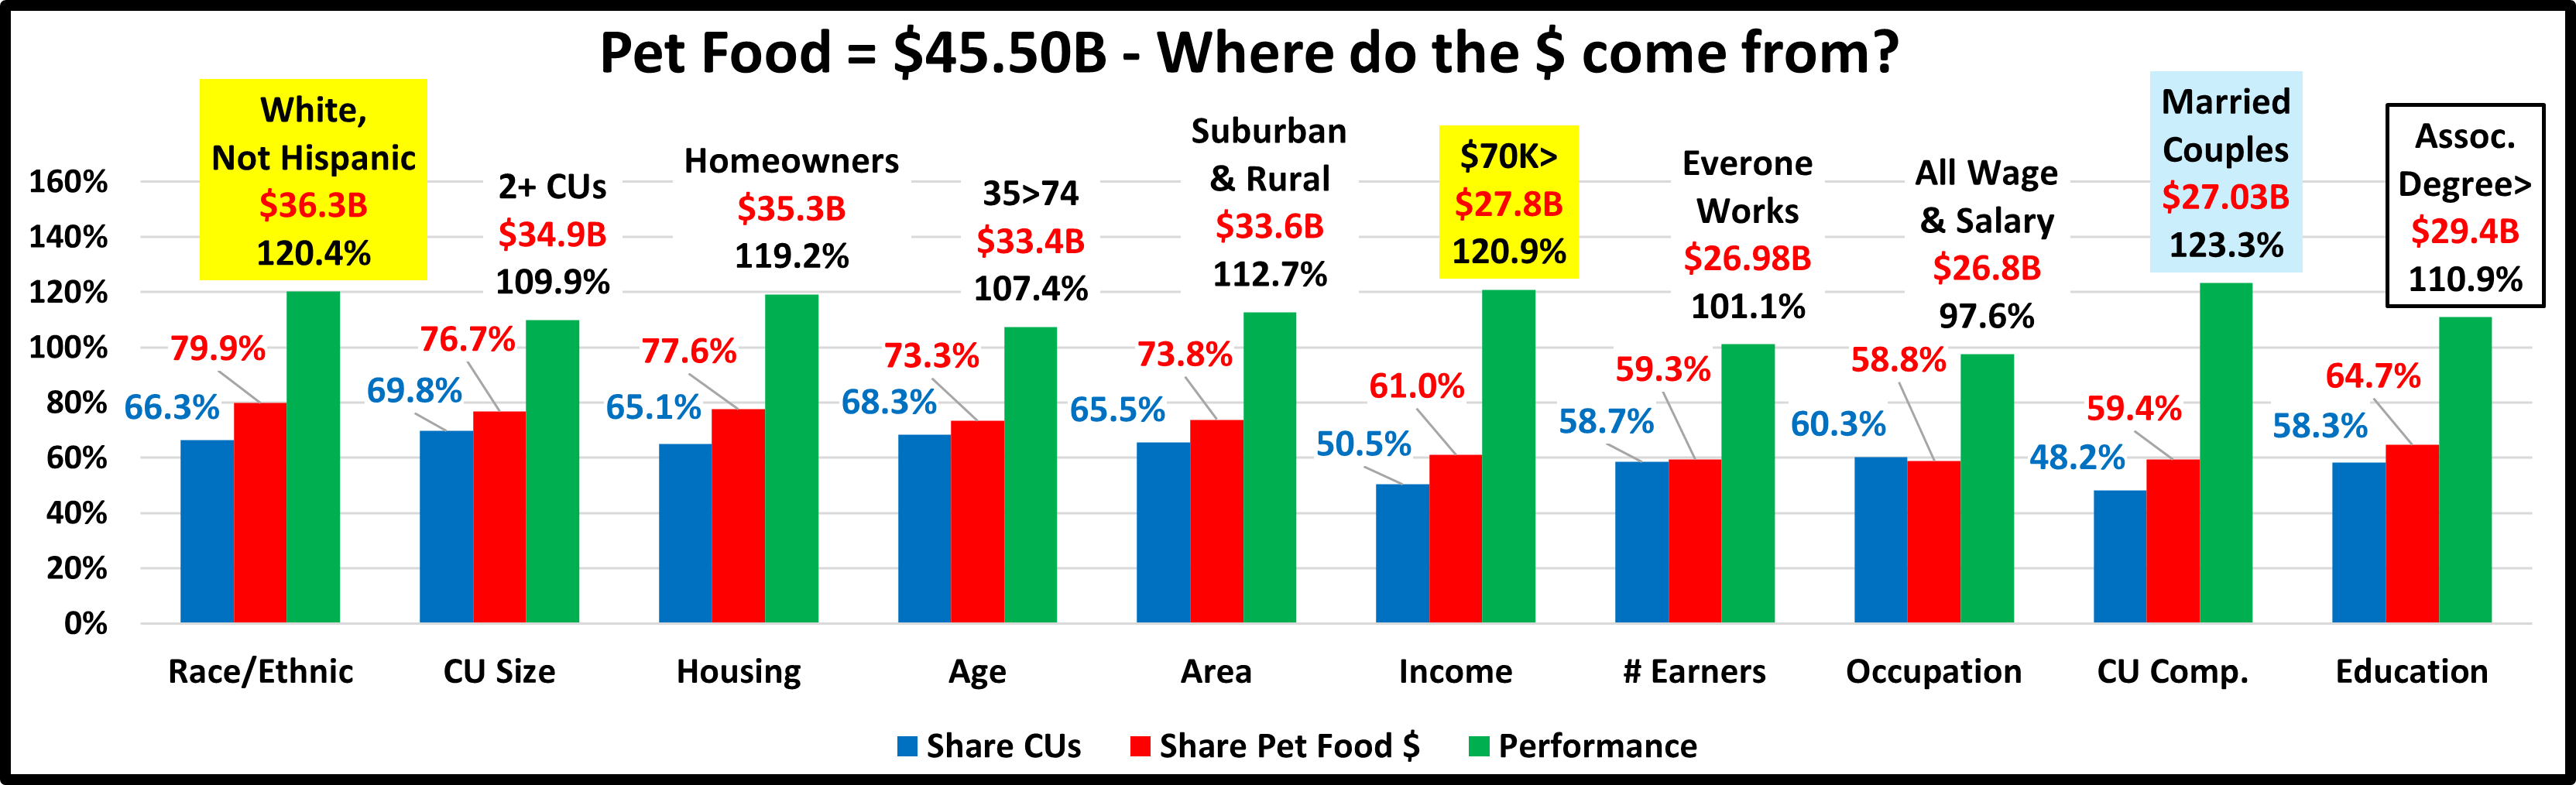
- Race/Ethnic – White, not Hispanic (79.9%) – down from 83.4%. This large group accounts for the vast majority of spending in every segment. They lost share and their performance decreased to 120.4% from 124.1%, but this category stayed #3 in terms of importance in Pet Food Spending demographic characteristics. Hispanics, African Americans and Asians account for 33.7% of U.S. CU’s and they now spend 20.1% of Pet Food $, up from 16.6% in 2022. All groups had double digit % increases. Hispanics and African Americans both spent over $1.2B more.
- # in CU – 2+ people (76.7%) – down from 80.2%. The share of market fell for 2+ CUs and is again well below 80% for Pet Food. Their performance also dropped from 116.3% to 109.9% and their rank fell from #6 to #7. All CUs spent more. In the 2+ group, 2 & 3 People CUs spent $3.5B more while the combined lift for 4 & 5+ CUs was only $0.36B. Singles led the way with a $2.96B, +38.8% increase in Food spending. This caused the drops in share & performance.
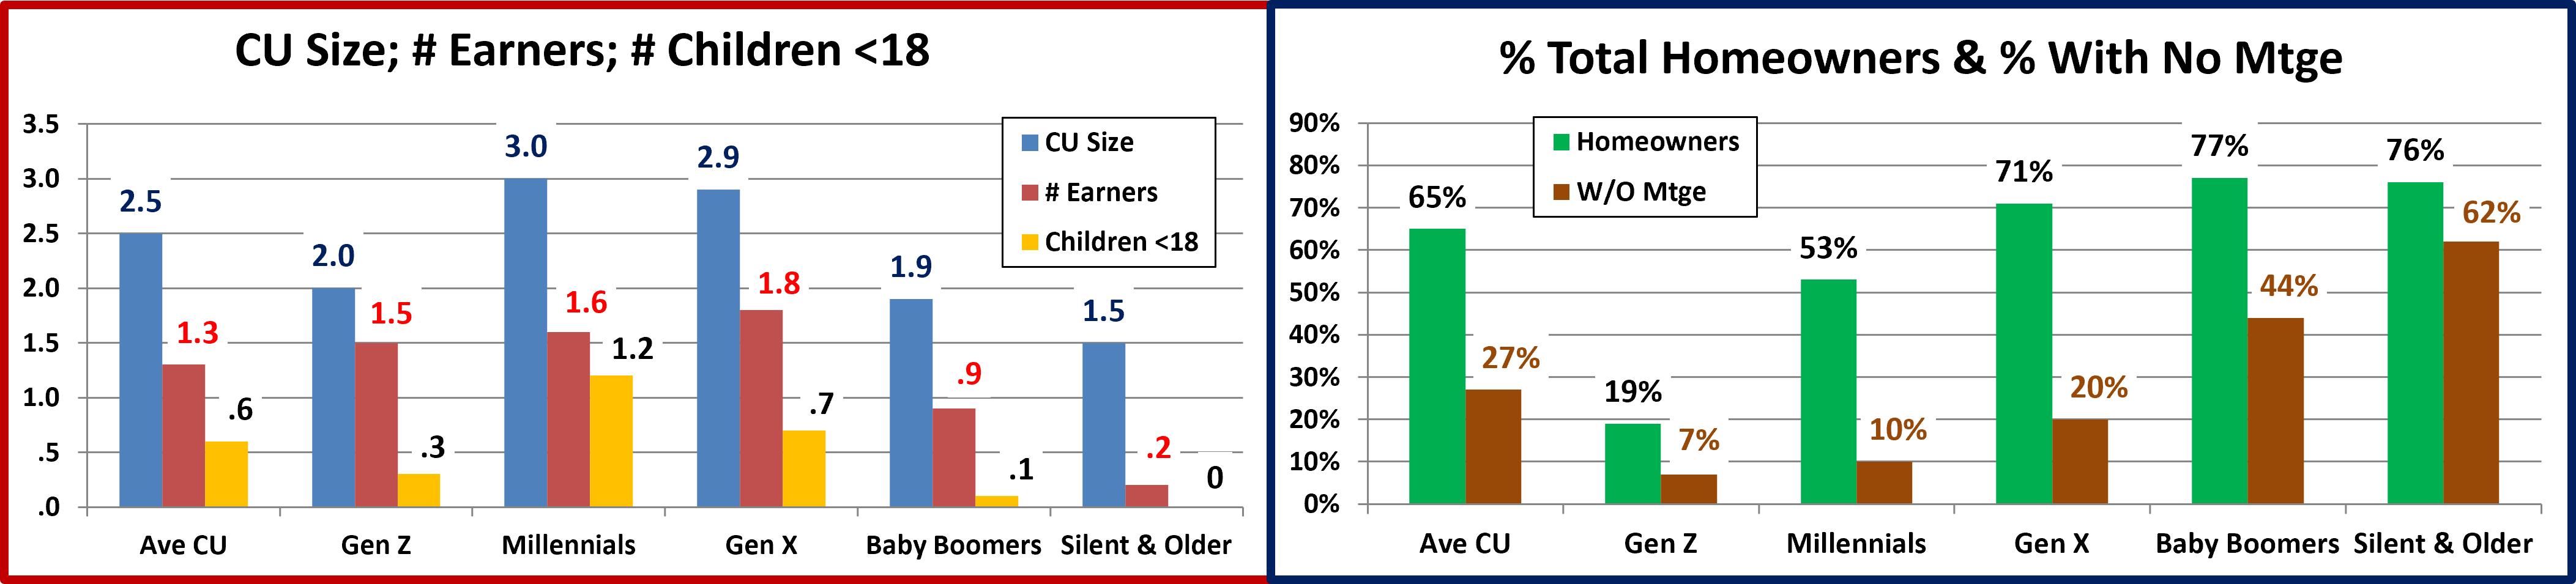
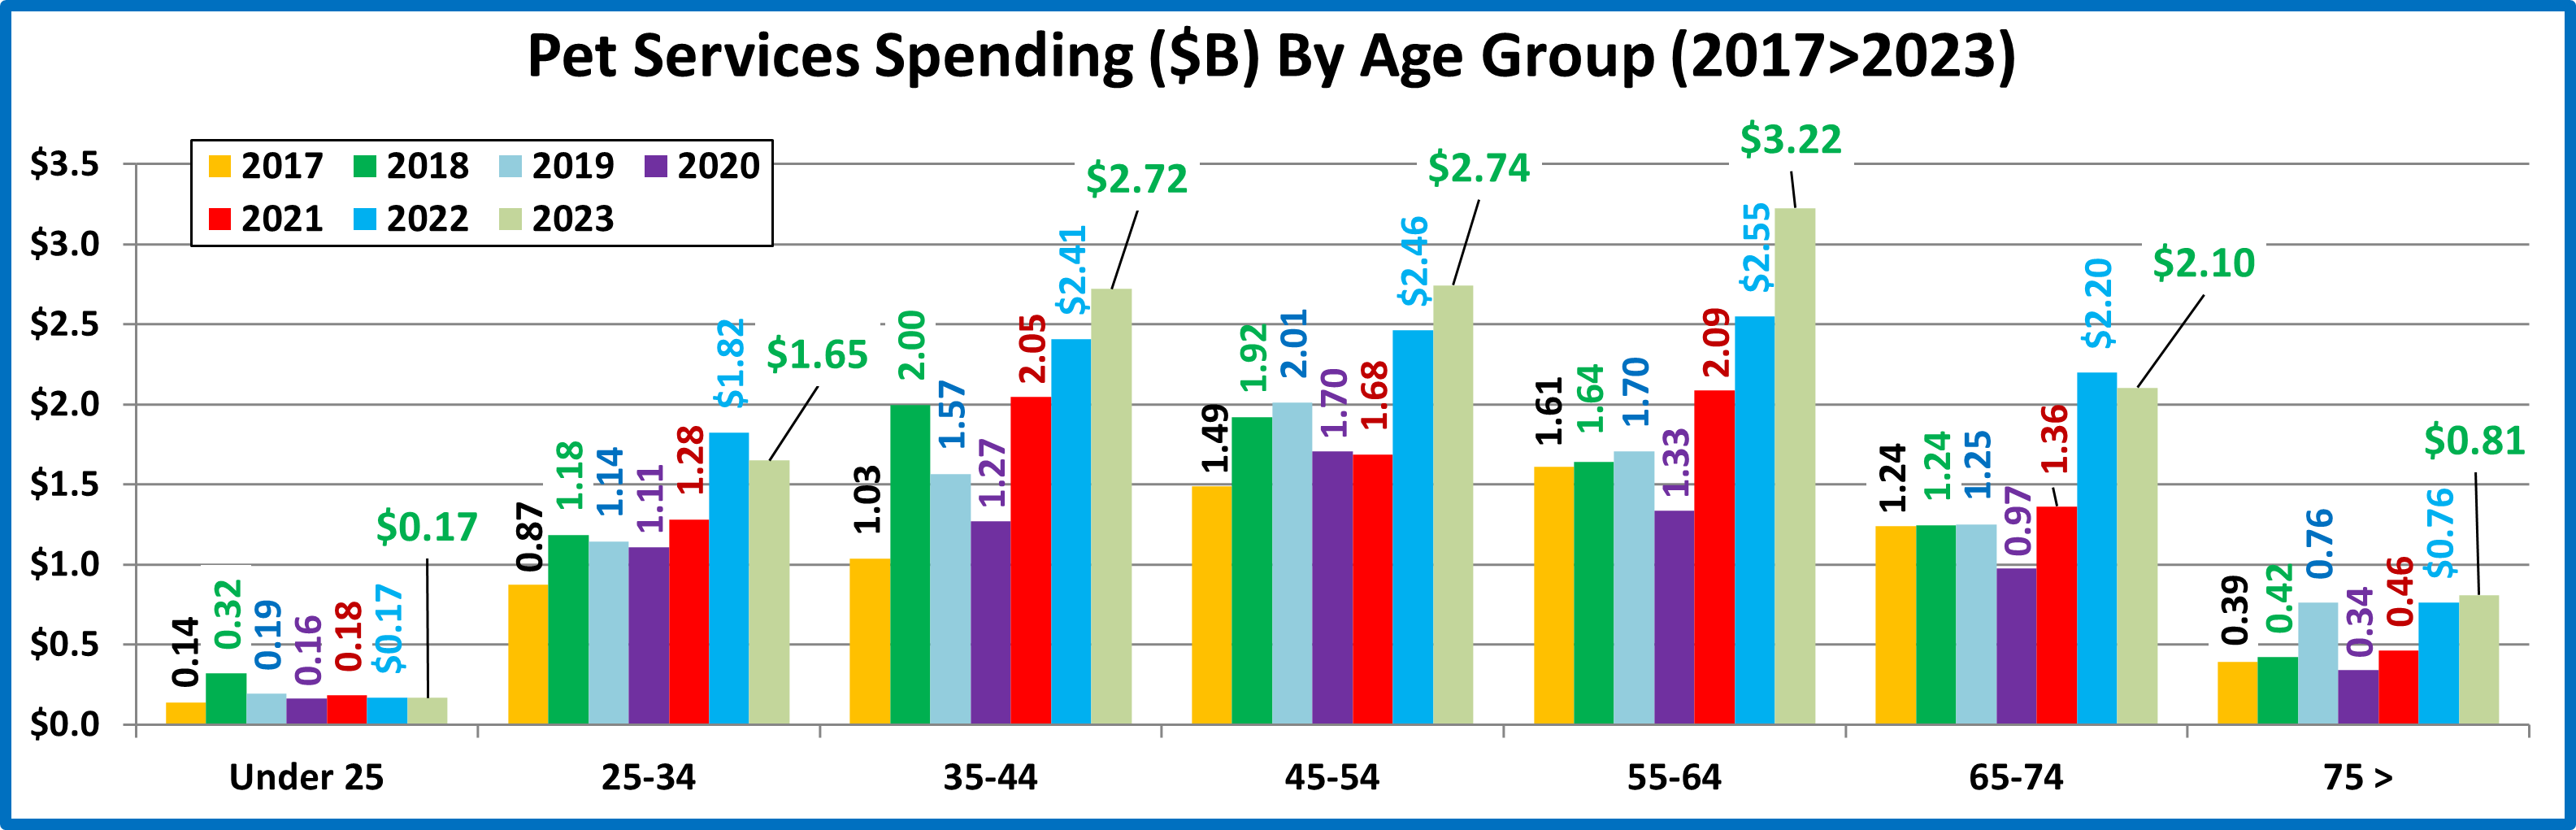
- Housing – Homeowners (77.6%) – down from 80.8%. Homeownership is a huge factor in pet ownership and pet spending. In 2023, homeowners lost share and their performance fell from 124.1% to 119.2%. They dropped out of the 120% club and fell from 3rd to 4th in importance. All segments had double digit % lifts. However, Renters were up +36.9%. Homeowners were only +13.0%. The $2.74B lift by Renters caused the drops for Homeowners.
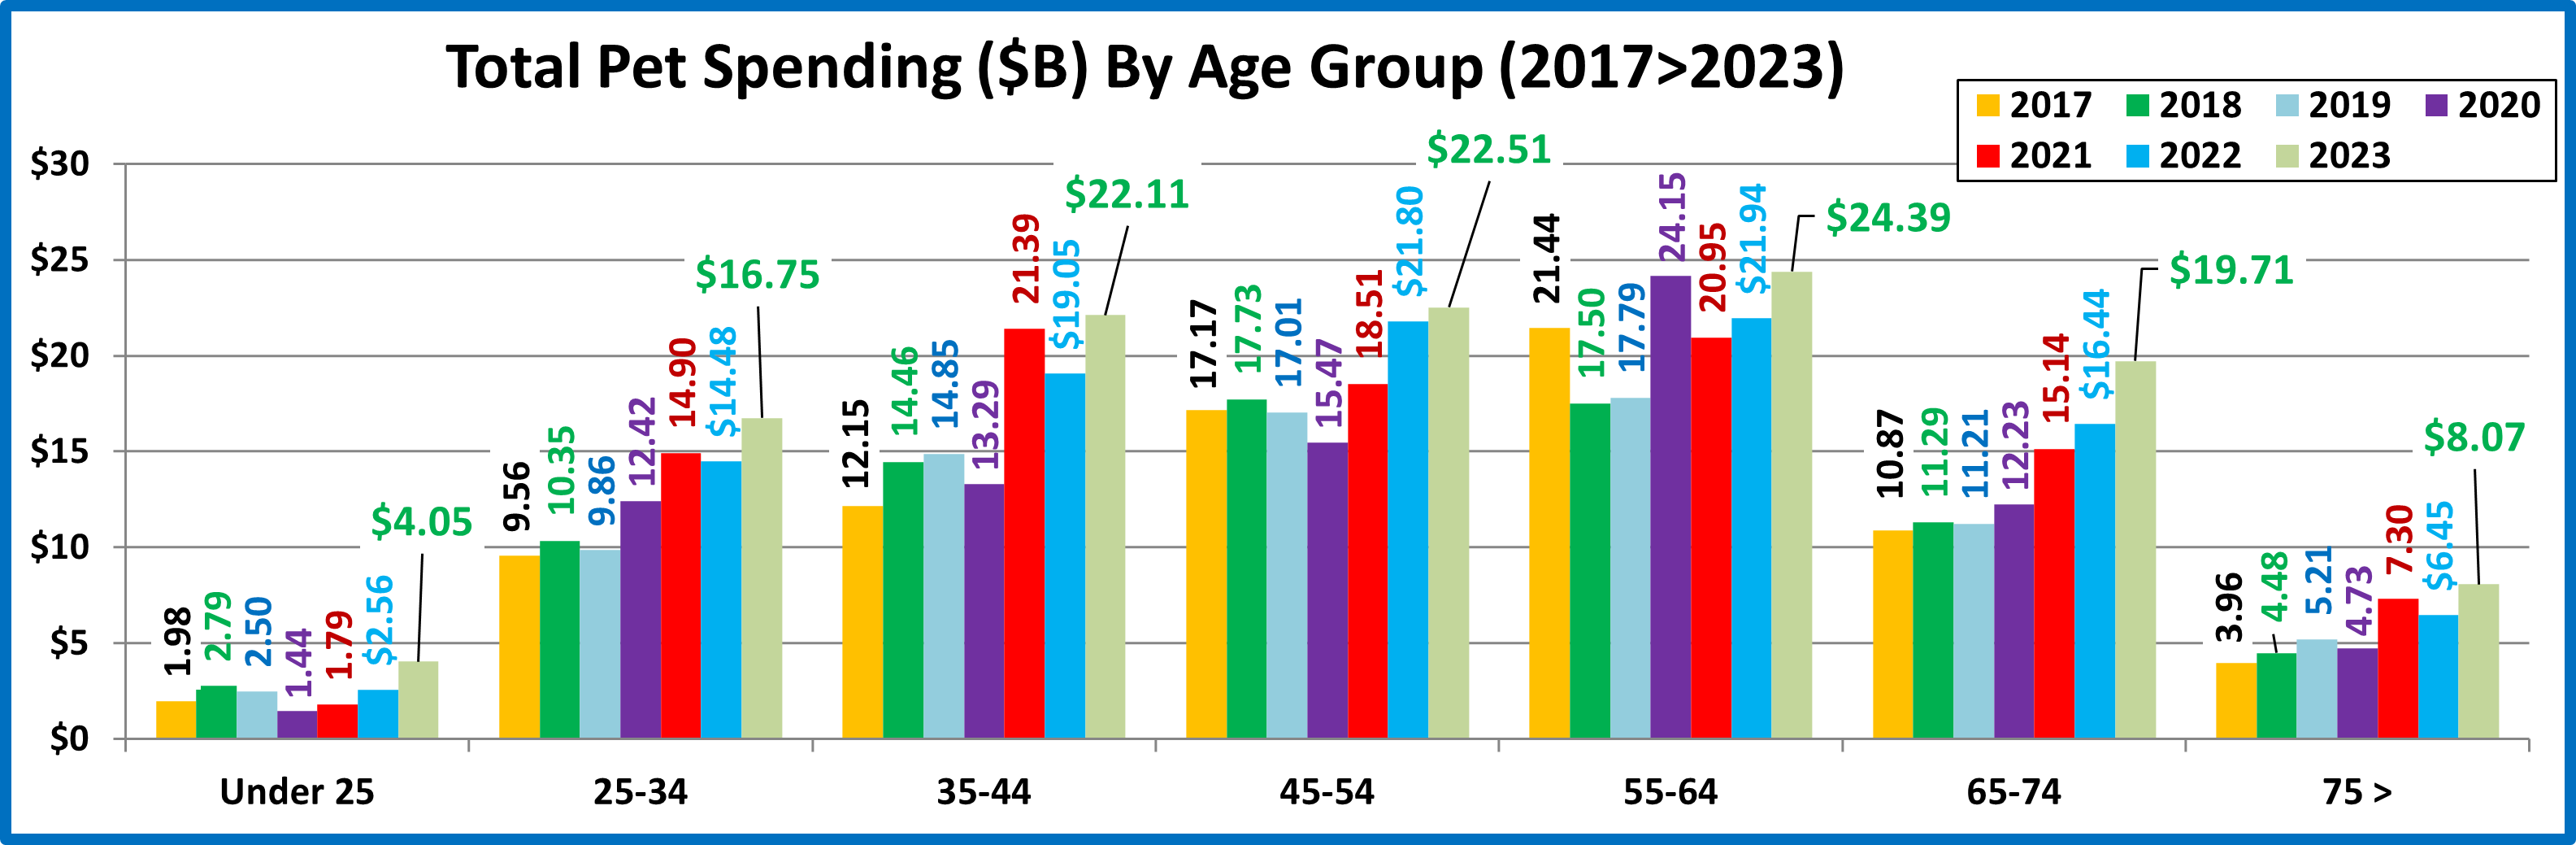
- Age – 35>74 (73.3%) – down from 78.3%. This expanded group is another indicator of increasing balance. Their performance fell from 114.5% to 107.4% and age dropped from #5 to #8 in importance. All but 45>64 spent more. Pet Food Share by Age: 25>34: 15.0%; 35>44: 18.5%; 45>54: 16.4%; 55>64: 18.6%; 65>74: 19.8%. Very Balanced!
- Area – Suburban + Rural (73.8%) down from 74.1%. Their performance fell from 113.1% to 112.7%. but their importance grew to #5, from #8. All segments spent at least $1.86B more. The Suburbs had the biggest $ lift, +$3.09B but Center City had the highest percentage, +18.5%. Overall, the lift was very balanced.
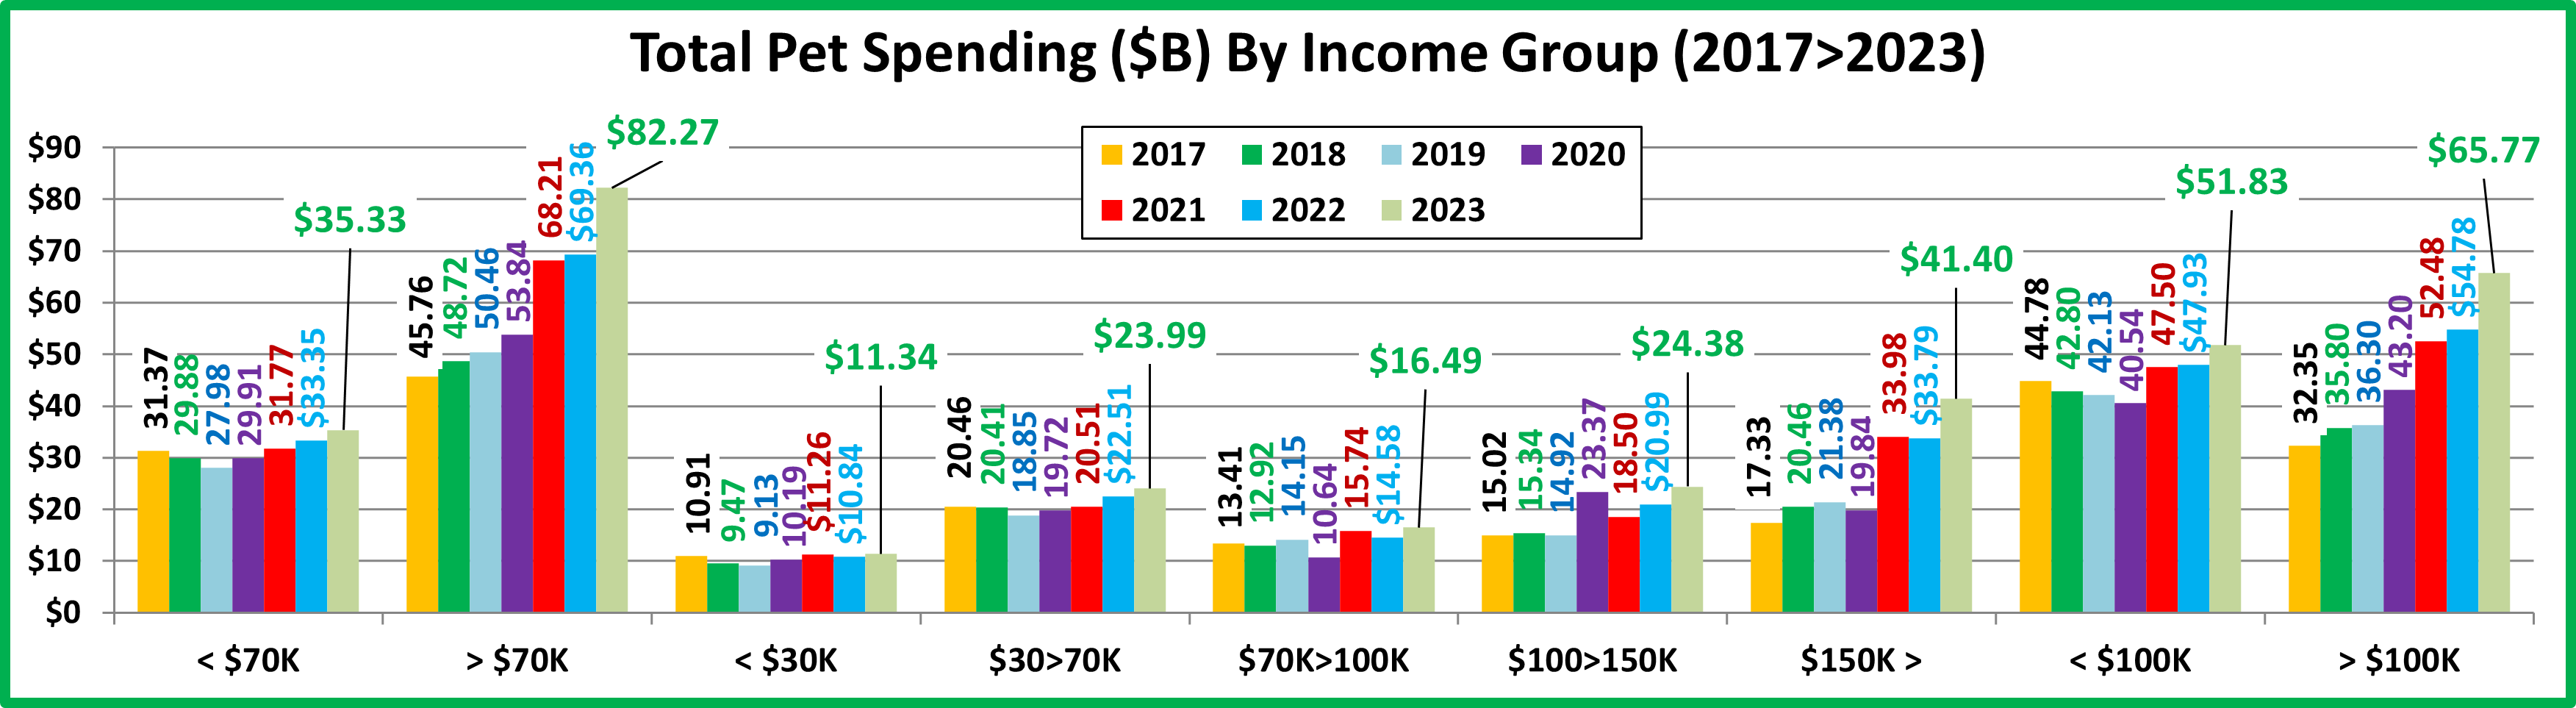
- Income – Over $70K (61.0%) – up from 60.5%. Their performance dropped from 127.9% to 120.9% but they stayed 2nd in importance. High income is still very important in Pet Food Spending but is not at the top of the list. The 50/50 $ divide rose slightly from $91K in 2022 to $93K in 2023 but it is still 9% below the average CU income. Only $40>49K & $50>69K spent less (Total: -$1.22B) but the 2 biggest lifts came from the 2 lowest income groups. <$30K led the category with a $1.89B lift but $30>39K was a close second, +$1.74B. All groups with an income over $70K and now $30>39K perform at 100+%. Prices are high but Food is so important that many low income CUs find the $.
- # Earners – “Everyone Works” (59.3%) – down from 62.9% and their performance also decreased from 107.8% to 101.1% but they stayed 9th in importance. No Earner CUs were up over 36%. 3 Earner CUs spent less and 2 Earner CUs were only +9.5% (less than inflation). Together, these factors drove the drop in share & performance.
- Occupation – All Wage & Salaried Workers (58.8%) – down from 62.4% – The group’s performance fell below 100% from 103.4% to 97.6%. Occupation is again last in importance. Mgrs/Prof and A/O, Unemployed spent less. Retirees were +48.6%. Self-Employeed: +32.4%. This combination caused the group’s drops in share & performance.
- CU Composition – Married Couples (59.4%) – down from 61.3%. They lost share and their performance fell from 128.3% to 123.3%, but they stayed #1 in importance. All Married CUs spent more but their lift was only 14.0%. Singles and Unmarried, All Adult CUs spent $4.22B, +32.6% more. This caused the Married Group’s drops.
- Education – Assoc. Degree> (64.7%) – down from 66.6%. Performance fell from 115.4% to 110.9% but higher education moved up from 7th to 6th in importance. Associates spent less and Adv Degrees were only +9.6% (less than inflation). Other HS Grads had a great year, +$3.38B, +20.5%. This caused the drops in share and performance.
All of the big spenders for Pet Food but Education are the same as Total Pet. 2022 brought a return to a more normal spending pattern. In 2023 we had a record lift that was widespread and more balanced. This is best illustrated by the fact that in 2023 the performance for only 3 groups exceeds 120% with the highest at 123.3%. In 2022 there were 4, with the highest at 128.3%. To put the balance into better perspective, in 2020 there were 8 at 120+%, 5 over 130%.
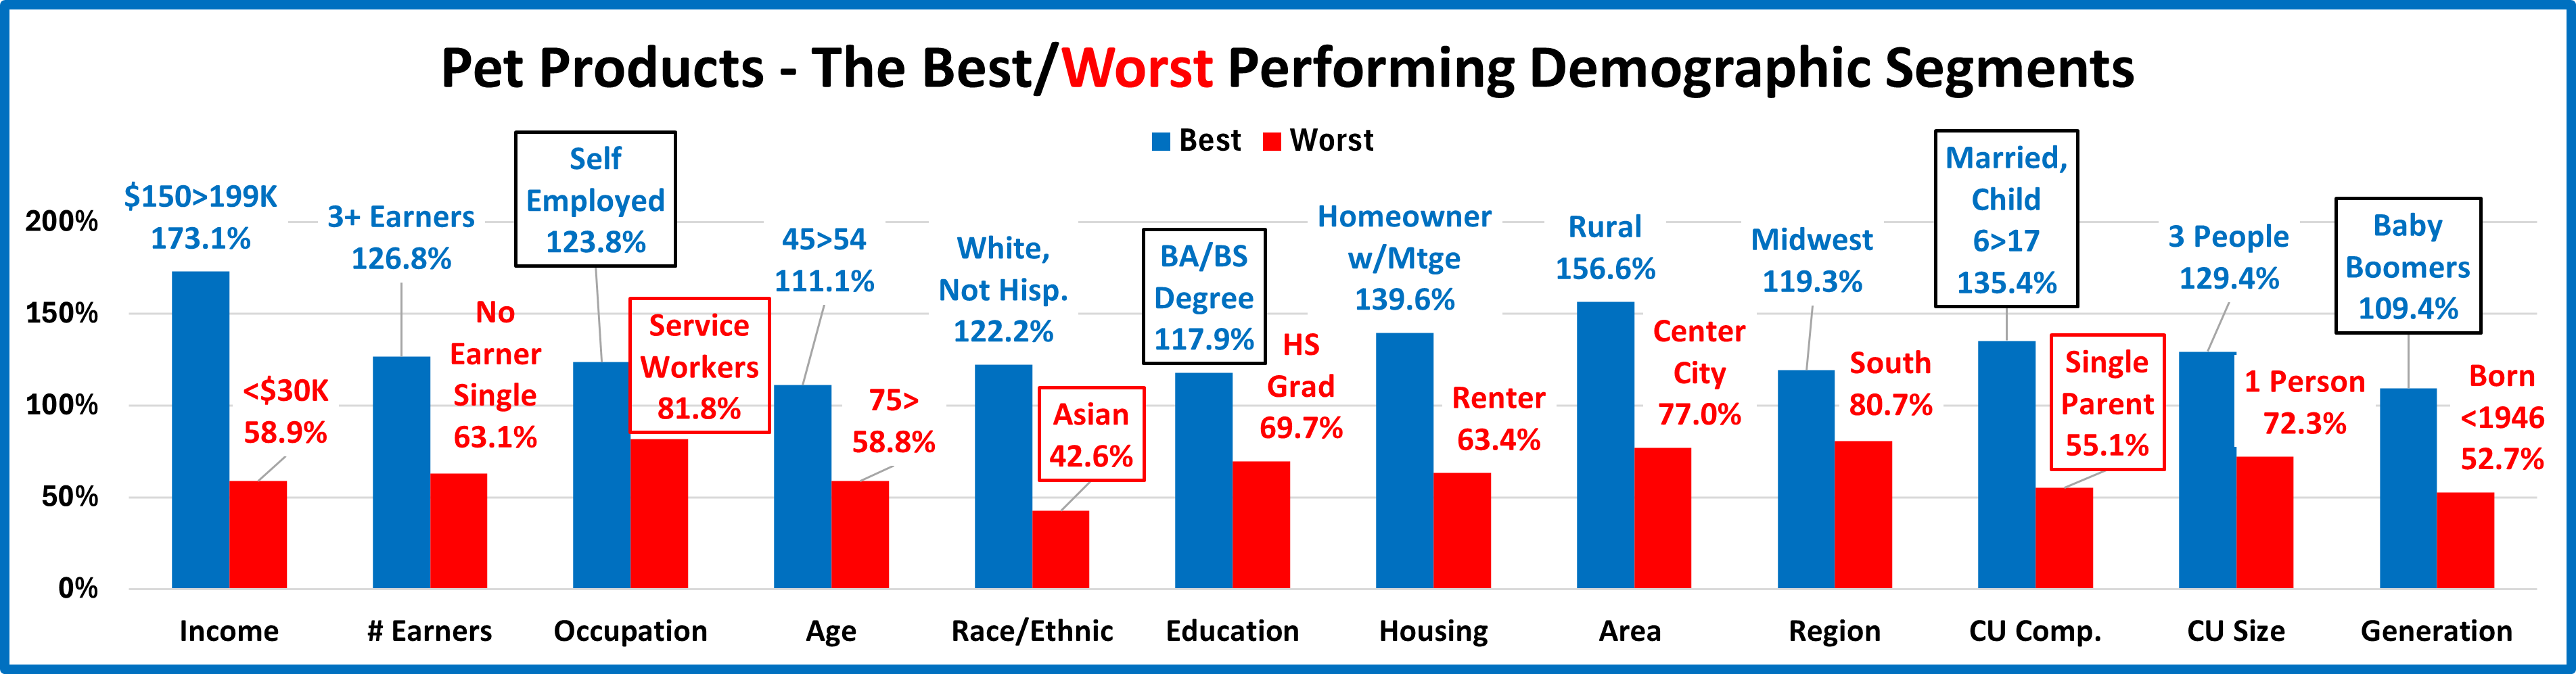
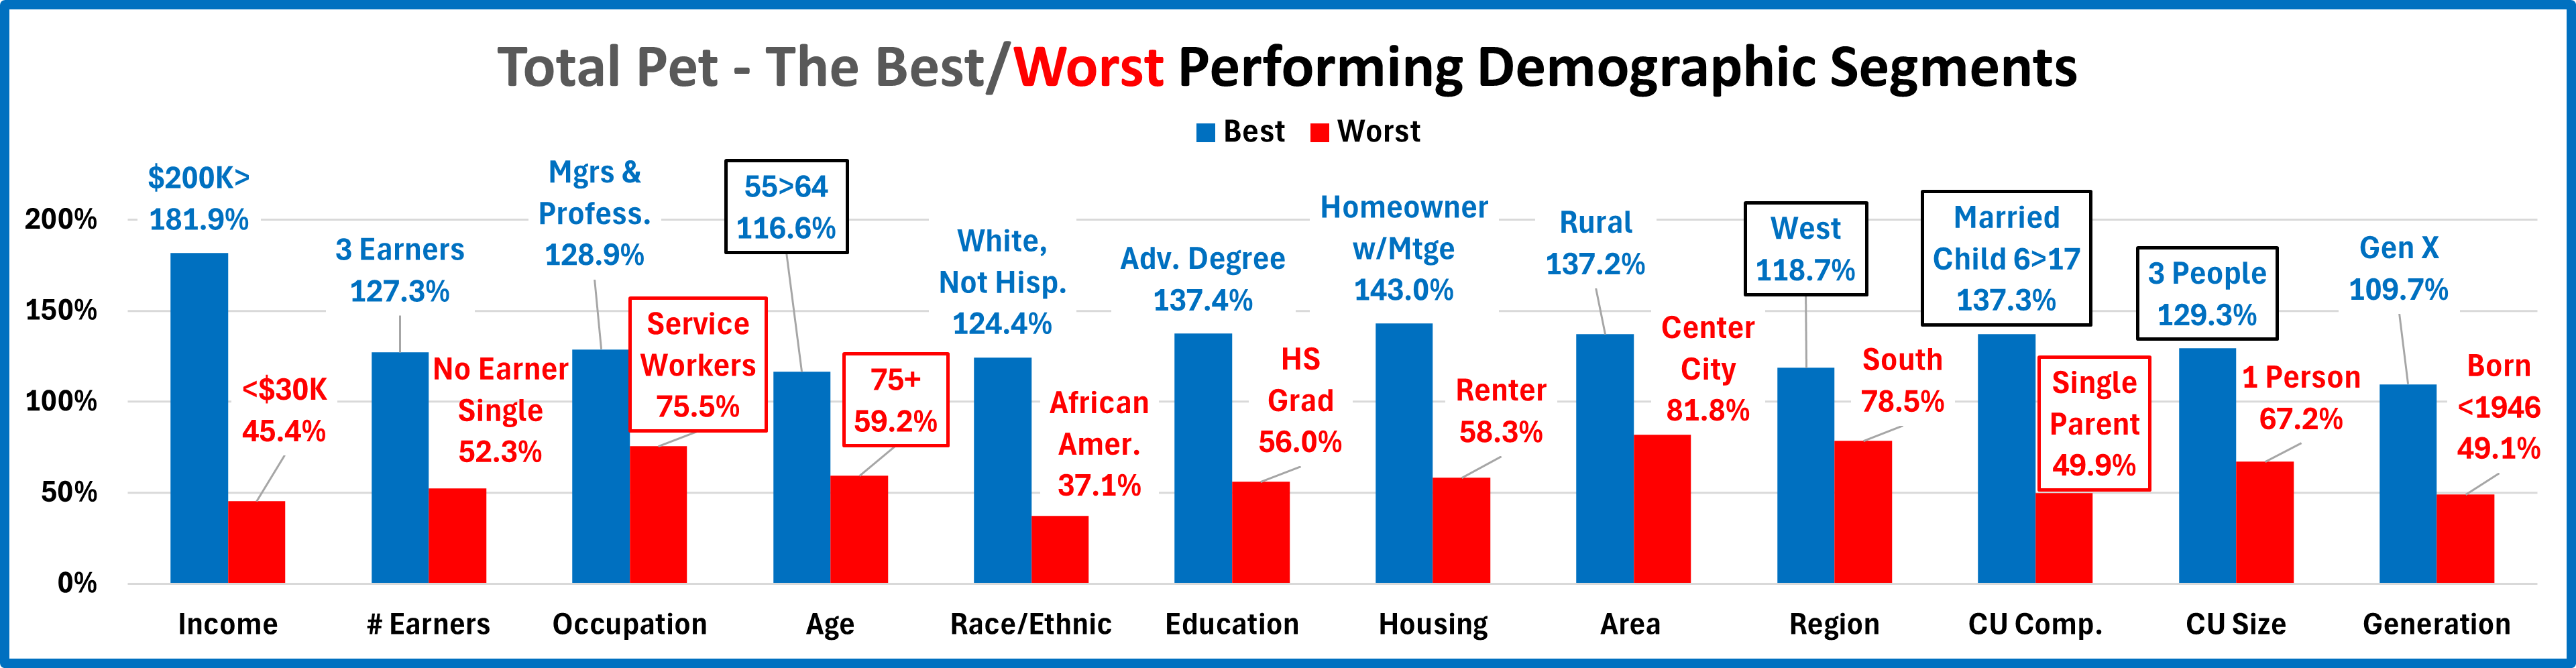
Now, we’ll look at 2023’s best and worst performing Pet Food spending segments in each category.
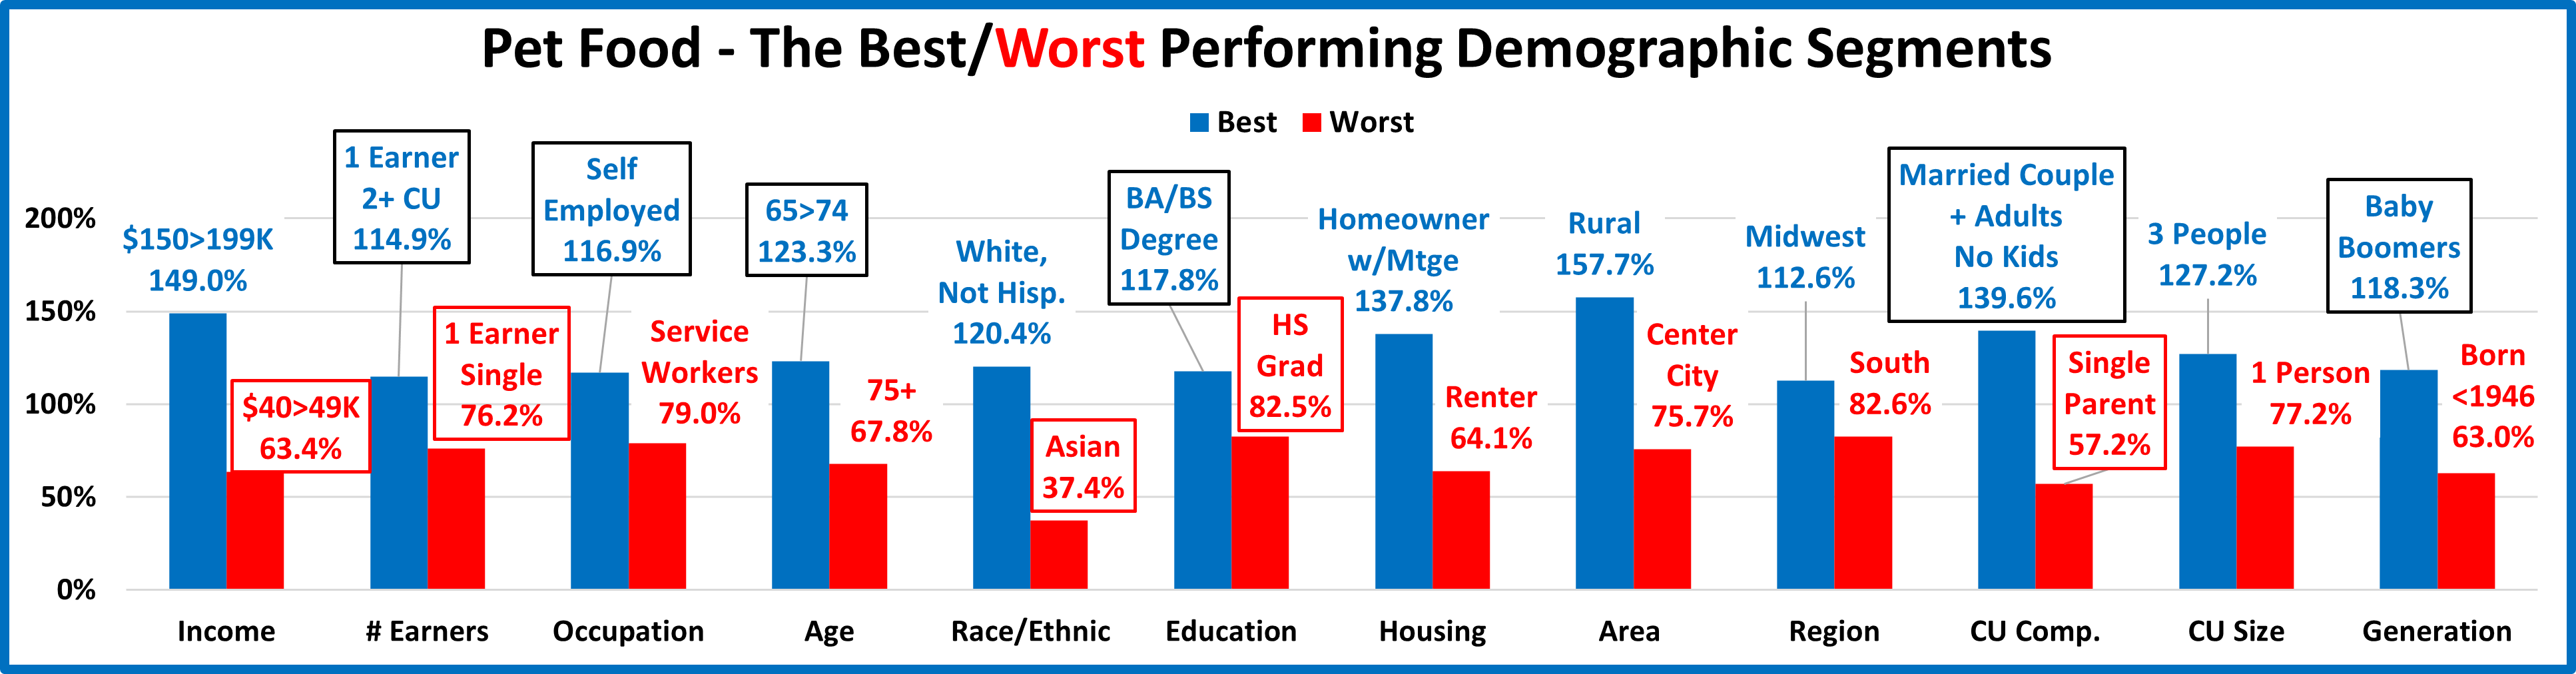
Almost all of the best and worst performers are the ones that we would expect. 2023 produced just 2 surprise winners – Married, + Adults and 65>74 yrs old. There are 6 different winners from 2022 and 5 different losers. This is the same total as 2022, but it had 4 new winners and 7 new losers. More new winners reflects the widespread nature of 2023’s record increase in Pet Food spending. Changes from 2022 are “boxed”. We should also note the performance gap between winner and loser narrowed in 11 of 12 categories. Overall, the average gap fell from 73.5% in 2022 to 59.1% in 2023. This is strong evidence of increased spending balance. Here are some more performance specifics:
- Income – $40>49K replaced <$30K on the bottom. The gap narrowed from 112% to 86%, and is now below 100%.
- # Earners – Winner & loser are new. The Winner has only an average income. The gap narrowed from 71% to 39%.
- Occupation – Self Employed replaced Mgrs/Prof. on top. The gap narrowed from 54% to 38%.
- Age, Generation- Boomers moved to the top in both and the oldest stayed on the bottom. Both gaps fell -16+%.
- Race – The usual winner. Asians replaced African Americans on the bottom. The gap narrowed from 94% to 83%.
- Education – Both are new but a college degree still mattered in Pet Food spending. The gap fell from 54%.to 35%.
- Housing – Owning a home is always important. The usual winner & loser returned. The gap narrowed – 97% to 74%.
- Area – The usual winner/loser – Rural on top & Center City on the bottom. The gap narrowed a little 85% to 82%.
- Region – Both kept their spots but this category had the only increase in the performance gap – 24.5% to 30%.
- CU Comp, CU Size– Size: No change. Married, +Adults was a surprise. Both gaps narrowed. Comp: -11%; Size: -6%
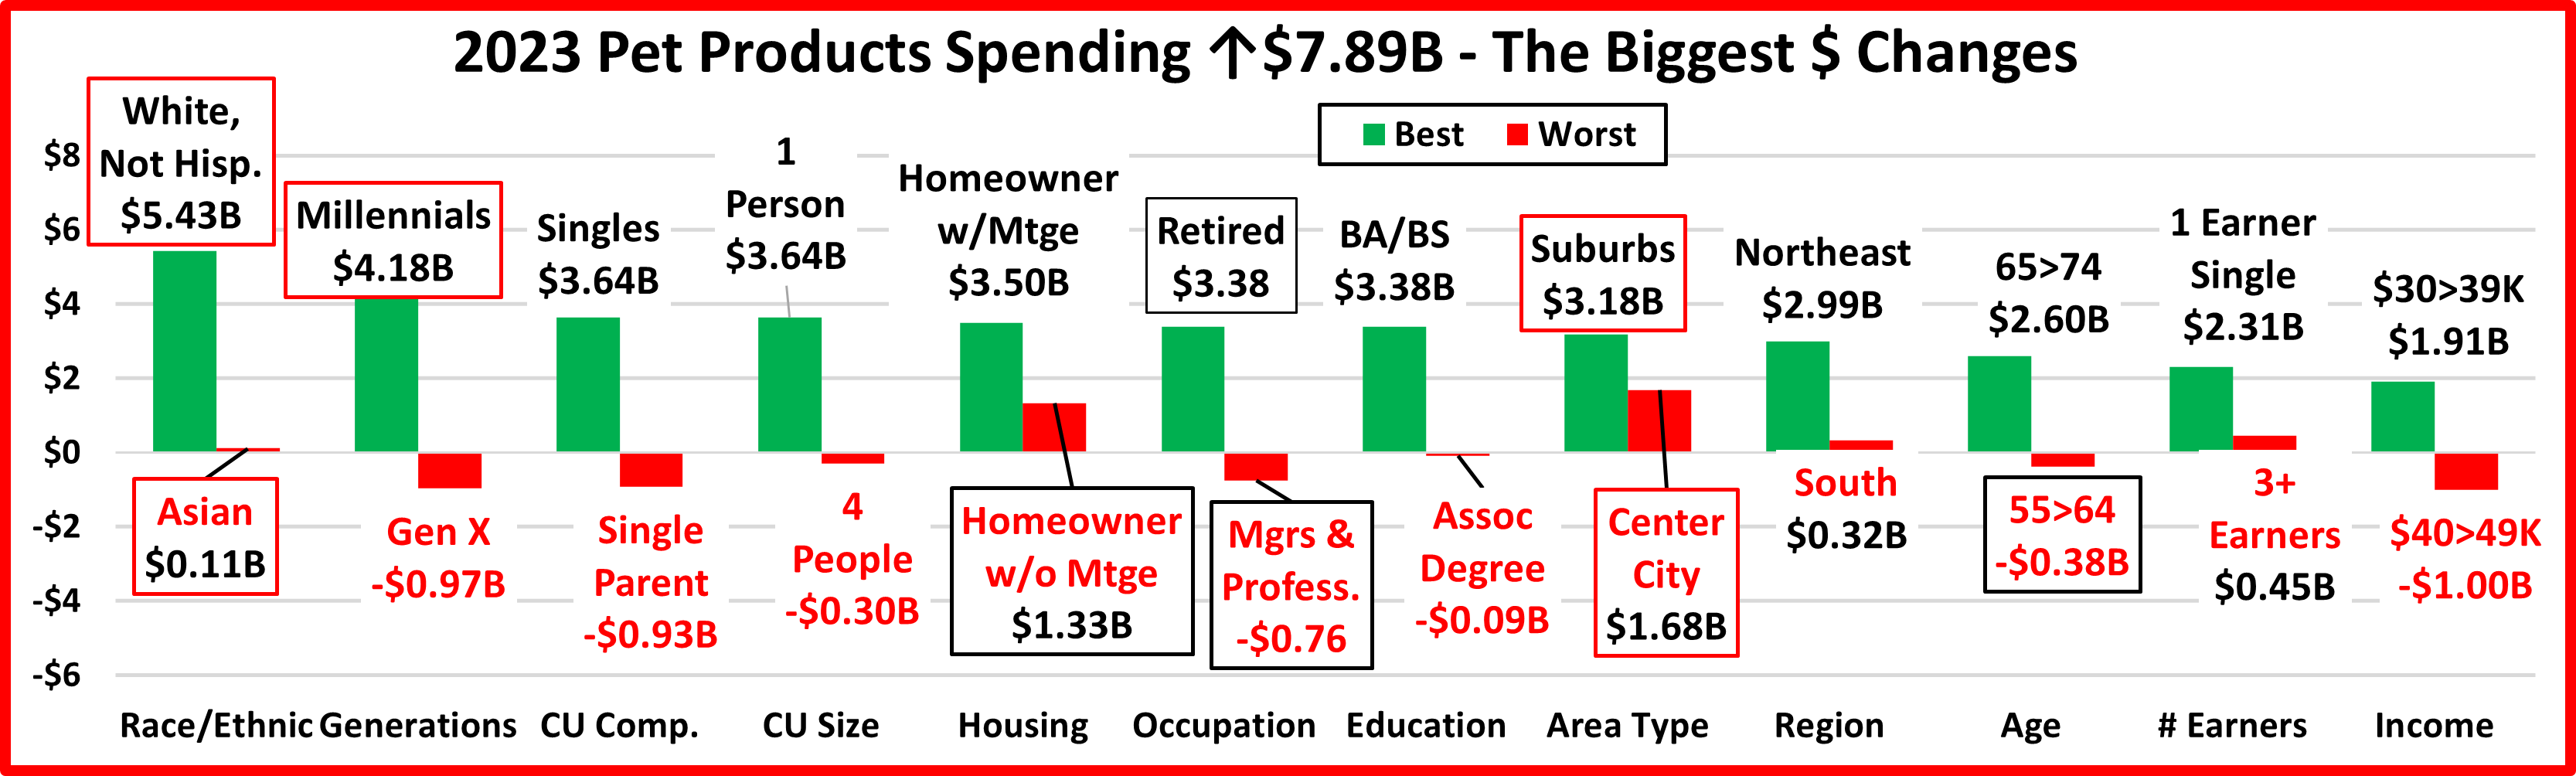
It’s time to “Show you the money”. Here are segments with the biggest $ changes in Pet Food Spending.
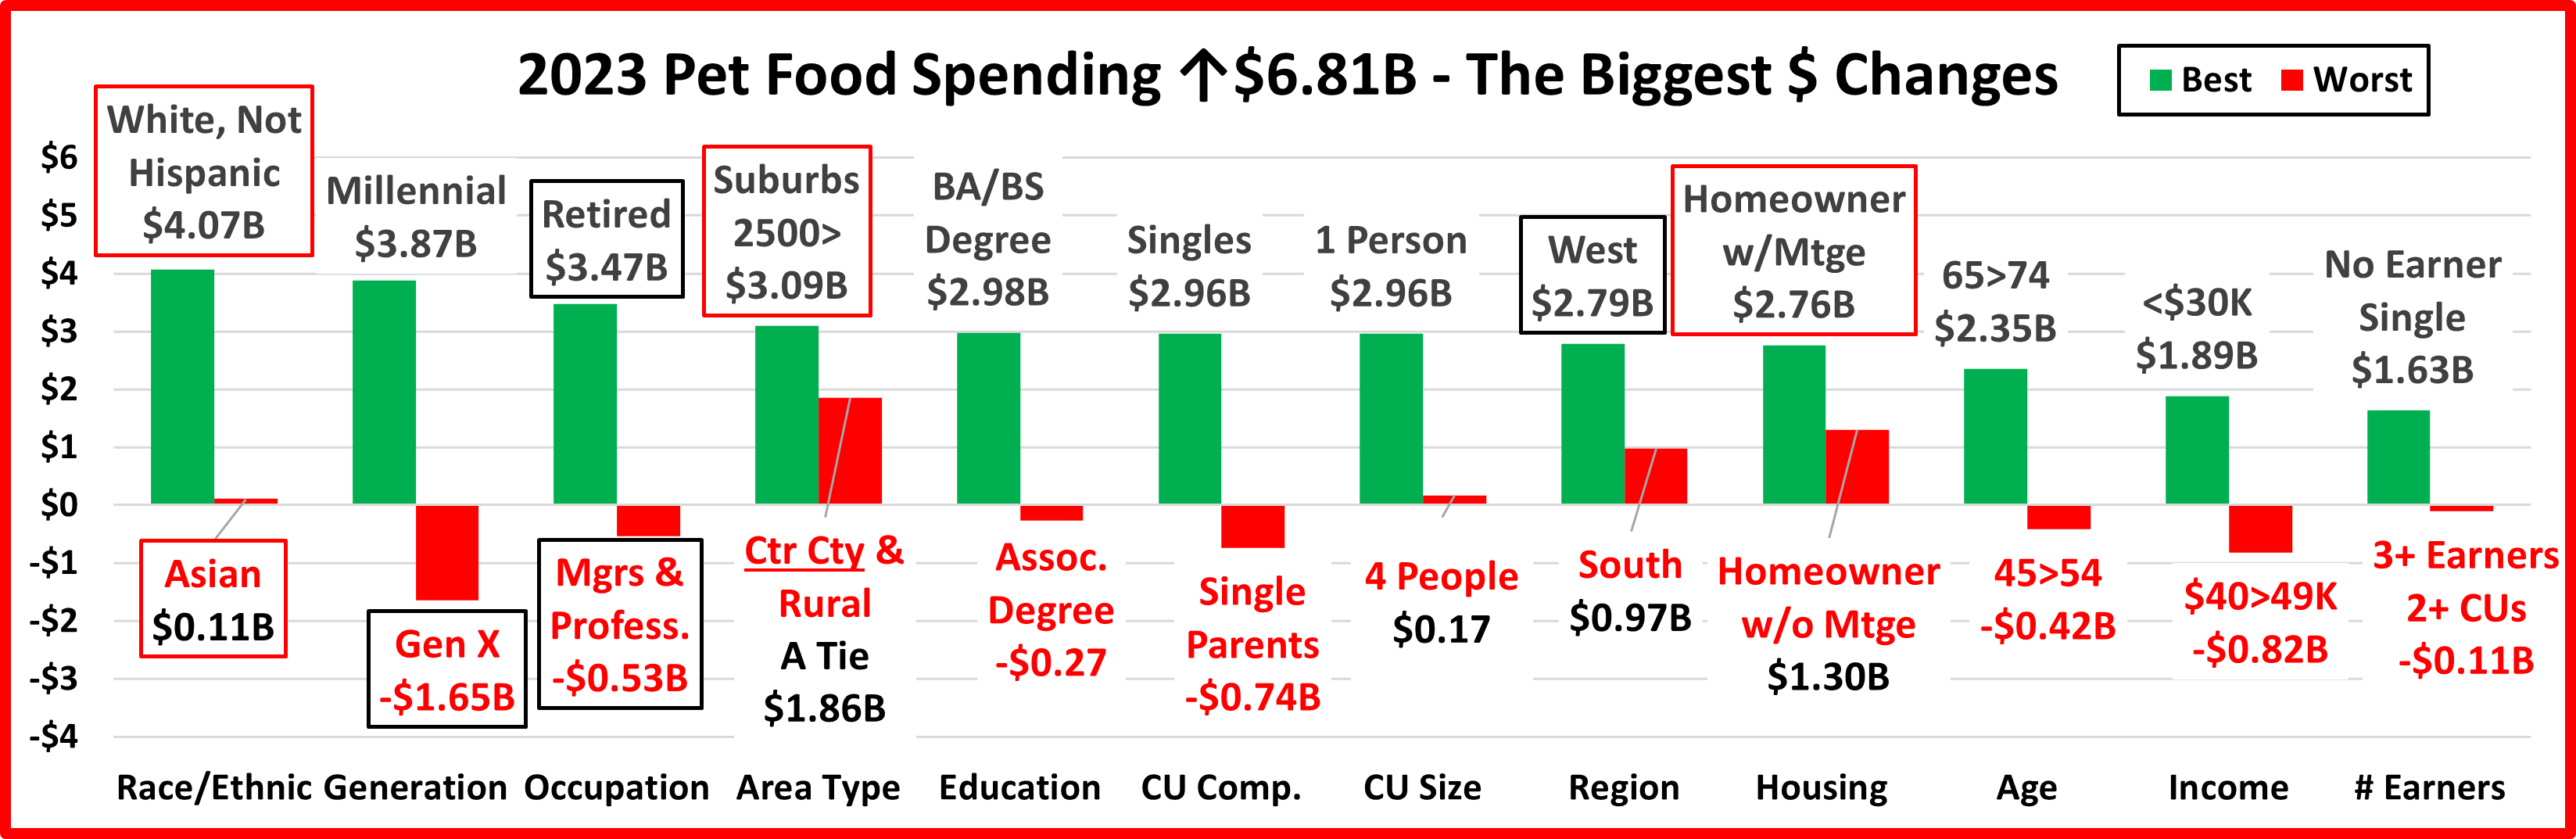
There are 4 repeats from 2022 and 4 flipped from 1st to last or vice versa. Last year there were 2 repeats and 13 flips -much more turmoil. The Surprise winners were Retired, 65>74, <$30K and 3 different singles. The surprising losers were Gen X, Mgrs, 45>54 and 3+ Earners. Spending grew 17.6% as 87.5% of demographic segments spent more. (With inflation, it was 80%) Plus, all segments in 5 categories had increases. In 2022 there was 1. Here are the specifics:
- Race/Ethnic – Both White, Not Hispanics and Asians held their positions.
- Winner – White, Not Hispanic – Pet Food Spending: $36.33B; Up $4.07B (+12.6%) 2022: White, Not Hispanic
- Loser – Asian – Pet Food Spending: $0.94B; Up $0.11B (+12.6%) 2022: Asian
- Comment – The U.S. is becoming more racially/ethnically diverse but White, Not Hispanics are by far the biggest spender in every Pet Segment. All segments spent more. Asian Americans had the smallest lift. African Americans & Hispanics had $1B increases. African Americans almost doubled their spending, +95.5%.
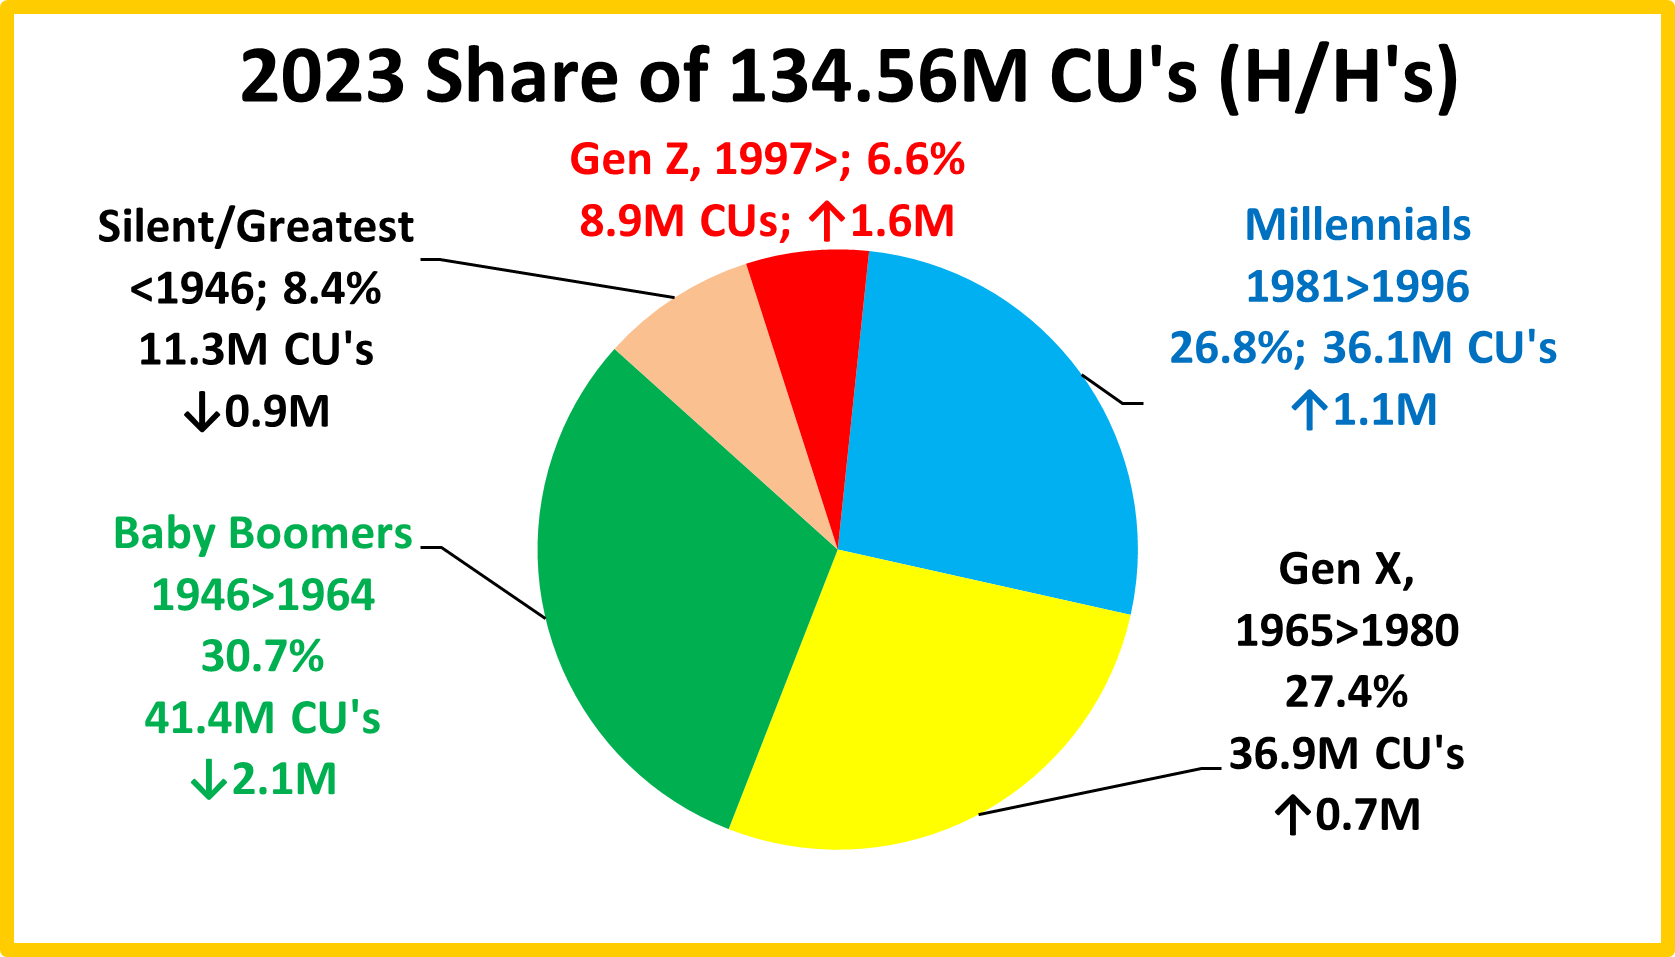
- Generation – Millennials are a new winner. Gen X flipped to the bottom
- Winner – Millennials – Pet Food Spending: $12.67B; Up $3.87B (+44.1%) 2022: Gen X
- Loser – Gen X – Pet Food Spending: $11.43B; Down $1.65B (-12.6%) 2022: Born <1946
- Comment – Much of the 2020>21 Pet Food spending boom and bust was due to the Boomers. Gen X took over the top spot in 21 & 22. In 2023, they had the only spending decrease. Millennials edged out Boomers, +$3.87B to $3.23B for the win. We should note that Millennials increased their Pet Food spending $5.43B 2021>2023.
- Occupation – The 2022 winner & loser flipped in 2023. This was the only dual flip in 2023 Pet Food.
- Winner – Retired – Pet Food Spending: $10.60B; Up $3.47B (+48.6%) 2022: Mgrs & Professionals
- Loser – Mgrs & Professionals – Pet Food Spending: $12.43B; Down $0.53B (-4.1%) 2022: Retired
- Comment – Only Mgrs/Professionals and A/O, Unemployed spent less. Retirees had the biggest lift in both $ & %. In fact, their increase was double the size of 2nd place – +$1.73B by Tech/Sls/Cler.
- Area Type – The Suburbs won again and Center City stayed on the bottom, even though they tied for the loss.
- Winner – Suburbs 2500> – Pet Food Spending: $19.95B; Up $3.09B (+18.3%) 2022: Suburbs
- Loser – Center City/Rural – Ctr City: $11.91B; Up $1.86B (+18.5%); Rural: $13.64B; Up $1.86B (+15.8%) 2022: Ctr City
- Comment – All segments spent more. The Suburbs won with a $3B lift and Center City tied for the bottom spot despite having a lift of $1.86B.
- Education – Both winner and loser are new. A college degree is still important..
- Winner – BA/BS Degree – Food Spending: $14.44B; Up $2.98B (+26.0%) 2022: HS Grads or less
- Loser – Asssociate’s Degree – Food Spending: $4.01B; Down $0.27B (-6.2%) 2022: Adv College Degree
- Comment – Only Associates Degrees and those without a HS diploma spent less. This was not surprising because in 2022 they both had $1+B lifts. In 2023, HS grads with no additional degree spent $3.4B more. BA/BS had a strong year but Adv. Degrees were only up 9% after a drop in 2022.
- CU Composition – The winner & loser are both new
- Winner – Singles – Food: $10.60B; Up $2.96B (+38.8%) 2022: Married, Oldest Child 18>
- Loser– Single Parents – Food: $1.33B; Down $0.74B (-35.7%) 2022: Married, Couple Only
- Comment – Only Single Parents spent less. There were strong increases in unexpected segments. Singles account for 30.2% of CUs. Their spending performance is still low, but they had a $2.96B, 38.8% lift. Unmarried, 2+ All Adult CUs. (16.5% of CUs) spent $1.25B, 23.8% more. Spending became more balanced in this category.
- # in CU – Again, the winner and loser are new.
- Winner – 1 Person – Pet Food Spending: $10.60B; Up $2.96B (+38.8%) 2022: 3 People
- Loser – 4 People – Pet Food Spending: $5.63B; Up $0.17B (+3.1%) 2022: 2 People
- Comment: All segments spent more but the larger CUs, 4 & 5 people had lifts <4.5%. 1 person led the way and 3 People was a little above average at +17.7%. Only 2>4 People CUs perform above 100%.
- Region – The West flipped from last to 1st.
- Winner – West – Pet Food Spending: $11.35B; Up $2.79B (+32.6%) 2022: Midwest
- Loser – South – Pet Food Spending: $14.81B; Up $0.97B (+7.0%) 2022: West
- Comment – All Regions spent more and all but the South had double digit percentage lifts.
- Housing – Homeowners w/Mtges held onto their position on top. w/o Mtge replaced Renters at the bottom.
- Winner – Homeowners w/Mtge – Food: $23.66B; Up $2.76B (+13.2%) 2022: Homeowners w/Mtge
- Loser – Homeowners w/o Mtge – Food: $11.66B; Up $1.30B (+12.6%) 2022: Renters
- Comment – All segments spent more with double digit % lifts. Arguably, Renters had the best year. Their $2.74B lift was only $0.02B behind the winner and their +36.9% increase was far better than all Homeowners.
- Age – The Winner and loser are both new and surprising.
- Winner – 65>74 yrs – Pet Food Spending: $9.00B; Up $2.35B (+35.4%) 2022: 55>64 yrs
- Loser – 45>54 yrs – Pet Food Spending: $7.45B; Down $0.42B (-5.3%) 2022: 75+ yrs
- Comment: 45>64 spent less while <45 and 65> spent more. The drop was driven by Gen Xers while Millennials & Boomers drove the lift. The biggest % increase came from 75> group. They spent $1.35B, 60.5% more.
- Income – Both the winner & loser are new and the winner is a big surprise.
- Winner – <$30K – Pet Food Spending: $6.63B; Up $1.89B (+39.7%) 2022: $100 to $149K
- Loser – $40 to $49K – Pet Food Spending: $2.11B; Down $0.82B (-28.0%) 2022: $70 to $99K
- Comment – Only the $40>69K groups spent less. Under $40K spent $3.63B more, which was only slightly less than the $3.74B increase by $100K>. The $30>39K group joined the groups over $70K with 100+% performance.
- # Earners – The winner and loser are both new
- Winner –– No Earner, Single – Pet Food Spending: $4.67B; Up $1.63B (+53.9%) 2022: 2 Earners
- Loser – 3+ Earners – Pet Food Spending: $4.53B; Down $0.11B (-2.3%) 2022: No Earner, 2+ CU
- Comment – 3+Earners had the only spending decrease, and it was only -2.3%. All other segments had increases over $1B. No Earner CUs were up $3B, +49%.
We’ve now seen the “winners” and “losers” in terms of increase/decrease in Pet Food Spending $ for 12 Demographic Categories. In 2020, very specific segments binge bought Pet Food. In 2021, their pets “ate up” the overstock so Pet Food spending fell. 2022>23 brought a new challenge, strong inflation. However, most of America remains firmly committed to high quality Pet Food. Super premium Food already had high prices, so income is still very important in Pet Food spending. The 2023 result was 87.5% of all demographic segments spent more which drove a record lift of $6.81B, +17.6% to $45.5B. Even considering inflation, 80% spent more on Pet Food. We have identified the winning segments in performance and $ increase but they were not alone. Not every good performer can be a winner. Some “hidden” segments should also be recognized for performance. They don’t win an award, but they get…
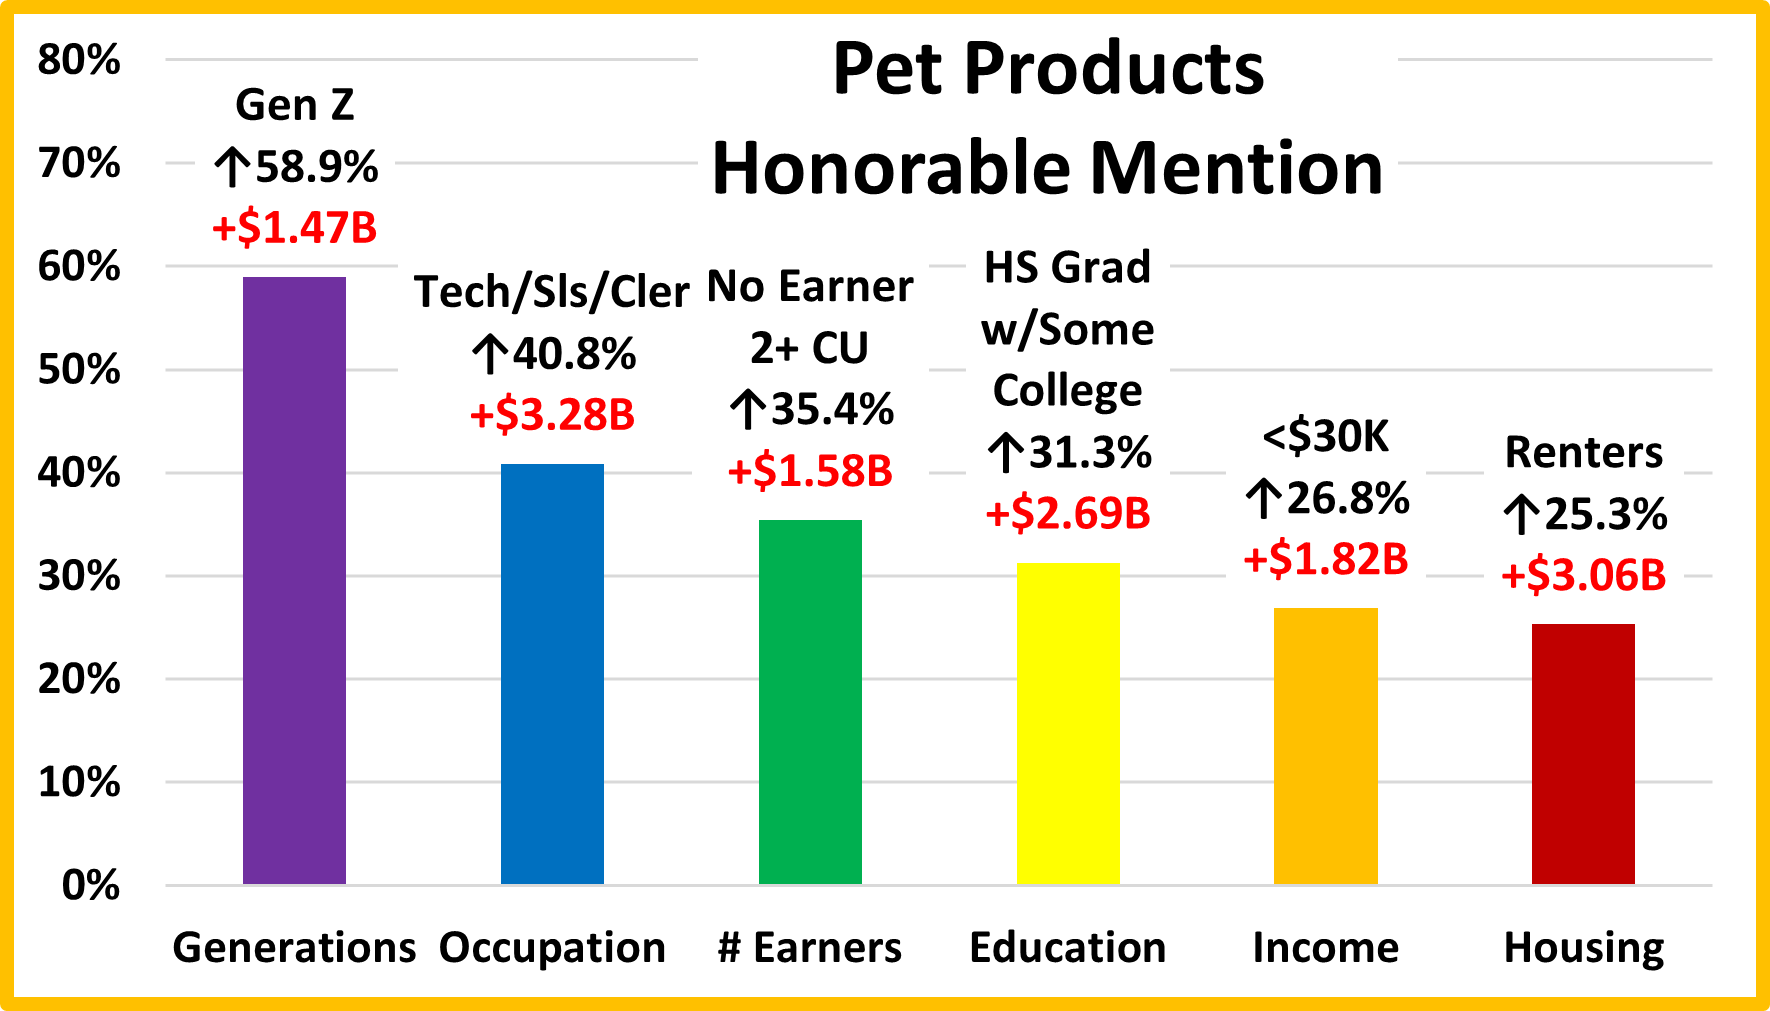
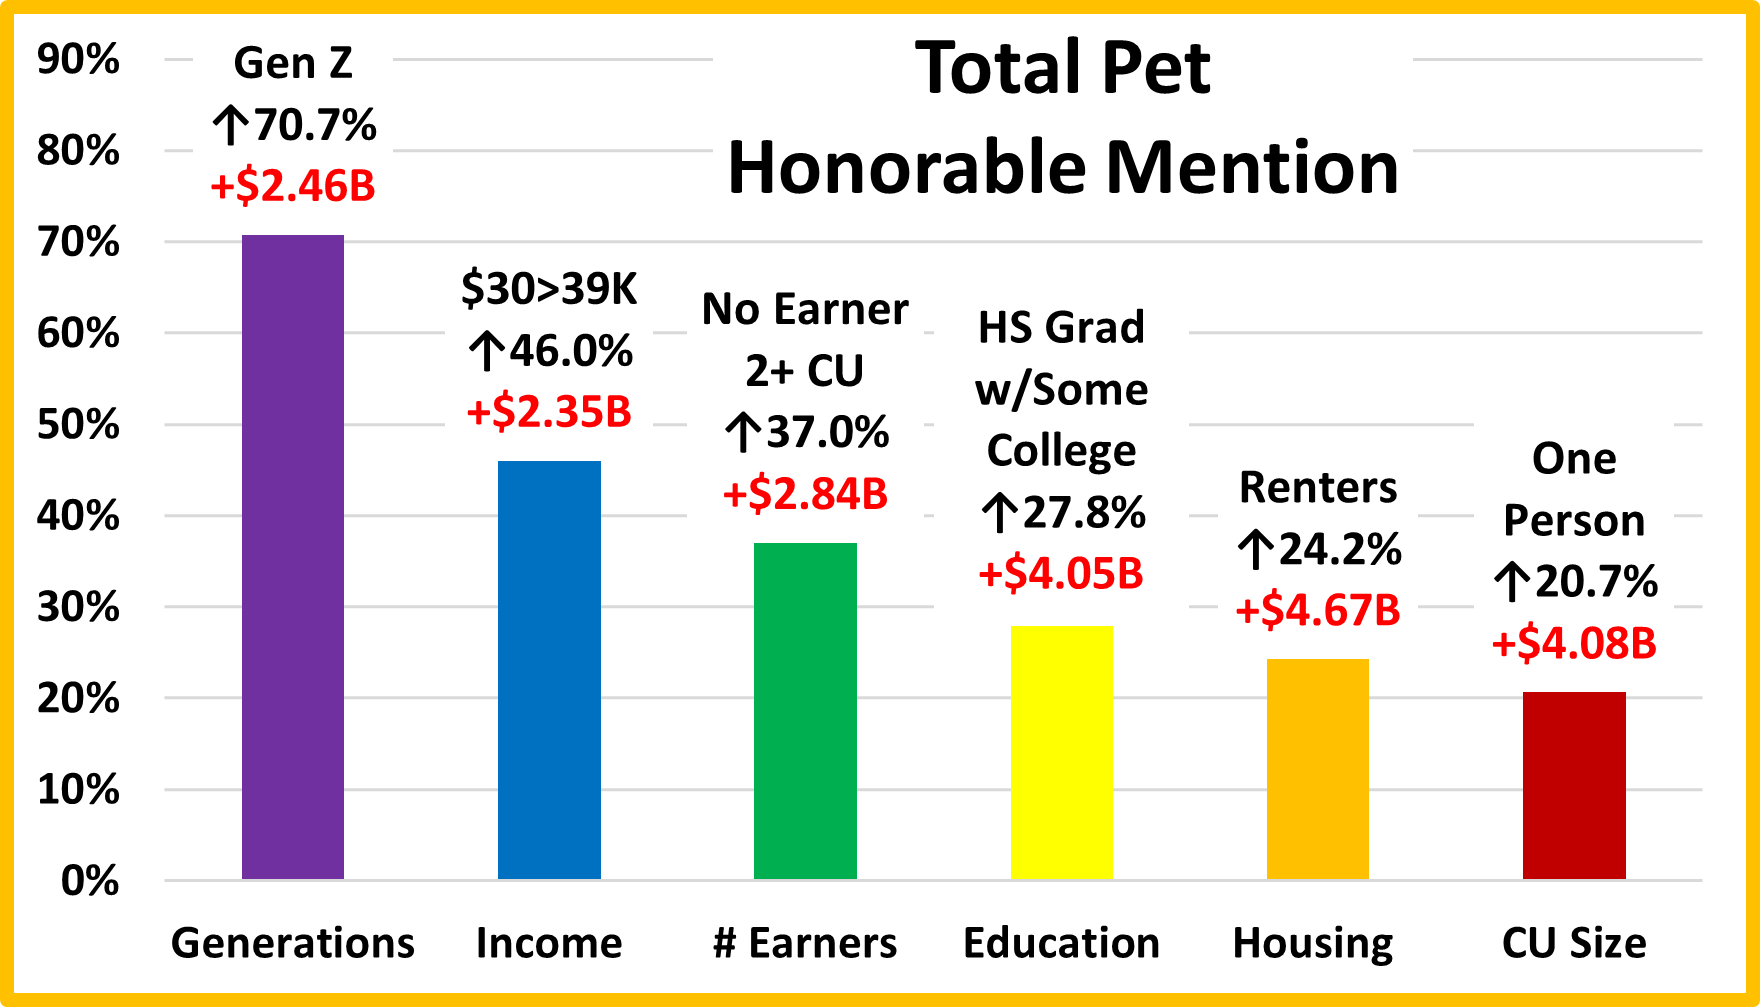
HONORABLE MENTION
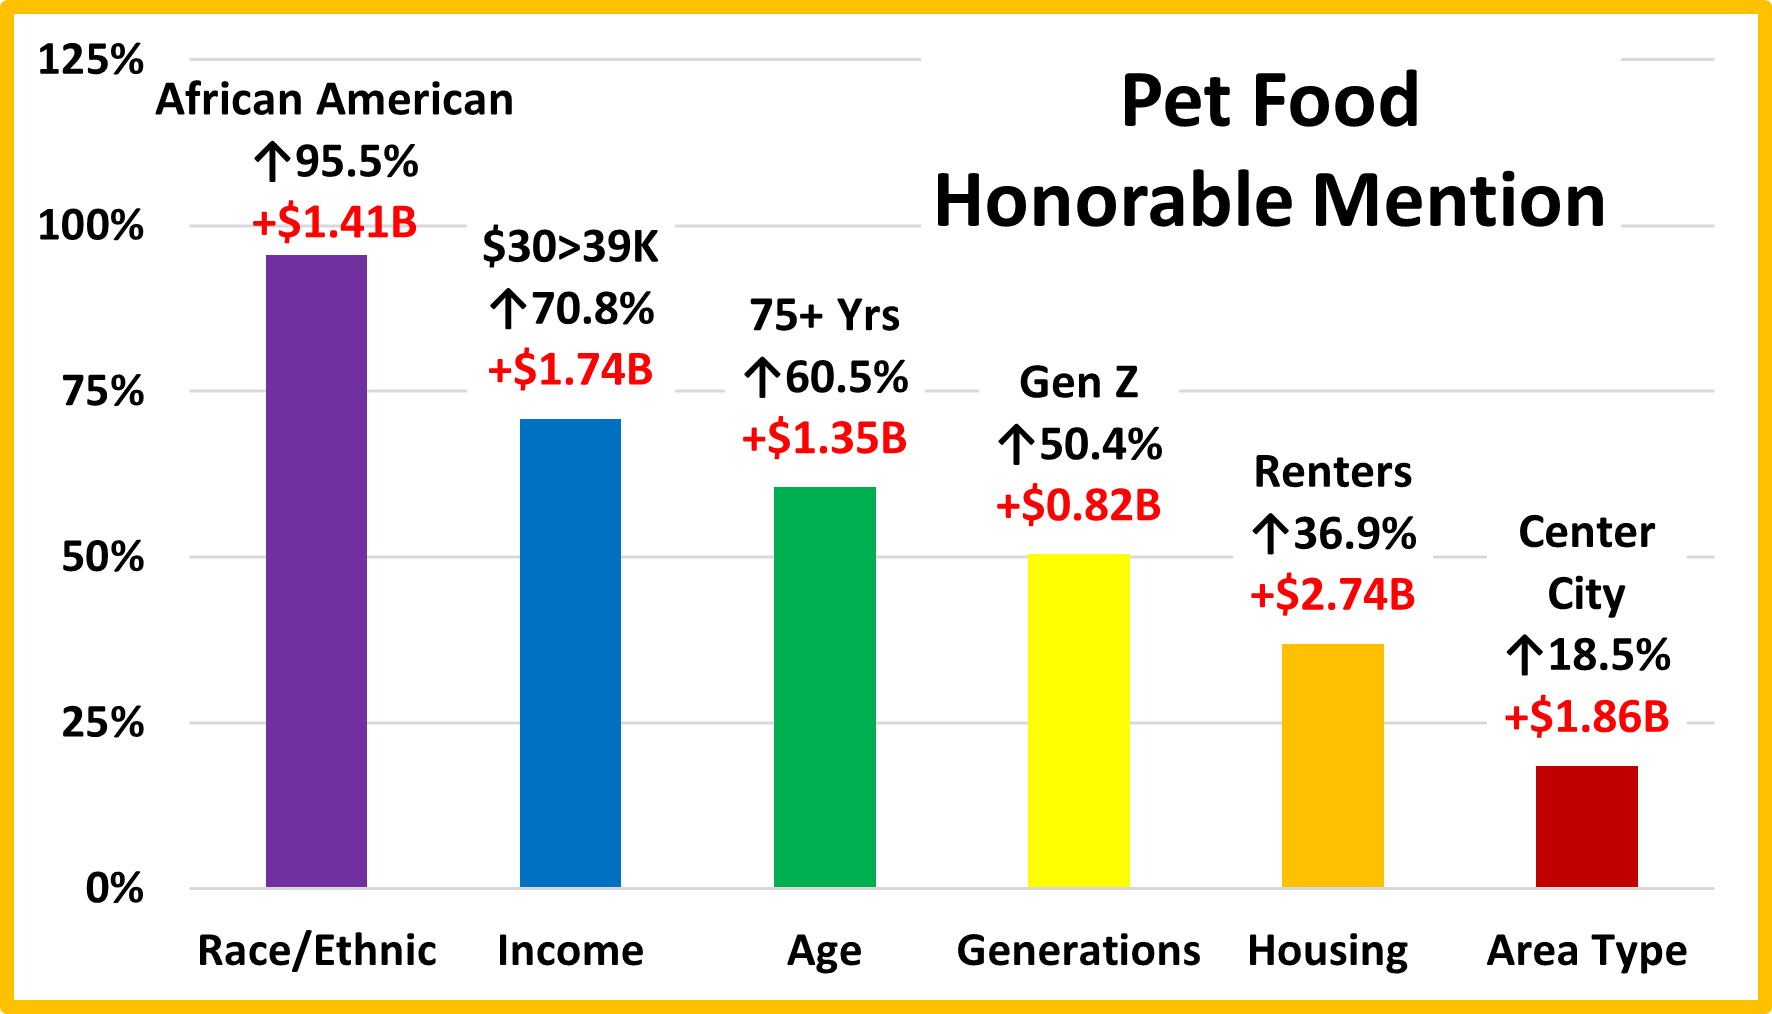
This group clearly demonstrates that the lift in Pet Food spending was very widespread. The first thing that you notice is that while food prices are high, lower income groups like African Americans and $30>39K still “found a way” and increased their spending… over 70%. Gen Z continues to reinforce their commitment to Pet Parenting and in 2023 the oldest American joined the movement. Both spent over 50% more. Also, many groups that usually finish at or the bottom in spending comparisons stepped up in 2023. Renters and Center City are still the worst performers in their category but in 2023 they both increased their Pet Food spending over $1.8B. Income is important in Pet Food spending but family commitment is still #1. The strong performance of these segments demonstrates just how widespread the commitment to our Pet “Children” has become.
Summary
Pet Food has been ruled by trends over the years. The drop in 2018 due to the FDA grain free warning broke a 20 year pattern of 2 years up followed by 1 year of flat or declining sales. This trendy nature increased with the move to premium foods in 2004. The 2007 Melamine crisis resulted in a series of “waves” which became a tsunami with the introduction of Super Premium Foods. The 25 to 34 yr old Millennials were the first to “get on board” with Super Premium in the 2nd half of 2014. In 2015, many more groups began to upgrade. The result was a $5.4B spending lift. These consumers were generally more educated with higher incomes. Unfortunately, they often paid for the upgrade by spending less in other segments. In 2016, spending dropped as many value shopped, especially online. They spent some of the $3B “saved” Food $ in other segments but not enough so Total Pet Spending was down $0.46B. In 2017, due to a price competitive market, we got a deeper penetration of Super Premium. These upgraders were mostly middle-income and not college educated. The result was a $4.6B increase but this time there was no trading of segment $.
In 2018 we were “due” a small annual increase in Pet Food, but spending fell $2.26B in reaction to the FDA warning on grain free dog food. The big decrease came directly from the groups who had fueled the 2017 increase. In fact, 71% of the demographic groups with the biggest change in Pet Food $ switched from first to last or vice versa from 2017.
That brought us to 2019. The FDA warning was false, so Pet Parents returned to Super Premium or even pricier options. Supplement $ also grew as the health of their Pet Children remained the #1 priority. Pet Food $ grew $2.35B with 75% of demographic segments spending more. Income and related categories mattered more, and Pet Food Spending became less demographically balanced. In 2020 the Pandemic accelerated this trend. Fear of shortages led to binge buying and a $5.65B increase. This behavior was driven by very specific groups. This spending disparity was manifested in the fact that the performance of 8 of 10 big spending groups exceeded 120% while 49% of all segments spent less.
In 2021, the retail market strongly recovered but the turmoil in Pet Food continued. The 2020 binge buying didn’t increase usage, so Pet Food spending fell by $2.44B. Every segment with the biggest increase in 2020 had the biggest decrease in 2021. The resulting drop in $ hid the fact that 65% of all demographic segments spent more on Pet Food.
In 2022 the situation returned to a more normal, balanced pattern in spending. Pet Parents renewed their commitment to high quality food for their children. Despite strong inflation, 82% of demographic segments increased spending generating a $4.29B (+12.5%) lift and reaching a new record high of $38.69B – even exceeding the 2020 binge by $1.85B.
In 2023 inflation got even stronger, +10.6%, but so did Pet Parents’ commitment to their Pet Children. Most prioritized their spending which put Pet Food high on their shopping list. The 22>23 lift of $6.81B set a new record and was widespread. In 5 categories, all spent more and overall, 87.5% of demographics increased spending. Even considering inflation, 80% spent more. 2023 was also more balanced as only 3 big groups performed over 120% and the average discrepancy between the best and worst performers dropped from 73.5% to 59.1%. 2023 was a great year for Pet Food.
Finally – The Ultimate Pet Food Spending CU is 3 people – a married couple and 1 other adult. They are 65>74 years old and White, but not Hispanic. At least one has an Advanced College Degree and 2 of them work in their own business. This generates an income of $200K>. They are still paying the mortgage on their house in a small Midwestern suburb.