Retail Channel Monthly $ Update – July Final & August Advance
Time for our monthly update on U.S. retail sales by channel. The current COVID-19 crisis has caused turmoil in the Retail Marketplace. Consumer spending behavior has changed and continues to evolve. In this report we will track the changes and migration between channels. We will do that with data from two reports provided by the U.S. Census Bureau.
The Reports are the Monthly Retail Sales Report and the Advance Retail Sales Report. Both are derived from sales data gathered from retailers across the U.S. and are published monthly at the same time. The Advance Report has a smaller sample size so it can be published quickly – approximately 2 weeks after month end. The Monthly Final Report includes data from all respondents, so it takes longer to compile the data – about 6 weeks. Although the sample size for the Advance report is smaller, the results over the years have proven it to be statistically accurate with the final monthly reports. The biggest difference is that the full sample in the Final report allows us to “drill” a little deeper into the retail channels.
This means to get the full picture in our monthly channel update we need to look at the latest release of both reports. We will begin with the Final Retail Report from July and then move to the Advance Retail Report for August. This will also allow us to better track the consumers’ evolving spending behavior in terms of channel migration.
Both reports include the following:
- Total Retail, Restaurants, Auto, Gas Stations and Relevant Retail (removing Restaurants, Auto and Gas)
- Individual Channel Data – This will be more detailed in the “Final” reports and we fill focus on Pet Relevant Channels
The information will be presented in detailed charts to facilitate visual comparison between groups/channels of:
- Current Month change – % & $ vs previous month
- Current Month change – % & $ vs same month in 2019
- Current YTD change – % & $ vs 2019
- Monthly and Year To Date $ will also be shown for each group/channel
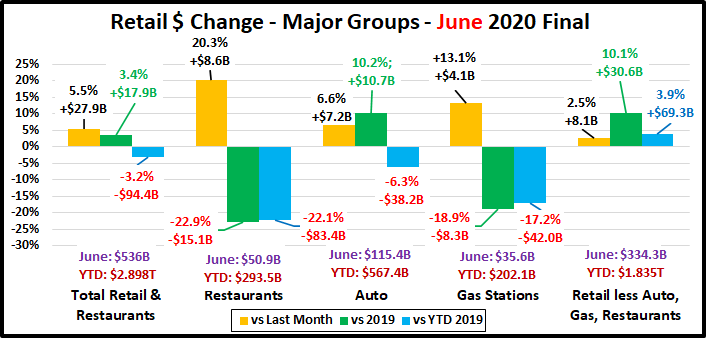
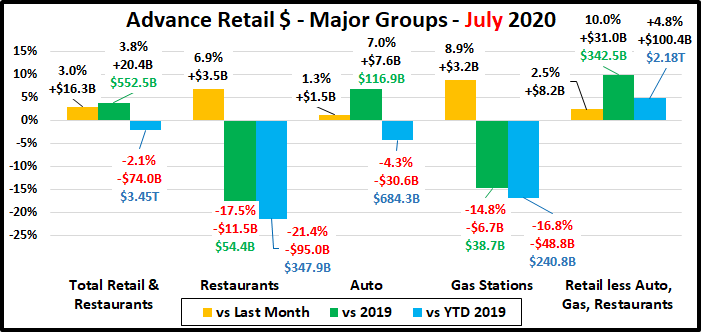
We’ll start with the July Final report. The retail market hit bottom in April then began a slow recovery which continued in July. First, we will look at some major retail groups. (Note: The Data in all graphs is Actual, Not Seasonally Adjusted)
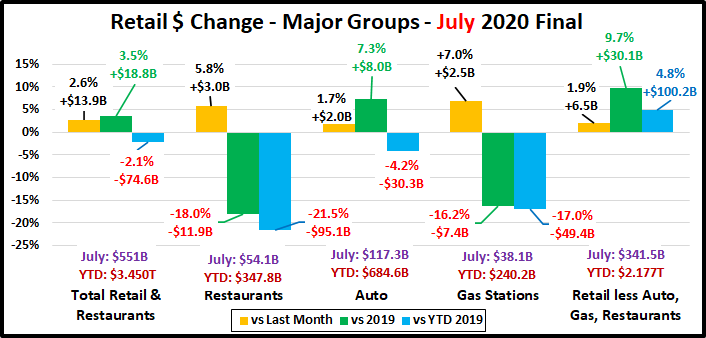
The final total is $2.5B less than the Advance report projected a month ago. All were down slightly from projections. Relevant Retail: -$1B; Auto:-$0.6B less; Restaurants: -$0.3 less and Gas Stations’ $ were -$0.4B. $ales were up vs June across the board. Driven by Relevant Retail, +$30B and Auto, +$8B, Total monthly sales were also up $18.8B vs 2019.
The Spring Lift is usually over by July but the COVID crisis has pushed the Spring timing back. Things began to open up in May and continued into July. However, all but Relevant Retail were still down YTD vs 2019.
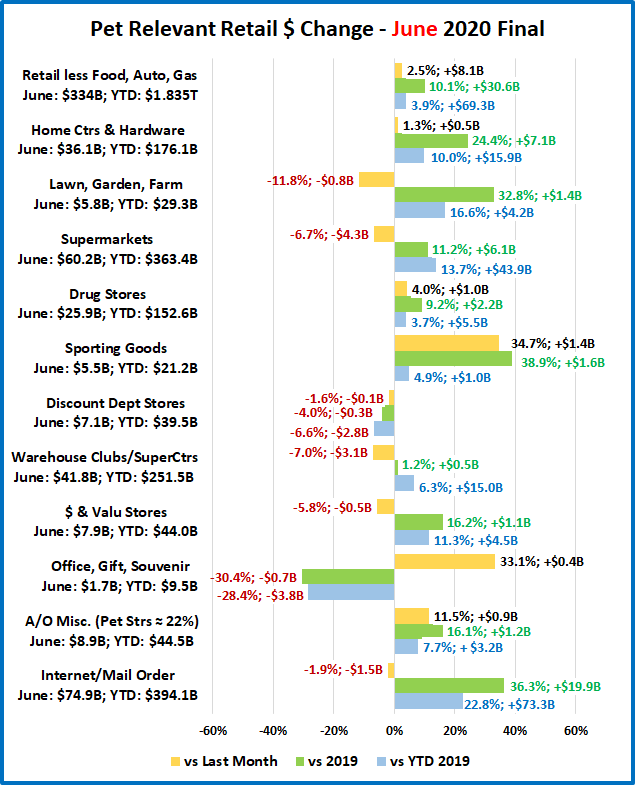
Now, let’s see how some Key Pet Relevant channels were doing in July.
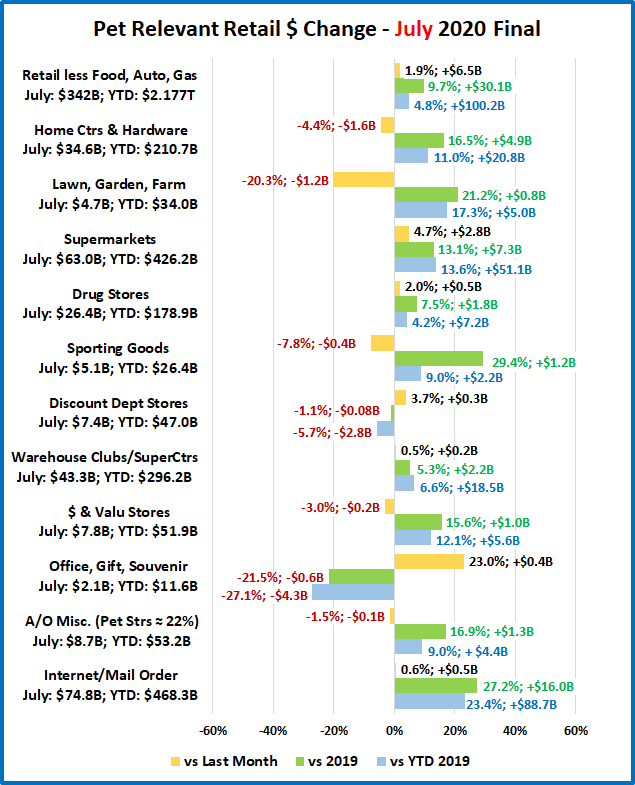
- Overall – Sales in 5 of 11 groups were down vs June, but 9 of 11 again showed increases vs same month in 2019.
- Building Material Stores – This group has their biggest annual lift in Spring. This is unchanged and even stronger. While sales were down vs June, they still have spectacular increases vs 2019. Although Sporting Goods stores are not included in this group, they have a similar Spring lift pattern. Their sales took off in May and continued to grow spectacularly through June. Although July sales dipped slightly from June, they turned positive YTD in June.
- Food & Drug – After a dip in June vs May Supermarket sales are back up with incredibly strong growth vs 2019. After 2 months of slowed $, Drug Stores came back strong in June and July and remain positive across the board.
- General Merchandise Stores – Sales in Clubs/SuperCtrs slowed down in June but are back up in July and still strong vs 2019. Despite slowed sales in June & July, $ Stores are showing exceptional strength vs 2019. Discount Dept. store sales were generally slowing before the pandemic. This trend has continued despite a small July lift.
- Office, Gift and Souvenir Stores – They were slow to re-open. Sales are growing, but this group was hit hard.
- Internet/Mail Order – The pandemic has accelerated this channel’s growth vs 2019. Sales vs June were flat, but the crisis has introduced many new consumers to online shopping and the behavior is likely to become habitual.
- A/O Miscellaneous – This is a group of small to midsized specialty retailers – chains and independents. It includes Florists, Art Stores and Pet Stores (22 to 24% of total $). Pet Stores were usually essential, but most stores were not. The others began reopening in May and the number grew in June which produced an increase vs 2019. July was down slightly from June but was strong vs 2019 which pushed YTD sales up to +9.0%.
May began a slow recovery which continued in June and July as even more businesses began to re-open. The Relevant Retail Segment turned positive in all measurements in May and has stayed that way through July. Although many segments are now contributing, the Internet, Supermarkets, SuperCtrs/Clubs/$ Stores and Hdwe/Farm are the key drivers. Let’s see how the situation is progressing. Here are the Advance numbers for August.
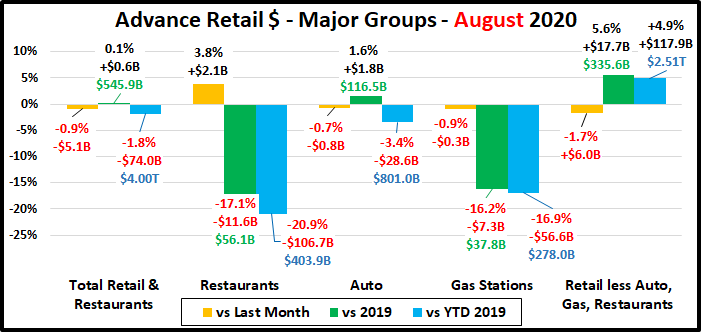
April and May were the 2 biggest spending drops in history. In June, monthly sales turned positive for the first time since February. In July the recovery continued. However, it flattened out in August leaving Total Retail still down -$74B YTD.
Total Retail – Total Retail spending increased $0.6B, +0.1% vs 2019, a big change from +3.9% in July and +3.4% in June. In February 2020 sales were up $60B, +6.6% YTD versus 2019. Then came COVID-19. Hopefully, we hit bottom at -$112B in May. We began moving in the right direction but have stalled in August, still -$74B YTD and -$134B from February.
Restaurants – The Spending increase slowed to +$2.1B over July and sales were down $11.6B vs 2019. This is important as August is usually their biggest $ month of the year. January and February, normally the 2 slowest months, are on top in 2020. In February YTD sales were up $9B. Then came the forced closures. Re-openings began in May but ran into problems in July and August. Delivery/Pickup can’t make up the difference as spending is now down $106.7B YTD.
Automobile & Gas Stations – When you are staying home your car becomes less of a focus in your life. Auto Dealers, both new and used, began combating this attitude with some fantastic deals and a lot of advertising. Sales turned positive versus 2019 in June, grew strongly in July, then slowed a bit in August. Although sales are down $28.6B YTD, they are up $20B vs 2019 in the last 3 months. Gas Station $ales increased in May, June and July over the previous month, but fell in August – Down $56.6B YTD. People are still not driving as much, whether for commuting or road trips.
Relevant Retail – Less Auto, Gas and Restaurants – Many non-essential businesses began to shutter their doors in March but there was also a rash of binge/panic buying for “necessities” and a big lift in groceries as consumers focused on home cooking which drove spending up $19B. April brought a full month of closures and an end in binge buying, spending dropped $34B from March. In May, the overall market began to reopen so spending began to move in the right direction. In June and July the growth continued but it slowed in August. However, the monthly June>August $ are larger than all months in 2019 but December. The primary drivers have been Nonstore, Grocery and SuperCenters/Clubs & $ Stores along with an enhanced spring lift from the Hardware/Farm and Sporting Goods channels. The Relevant Retail group now has posted positive numbers versus last year and year to date for 4 consecutive months and is up $118B YTD (+4.9%) vs 2019. In July it was up +4.8%.
Now let’s look at what is happening in the individual retail channels across America. In August, consumer spending in the relevant retail market grew even more positive versus 2019. Let’s see where the $ came from. These groups are less defined than in the Final Monthly reports and we will look across the whole market, not just pet relevant outlets.
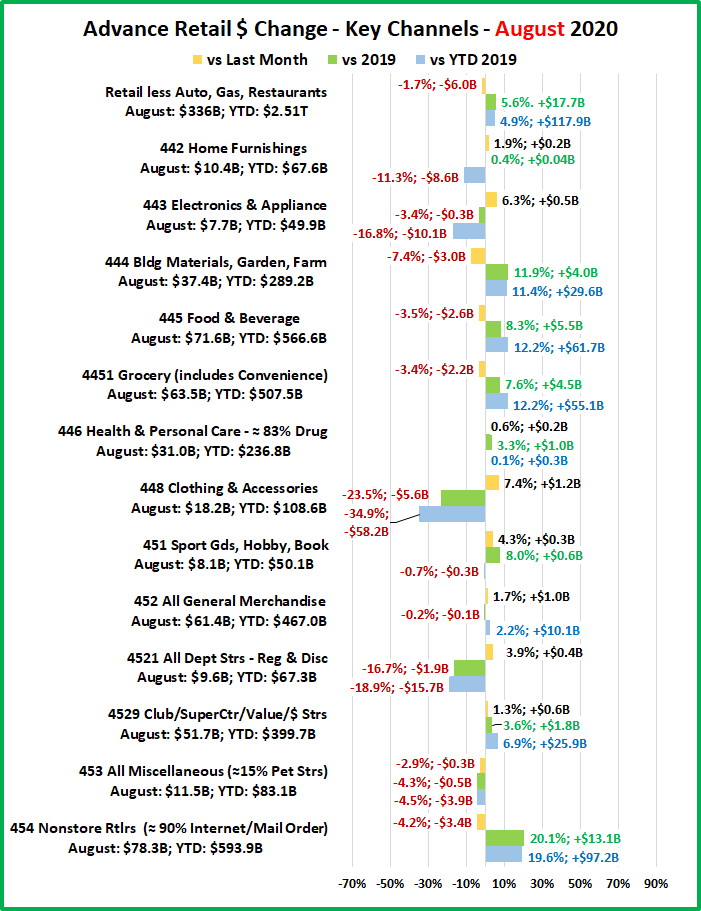
In July, 11 of 13 channels beat last month’s $. In August it was down to 7. In July, 10 channels beat July 2019. In August, this number was down to 7. However, in YTD numbers, 8 are now showing an increase as Health & Personal Care joined the group. The YTD decreases are coming from channels that are primarily nonessential businesses.
After a full month of stay at home and widespread closures there was a surge in May. Things truly opened up in June and July and sales continued to increase. In August they slowed slightly but YTD Relevant Retail Channels are up $117.9B vs 2019. The essential channels are responsible for the YTD lift vs 2019, primarily:
- Nonstore Retailers – Even more consumers are online shopping.
- Food & Beverage, especially Grocery– Restaurant $ are still down so consumers continue to eat & drink at home.
- Bldg Materials/Garden/Farm – A bigger than usual Spring lift continues as consumers focus “on their home”.
- SuperCtrs/Club/Value/$ Strs – Sales slowed in April but came back in May and continue to grow. This group turned the whole Gen Mdse channel positive. It clearly shows that value is still a consumer priority.
Regarding the Individual Large Channels
General Merchandise Stores – Regular Department stores are reopening which has cut the losses for total Department Stores as Discount Department stores continue to slowly fade. Club/SuperCtr/$ stores provided the big positive force. In April consumers dialed back their panic buying and spending on discretionary items was also down significantly. Since May we have seen consumer spending return to a more normal pattern in the big and small stores that promise value.
Food and Beverage, plus Health & Personal Care Stores – The Grocery segment is still driven by increased Food sales due to a slow restart by restaurants, up 7.6%, +$4.5B in August. Sales in the Health, Personal Care group were up vs 2019 in June July and August and finally turned positive YTD. Drug Store sales growth was a key factor.
Clothing and Accessories; Electronic & Appliances; Home Furnishings – In August, sales grew for the fourth consecutive month. Home Furnishing has even registered slight increases vs 2019 in July and August. However, all 3 channels are down double digit percentages in YTD sales. Clothing Stores are by far the worst performers. Even though August sales were up 7.4% over July they were still down 23.5% vs August 2019 and 34.9% YTD.
Building Material, Farm & Garden & Hardware – Sales fell again after peaking in June. However, this channel continues to benefit from consumers turning their focus to their home needs, including house and yard repair and improvements. This has accelerated and extended their Spring lift. Sales were up 11.9% vs August 2019 and up +$29.6B (+11.4%) YTD.
Sporting Goods, Hobby and Book Stores – Book and Hobby stores are open and sales in Sporting Goods stores have taken off as Consumers again sought outdoor recreation. Although sales fell again from their June peak, they were up 8% vs August 2019. YTD sales were down $3.4B in April. In August, this deficit had been cut to -$0.3B. If current trends continue, their YTD numbers could turn positive by September.
All Miscellaneous Stores – This group is mostly small to medium specialty stores – both chains and independents. Pet Stores are essential but most other stores are not, so closures hit this group particularly hard. Sales began to rebound in May and grew through July when they finally beat the monthly sales for 2019. In August sales dropped -2.9% vs July and -4.9% vs 2019. In February, this group was up $2.6B YTD. Through July, they were down -$3.4B but moving in the right direction. That has stopped, at least temporarily as they are now down -$3.9B YTD. They have a long road ahead.
NonStore Retailers – 90% of the volume of this group comes from Internet/Mail Order/TV businesses. The COVID-19 crisis has only accelerated the ongoing movement to online retail. In February NonStore was up 8.6% YTD. In August, despite falling -4.2% from July, they are up 19.6%, +$97.2B YTD. Their increase is 82% of the total $ increase for Relevant Retail Channels. They are the clear leader and their performance far exceeds their 12.9% annual increase in 2019. Since much of their annual increase comes from holiday sales, 2020 looks to be another banner year for NonStore Retailers.
Note: Almost without exception, online sales by brick ‘n mortar retailers are recorded along with their store sales in their regular channel. Whether they are up or down, their online sales are included in the totals.
Recap – April and May saw the 2 biggest year over year monthly sales declines in history. Restaurants, Auto and Gas Stations increased sales from May through July. In August, only restaurants had an increase. The Auto segment is showing positive monthly numbers vs 2019 but Restaurants and Gas Stations are still struggling. The Relevant Retail segment has been the only true positive. Although August sales are lower than July, monthly and YTD sales vs 2019 are up for 4 consecutive months. However, for many segments in this group there is still a long way to go. In July Total Retail was positive for the second consecutive month but it turned essentially flat in August. We saw a resurgence of the virus and retail restrictions were reimposed in many areas, which contributed to sales declining from July. This is going to be a long battle with no end in sight. We will continue to monitor the data and provide you with regular updates.