2015 Pet Spending was $67.75B – Where did the $ come from…?
As we have reported, the 2015 Consumer Expenditure Survey conducted by the US BLS with “field” work by the Census Bureau determined that Total Pet Spending in the U.S. reached $67.75B – an increase of $3.43B (+5.3%). After a detailed analysis, we concluded that the increase was primarily driven by the Baby Boomers, who elected to upgrade their Pet Food in 2015. However, that’s not the whole $67.8B story.
Where did the bulk of the spending come from? In this report we will look at Total Pet Spending in terms of 10 demographic categories. The goal is to determine what groups were responsible for most of the overall spending. Our target number was to find demographic segments in each category that account for 60 to 80% of the total. In some cases this was easy – Homeowners. In other situations, we had to bundle individual segments together to reach our 60% “minimum”. Ex: Ages 45>74
Knowing the specific group within each demographic category that was responsible for generating the bulk of Pet Spending is a first step in a targeted marketing program. In an upcoming “awards” post we will drill even deeper to show the best and worst performing demographic segments for 2015! But first…we’ll “show you the money!”
In the 2 charts that follow, the demographic groups appear in ranked order by Total Pet market share from highest to lowest. I also included their share of total CU’s (Financially Independent Consumer Units). This allows us to see how each performed versus the size of the demographic group.

- Race/Ethnic – White, Non-Hispanics (88.3%) The vast majority of Pet Spending is done by this group. In fact, Hispanics, African Americans and Asians account for 30% of CU’s but less than 12% of Pet Spending. The Hispanic portion of the U.S. population is growing strongly. This is a situation that should be researched further. (Performance Rating: 126%)
- Housing – Homeowners (82.6%) Controlling your “own space” has long been the key to larger pet families and more pet spending. (Performance Rating: 132%)
- # in CU – 2+People (80.1%) – It just takes two. More singles are adding Pets to their household. However, if you put 2 people together, pets very likely will follow. (Performance Rating: 113%)
- Income – Over $50K (69.5%) Although Pet Parenting is common in all income groups, money does matter. The top half of CU’s by income spent 70% of Total Pet $. (Performance Rating: 140%)
- Education – Associates Degree or Higher (66.5%) Once again, all education levels have pets but spending is another matter. Consumers with a formal degree beyond a high school diploma (51%) accounted for 2/3 of Total Pet $pending. (Performance Rating: 131%)
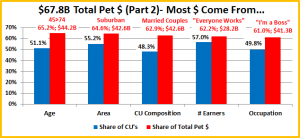
- Age – 45>74 (65.2%) Income starts high with this group then fades. The key factor is that their children are older and in most cases have left home. When this happens their attention and spending naturally turns to their Pet Children. (Performance Rating: 128%)
- Area – Suburban (64.6%) Homeownership is high and this group also has the “space” for pets. About half (55%) of U.S. CU’s accounted for almost 2/3 of Pet Spending. (Performance Rating: 117%)
- CU Composition – Married Couples (62.9%) With or without children, two people committed to each other is an ideal situation for Pet Parenting. (Performance Rating: 130%)
- # Earners – “Everyone Works” (62.2%) This is a composite of CU’s, regardless of size, where all adults are employed. While this group makes and spends more money, retired folks and CU’s with 2+ people and only one earner are still a significant share of spending. (Performance Rating: 109%)
- Occupation – “I’m a Boss” (61.0%) – This is another composite group, consisting of managers/professionals, self-employed and retired people. While they may not be “the” boss, they are all “bosses” to some extent. Pet ownership is so widespread across all occupations that bundling a “significant” spending majority with a common connection is difficult. (Performance Rating: 122%)

Comments: The apparent spending disparity in regard to Race/Ethnicity is an obvious concern which should be investigated. The correlation between homeownership (especially with a yard) and pet spending has been true from the earliest days of the industry. Putting 2 people together is another “good bet for pet”. Yes, income does matter, especially with the inflation in the Veterinary Segment and the current movement to upgrade Pet Food. However, how you make the money isn’t as important. Educated consumers are also more likely to spend more. They generally make more money and may respond better to the value of higher quality nutrition – at a higher price, as well as the need for regular Vet visits. Finally, as parents grow older and their children start to leave home, they turn their attention and spending to their Pet Children.
Most of these answers are the ones that we expected. However, as we have learned from past experience, it is always a good idea to look “beneath the surface” of the overall numbers. In a follow up post, we will drill deeper into the data. We will determine the best and worst performing segments in each demographic category and specifically, who generated the largest increases and decreases in Pet Spending in 2015. As usual, expect some surprises.
Pets are obviously an integral part of the American way of life…but there is still room for the relationship to grow.