
Retail Sales – The Path from 2019 to 2023
In this report we fill take a closer look at the Retail journey from 2019 to 2023. It was a traumatic time for America and the retail marketplace. We experienced a massive pandemic followed by the worst inflation in 40 years. Granted, much of the pricing surge was started by supply chain issues due to the pandemic. However, they were different problems with different solutions for recovery.
Our analysis will include an overview of annual retail sales from 2019 to 2023 followed by a more in depth look in which we factor inflation into the numbers. This gives us a “real” view of the situation as it shows the change in the amount of product sold. We will look at the Big Retail groups then drill deeper into the pet relevant channels. First, here is an overview of the Big 4 Groups and Total Retail.
You immediately see the impact of the 2020 pandemic as sales dropped in Restaurants, Auto and Gas Stations. The drops were especially large in Restaurants and Gas Stations due to closures and the “stay at home” attitude. Total Retail had an increase every year, even 2020. The 2020 lift was solely due to Relevant Retail. They are the only member of the Big 4 to have consistent annual growth. The only drop outside of 2020 was by Gas Stations. They had ridiculously high inflation. In 2023, it’s cumulative impact was very visible as their total $ dropped. Now, let’s look a little deeper. The next chart tracks the actual and real (inflation factored in) annual $ changes. We have included 2018>19 so that you can compare 19>23 to a pre-pandemic year.
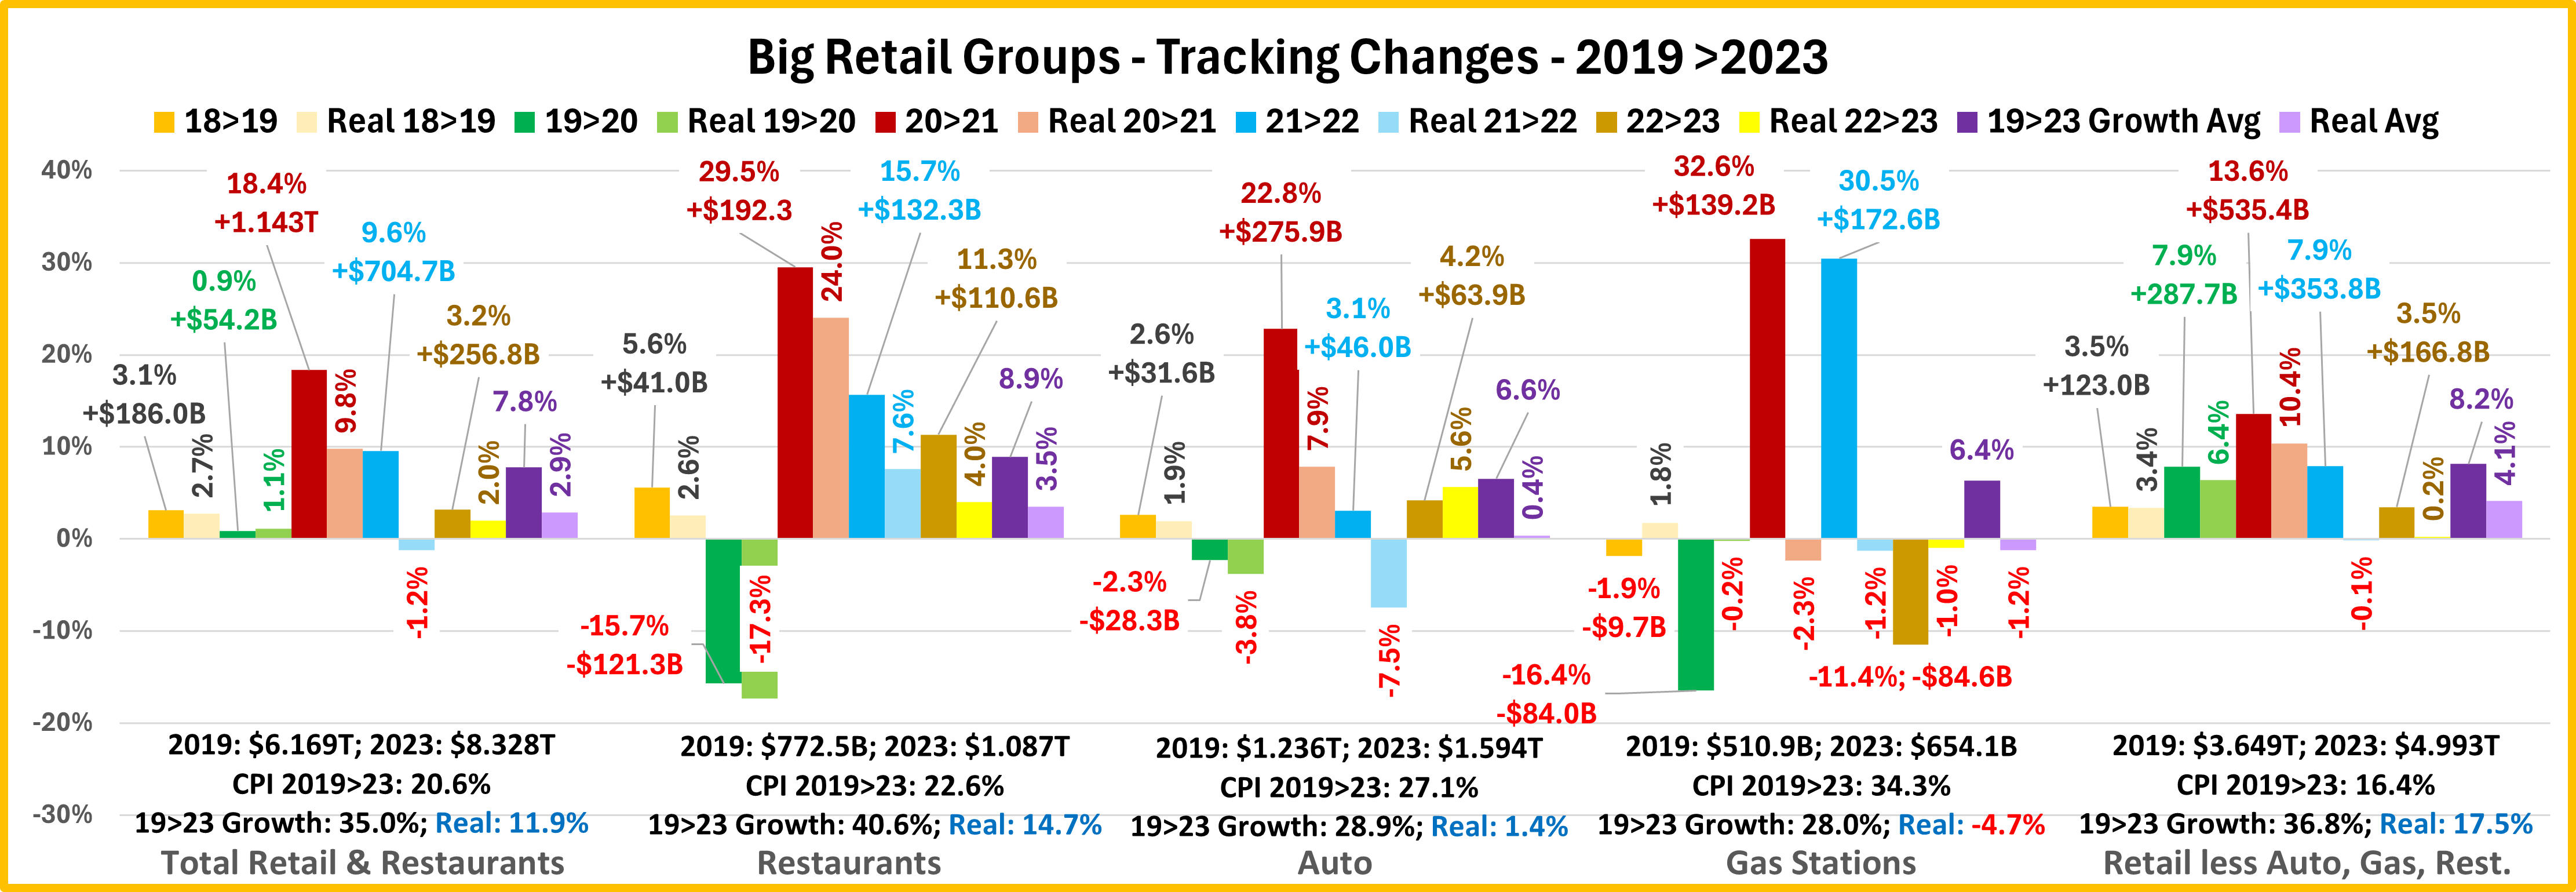
The first thing that you notice is that there are a lot more negatives. There were 9 “real” annual sales drops added to the 4 actual drops. 36% of all real annual measurements were negative. Plus, the average real growth in Gas Stations is negative. Only 16% of actual annual sales measurements were negative. This clearly demonstrates the impact of inflation. Another result of inflation is very evident. All groups and Total Retail had a strong COVID recovery with their biggest lift occurring in 2021. Inflation peaked in 2022. You will note that the annual actual increases were progressively smaller in 2022 & 2023 – another immediate and cumulative impact of inflation.
Now let’s take a more detailed look at each of the big groups.
Total Retail – Thanks to Relevant Retail, they eked out a +0.9% increase in 2020. Commodity prices actually deflated -0.3% in 2020. Things changed in 2021. They had a strong 18.4% recovery as sales grew by $1.1T. However, strong inflation began, +7.8% so only 53% of the growth was real. The 21>22 increase slowed to 9.6% but Inflation grew to 10.9%. (Peak: June, 13.6%) The result was a -1.2% drop in real sales. Inflation slowed to 1.2% in 23 but the $ increase dropped to 3.2%, about the same as 18>19 but 59% below average. However, 60% was real.
Restaurants – They were hit hard by the pandemic as sales fell -15.7%. Inflation also slowed from 3% to 2%. Consumers returned to eating out in 2021. Sales increased 29.5%, despite the fact that inflation more than doubled to 4.4%. The increase slowed to 15.7% in 2022 as inflation peaked at 7.5%. In 2023, sales growth was still in double digits at 11.3% and inflation fell slightly to 7.0%. But you see clear evidence of its cumulative impact. In 21, 81% of their growth was real. In 23, it was down to 35%. Overall, 36% of their 40.6% 19>23 growth is real.
Auto – In 2019, prior to the pandemic, they had a small, 2.6% increase and inflation was only 0.7%. The pandemic brought a small, -2.3% drop in sales and inflation inched up to 1.6%. In 2021, sales took off, +22.8%, but so did inflation, 13.9% (the peak). Only 35% of the growth was real. In 22, inflation was 11.4%. Sales were only up 3.1% so real sales were down -7.5%. In 23, prices deflated -1.4% and sales grew by 4.2%. However, just 5% of their 28.9% growth since 2019 is real. Essentially, they are selling the same amount as 2019, but charging 27.1% more.
Gas Stations – Amazingly, prices deflated in 2019, -3.6%, but sales still fell -1.9% because consumers only bought 1.8% more gas. Sales plummeted -16.4% in 2020, despite a -16.3% drop in prices. People bought -0.2% less gas. Prices exploded in 21 & 22, with 30+% increases in both years. Sales also increased over 30% in both years, but consumers bought 1>2% less. In 23, prices fell -10.6%, but it didn’t help as sales fell -11.4%. People bought 1.0% less. In 2020, consumers began driving a lot less, but they radically increased the amount of home deliveries. We bought -4.7% less gas in 23 than in 19 but in every year, we bought 98>99% of the amount bought the previous year.
Relevant Retail (Total less Restaurants, Auto & Gas Stations) – 2018>19 growth was 3.5%, 97% was real because inflation was only 0.1%. In 2020 they had the only growth, +7.9%, which kept Total Retail positive. Inflation was 1.4% so 81% of the lift was real. In 21, they had a strong increase, but inflation doubled to 2.9%. However, 76% of the growth was still real. In 22, prices exploded to +8.1%. Sales still increased but the lift slowed to 7.9% and real sales turned slightly negative, -0.1%. In 23, inflation plunged to 3.2% but prices were still 16.4% above 2019. The sales increase fell to 3.5%. This was the same as 18>19 but only 6% was real – cumulative inflation.
Recap– The situation is obviously complex. In 23, all groups had a 28+% increase from 2019 but when you consider inflation, the percentage of their increase that was real peaked at 48% for Relevant Retail. Gas Stations were even really down -4.7%. Relevant Retail has a number of channels, which took many different paths. Let’s look deeper.
Here is an overview of the most Pet Relevant Retail Channels
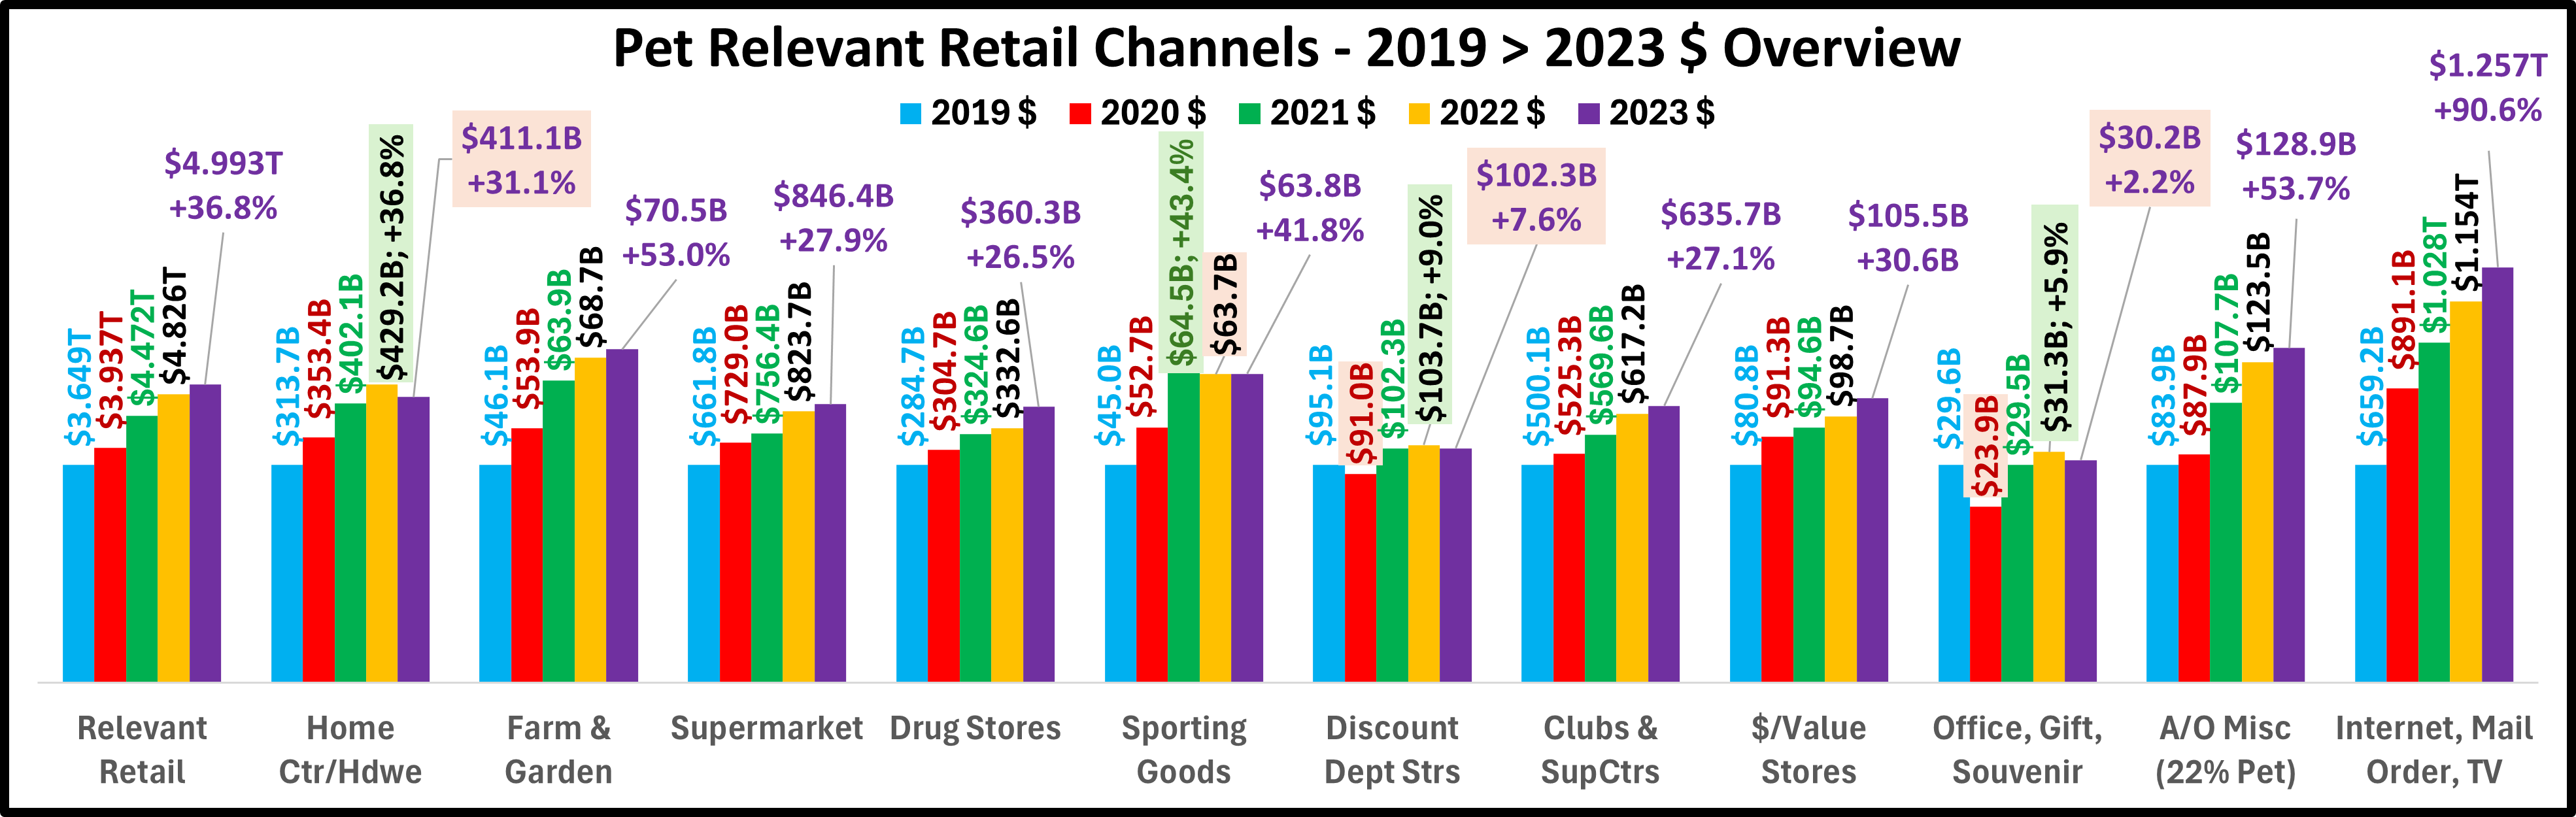
There is a lot of consistency. 7 of 11 channels had consistent annual growth so they peaked in 2023. Of the other 4 channels, Discount Department Stores & Office, Gift & Souvenir Stores had the same pattern – drops in 2020 & 2023 with sales peaking in 2022. Home Center/Hardware stores had consistent growth until sales dropped in 2023. Sporting Goods Stores peaked in 2021 then fell in 2022. They have essentially plateaued at their 2021 peak. All channels sold more in 2023 than in 2019. The biggest increases came from the Internet, +90.6%, A/O Misc. (includes Pet),+53.7%, and Farm Stores, +53.0%. Now, let’s look at the details.

Relevant Retail, 11 Channels – 19: 8 were actually & really up. 20: Inflation was still low, at 1.4% so the number really & actually up grew to 9; 21: The CPI grew by 2.9% but actual & real sales increased for all 11. 22: Prices grew by 8.1%. 10 had sales increases but only 4 were real and Relevant Retail sales were really down -0.1%. 23: 8 were up and 5 were real. However, the lifts were smaller. The lift, 3.5%, was equal to 2019 but the percentage of real growth fell from 97% to 6%.
Home Ctr/Hardware – 19: The CPI was low at 1.5% but sales fell -2.6%. 20 & 21: Sales took off, by about +13% in both years, even as the CPI grew from 1.8% to 3.5%. 22: Prices jumped up by 10.9%. $ still increased by 6.7% but real sales were -3.7%. 23: Prices grew 7.4% and sales fell -4.2%. Now, only 14% of their 31.1% 19>23 growth is real.
Farm/Garden – 19: Unlike Home Ctrs, they had a small lift, +2.6%. 20>23: The same pattern as Home Ctrs/Hdwe but their 20 & 21 lifts were 33+% larger. Their 22 & 23 lifts were not enough to overcome inflation so real sales fell -3.1% in 22 and -4.5% in 23. However, 42% of their 53% 19>23 growth was real – 3 times better than Home Ctrs.
Supermarkets – 19: Inflation was 0.9% and sales grew 3.4%. 20: The CPI was 3.5% but the $ took off, +10.1%. 21: Inflation stayed at 3.5% but the increase slowed to 3.8%, with only 0.3% real growth. 22: The CPI jumped by 11.4%. Sales were up 8.9% but really down -2.3%. 23: Inflation slowed to 5.0% but the $ increase was only 2.8% and real sales were down -2.2%. Only 8% of their 27.9% 19>23 growth is real.
Drug Stores – 19: The CPI was 0.0% and $ grew 1.7%. 20: The increase quadrupled to 7.0% and prices only grew by 0.5%. 21: Prices deflated -1.5% and sales were +6.6%. 22: The CPI grew to 2.9% and the $ increase slowed to 2.5% so real sales were -0.4%. 23: Inflation grew to 4.2% but $ had their biggest lift, +8.3%. Despite rising inflation, 73% of their 26.5% 19>23 growth is real.
Sporting Goods – 19: The CPI was 1.2% and sales grew 2.2%. 20: Inflation stayed at 1.2% but sales took off, +17.2%. 21: inflation increased over 5 times to 6.7% but the lift increased to 22.3% reaching their 19>23 sales peak. 22: Prices grew 5.2% and sales dropped -1.2%. 23: Prices fell -0.5% but sales only grew 0.1%. They have basically plateaued near the 2021 level but 61% of their 41.8% 19>23 growth is real.
Discount Dept Strs: 19: Prices deflated -0.1% but $ still fell -2.5%. 20: The CPI was only 0.3% but sales still dropped -4.3%. 21: Prices were up 2.4% but their sales recovered, +12.3%. 22: Inflation more than doubled to 5.7% and the $ lift slowed to 1.4%. Real sales were -4.1%. 23: The CPI fell to 2.2% but sales decreased by -1.4%. Their sales are up 7.6% from 2019 but their real sales are down -3.1%.
Clubs & SuperCenters: 19: The CPI was 0.1% and sales grew 2.9%. 20: CPI was 1.6%. Sales grew 5%. 21: CPI increased to 2.8% but sales increased by 8.4%, 5.5% real. 22: Inflation peaked at 7.8%. $ again grew by 8.4% but real growth fell to 0.5%. 23: The CPI slowed to 3.4% but the cumulative impact caused growth to slow to 3.0% and real growth turned negative at -0.4%. Only 34% of their 27.1% 19>23 growth was real.
$/Value Stores: 19: CPI = 0.1%. Also, a 2.9% sales increase. 20: CPI = 1.6%. Sales spiked at +13.0%. 21: CPI = 2.8%. $ growth slowed to 3.7%. Real growth only 0.9%. 22: CPI jumped up to 7.8%. Sales growth increased to 4.3% but real growth was negative, -3.2%. 23: CPI slowed to 3.4% and sales increased by 6.9% so real growth turned positive again at 3.4%. 40% of their 30.6% 19>23 growth was real, a little better than Clubs/SupCtrs.
Office/Gift/Souvenir – 19: CPI = -0.1%. Sales fell -2.1%. 20: CPI = 0.3%. Sales plummeted, -19.2%. 21: CPI = 2.4%, Sales had a strong recovery, +23.6%. 22: CPI jumped to 5.7% and growth slowed to 6.1%. 23: The CPI moved down to 2.2% but sales fell -3.6%. Although their actual sales are up 2.2% from 2019, they are really down -7.9%.
A/O Mscellaneous (22% Pet) – 19: CPI = -0.1% and sales grew 3.4%. 20: CPI = 0.3% and sales increased by 4.8%. 21: CPI increased to 2.4% but sales took off, +22.5%. 22: The CPI jumped to 5.7% and the lift slowed a little to 14.7% so now only 58% was real. 23: The CPI dropped to 2.2% but sales growth slowed to 4.4% and only 48% was real. Their overall 19>23 growth was 53.7% (2nd best) and 72% was real.
Internet/Mail Order – 19: CPI = -0.1%. Sales were +12.7%. 20: CPI = 0.3%. Sales skyrocketed, +35.2%. 21: CPI = 2.4%. Growth slowed but was still +15.4%. 22: CPI increased to 5.7% and sales were +12.2%. Now only 51% of the growth was real. 23: CPI dropped to 2.2% but sales growth slowed to 8.9%, 30% below 2019. They are by far the 19>23 growth leader, +90.6% and 79% of their increase was real.
Recap: The retail journey from 2019>23 was complex, so you have to look deeper than the overall sales to better understand what was happening. The Pandemic and the worst inflation in 40 years were major traumas. Factoring inflation into the data to get the real changes was especially important. You see that different channels took different paths. Retail has largely recovered from the Pandemic, but the price surge recovery is still ongoing.

