2018 Pet Food Spending was $28.85B- Where did it come from…?
As we continue to drill ever deeper into the demographic Pet spending data from the US BLS, we have now reached the level of individual Industry segments. We will start with Pet Food, the largest and arguably most influential of all. We have noted the trendy nature of Pet Food Spending – 2 years up then spending goes flat or turns downward for a year. This pattern began in 1997 but has become more pronounced since 2003. After the dip in 2016, Food spending increased by $4.6B in 2017 due to a deeper market penetration of super premium foods. We then expected a small increase in 2018 but what we got was a $2.27B decrease (-7.3%). This was likely due to the reaction to the FDA warning on grain free dog food. A pattern of over 20 years was broken by 1 statement. Let’s take a closer look.
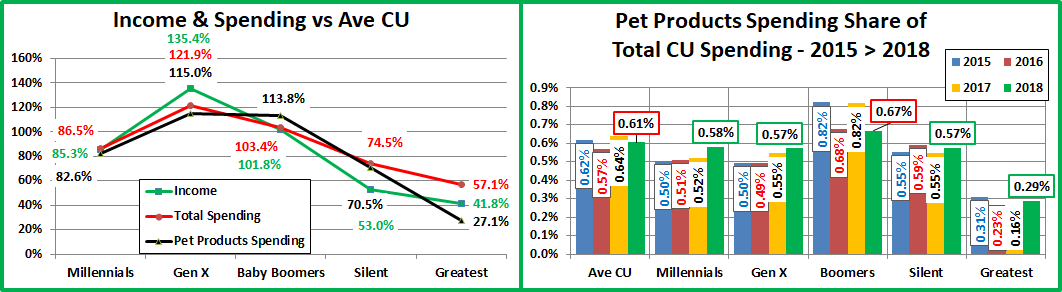
First, we’ll see which groups were most responsible for the bulk of Pet Food spending and the $2.27B drop. The first chart details the biggest pet food spenders for each of 10 demographic categories. It shows their share of CU’s, share of pet Food spending and their spending performance (Share of spending/share of CU’s). 9 of the groups are the same as Total Pet. However, Pet Food spending by Age group has become more balanced and skewed slightly older. The categories are presented in the order that reflects their share of Total Pet Spending. This highlights the differences in importance. In Pet Food the # of earners is far less important while Marriage matters more. Also, while Income is still the highest performing demographic characteristic, it carries less weight in Food spending. Another big difference is that Total Pet had 6 groups performing at or above 120%. Pet Food had only 4. This indicates that Pet Food spending and Pet ownership is spread more evenly across demographic segments. Pet Products also had only 4 groups over 120%. This shows the influence of the Pet Food Segment which still accounts for 59% of Pet Products $ and 37% of all Pet Spending.

- Race/Ethnic – White, not Hispanic (83.2%) – down from 86.6%. This large group accounts for the vast majority of spending in every segment. Like 7 other big groups, their performance fell. It was down to 120.5% from 126.4%, but this category still ranks #4 in terms of importance in Pet Food Spending demographic characteristics. While Hispanics, African Americans and Asian American account for over 31% of U.S. CU’s, they spend only 17% of Pet Food $. However, this is up from 13% last year. Pet ownership is relatively high in Hispanic households and they fueled the growth, but it remains significantly lower for African Americans and Asian Americans.
- # in CU – 2+ people (80.3%) – down from 82.4%.The share of market for 2+ CU’s is over 80% for all segments but Services. Their overall Food performance fell from 115.6% to 113.8% largely because it was a bad year for 2 person CUs and a good year for singles. 2 Person households are still the performance leader but in the 2+ group only 4 person CU’s underperform…slightly. Their lowest performance rating is 94%, which is not bad. The old adage about Pet Spending is still true, “It just takes two.”
- Housing – Homeowners (76.8%) – down from 80.9%. Homeownership is a huge factor in pet ownership and more pet spending. However their share dropped and their performance fell from 128.6% to 121.0%. Homeownership went from 2nd to 3rd in terms of importance for increased pet Food spending. It was an incredibly bad year for Homeowners w/o a mortgage and a good year for renters.
- Income – Over $50K (68.7%) – down from 70.5%. Although their performance rating dropped significantly from 136.9% to 128.9%, CU income is still the single most important factor in increased Pet Food Spending. However, the over $50K income group has its smallest market share and lowest performance in the Food Segment. Since Pet Food is a “must buy” for Pet Parents, this is evidence that pet ownership is common across all income levels. The drop in share and performance was largely driven by a $2.9B decrease in spending by the $50>149K group.
- Education – Associates Degree or Higher (62.8%) – up from 55.4%. Education regained importance in Pet Food Spending. The performance of higher education grew from 102.4% to 115.2%. All groups with a formal degree after High School spent more. The other groups, especially HS grads w/some college spent less.
- Occupation – All Wage & Salary Earners (60.4%) – down from 67.7% – In an exact reversal of 2017, the spending of Blue-Collar workers dropped precipitously while the Self-employed spent more. Even though Tech/Sls/Clerical workers increased spending, the performance of All Wage & Salary earners fell from 110.8% to 98.9%. This big group is no longer “earning their share” in Pet Food Spending.
- # Earners – “Everyone Works” (58.2%) – down from 58.4%. There was little change from last year as their performance also fell slightly from 101.9% to 100.7%. Income matters most in Pet Food Spending but it appears that the # of Earners matters very little, regardless of whether overall spending in the segment is up or down.
- Age – 45>74 (60.4%) – down from 65.9%. There was a huge decrease by the 55>64-yr olds but the 35>54 yr olds also spent less. The 65>74 group increased spending by $0.92B so the “big” group became 45>74. The performance of the new group fell from 128.2% to 118.7% so “Age” category dropped out of the 120+% club.
- CU Composition – Married Couples (61.3%) – down from 62.5%. Although they lost a little in share and their performance fell from 126.3% to 123.5%, they moved up from 5th to 2nd place due to Married CUs with children.
- Area – Suburban (60.1%) up from 55.4%. Suburban areas are the biggest Food spenders and they gained share. Their performance jumped from 99.6% to 108.4% due to a bad year by Rural and a $1.5B gain by Suburbs >2500
9 out of 10 big spenders for Pet Food are the same as those for Total Pet and Pet Products but generally have a lower market share and performance. Pet Food spending fell $2.27B in 2018. We have strong initial indications that much of the drop came from a complete reversal of spending from the groups that upgraded in 2017, possibly due to the FDA warning. Income is still important but there are indications of more balanced spending in most demographic categories.
Now, we’ll look at 2018’s best and worst performing Pet Food spending segments in each category.
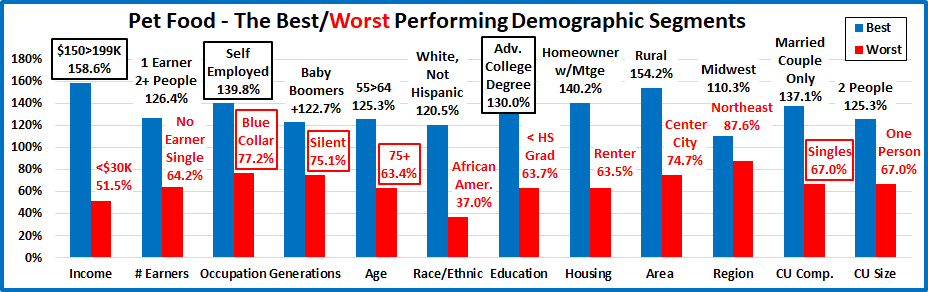
Even as we drill down to the Industry segment level, many of the best and worst performers are the ones that we would expect. In Pet Food spending, there are 7 that are different from 2017, which is 2 more than for Total Pet but the same as Pet Products. 7 of 12 winners are the same as Pet Products but all the losers match. This demonstrates the impact that the Food spending decrease had on overall Pet Products. Changes from 2017 are “boxed”. We should note:
- Income is important in every segment. However, Food is the only segment in which the winner is not $200K+. Also, every income group above $50K is performing at or above 100% in Pet Food Spending.
- # Earners – 1 Earner, 2+ CU’s took the top spot for the second consecutive year. While income is still the biggest factor, the number of earners is far less important in Pet Food than any other segment – more balanced spending.
- Occupation & Education – The winners and losers returned to more “normal” segments.
- Generation – As usual, the Boomers won, but the Millennials are no longer the worst performers – finally!
- Age – Despite a terrible year, the 55>64-yr olds finished on top. The big news is the <25 group got off the bottom.
- CU Composition – Married, Couples Only won for the 4th straight year.
- Area – Rural won again but their performance fell from 238.9% to 154.2% and they dropped from 1st to 2nd
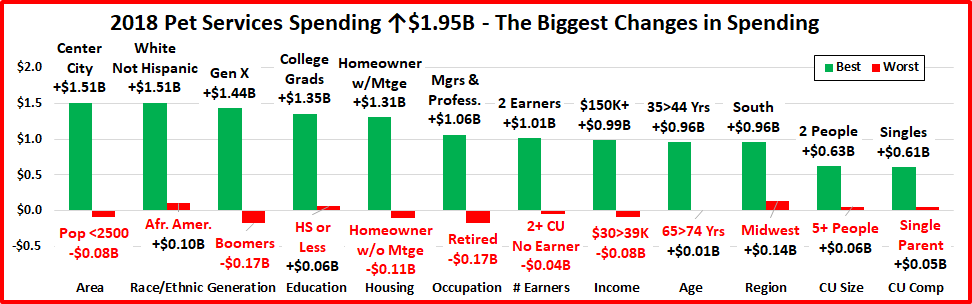
It’s time to “Show you the money”. Here are segments with the biggest $ changes in Pet Food Spending.

There is 1 repeat from 2017 – the South lost again. 17 of the 24 segments (71%) flipped from 1st to last or vice versa – talk about turmoil! 6 of the 12 categories had dual flips but we still had some surprise winners, like Millennials, 65>74 yr olds and Renters. It is at this level where the demographic uniqueness of the different industry segments truly shows up. Here are the specifics:
- Income – The winner and loser flipped in 2018.
- Winner – $150 to $199K – Pet Food Spending: $2.83B; Up $1.08B (+62.3%)
- 2017: $40 to $69K
- Loser – $50 to $69K – Pet Food Spending: $3.77B; Down $1.38B (-26.8%)
- 2017: $150 to $199K
- Comment – Only the $150>199K and $30>39K group spent more on Food in 2018, +$2.03B. The other groups – High, Middle and Low were down -$4.3B.
- Winner – $150 to $199K – Pet Food Spending: $2.83B; Up $1.08B (+62.3%)
- Generation – The Millennials finally earned some of their publicity with a win.
- Winner – Millennials – Pet Food Spending: $6.04B; Up $0.99B (+19.6%)
- 2017: Boomers
- Loser – Boomers – Pet Food Spending: $11.78B; Down $3.93B (-25.0%)
- 2017: Silent
- Comment – Boomers are still the biggest spenders but are subject to big $ swings with their 4th consecutive flip.
- Winner – Millennials – Pet Food Spending: $6.04B; Up $0.99B (+19.6%)
- Area Type – Rural gave back all of their 2017 gains and flipped from 1st to last.
- Winner – Suburbs >2500 – Pet Food Spending: $12.97B; Up $0.78B (+6.4%)
- 2017: Rural
- Loser – Rural – Pet Food Spending: $3.70B; Down $2.47B (-40.0%)
- 2017: Central City
- Comment – Areas over 2500 pop. spent more, +$0.88B. Areas under 2500 spent a lot less, -$3.15B
- Winner – Suburbs >2500 – Pet Food Spending: $12.97B; Up $0.78B (+6.4%)
- Occupation – A dual flip from 2017.
- Winner – Self-Employed– Pet Food Spending: $2.41B; Up $0.78B (+47.6%)
- 2017: Blue-Collar Workers
- Loser – Blue-Collar Workers – Pet Food Spending: $4.64B; Down $3.58B (-43.6%)
- 2017: Self-Employed
- Comment – This is where the spending flip becomes better defined. Blue-Collar Workers clearly backed down from their 2017 food upgrade, which was a likely reaction to the FDA warning. At the same time, the Self-Employed grew in number and took the opposite route by spending significantly more per CU on Pet Food.
- Winner – Self-Employed– Pet Food Spending: $2.41B; Up $0.78B (+47.6%)
- Age – The 65>74 yr olds are truly a surprise winner.
- Winner – 65>74 yrs – Pet Food Spending: $4.80B; Up $0.75B (+18.5%)
- 2017: 55>64 yrs
- Loser – 55>64 yrs – Pet Food Spending: $6.73B; Down $03.51B (-34.3%)
- 2017: <25 yrs
- Comment: The 55>64-yr olds flipped from 1st to last but all groups from 35>64 spent less. However, the older and younger groups spent more. The result was that Pet Food spending became more balanced in terms of age.
- Winner – 65>74 yrs – Pet Food Spending: $4.80B; Up $0.75B (+18.5%)
- Housing – The unusual growth from renters came from both younger and older groups.
- Winner – Renters – Food: $6.69B; Up $0.74B (+12.4%)
- 2017: Homeowners w/o Mtge
- Loser – Homeowners w/o Mtge – Food: $7.13B; Down $3.06B (-30.0%)
- 2017: Homeowners w/Mtge
- Comment – Homeowners w/o Mtge flipped from first to last but the decrease didn’t come from Retirees. Their spending was up. It likely came from Baby Boomers who have paid off their home but are still working.
- Winner – Renters – Food: $6.69B; Up $0.74B (+12.4%)
- # Earners – No Earner, Singles were the only group to increase CU spending on Pet Food.
- Winner –– No Earner, Single – Pet Food Spending: $2.28B; Up $0.64B (+38.8%)
- 2017: 1 Earner, 2+ CU
- Loser – 1 Earner, 2+ CU – Pet Food Spending: $7.12B; Down $1.51B (-17.5%)
- 2017: 2 Earners
- Comment – 1 Earner, 2+ CUs flipped from biggest increase to biggest decrease but still remained the top performing group. This happened often in 2018 and shows just how big of a lead that they had on other groups.
- Winner –– No Earner, Single – Pet Food Spending: $2.28B; Up $0.64B (+38.8%)
- Race/Ethnic – A dual flip as Hispanics moved to the top with a 29% spending increase.
- Winner –– Hispanic – Pet Food Spending: $24.01B; Up $0.62B (+29.3%)
- 2017: White, Not Hispanic
- Loser – White, Not Hispanic – Pet Food Spending: $2.74B; Down $2.93B (-10.9%)
- 2017: Hispanic
- Comment – The U.S. is slowly becoming more racially/ethnically diverse. In 2014 White, Not Hispanics were 70.2% of U.S. CUs. In 2018 their share was down slightly to 69.0%. This group is by far the biggest spender in every Pet Industry Segment. However, they have their smallest share in Food, and it is slowly shrinking. In 2014 it was 86.7%. In 2018 it was down to 83.2%. Since it is a necessity, Food spending is one indicator of Pet ownership. Pet Ownership by Hispanics is relatively high. It may be increasing in Asian American and African American CUs.
- Winner –– Hispanic – Pet Food Spending: $24.01B; Up $0.62B (+29.3%)
- CU Composition – A dual flip, but Married Couple Only is still the performance leader.
- Winner – Married, Oldest Child <6 – Food: $1.16B; Up $0.56B (+93.4%)
- 2017: Married, Couple Only
- Loser – Married, Couple Only – Food: $9.06B; Down $2.05B (-18.4%)
- 2017: Married, Oldest Child <6
- Comment – In 2017 Married Couples with the oldest child <6 was the only segment in this category to have a decrease. In 2018, they were on top. However, Married, Oldest Child 6>17, Single Parents and Singles also spent more. Every other group spent less. It was an unusual year in Pet Food spending.
- Winner – Married, Oldest Child <6 – Food: $1.16B; Up $0.56B (+93.4%)
- Education – Another dual flip and more evidence of the reversal of the 2017 upgrade.
- Winner – Assoc. Degree – Food Spending: $3.4B; Up $0.52B (+18.0%)
- 2017: HS Grad w/some College
- Loser – HS Grad w/some College – Food Spending: $5.67B; Down $3.44B (-37.7%)
- 2017: Assoc. Degree
- Comment – Those with an Associate’s degree, College Grads, High School Grads and even those who didn’t finish High School all spent more on Food, but they couldn’t overcome the huge drop by HS Grads with some College.
- Winner – Assoc. Degree – Food Spending: $3.4B; Up $0.52B (+18.0%)
- # in CU – A final dual flip, but once again the loser remains the best performing segment in the category.
- Winner – 3 People – Pet Food Spending: $4.67B; Up $0.47B (+11.2%)
- 2017: 2 People
- Loser – 2 People – Pet Food Spending: $12.28B; Down $2.53B (-17.1%)
- 2017: 3 People
- Comment: 3 person CU’s and singles were the only sizes with increased Food spending. This means that married couples with only 1 child had the biggest increase in pet food spending in 2018.
- Winner – 3 People – Pet Food Spending: $4.67B; Up $0.47B (+11.2%)
- Region – Last year every region spent more. This year they all spent less.
- Winner – West – Pet Food Spending: $6.78B; Down $0.14B (-2.1%)
- 2017: Midwest
- Loser – South – Pet Food Spending: $10.73B; Down $1.16B (-9.7%)
- 2017: South
- Comment – Although The South kept the “loser” position, the fact that every region spent less shows the widespread impact of the 2018 Pet Food spending reversal.
- Winner – West – Pet Food Spending: $6.78B; Down $0.14B (-2.1%)
We’ve now seen the “winners” and “losers” in terms of increase/decrease in Pet Food Spending $ for 12 Demographic Categories. The results strongly reinforce our initial observations of a spending reversal by the groups that largely drove the $4.6B increase in 2017. Since the spending drop occurred in the second half, it is likely a reaction to the FDA warning about grain free dog food made in July of 2018. In this situation there were a number of segments with a huge decrease in spending. However, we have identified 11 of the 12 “winning” segments which unsuccessfully tried to reverse the $2.27B decrease in Pet Food Spending. They were not alone. Not every good performer can be a winner. Some “hidden” segments should also be recognized for performance. They don’t win an award, but they get…
HONORABLE MENTION
 The spending lift by the <25 group may be the most significant because it signals increased involvement with pets. The $30>39K income group reflects the positive performance by Retirees. Asian Americans’ spending was up 35.5% which is a great sign as this group has the lowest percentage of pet ownership. Single Parents rarely win any spending awards. Their 13.7% increase deserves recognition. Also, the “bosses” generally get the credit, but the Tech/Sales/Clerical workers spent $0.54B more in 2018. Finally, the Millennials had the biggest increase, but the Gen Xers weren’t far behind, +$0.61B. The drop in Pet Food Spending was widespread, but 2018 wasn’t all bad news. 43 of 92 demographic segments, 46.7% spent more on Food.
Summary
As we have noted, the Pet Food spending drop in 2018 was unexpected as it broke a pattern of 2 years up followed by 1 year of flat or declining sales which has been going on since 1997. This trendy nature increased with the first significant move to premium foods in 2004. The Melamine crisis in 2007 intensified the pattern and resulted in a series of “waves” which became a tsunami with the introduction of Super Premium Foods.
The 25 to 34 yr old Millennials were the first to “get on board” with Super Premium in the second half of 2014. In 2015 a substantial portion of consumers began to upgrade to this new trend. The result was a $5.4B spending increase. These consumers were generally more educated, often worked as managers or were self-employed and had higher incomes. One negative was that they often paid for the upgrade by spending less in other segments. In 2016 the anticipated drop in spending happened. The “upgraded” group began value shopping for their new food and found great deals online and in some stores. They spent some of the $3.0B “saved” Food dollars in other segments but not enough to make up for the drop in Food. Total Pet Spending was down $0.46B. In 2017 we were ready for a new “wave”. Thanks to a very price competitive market, what we got was a deeper penetration of Super Premium foods. This group of upgraders was mostly middle-income, not college educated and often Blue-collars workers. Most also were in the 55>64 year old age group. The result was a $4.6B increase but this time there was no trading $ with other segments.
That brings us to 2018. We expected a small annual increase in Pet Food and spending in the first half was up $0.25B. Then the bottom dropped out as spending fell $2.51B in the second half. The timing of this spending drop, in correlation with the FDA warning on grain free is too close to be a coincidence. When we got the 2018 data, we began an in depth demographic analysis of Pet Food Spending. It turns out that the big decrease in pet food spending was coming directly from the groups who had fueled the big 2017 increase. They had obviously backed off from the previous year’s upgrade “en masse”. Fear for their pet’s welfare is the obvious reason for such an abrupt turnaround. This is especially true since the primary motivator for pet parents is the health and well-being of their pet children, especially regarding nutrition.
As you have seen from our analysis, it certainly caused turmoil in the segment as 71% of the demographic groups with the biggest change in Pet Food $ switched from first to last or vice versa from their position in 2017. However, It wasn’t all turmoil and bad news. 47% of 92 democratic segments increased pet food spending. They may have upgraded even more, added supplements or wanted more facts on grain free. The other good news is that the average gap between the best and worst performing segments in 12 categories fell by 23%. Pet Food spending is becoming even more demographically balanced in America. We’ll see what 2019 brings. Are we starting a new pattern or maybe no pattern?
Finally – 2018’s “Ultimate” Pet Food Spending CU is 2 people – a married couple, alone. They are 55>64 years old. They are White, but not of Hispanic origin. At least one has an advanced college degree and they both work in their own business. They earn $150 to $200K but are still paying for a mortgage on their house in a small suburb in the Midwest.