2019 U.S. PET FOOD SPENDING $31.19B…Up ↑$2.35B
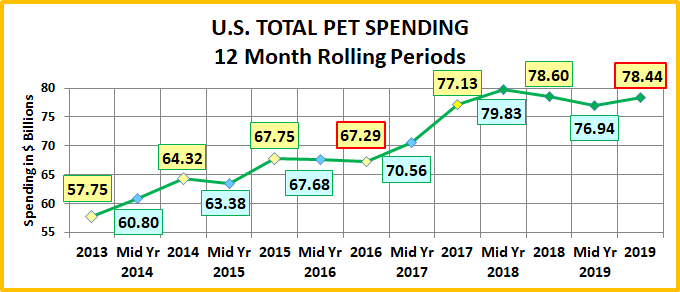
In 2019 The Pet Industry was a mixed bag. Total spending fell slightly to $78.44B, down $0.16B (-0.2%). Food recovered from the impact of the FDA grain free warning. Veterinary had another modest increase and the Services segment was basically stable. The big downside was Supplies, where we saw the full impact of tariffs. Here are the specifics:
- Pet Food – $31.19B; Up $2.35B (+8.1%)
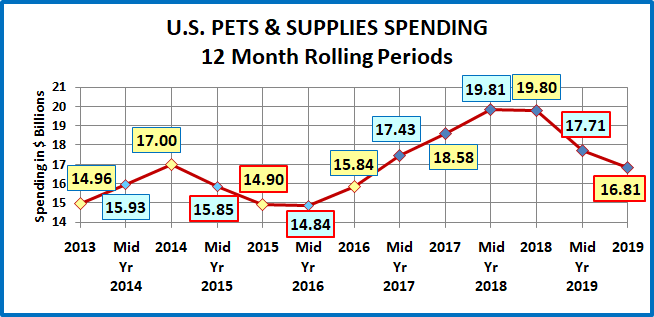
- Pets & Supplies – $16.81B; Down $2.98B (-15.1%)
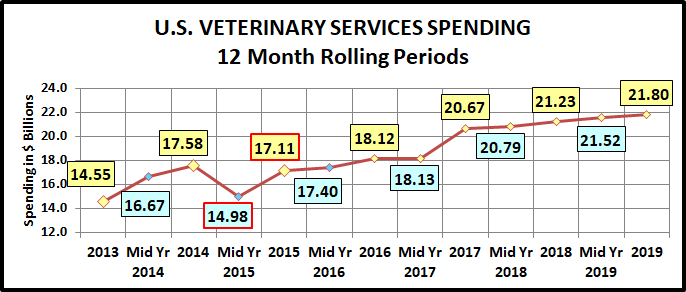
- Veterinary – $21.80B; Up $0.58B (+2.7%)
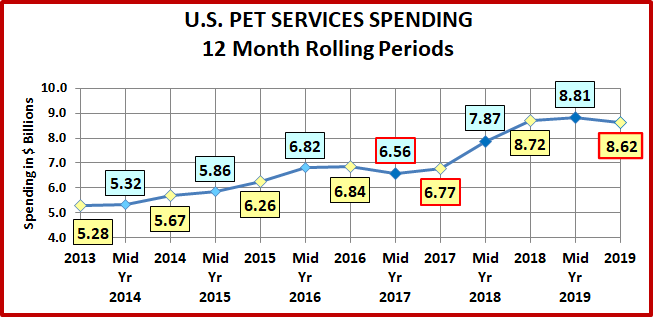
- Pet Services – $8.62B; Down $0.10B (-1.1%)
The industry truly is a “sum” of its integral segments and each segment has very specific and often very different buying behavior from the many consumer demographic segments. For this reason, we’re going to analyze each of the industry segments first. This will put the final analysis of Total Pet Spending into better perspective. Note: The numbers in this report come from or are calculated by using data from the current and past US BLS Consumer Expenditure Surveys. In 2019, this was gathered by the U.S. Census Bureau from over 42,000 interviews and spending diaries. The final data was then compiled and published by the US BLS.
We will start with the largest Segment, Pet Food (and Treats). In 2019 Pet Food Spending totaled $31.19B in the U.S., a $2.35B (+8.1%) increase from 2018. This was the 4th largest increase in history. It’s interesting that 3 of the 4 greatest $ increases and the 2 biggest $ decreases have all occurred in the last 5 years. The current trend in high priced, super premium foods magnifies the results of any changes in consumer purchasing behavior. As you recall, in earlier research we discovered a distinct, long term pattern in Pet Food Spending. In 2018 we broke that pattern. We’ll see what develops in the future. Take a look at Pet Food Spending since 1997 in full Retail Dollars and adjusted for inflation.

The pattern began in 1997. Retail Pet Food Spending increases for 2 consecutive years then reaches a plateau year or even drops. There was a notable exception in the period from 2006 to 2010. During this time, there were two traumas which directly impacted the Pet Food Retail market. The first was the Melamine recall, which resulted in radically increased prices as consumers insisted on made in USA products with all USA ingredients. The second affected everyone – the great Recession in 2009. This was the first time that annual U.S. retail spending had declined since 1956. The net result was that the plateau period was extended to include both 2009 and 2010.
Pet Food seems to be driven by short term trends. A new food trend catches the consumers’ attention and grows…for 2 years. Then sales plateau or even drop…and we’re on to the next “must have”. The changes became more pronounced in recent years and the whole situation has gotten even more complicated since 2014. Due to an unprecedented level of competition, Food prices deflated through 2018. Then they jumped up +2.9% in 2019, the biggest increase since 2009.
After consumers choose to upgrade to a more expensive pet food, their #1 priority becomes, “Where can I buy it for less?” The internet entered this battle in a big way and “value shopping” was a major contributing factor in the big spending drop in 2016 and its influence continues to grow.
In 2017, according to the 20-year pattern, we should have been beginning a new trend. There was the expected lift in Pet Food spending but what was the new “must have” type! There were some possible candidates, but nothing stood out. A deeper dive into the data showed that the $4B increase in Pet Food spending in 2017 didn’t come from a new trend. It came from a deeper demographic penetration of Super Premium foods. Value shopping in a highly competitive market, especially on the internet had made Super Premium pet foods more accessible to a broad swath of consumers.
Like Pet Food, human behavior has changed over the years in regard to our pets. In the 90’s, Pet Owners became Pet Parents. Then, after the turn of the century we began truly humanizing our pets. This movement is very accurately reflected in the evolution of Pet Food. We became increasingly more conscious of fulfilling the health needs of our pets, beginning with the first move to premium foods in 2004. This ramped up considerably after the Melamine scare in 2007. Now consumers read pet food labels, research ingredients and expect their pet foods to meet the same quality standards as the best human foods. This was very evident in 2018. It should have been a year of increased spending but the consumers’ reaction to the FDA grain free warning threw the pattern out the window.
In 2019 Pet Food spending posted a strong recovery. Let’s look at some specifics to see where the lift came from. In 2019, the average U.S. Household (pet & non-pet) spent a total of $236.26 on Pet Food. This was an 7.4% increase from the $219.92 spent in 2018. This doesn’t exactly “add up” to the 8.1% increase in total Food Spending. With additional data provided from the US BLS, here is what happened.
- 0.7% more U.S. households
- Spent 12.2% more $
- 4.2% less often
By the way, if 67% of U.S. CU’s are pet parents then their annual Pet Food Spending is $352.63. Let’s look at a rolling history of Pet Food Spending since 2013.
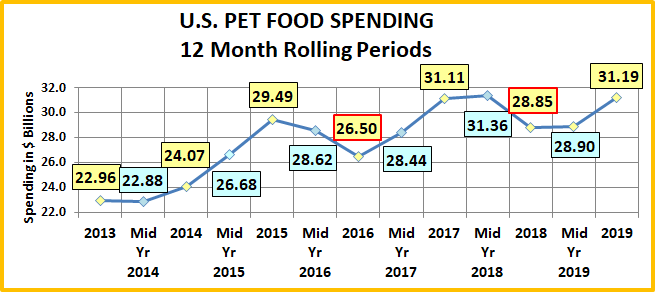
Pet Food Spending fell in 2013 and continued down in the first half of 2014. This corresponds to the beginning of a general deflation which continued through 2018 in this segment. During deflation, in a “need” category like Food, you don’t buy more, you just spend less. The spectacular lift in Pet Food Spending beginning in the second half of 2014 came from a fundamental change in spending behavior. Consumers began to buy more Super Premium Food and Med/Supplements in Treat form, all of which cost more.
An increasing number of consumers chose to upgrade their Pet Food and spending peaked in 2015. Then spending began to fall in the first half of 2016 and the decline intensified in the second half. At first it appeared that consumers were backing down on the upgrade. As it turns out, they were just applying the #1 driver in their buying behavior since the great recession – price (75%). They began shopping for value and there were plenty of bargains to be found.
In 2017 Pet Food spending registered the second largest increase in history. It was time to begin a new “trend”, but this big lift was unusual. Usually the biggest increase comes in the 2nd year of a cycle. There also was no clear product focus.
Looking deeper into the data we discovered that it was not a new food trend. It was a deeper demographic penetration of Super Premium. Higher education and higher income have driven recent food trends. However, the highly price competitive market had made these high-priced foods more accessible to Blue Collar workers and those without college degrees. Baby Boomers in these groups, with their strong commitment to their pets, responded in a big way, +$3.8B.
After such a big lift in year 1, the 2018 increase was expected to be small and the first half started out that way, +$0.25B. Then the bottom dropped out in the second half of the year as spending fell -$2.51B, the biggest half year decrease in history. In July of 2018, the FDA issued a warning about the possible connection between DCM and grain free dog food. This was frightening and one suggestion was to move back to standard foods, which apparently many people did.
In the beginning of 2019 Total Pet Food spending stabilized as some doubts were raised about the validity of the warning. In the second half of the year Food Spending increased +$2.3B. Some Pet Parents began to return to the topline Super Premium Foods. In some cases, they opted for even more expensive varieties. We also saw some new groups get on board the Super Premium “Express”.
The growth of Pet Food spending since 2014 reflects the rise of Super Premium but also another trend – the spectacular increase in the number and use of Pet Medications and Supplements, which are often produced in the form of treats. Together, the strength of these 3 Pet Food product subcategories reflect the Pet Parents’ absolute number 1 current concern – the health, wellbeing and safety of their Pet Children, which starts with the quality of their food.
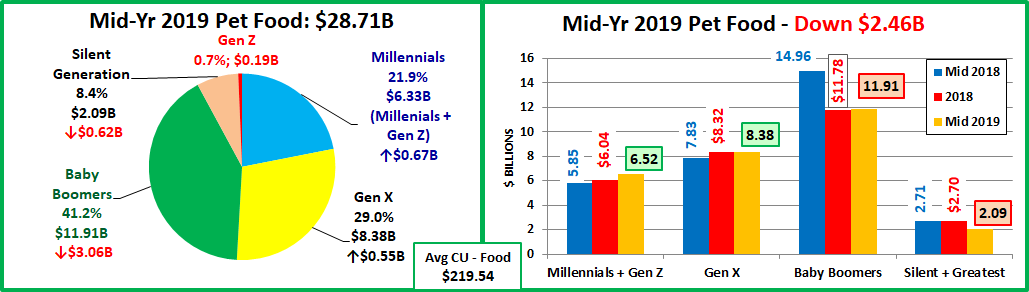
Now let’s look at some specific 2019 Pet Food Spending Demographics. First, we’ll look at income. Prior to 2014 it was a less dominant factor in Food spending. However, the move to Super Premium has brought it more to the forefront. In 2017, with competitive pricing and the consumers’ commitment to pet health, Super Premium drove spending growth in every major income group. In 2018 we had the FDA warning which affected almost all groups. In 2019 the category recovered to 2017 levels, but income once again became a key factor in the rebound. In this chart we will show the annual spending from 2015 through 2019. This will put the 2019 numbers into better perspective.

2019 National Numbers: $236.26 per CU (+7.4%); $31.19B; Up $2.39B (+8.1%); 2015>2019 – Up $1.70B (+5.8%)
There is a clear income divide which is even more defined than the graph indicates. All groups below $40K spent less. All over $40K spent more. Prices inflated 2.9% which may have impacted low income groups.
Here are 2019 specifics:
- Under $30K: (27.0% of CU’s) – $120.17 per CU (-0.7%) – $4.04B – Down $0.23B (-5.3%). Obviously, this group is very price sensitive. It is also getting smaller. The number of CU’s was down 5.4% in 2019 and 13.1% since 2015. This decrease masks the true food situation. While their Total Food spending is lower than 2015, their Avg CU spending on food is unchanged. The Total is being driven down by the declining number of CUs. Even this lowest income group remains committed to their pets.
- $30K>$70K: (31.5% of CU’s) – $191.66 per CU (-5.4%) – $8.15B – Down $0.40B (-4.7%). The spending for this group usually matches the national pattern. However, they broke it in 2019. Retirees’ average income is $30>39K. Their Food spending drop due to the FDA warning was slow – 2019, rather than 2018. They are a large, fast growing group. The $40>69K group was up +$0.40B. $30>39K spent -$0.80B less, turning the whole large group negative.
- $70K>$99K: (14.5% of CU’s) – $306.19 per CU (+13.3%) – $5.90B – Up $0.62B (+11.8%). The Pet Food Spending for this group had been very stable. In 2017, this changed as they got “on board” with the Super Premium Pet Food upgrade. They also became more sensitive, reacting to the FDA warning in 2018, then bouncing back in 2019.
- $100K>$149K: (13.8% of CU’s) – $309.94 per CU (+8.5%) – $5.92B – Up $0.74B (+14.2%) They have a high income but also large families, so they are very value conscious. Their spending matches the national pattern. You can see their sensitivity to trends/changes by their large annual swings in spending.
- $150K> (13.3% of CU’s) – $409.78 per CU (+18.4%) – $7.19B – Up $1.61B (+29.0%). 91% are college grads so they saw the value of Super Premium food very early. They were the only group to spend more on Pet Food in 2018. Their reaction to the FDA warning was to buy even more expensive food and this behavior is growing in 2019.
In 2018, the decrease in Pet Food spending was widespread across incomes. In fact, groups totaling 83.9% of all U.S. households spent less on Pet Food. In 2019, the “rebound” spending increase only happened for households with incomes above $40K, 61.4%. As we have fully moved into the era of Super Premium, Pet Food spending is becoming more tied to income. Now, Spending by Age Group…
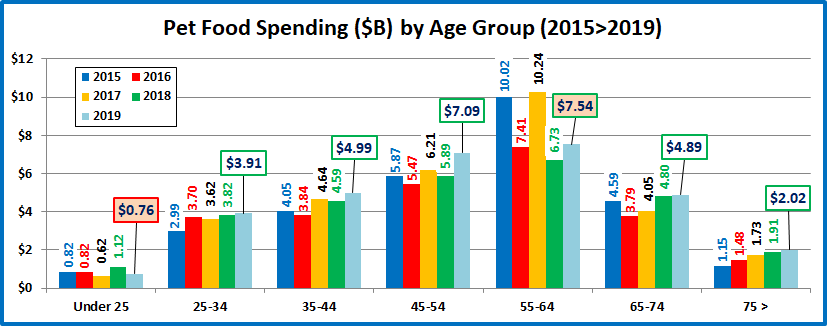
2019 National Numbers: $236.26 per CU (+7.4%); $31.19B; Up $2.39B (+8.1%); 2015>2019 – Up $1.70B (+5.8%)
For Pet Food spending, the youngest group was on the outside, with the only spending decrease. They gave back their big lift in 2018. The three highest income age groups (35>64) spent $2.41B more, led by the 45>54 Gen Xers.
- 45>54 (16.8% of CU’s) – $316.22 per CU (+23.7%) – $7.09B – Up $1.20B (+20.4%) This group is #1 in income and total CU expenditures. Up until 2015 they were #1 in Pet Food spending. They bought premium food but didn’t “buy in” to Super Premium until 2017. They were negatively impacted by the FDA warning, but they rebounded stronger than any other group. In fact, they took the lead in average CU Pet Food spending.
- 55>64 (18.6% of CU’s) – $306.58 per CU (+13.6%) – $7.54B – Up $0.81B (+12.0%). This group (all Baby Boomers) has been at the forefront of recent major spending swings. In 2015 many of them upgraded to Super Premium. In 2016 this group looked for and found a better price. In 2017 they led a deeper penetration of the upgrade. In 2018 they had a -$3.5B reaction to the FDA warning. They spent more in 2019 but their comeback was far short. In fact, their Pet Food spending in 2019 is -$2.48B (-24.8%) below 2015. They only spent the most Food $ because of more CUs.
- 35<44 (16.9% of CU’s) – $226.83 per CU (+7.7%) – $4.99B – Up $0.40B (+8.8%) They are 2nd in income and CU spending but have the biggest families. Value shopping is a way of life and their spending pattern tends to be less volatile. They opted in for Super Premium in 2017, held their ground in 2018 and are back on a growth track in 2019.
- 65>74 (14.9% of CU’s) – $251.14 per CU (-0.2%) – $4.89B – Up $0.09B (+1.8%). This group is 90% Boomers and growing (+2.1%). They are starting to retire but many are still working (0.7 per CU). They tend to lag behind in response to industry trends. Pets are a priority as they spend 1.04% of their total CU expenditures on their pets.
- 75> (11.2% of CU’s) – $148.54 per CU (+2.5%) – $2.02B – Up $0.11B (+5.9%). Both the effort and the expense of Pet Parenting become issues as we reach 75+. However, they remain committed to their Pets and high quality food.
- 25>34 (16.1% of CU’s) – $175.43 per CU (-3.9%) – $3.91B – Up +$0.10B (+2.5%) In recent years their spending pattern has foreshadowed the overall market for the following year. Their spending lift in 2018 predicted the overall increase in 2019. However, the 2020 projection is questionable. They spent less per CU. The 2019 increase came only from more CUs. Another situation should be noted. They are the most stable in spending. That is surprising.
- <25 (5.5% of CU’s) – $98.91 per CU (-26.9%) – $0.76B – Down -$0.36B (-32.4%) After a spectacular 2018, they radically cut spending and the number of CUs fell -3.3%. It appears that fewer Gen Zers are moving out from their parents homes. Except for 2018, their pet food spending has been consistently low. In 2019 they were one of only 2 groups that actually spent less than they did in 2015.
The situation in the age groups is even simpler than in the income groups. Every group over 25 (94.5%) spent more on Pet Food in 2019. The other significant event was that the title for top Pet Food spending CU was passed from young Baby Boomers to old Gen Xers. The Boomers will inevitably fade but it will take a long time. Look at the ongoing strong performance by the 65>74 year olds. Next year this group will be 100% Boomers.
We need to drill deeper. Let’s take a look at the segments with the biggest change in spending in 12 categories. The segments that are outlined “flipped” from 1st to last or vice versa from 2018. The red outline stayed the same.
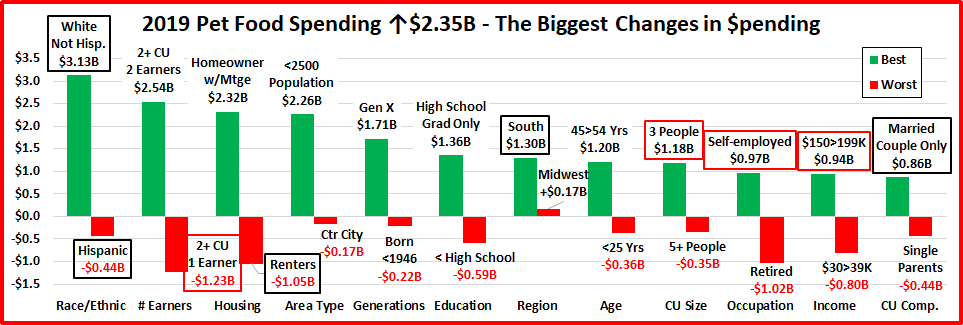
2017 was a spectacular year of growth as Super Premium became very demographically widespread across America. The impact of the FDA grain free warning was very apparent in 2018. It was the year of the “flip” as 11 of 12 winning segments in 2017 became the biggest losers in 2018. There were 4 others who moved from last to first. Only the South maintained their position at the bottom of the Regions.
2019 looked a lot more normal. There was not a strict recovery of 2018 losses as only 3 segments moved from last to first. Of note, the South finally made it to the top. Only 2 flipped from first to last and 4 maintained their position – 3 at the top and 1 on the bottom. The 2019 lift in Food spending was widespread as 75% of 96 demographic segments posted an increase. The winners and losers included plenty of the “usual suspects”:
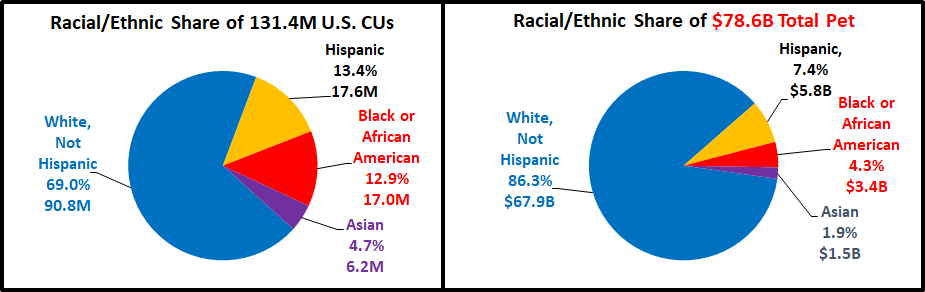
Winners: White-Not Hisp, 2 Earner, Homeowner w/Mtg, <2500 pop., Self-employed, $150>199K & Married Couple Only
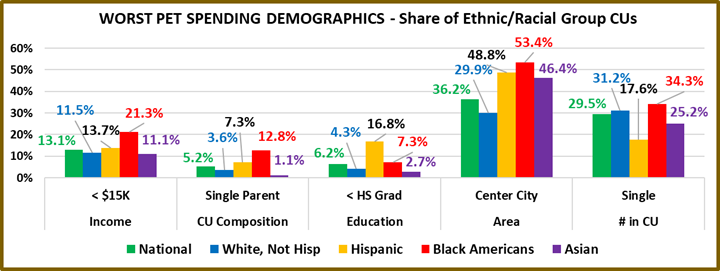
Losers: Hispanic, Renters, Ctr City, Oldest Generation, Less than HS Grads, <25 yrs, 5+ People, Single Parents
On the “up” side we should also note High School Grad Only as winners. This is further evidence that Super Premium is reaching even deeper into the marketplace. We also should give credit to Gen Xers (45>54 yr olds) for taking the lead in increased spending and average spent per CU.
We also see evidence of the lag time in spending behavior for Retirees ($30>39K). They had a negative reaction to the FDA warning in 2019. Virtually everyone else reacted in the second half of 2018.
2019 was a strong year as spending returned to more normal behavior. We’ll see what happens in the 2020 pandemic.