
Race and Ethnicity in the Pet Industry
The issue of racial and ethnic inequities is a hot topic right now and for good reason. Despite laws and constitutional amendments, major societal and economic disparities still exist between White, Not Hispanics and minorities in the United States. In this report we will start to look at the Pet industry in terms of Race and Ethnicity. The Data is taken from U.S. Government sources including the USBLS Consumer Expenditure Survey, the HUD American Housing Survey and the Census Bureau’s Annual Business Survey. All of the surveys are designed and conducted by personnel from the U.S. Census Bureau to insure that they accurately represent the situation in the total U.S.
First let’s look at the racial/ethnic share of U.S. CU’s (financially independent Consumer Units – more defined than H/Hs) compared to their share of $78.6B in Total Pet Spending in 2018. Note: 260K CUs identify as both Black and Hispanic. This is only 0.2% of all U.S. CUs and about 1.5% of each group so it has little effect on the numbers. Their data appears to more closely match that from the Black group so whenever possible it is included with them. This is a first indication of the impact of Race in U.S. society. Race/Skin Color is more significant than ethnicity.
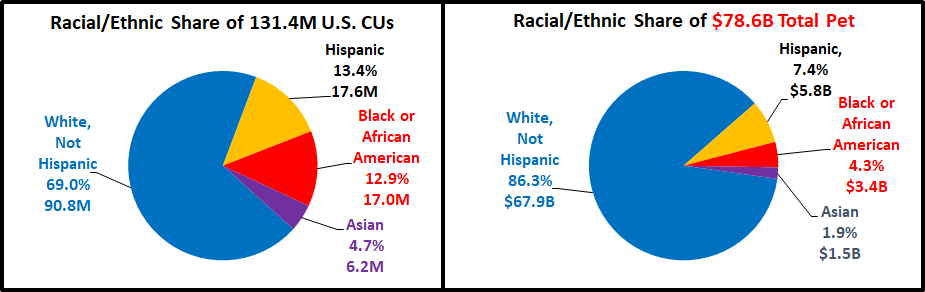
The White, not Hispanic group obviously takes a much bigger bite out of the Pet Spending Pie. Let’s see how their spending compares at the CU level for Total Pet and the 4 industry segments.
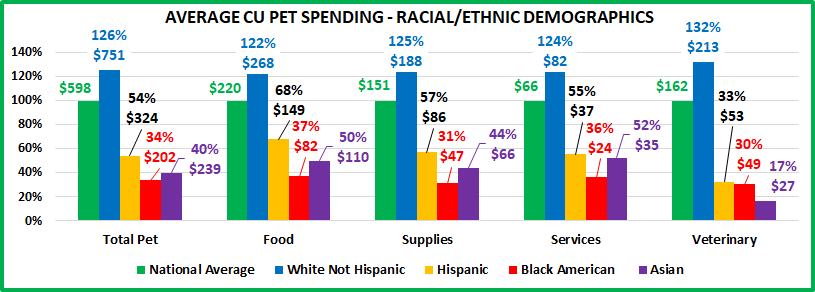
- As you can see the White, not Hispanic group is the runaway winner in all segments.
- Hispanics finish 2nd across the board and Black Americans are last overall and in all segments but Veterinary.
- Although the disparity between White and Minority spending is still huge, it is lowest in the Pet Food Segment. This makes sense as it is the only true necessity in Pet Spending. You may not opt for Super Premium, but if you have a pet, you need to buy food.
- We usually think of Veterinary spending as another pet necessity. However, strongly inflating prices in recent years have caused many pet parents to delay or cancel services. This has been especially impactful in many minority households. The result is that the biggest racial/ethnic disparity is in the Veterinary segment.
Race/Ethnicity is a big factor in Pet Spending. Let’s take a closer look at the other key drivers behind the numbers.
The chart below shows the key CU demographics that drive increased Pet Spending. Regarding Race/Ethnicity, people have no choice in what group they are included. In the other categories they can affect what segment that they are in. The graph shows the biggest spending group in the demographic category along with their Share of Pet spending and Share of CU’s. Then we divide share of spending by share of CUs. This “Performance” allows us to compare the relative importance of the demographic categories.
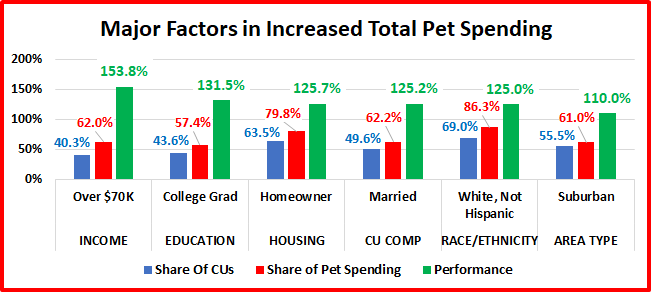
The chart shows only Total Pet Spending. However, while the performance numbers may vary slightly between segments, all of these demographic groups are important in all areas of Pet Spending.
- We saw in our very first pie chart that race/ethnicity was important. In this chart we see that there are 4 other demographics that are equally or even more important in Pet Spending.
- Higher Income is the single most important factor in all segments. It is at its lowest level in food but grows in importance as spending becomes more discretionary in Supplies and Services…or super expensive in Veterinary.
- A College degree generally means higher income, but it also correlates with recognizing the “value” of super premium foods and regular Veterinary care.
- Homeownership – Space that you own, and control has always led to increased Pet ownership and spending.
- Married couples have made a commitment to each other. They are far more likely to commit to pets.
- Suburbia – More space means more room for Pets. Pet ownership and spending is lowest in the Central Cities. As you move away from the city it grows, peaking in the areas under 2500 population – both suburban and rural.
Now let’s break down these key demographic factors in terms of Race/Ethnicity.
The chart shows the average number or share for U.S. CUs compared to that for each of the Racial/Ethnic Groups
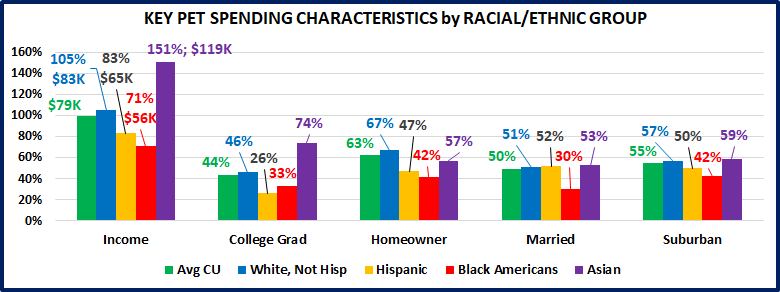
- One thing that stands out immediately is the status of Asian Americans. They are the leaders in 4 of the 5 categories, including the runaway winners in Income and Education. Yet, they have a very low level of Pet Spending. This goes contrary to all the national numbers. It also shows that there are “hidden” factors when it comes to our relationship with our pets. It suggests that there may be cultural differences in Asian American households so that pet ownership is substantially less likely than for other groups.
In light of this situation, we’ll focus on comparing White, not Hispanic to Hispanic and Black American CUs.
- Income – The Whites are a clear winner – 28% more than Hispanics and 48% more than Black Americans.
- College Education – This generally correlates with income, but the disparity is even wider. This category is the only one in which Blacks outperform Hispanics. Both groups have socio-economic inequities which keep their numbers down. However, there is a key early difference. 87% of Blacks graduate from High School compared to 71% of Hispanics. The Hispanic numbers are driven down by foreign born individuals with a 55% HS graduation rate. Blacks benefit from the availability of Historically Black Colleges and Universities which produce 20% of all Black College Grads and also the opportunity provided by athletics. They receive 23% of all college athletic scholarships and 77% graduate.
- Homeownership – Whites again lead the way, with a disparity even greater than income. We should also note that this is the only category in which Whites beat Asian American CUs.
- Marriage – This is the demographic in which Black Americans are most different from the other groups. Only 30% of Black American CUs are Married Couples. This is 40% less than all other groups of which 51 to 53% are Married Couples – with or without children.
- Suburban – Black Americans tend to live in more urban areas. They are the only group in which less than 50% of CUs live in the Suburbs. We should also note that they also live in the suburban areas with higher population.
In terms of the Best Spending Demographics, you can see why White spending far exceeds Hispanics and especially Black Americans. Now, let’s take a look at some of the worst spending groups in terms of Race and Ethnicity.
These 5 groups are the worst performing in terms of pet spending in their category.
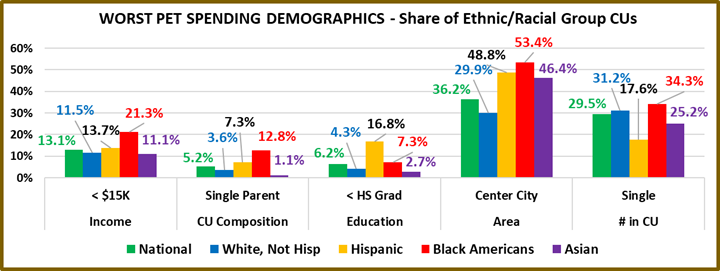
- Under $15K Income – 1 of every 5 Black American CUs makes under $15K – 63% higher than the National Avg.
- Single Parents – These CUs are generally under tremendous financial pressure. You can see that they are more likely to be Hispanic and especially likely to be Black American. In fact, 32% of all Single Parent CUs are Black American. That is stunning considering that Black Americans only make up 12.9% of total U.S. CUs.
- Less than High School Diploma – You can see where the educational disparity begins and that it goes much deeper than a college degree. 1 of every 6 Hispanic CUs has no member that completed High School.
- Center City – Black Americans are the only group with 50+% living in Center City. Hispanics and Asians are relatively evenly divided between the Suburbs and the City, but Whites tend more toward suburban/rural living.
- Single – In Pet Spending it just takes 2. Obviously, being single is not popular with Hispanics. Black Americans lead the way, but Whites are not far behind, which ultimately reduces the overall Pet $pending for both groups.
- Note: Single Parents and Singles are 2 of the lowest Pet Spending Groups. They make up 47.1% of Black CUs.
We saw that Black Americans had the lowest share of all the biggest Pet Spending groups except College Degrees, where they were next to last. Now we see that they have the highest share of all the lowest Pet Spending groups but education, where they again finish next to last. This is an overwhelming combination and provides specific reasons for their low level of Pet Spending.
When we look at the varied rates of Pet Spending, one obvious question comes to the forefront. What is the percentage of Pet Ownership? For an unbiased answer we again turn to a Government resource – HUD, The Department of Housing and Urban Development. With the help of the Census Bureau, every two years HUD conducts the American Housing Survey to measure the current state of housing in the U.S. In the 2017 Survey of over 70,000 H/Hs they included a specific section on Disaster Preparedness to assess the state of readiness across the U.S. in the event of a disaster – natural or manmade. A series of questions was both relevant and significant for the Pet Industry. They asked if respondents had a pet and if so, would they need assistance in evacuating the animal in the event of a disaster? This is obviously relevant to the industry but also significant in that the U.S. Government officially recognized that our Pet Children are an integral part of U.S. households. Their only reason for asking the question was to help insure that communities are adequately prepared to protect and save all members of their community – people and pets.
The next graph shows the results of the question regarding pet ownership by racial/ethnic groups. There is a bonus as they also include Native Americans as a separate group. The numbers are lower than what you have seen from industry sources but don’t be distracted. The key is to focus on the relative differences between groups.
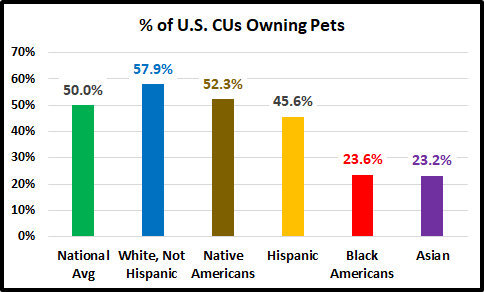
- The first thing that we note is that the pet ownership rates closely reflect the relative pattern of pet spending rates for these groups.
- The high rate for Native Americans shows that Pet Parenting is truly an American tradition.
- Asians have the lowest rate of ownership which explains their low pet spending, despite the fact that they are leader in many key demographic categories which directly relate to increased Pet Spending.
- Whites have more pets, but they also make a lot more money than Hispanics or Blacks. This is the fundamental basis for the pet spending difference between these 3 groups which is only magnified as incomes grow and the White households’ share of higher income groups becomes even larger.
From all this data, we see that there is a definite Racial/Ethnic disparity in pet ownership and pet spending. This is not the fault of the Industry. It is just a reflection of the extreme inequality in the current American Society. Black Americans are at the bottom of the ladder, with no clear route to the top without major societal changes.
So far, we have looked at the industry from the consumers’ perspective. What is the situation when we start looking up the distribution chain? Are Blacks, Hispanics and Asians represented in participating Pet Industry Companies. I’m not aware of any data that measures the racial/ethnic breakdown of Pet Company employees. However, the Annual Business Survey from the Census Bureau does track ownership by race/ethnicity for businesses with employees that qualify for this measurement. Larger Companies generally don’t fit the parameters but there are still thousands of small businesses that do. Let’s look at a few business types that are directly tied to the Pet Industry. This data is from 2017.
The chart below shows the percentage of Racial/Ethnic ownership in 3 Pet Business types and the number that qualify.
- Veterinary Clinics – 27,881
- Pet Services Outlets – 16,765
- Pet Stores – 5191
Note: We were once again able to further define the data to include Native Americans. FYI – In 2017 they accounted for about 0.9% of U.S. CUs. The numbers for each group will not total 100% because the owners of a small percentage of businesses are from multiple racial/ethnic groups.
Note: Other Racial/Ethnic shares of U.S. CU’s:
White: 69.0%
Hispanic: 13.4%
Black: 12.9%
Asian: 4.7%
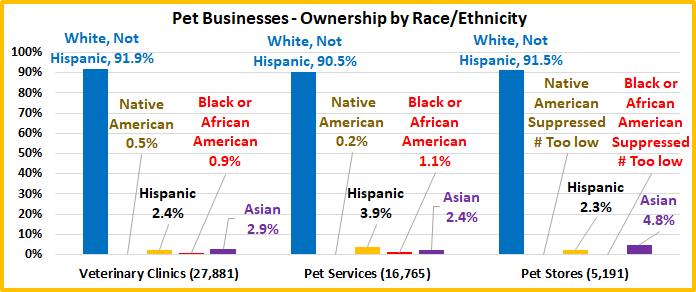
- Over 90% of all these businesses types are owned by White, Not Hispanics. That is a more dominant situation than Pet Spending, where their share was 86.3%.
- Veterinary Clinics – You can see that a huge number of Veterinary Clinics are small businesses and can be classified by the race/ethnicity of the owner. Native Americans make their best showing in this category. About 92% are white while only 0.9% are owned by Black Americans.
- Pet Services – There are also a lot of these small businesses. Stereotypically, Hispanics and Blacks are more associated with Services work. That may be true in the Pet Industry as both have their highest ownership share.
- Pet Stores – Over 5 thousand pet store owners can be classified by race or ethnicity. The share of Asian owned pet stores actually exceeds their share of U.S. CU’s, a singular situation for any minority. Hispanics are seriously underrepresented, but the biggest concern is in regard to Black Americans. The number of stores is so small that the Census Bureau doesn’t release it because looking at metro area data could reveal the sales info for a specific business. Native American data is also suppressed but they don’t account for 12.9% of U.S. CUs, like Blacks.
- Other Pet Businesses – In most cases the NAICS code doesn’t specifically define “Pet” businesses. However, data is available for Dog/Cat Food Manufacturers. There are 237 that can be classified. 223 (94%) are White-owned. Minorities own 14 businesses but again the number is so small that all Racial/Ethnic specifics are suppressed.
The Pet Industry is not the cause of the racial/ethnic inequality in the U.S but it certainly reflects the situation, especially for Black Americans. Let’s start with consumers. Due to socio-economic factors, Black Americans have an incredibly low level of pet ownership. This obviously suppresses spending, but it could even be a matter of health. HABRI is constantly offering evidence of the health benefits of Pets. The recent COVID-19 crisis has revealed that the overall health of Black Americans is the worst of any group. Programs should be developed to encourage and assist in increasing the level of pet ownership by Black American Households.
In terms of Industry Participants, minority representation is even more limited. There are no Blacks on any of the 3 Industry Organization Boards. That’s to be expected. You have to first be a member before you can be on the Board. Programs should be developed to encourage and aid minority Pet businesses of all kinds. Existing businesses should also take a look at their current staff and actively work for more diversity.
To solve a problem, you must first recognize its existence. Then take action to solve it. Racial/Ethnic inequality is definitely a problem in the Pet Industry. That means that it is also an opportunity. Let’s get to work!

