
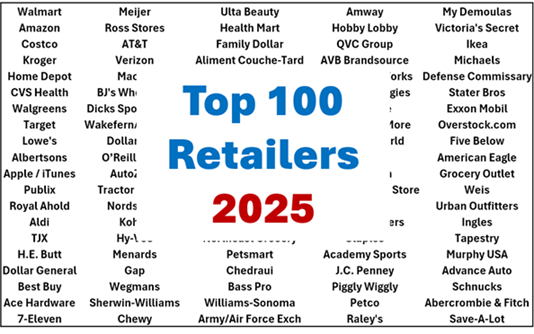
Top 100 Retailers – 2025
The U.S. Retail market reached $8.7 Trillion in 2025 from all channels – Auto Dealers, Supermarkets, Restaurants, Online retailers and even Pet Stores. The $314B, +3.7% lift was down significantly from the pandemic recovery lift of +$1.12T, +18.3% in 2021. However, the Total Retail market is now $2.64T, 43.4% ahead of 2019. That’s a strong annual growth rate of +6.2%. (Data courtesy of the Census Bureau’s monthly retail trade report.)
In this report we will focus on the top 100 Retailers in the U.S. Market. The base data on the Top 100 comes from Kantar Research and was published by the National Retail Federation (NRF). The historical data for some companies that weren’t in the Top 100 all years from 2019>2023 was gathered from other reliable sources. In 2020, Restaurants were removed from the list and only Convenience stores sales for Gas Stations were included. I adjusted the 2019 list to reflect this change. This change means that the Top 100 now only includes Relevant Retail companies. The Top 100 account for 36.0% of the total market. This share peaked at 39.8% during the 2020 pandemic and has stabilized at 36% since then. However, the Top 100 are still the “Retail Elite”. The vast majority of the group also stock and sell a lot of Pet Products so their progress is critically important to the Pet Industry. Let’s get started in our analysis. The report does contain a lot of data, but no longer a store count. We’ll still break it up into smaller pieces to make it more digestible.
We will begin our report with an overview chart of the 2019>2025 annual sales history for major segments of the Retail Marketplace. The U.S. Retail market strongly recovered from the 2020 pandemic trauma and the resurgence became widespread across most channels. Our regular retail sales reports have shown that different defined retail channels often took a different path from 2019 to 2021. In the Spring of 2021 and throughout 2022 the retail market faced a new challenge – strong inflation. The YOY price increases were the largest in decades, even reaching double digits in October of 2021 (stayed for 11 months). The high rate didn’t start to slow until July of 2022. Although the increase rate has slowed, the retail market is still feeling the impact of high cumulative inflation. The Top 100 analysis allows us to see if the company revenue size was a factor in their overall pandemic/price journey from 2019>2025. The following chart shows the annual sales and market share as well as the changes in both for large retail subgroups that are based upon the amount of their annual revenue. Note: In comments we’ll show Avg Growth Rates – Actual & Real (Inflation Related)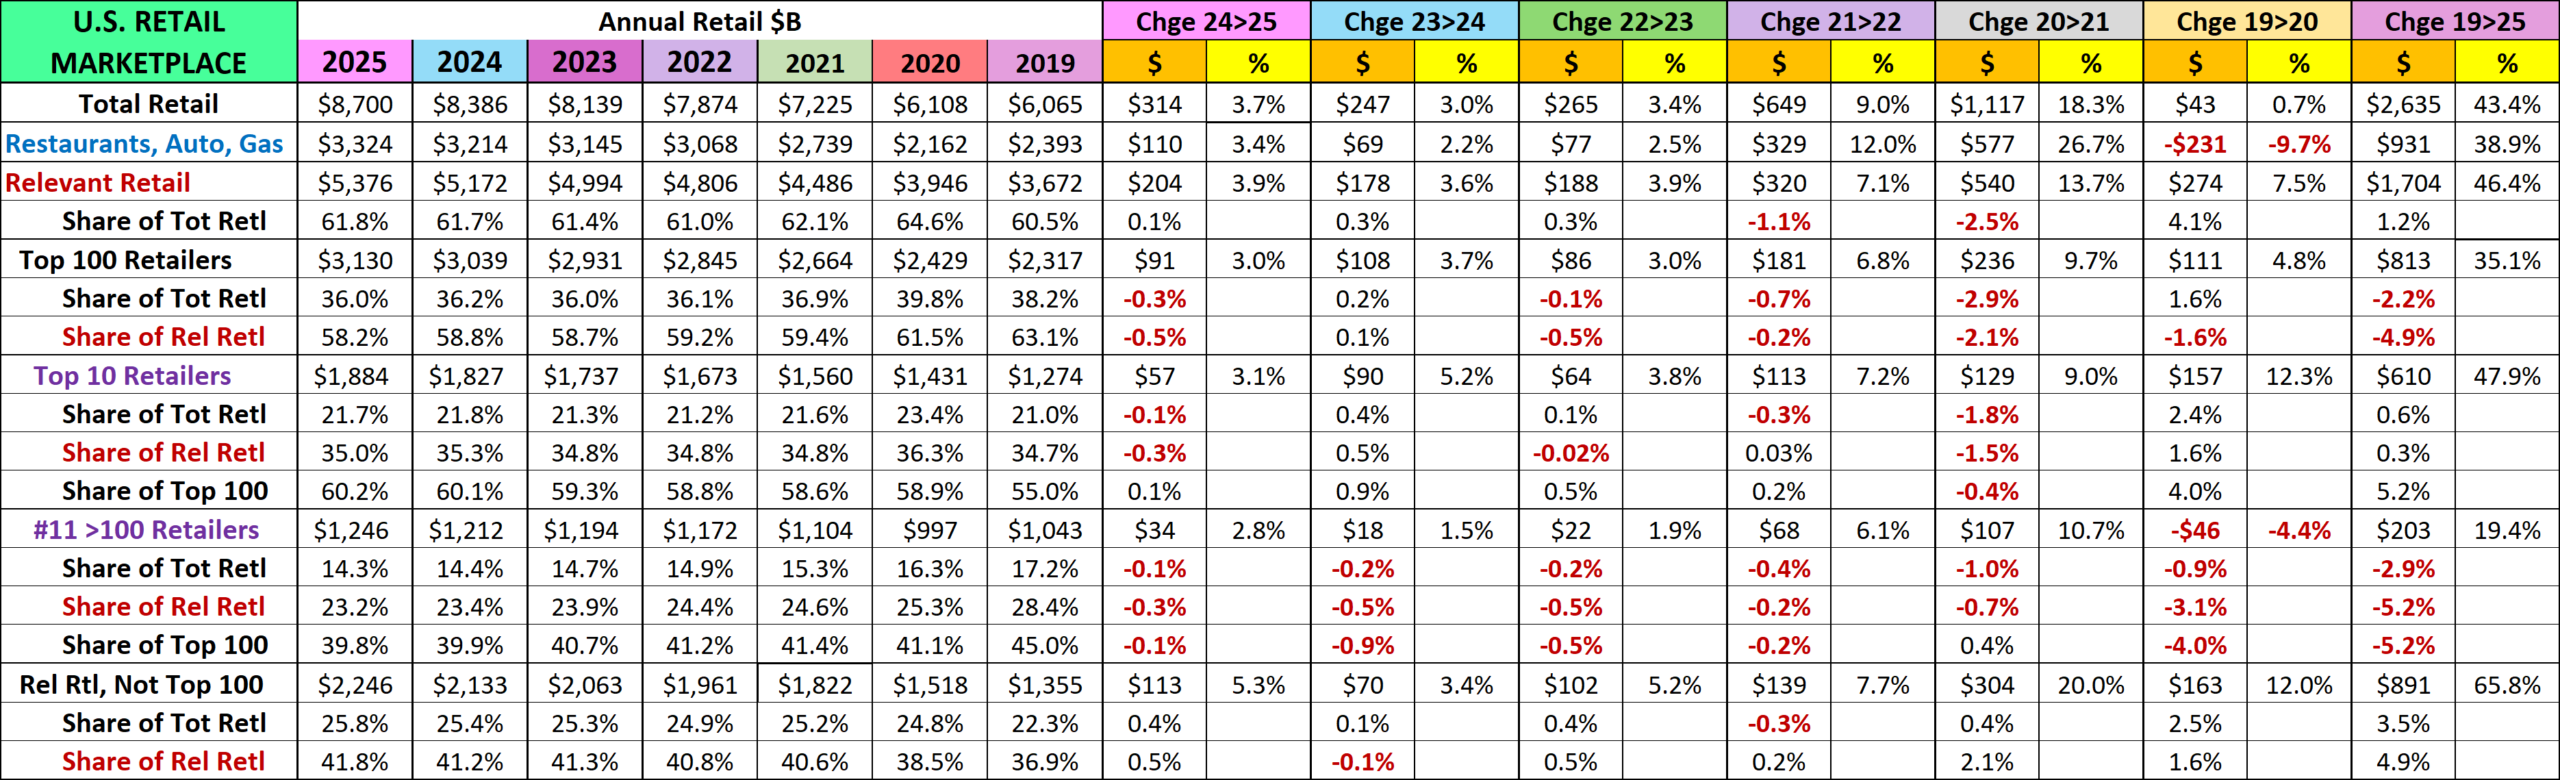
- The Total Retail Market grew $247B, +3.7% in 2025. That is far less than the $1.12T, +18.3% in 2021 and even below some pre-pandemic years: 2019, 3.6%; 2018, 4.9%; 2017, 4.3%. However, the average growth rate from 2019>25 is 6.2%, which is 59% above the 2016>19 rate of 3.9%. Factoring in inflation, Real 19>24 growth was +2.8%, about the same as the 16>19 real rate of +2.7%. Retail inflation was below 1% in 2025 but it still has a cumulative impact – smaller sales increases and only 45% of 19>25 growth is real.
- The “Non-Relevant” Group (Restaurants, Auto Dealers, Gas Stations) was hit hardest by the pandemic as sales fell -9.7% in 2020. They had a strong recovery as 20>22 sales grew $906B, 41.9%. Average annual growth: 18.8%. In 23 the increase slowed to 2.5% & 2.2% in 24. High inflation from 2019 was a factor. Gas: 27%; Auto: 24%; Restaurants: 28% In 2025, inflation slowed for all, which certainly contributed to the increased lift of 3.4%.
- Relevant Retail was the hero of the pandemic as they kept Total Retail positive in 2020. Their sales surged in the 2021 recovery then radically slowed in 23 (3.9%), 24 (3.6%) & 25 (3.9%). They were up $204B in 2025 producing an average growth rate since 2019 of +6.5%. Their Real growth rate (considering inflation) was +3.0%. Their share of Total Retail has stabilized at 61>62%, down 2.9% from its peak of 64.6% in 2020. The story is complex.
- The Top 100 Retailers make up 58.2% of Relevant Retail and 36.0% of Total Retail. Sales have grown every year since 2019, but growth slowed markedly in 23 before an uptick in 24. It slowed again in 25. Their market share has fallen since peaking in 2020 for Total Retail and 2019 for Relevant Retail. Their average growth since 2019 is +5.1%, but Real Growth is +2.3%. 45.1% of their growth is real.
- The biggest subgroup in $ in the Top 100 is the Top 10 which accounts for 60.2% of the Top 100’s revenue, up from 55% in 2019. This group has been unchanged since 2015 and consists of Amazon, plus truly essential brick ‘n mortar retailers. Their biggest sales surge occurred in 2020 which was their peak in Total & Relevant Retail market share. Their growth slowed in 23, rose in 24, then fell in 25. Their avg growth rate is +6.7%. Real growth was +3.9% – 58.2%.
- The Retailers ranked from #11 to #100 change slightly every year. Their sales in 25 ranged from $4.1B to $75.9B and they accounted for 39.8% of the Top 100’s revenue. They have an unusual sales pattern in that their -$46B decrease in 2020 is the only negative sales on the chart outside of the big drop by Rest/Auto/Gas. They did have a big 10.7% increase in 2021 but that fell to 1.9% in 23 & 1.5% in 24, before turning up to 2.8% in 25. They have lost share in Total & Rel. Retl every year since 2019 but are still a big part of U.S. Retail. Avg Growth: +3.0%; Real: 0.9% – 30.0%.
- The Relevant Retailers outside of the Top 100 don’t get a lot of “press” but maybe they should. They currently account for 41.8% of Relevant Retail $ and 25.8% of Total Retail. They had the biggest percentage increase of any Relevant Retail subgroup overall and in all years, but 20 & 24. Their avg increase is +8.8%. Real: +5.8% (66.5%), the best numbers of any group on the chart. While this performance is amazing, perhaps the most important fact is that they delivered 59% of Relevant Retail’s sales increase in 2020 and even 52% of the lift from 2019>2025.
There is no doubt that the big retailers are critical to the success of the U.S. Retail Market. However, there are sometimes “hidden heroes” that should be noted.
The Top 100 only outperformed Total Retail in 2020 and 2024. In fact, the sales growth since 2019 trails Total Retail, Relevant Retail and even Rest/Auto/Gas. It still generates 36.0% of Total U.S. Retail $ so it is still very important. We also should remember that the Top 100 is really a contest with a changing list of winners. Companies drop out and new ones are added. This can be the result of mergers, acquisitions, surging or slumping sales or even a restructuring. In 2025,
5 adds: Family Dollar (Small Value) • Five Below (Small Value) • Saks Global (Dept Str) • Murphy USA (Convenience) • Abercrombie & Fitch (Apparel)
5 drops: • Save Mart (Supmkt) • Foot Locker (Apparel) • Rite Aid (Drug) • Hudson’s Bay & Neiman Marcus (2 Dept Strs)
I think that we now have a good overview of U.S. Retail and the Top 100 so let’s turn our attention to Pet Products. They have become very important & the market is extremely competitive. How many of the Top 100 sell Pet Products?
- We should note that the data in the chart only reflects the performance of the companies in the 2025 list since 2019 and is not being compared to the Top 100 list of companies from prior years
- 90 are selling some Pet Products in stores and/or online. This is 2 more companies than 2024 and 10 more than the 1st “official” all Relevant Retail Top 100 list in 2020.
- Their Total Retail Sales of all products is $3.04 Trillion which is…
- 97.1% of the total business for the Top 100
- 56.5% of Relevant Retail
- 34.9% of the Total Retail market
- 74 Cos., with $2.84T in sales, sell pet products off the retail shelf – 90.8% of Top 100 $ & 52.9% of Relevant Retail.
- In 2025, only 2 companies in the current Top 100 changed how they handle pet products. Exxon Mobil added pet to most stores, but Advance Auto flipped from in store to online.
- As you can see by the growth in sales, “in store” is still the best way to sell pet.
- Online only is another story and the story gets complicated.
- Amazon includes Whole Foods, which has stores in 45 states so the Amazon $ are in the “Pet in Store” numbers.
- As we said, one retailer now offers Pet online rather than in store. This group had the smallest sales lifts in 24>25 and 19>25.but they still lead Non-Pet in the real 24>25 $ lift.
- Some non-pet specialty retailers like Lulumon and Signet have had extraordinarily strong post pandemic growth. The growth in the whole non-pet group slowed in 2022, fell -2.7% in 2023, then rebounded to +2.0% in 2024 & +4.0% in 2025. They are the 19>25 growth leader, but perhaps, more of them will see Pet as another growth opportunity.
- Their Total Retail Sales of all products is $3.04 Trillion which is…
The pandemic caused our Pets to become an even more important part of our households. They are truly family. Pet products have long been an integral part of the strongest retailers and are now even more widespread across the entire U.S. marketplace. Of the Top 100, Companies doing 91% of sales stock & sell at least some pet items. However, there are thousands of additional “pet” retail outlets including 15,000 Grocery Stores, 10,000 Pet Stores, 16,000 Vet Clinics, 6,000 Pet Services businesses and more. Pet Products are on the shelf in over 200,000 U.S. brick ‘n mortar stores… plus the internet. Pet Products have become part of the new “normal” for the majority of U.S. Retailers.
Before we analyze the whole Top 100 list in greater detail let’s take a quick look at the Top 10 retailers in the U.S.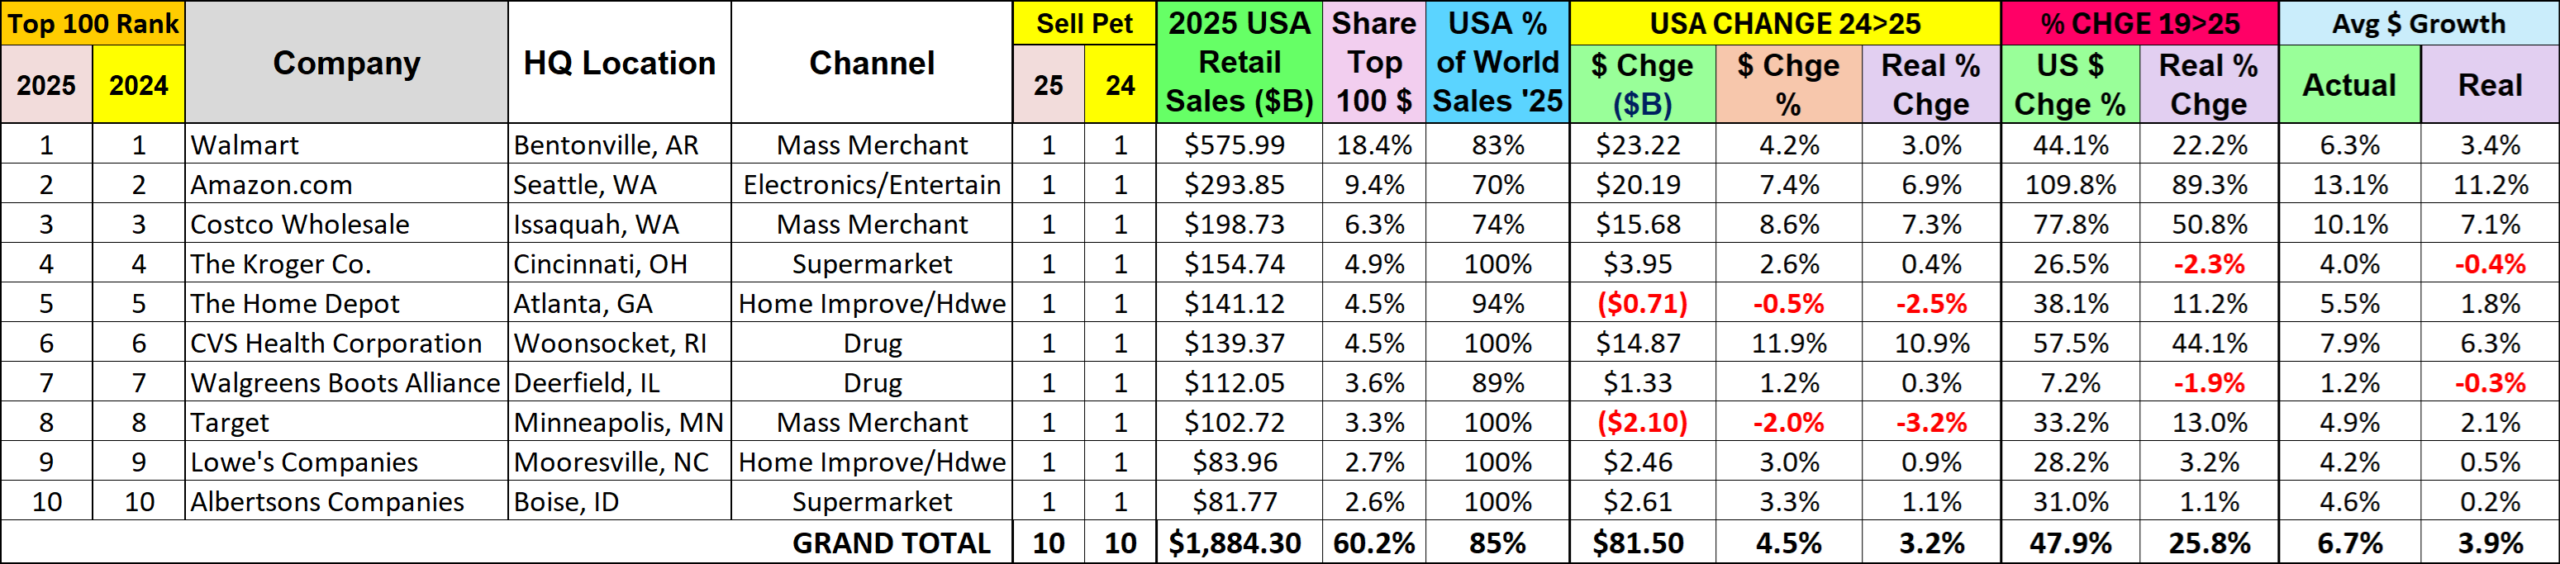
This group has been incredibly stable. Even the rank is the same as 24. The list has been the same since 2013, with one slight qualification. In 2015 Albertsons purchased Safeway. The new Albertsons/Safeway group replaced the stand-alone Safeway company in the list. We have included the growth, both Actual & Real (Inflation was factored in using specifically targeted CPIs) for 24>25 & 19>25. Plus, the average growth rates for 19>25. Now let’s get into the numbers.
- Their Total Retail Sales were $1.88 Trillion which is:
- 60.2% of Top 100 $ales, 0.1% above the previous 2024 peak (60.1%), but 5.2% more than 55% in 2019.
- 35.0% of Relevant Retail, above 21>23 but down from 35.3% in 2024 & 36.3% in 2020.
- 21.7% of Total U.S. Retail $, above 2019 and 21>23, but down from 21.8% in 2024 & 23.4% in 2020.
- In ranking, there was no change – rather unusual.
- Sales vs 24 are actually & really down for Home Depot & Target .
- All are actually up vs 19, but Kroger & Walgreens were really down. The biggest growth came from Amazon. In average growth, 4 have rates over 6%, but 2 are really <0%. The group averages +6.7% with +3.9%, 58.2% being real.
Now we’ll look at the detailed list of the top 100. It is sorted by channel groups with subtotals in key columns. The data only reflects the situation for the current 2025 Top 100 Retailers. Retailers have slightly changed in some groups through the years but there has been very little difference in group share. CPI Note: To better reflect their “real” product sales, I used a specific CPI rate for each retailer. These ranged from individual expenditures, like Alcohol at Home for Total Wine & More to specially created targeted aggregates for Superstores/Clubs. For the group, the individual inflation results were then combined to more accurately reflect the group price changes . There is not a lot of highlighting, but:
- Pet Columns ’25 & ‘24 – a “1” with an orange highlight indicates that products are only sold online.
- Rank Columns – 2025 changes in rank from the 2024 list are highlighted as follows:
- Up 3-5 spots = Lt Blue; Up 6 or more = Green
- Down 3-5 Spots = Yellow; Down 6 or more = Pink
Let’s get started. Remember, online $ are included in the sales of all companies.
Note:(*) in the 19>25 $ Chge % column of some Co’s means the 2019 base was estimated from other sources.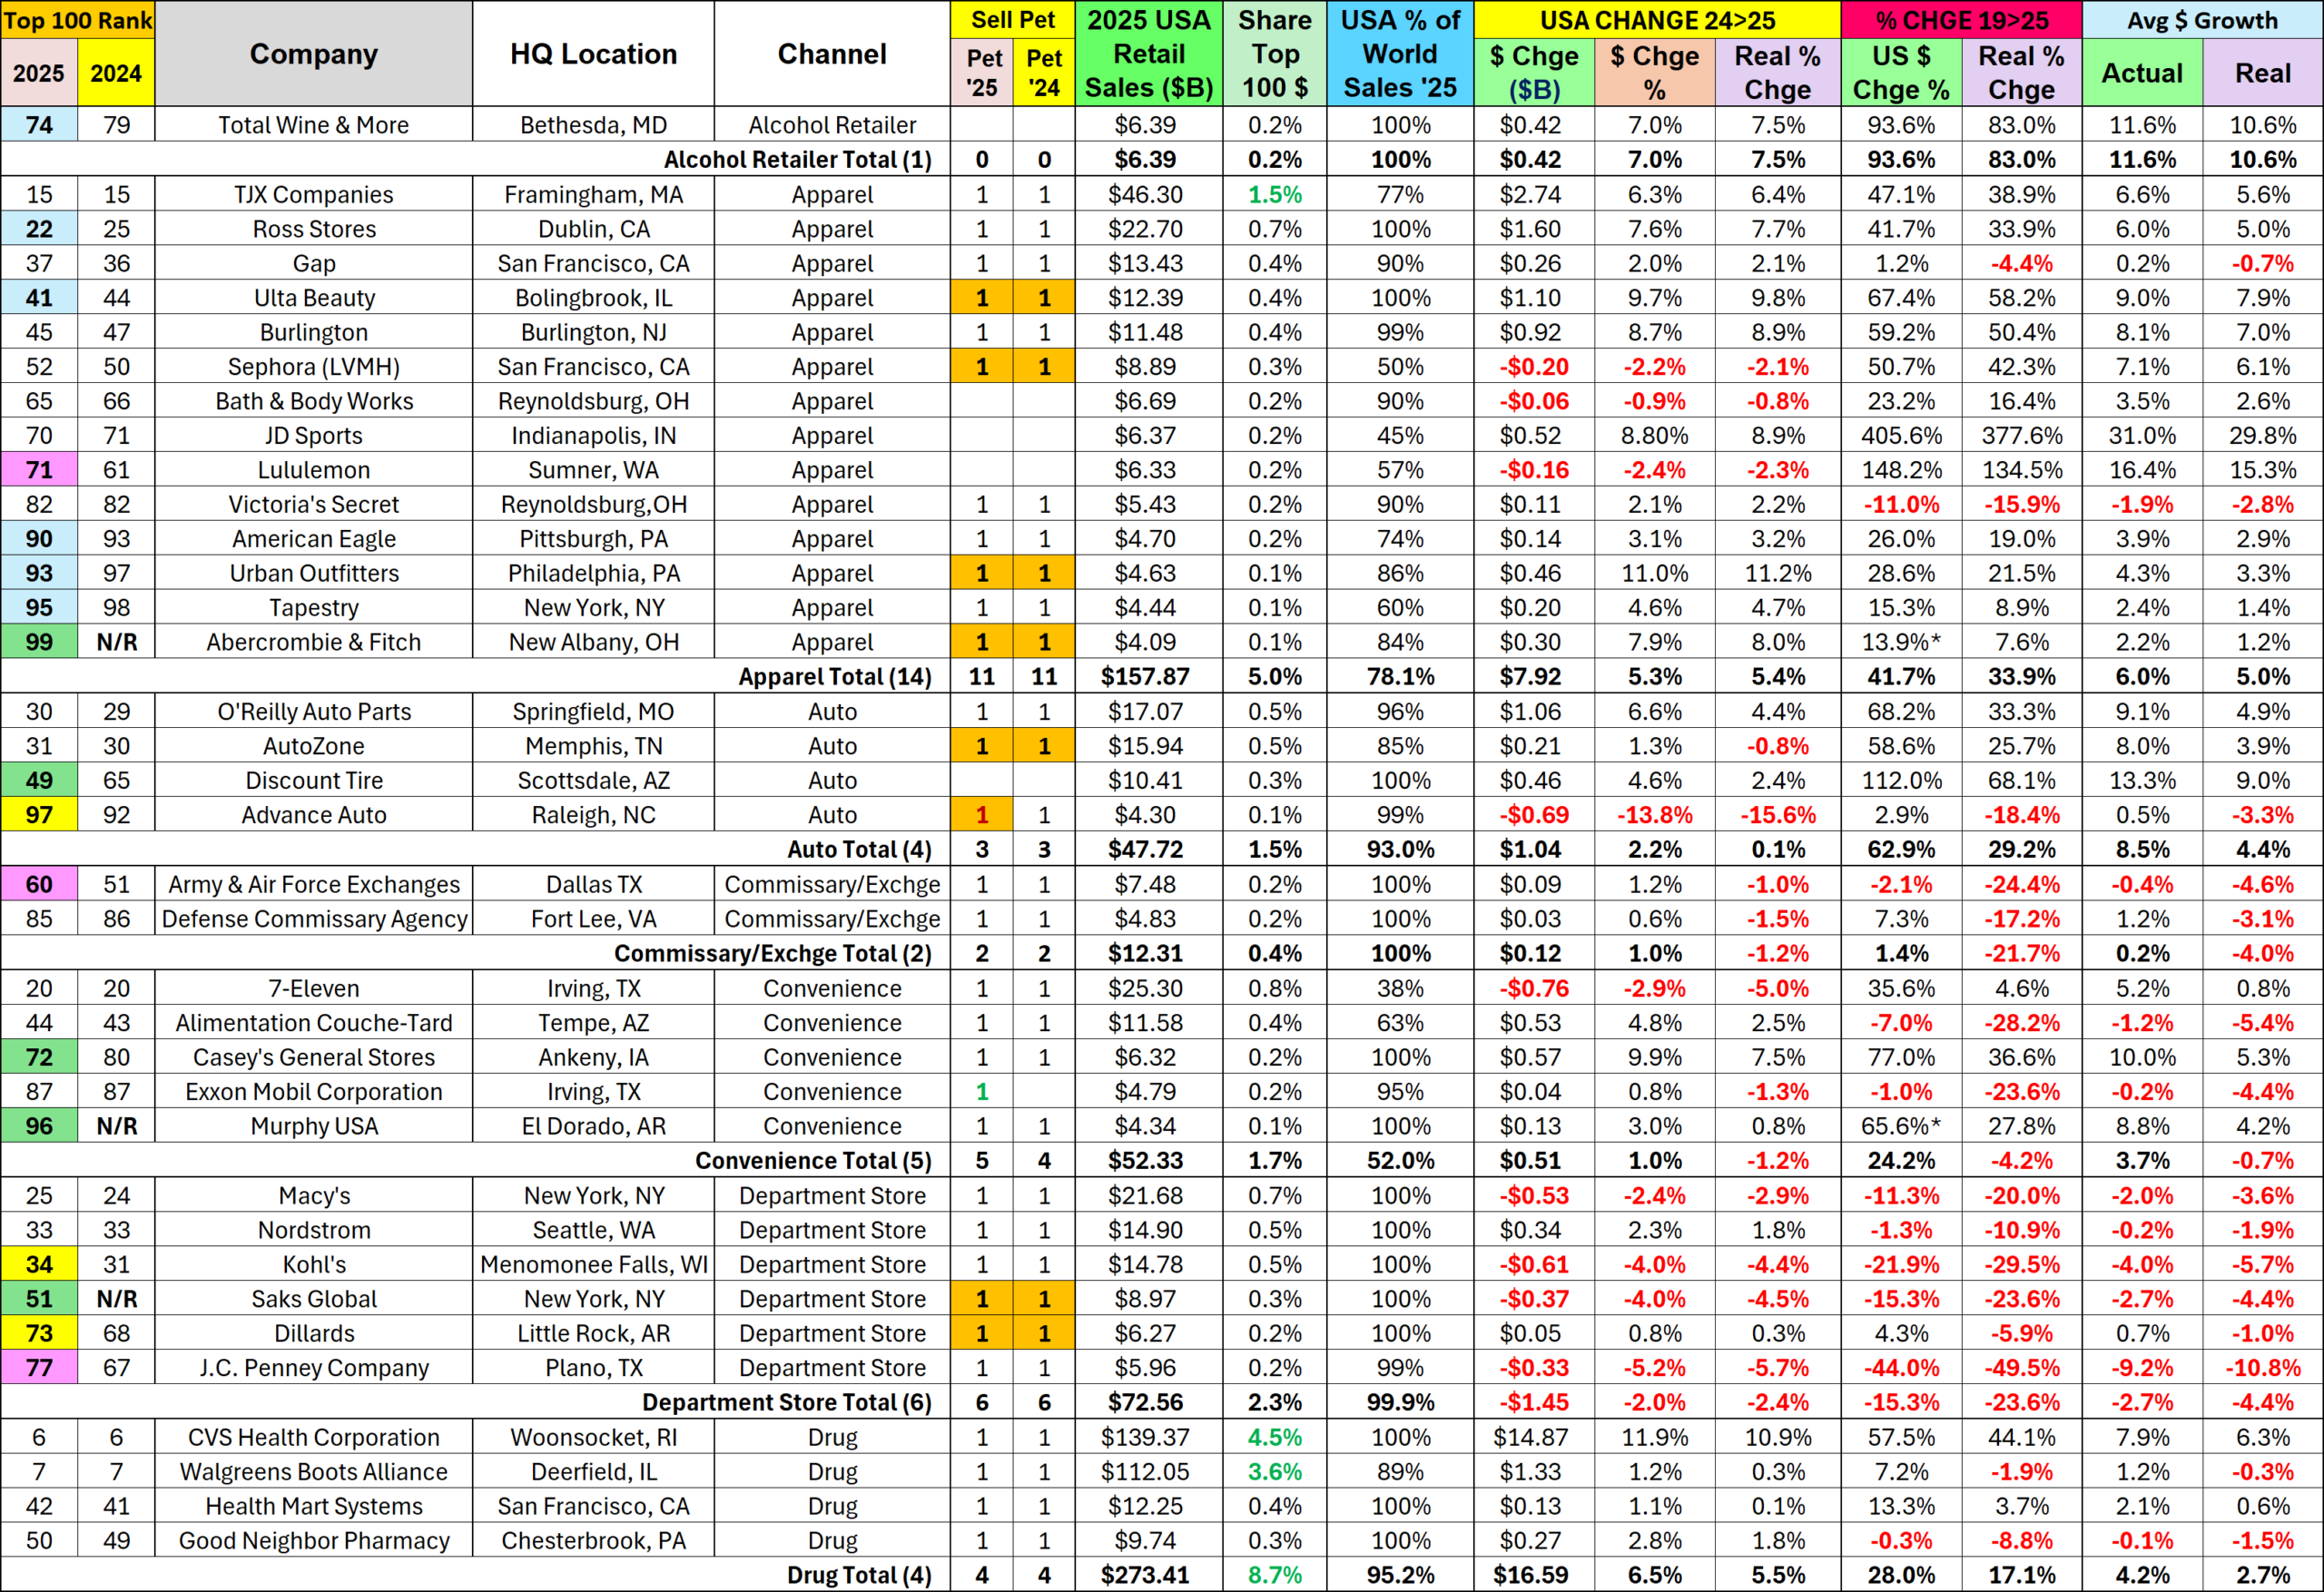
Observations
- Alcohol Retailers first made the list in 2020 as consumers increased dining at home. Strong growth continues.
- Apparel – They were hit hard by the pandemic but had a strong recovery in 21. The 24>25 increase was stable at 5.3%. 3 companies had sales decreases, but 6 had lifts over 7% from 24. Foot Locker was bought by Dick’s Sporting, but Abercrombie & Fitch was added. The channel has 14 companies, the most ever and 50+% more than in 2019 (9). Also, 11 sell Pet. In 2019, there were 3. The average group sales increase was Actual: +6.0%; Real: +5.0% (83%).
- Auto – This group is unchanged from 2019. Their growth continues to slow, +2.2%, down from +5.0% in 23 and +5.5% in 2019. The biggest negative is Advance Auto is actually & really down from 24 and even really down vs 2019. Also, they did move pet items from in store to online only. The group’s Avg Growth: +8.5%; Real: +4.4%. (52%).
- Commissary/Exchanges – They were on hold from 2019>22. The 22/23 lift was +5.9%, but 23/24 fell to +0.6% & 24/25 was +1.0%. Their Avg Actual Sales Lift is +0.2%, but their Real Sales Lift Avg is -4.0%.
- Convenience Stores – 7-Eleven $ continued to drop so the group is actually & really down vs 24. Vs 2019, Alimentation Couche-Tard & Exxon Mobil were actually & really down which pushed the group to really negative. Some positive notes are Murphy USA (in store Pet) was added & Exxon Mobil now has Pet. They chose in store. Avg Actual Sales change: 3.7%; Real: -0.7%. (No real %)
- The decline in Department Stores was accelerated by the pandemic. In 2025, Neiman Marcus & Hudson’s Bay were consolidated under Sak’s Global. 2025 was a bad year for Department Stores. Only 2 of 6 companies had an actual & real lift vs 24. Vs 2019, only Dillards had an actual increase, but real sales were negative for all. The group’s measurements are all negative. J.C. Penny has by far the worst performance. Avg Growth: -2.5%; Real: -4.4%
- Drug Stores – Rite Aid shut down in 25. The others are all positive vs 24. All have been closing stores since 2019. Good Neighbor is actually & really down vs 19 but even Walgreens is really down. Actual Avg: +4.2%; Real: +2.7% (64% real). CVS has the most growth, but mainly from acquisitions.
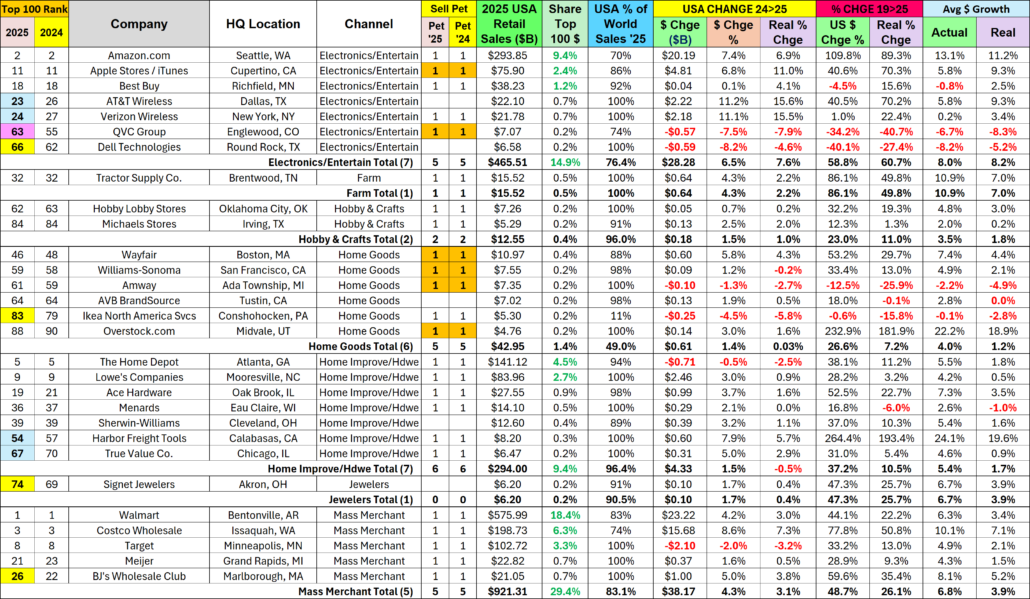
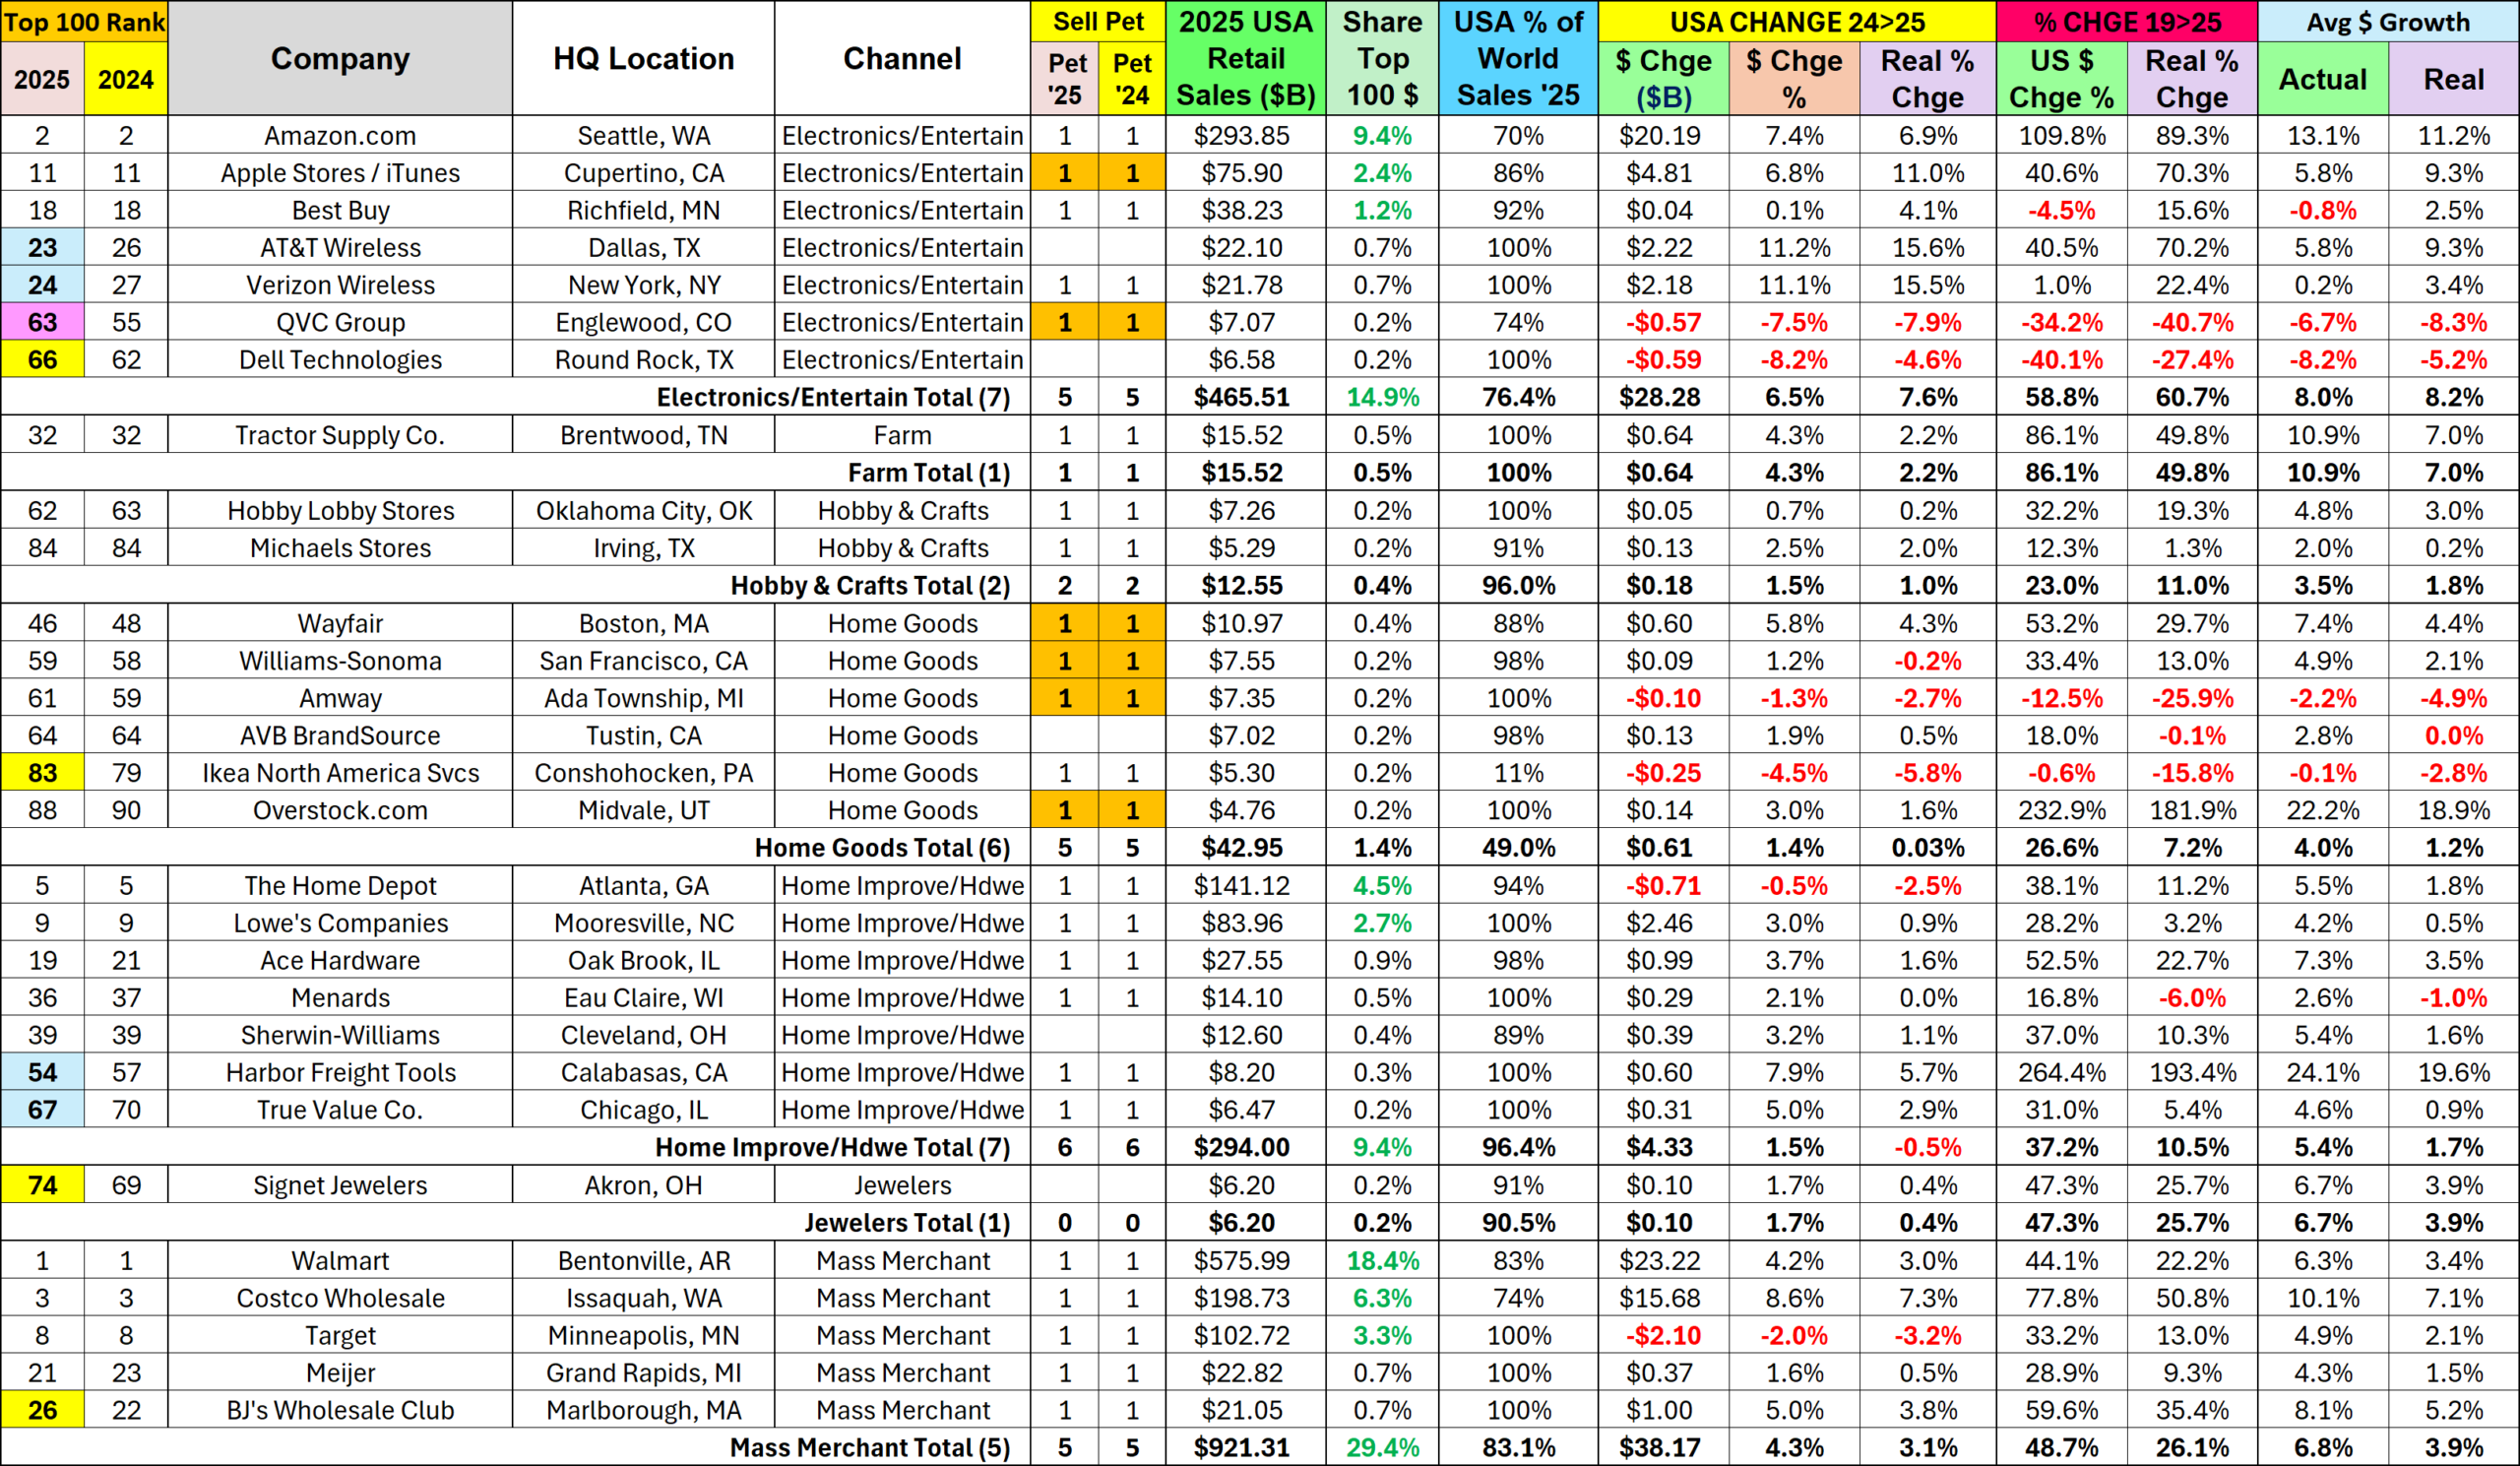
- Electronics/Entertainment – Sales vs 24 rose for all but QVC & Dell. Cell phone companies had the biggest lifts. Store closures continued, especially for electronics retailers.
- Amazon Retail grew 7.4% in 25 but the lift is only 56% of their average 19>25 growth. However, 93% is Real.
- 3 were actually down vs 19 (2 real). Dell had the worst Actual avg, -8.2%. QVC had the worst Real avg, -8.3%.
- Only 1 Electronics store was down vs 24 but 2 were down vs 2019. They continue to close stores. However, strong deflation has pushed real sales up so only Dell is “really” down vs 2019.
- Group avg growth, Actual: +8.0%; Real: +8.2%. Deflation in electronics was strong enough to impact the group.
- Farm– Tractor Supply growth rose to 4.3% from 2.2% in 24 & 3.4% in 23, but it is still far below 11.4% in 22. Avg growth, Actual: +10.9%; Real: +7.0% (64%).
- Hobby & Crafts– Vs 24 & 19, all measurements are positive. Michael’s is the best performer vs 2024, while Hobby Lobby wins vs 2019. Avg Group Growth: 3.5%; Real: +1.8%. 51% is real.
- Home Goods – Vs 24 & 19, only Amway & Ikea are actually & really down. Williams Sonoma is really down vs 24 and AVB is really down vs 19. Avg growth: +4.0%; Real: +1.2% (30%).
- Home Improvement/Hardware – Sales vs last year turned negative in 23, -2.5%. The situation flipped in 24 to +2.0% & growth slowed to 1.5% in 25. Home Depot had the only drop – actual & real, but it turned the channel really down
- Sales vs 2019 are better. All measurements are positive but real for Menards, -6.0%.
- Avg Actual Growth: +5.4%; Real: +1.7% ( 31.5% “Real” growth)
- Jewelry – Signet sales turned around to +1.7% from -4.9% in 24. Avg: 6.7%; Real: 3.9% (58%).
- Mass Merchants have 3 of the 8 largest volume retailers in America – Wal-Mart, Costco and Target. However, the value and selection offered by the whole group has increased its importance to consumers due to the pandemic.
- Wal-Mart $ were up 4.2% in 2025, below 6.5% in 2024, 6.9% in 2023, 8.7% in 2022 and their average 19>25 increase in sales: +6.3%. Their business is driven by SuperCenters. Groceries drove up cumulative inflation, so their real sales avg increase was 3.4%, despite deflation in many general merchandise categories. 54% of their sales are real.
- Costco’s 2025 $ increase was +8.6% up from +4.4% in 2024 & +6.8% in 2023, but radically less than +16.9% in 2022 and even 15% below their 10.1% 19>25 average. Average real growth was 7.1% (70%). They continue to open new stores and expand their internet offerings.
- Target – After 6 consecutive annual sales increases, sales fell -1.6% in 2023, turned slightly positive in 2024, +0.8%, then fell -2.0% in 2025. Their growth peaked at +13.2% in 2021. Avg Growth: 4.9%; Real Growth: 2.1%, 43% real. They continue to open more supercenters. However, their key growth strategy is to expand the product mix in their discount stores, especially by adding more fresh groceries.
- Meijer’s $ales growth continues to slow, 1.6% in 25, 2.3% in 24, 3.7% in 23 & 5.6% in 22. They are now 63% below their avg of 4.3%. Their avg real growth is 1.5%, so only 35% is real.
- BJ’s growth slowed to +5.0% from +5.6% in 24 and it’s far down from +22.8% in 22. They do have the 2nd highest growth since 2019 of any company in the group, +59.6%. Avg growth: +8.1%; Real: 5.2%, 64% real.
- We should note that Costco ranks 1st & BJ’s 2nd in both comparisons vs 2019 and Sam’s Club is a significant share of Wal-Mart’s total sales. Mass Merchants are the biggest category, and Club stores have moved to the retail forefront. Mass Merchant Avg growth: +6.8%; Real: +3.9%, 57% real.
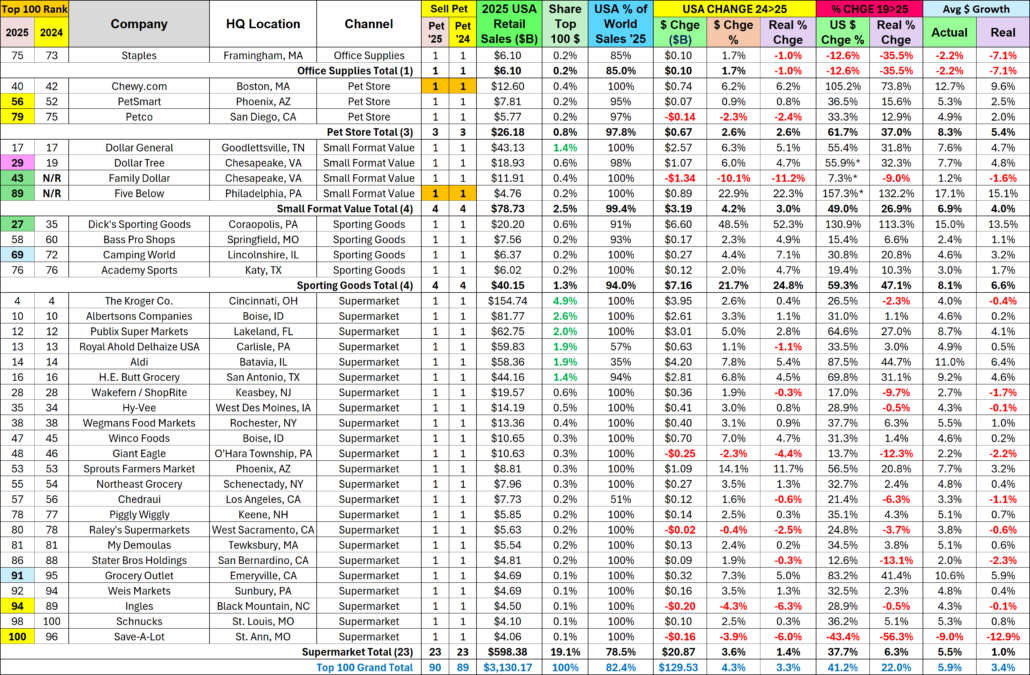
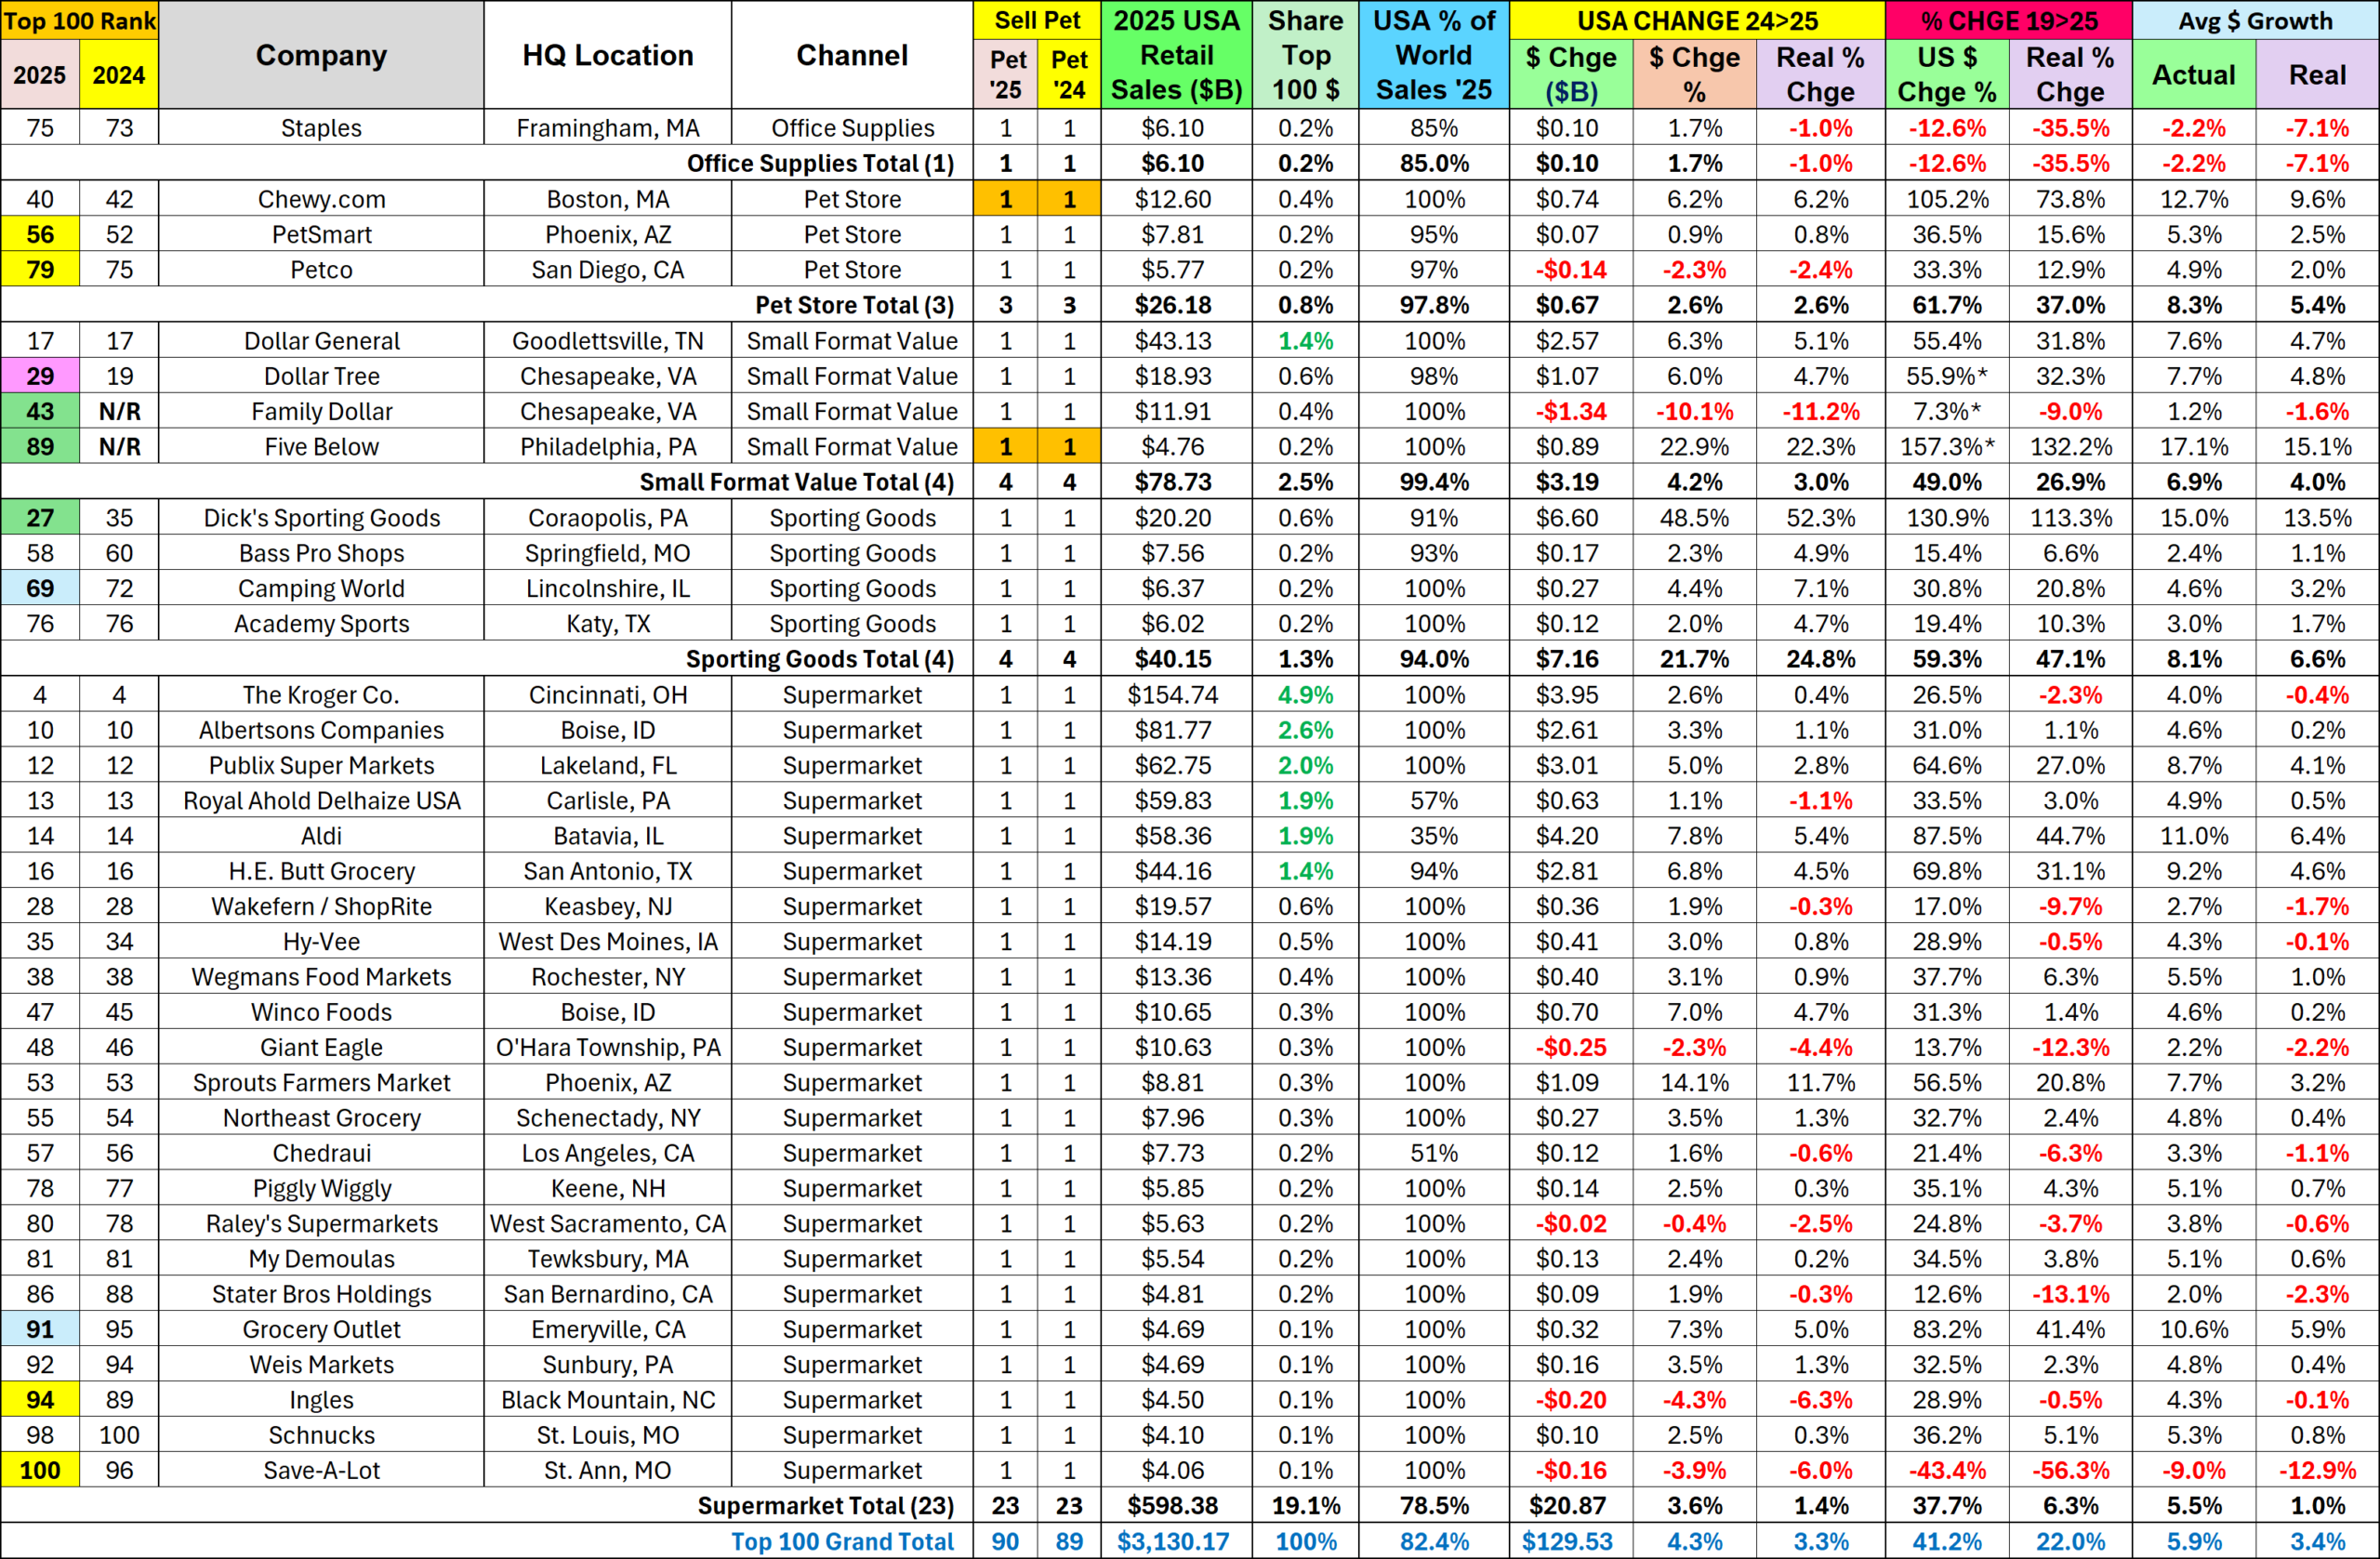
- Office Supply Stores – This channel continues its consistent decline as Consumers maintain their move to online ordering of these products. Only Staples remains on the list. They are up +1.7% in 25, but all other Staples comparisons are negative, and their Avg Growth is: -2.2%; Real:-7.1%.
- Pet Stores’ growth in 25 was +2.6%, up from +2.2% in 24, but down from +6.0% in 23, +7.3% in 22 and a big drop from their 21 peak of +22.3%. However, they are up +61.7% from 2019. Most of the growth in all measurements comes from Chewy’s online sales. Pet Store Avg Growth: +8.3%; Real: +5.4%, 65%.
- With the strong consumer movement to online purchasing, Chewy is still the big story in this channel. They have the most sales. Their 25 lift was +6.2%, down from +6.4% in 24, +10.4% in 23, 13.6% in 22 and +24.4% in 21, but 2.4 times the Pet Store group’s 2025 $ increase. Their 105.2% sales increase vs 2019 is also triple that of the retail outlets. Avg Growth rate: +12.7%; Real: +9.6%. 76% of their big increase is real.
- PetSmart’s 25 growth was 0.9%, up from +0.1% in 24, but down from +2.0% in 23, +2.2% in 22 and radically below +23.1% in 21. Sales growth was below 1% in 24/25 but they are still up +36.5% from 2019. Their Average growth rate is +5.3%. Real growth is +2.5%, 47%. The real % is far below Chewy’s, but not too bad.
- Petco’s 25 sales were -2.3%, slightly better than -2.7% in 24, but a big change from +3.7% in 23, +4.1% in 22 and +17.6% in 21. Their growth since 2019 is +33.3%, slightly behind PetSmart. Avg growth: +4.9%; Real: +2.0%, 41%. A big difference from PetSmart is that Petco has cut back on their retail stores.
- Small Format Value Stores – These stores offer value and convenience. Dollar Tree sold Family Dollar & Five Below had a big lift, so we have 2 additions to the group.
- Group sales increased +4.2%, similar to +4.1% in 24 & +4.7% in 23. Avg Growth: +6.9%; Real: +4.0%, 58%.
- Dollar General is the largest and has strong growth, +6.3% in 25. Avg Growth: +7.6%; Real: +4.7%, 62%. Dollar Tree also showed their strength, +6.0% in 25. Avg Growth: +7.7%; Real: +4.8%, 62%. Family Dollar continues to fade, -10.1% in 25. Avg Growth: 1.2; Real: -1.6%. Five Below jumped into the game with a 22.9% lift in 25.
- Sporting Goods – Dick’s acquisition of Foot Locker made a big difference, but all Company comparisons vs 2024 & 2019 are positive. Group is +21.7% vs 24. Avg $ Growth: +8.1%; Real: +6.6%, 81%.
- Dick’s also had the best $ performance before the acquisition. 2025 sales, +48.5%. Avg: 15.0%; Real: 13.5%, 90%. Camping World is +4.4% in 25. Avg Growth: +4.6%; Real: +3.2%, 70%.; Academy, +2.0% in 25. Avg Growth: +3.0%; Real: +1.7%, 57%. Bass Pro, +2.3% in 25. They have the worst performance. Avg Growth: +2.4%; Real: +1.1%, 46%.
- Supermarkets – 1 drop out – Save Mart. They are still the biggest group with 23 companies. 25 Sales vs 24, +3.6%. Avg Growth: +5.5%; Real: 1.0%, 18%.
- 4 were down vs 24. 4 more were really down. Biggest Changes: Sprouts, +14.1%; Ingles, -4.3%
- Vs 2019, only Save-A-Lot was actually down, but 8 more (including Kroger) were really down – sold less product.
- Sales continue to increase but you see the impact of cumulative inflation – only 18% of the 19>25 growth is real.
- With $598B in sales and all stores carrying Pet Products, this group is definitely essential both to the Retail Market and the Pet Industry.
Wrapping it up!
This report is focused on 2025, but we can also see the continued evolution of the Retail Marketplace. In 2020 many non-essential retailers were hit with restrictions and closures. On the plus side, consumers turned their focus to essentials and their homes. This helped drive incredible growth in many retail channels.
In 2021 the Total Retail market moved into a full recovery with spectacular growth. Many channels showed a strong sales rebound from 2020. Others built upon their pandemic success while many returned to a more normal growth pattern. However, a few continued to decline. The Top 100 companies had participants in all of these patterns.
In 2022 strong inflation hit many categories which slowed both actual and real growth. Inflation slowed 23>25 but we still saw its cumulative impact. The annual lifts were relatively stable but lower. Plus, sales of some retailers actually fell.
The Top 100 is a contest with the winners changing slightly every year. It is a critical part of the U.S. Market, accounting for almost 60% of Relevant Retail Revenue and 36+% of Total Retail. Sales have increased annually but the Top 100’s share of Total Retail peaked in 2020 and in 2019 for Relevant Retail and steadily declined except for a lift in 24. The Top 10 has had stronger annual growth but sales in the #11>100 group actually fell in 2020 and their 19>25 increase is only 41% of the Top 10’s lift. We also must remember our new hero – Relevant Retail, not in the Top 100. The 19>25 Sales by these smaller guys are +65.8%, 37% more than the Top 10. Their performance slowed in 24 but rebounded in 25.
Pet Products are an important part of the success of the Top 100. 90 companies (97.1% of $) sell Pet items in stores and/or online. The 74 companies that stock pet products in their stores generated $2.84T in total sales. How much was from pet? Let’s “Do the math”. If we take out the $26.2B done by Top 100 Pet stores and the remaining companies generated only 1.7% (based on the Economic Census) of their sales from Pet, we’re looking at $47.9B in Pet Products sales from 71 non-pet sources! If you add Pet Stores & Chewy into the $, Pet Products sales for the Top 100 are $74.1B. The APPA reported $102.7B in Pet Products sales for 25. That means 71 mass market retailers accounted for 46.6% of all the Pet Products sold in the U.S. and 74 Top 100 companies generated 72.2%. Pet Products are widespread in the retail market but the $ are concentrated. Pet Industry participants should monitor the Top 100.
Retail sales lifts in 25 mainly grew for smaller Cos. Cumulative inflation is still a major factor. The situation is still evolving but the Top 100 will always be a critical part of US Retail. I hope that this report helps to put the group into a better perspective.

Leave a Reply
Want to join the discussion?Feel free to contribute!