U.S. PET FOOD SPENDING – $26.7B; MID-YEAR UPDATE…EXPANDED

The USBLS just released their Mid-Year Update of the Consumer Expenditure Survey covering the period 7/1/2014 to 6/30/2015. The following charts and observations on Pet Food Spending were prepared from calculations based upon data from that report and earlier ones.

The most recent report shows Pet Food Annual spending at $26.68 B. (Food & Treats). The first chart will help put that into perspective with recent history.

PetFood1

This chart, with its rolling 12 month totals, gives a good overview of the recent trend in Pet Food Spending. However, for the best comparison, we should look at like time frames:

  • 2014 vs 2013: Sales up $1.1B (+4.8%)
    • By Half Year vs previous year: Jan>Jun 14 down $-.09B; July>Dec 14 up $1.19B
  • Mid Yr 2015 vs Mid Yr 2014: Sales up $3.8B (+16.6%)
    • H/H’s increased 1.4M (1.1%), but Pet Food Spending per H/H increased 15.4%…Still a big number!
    • By Half Year vs previous year: July>Dec 14 up $1.19B; Jan>Jun 15 up $2.61B
  • There was a period of minor price deflation beginning in December 2013 and continuing through May of 2014 which could be a factor in the 2014 first half drop of -$0.09B.
  • Prices rose slightly in the second half of 2014 and were stable in early 2015. This contributed to the second half turnaround in 2014 (+$1.2B) and the outstanding growth in the first half of 2015.(+$2.6B)
  • Question: Prices had a record plunge in July ’15. What will be the impact on $? We’ll know in September.

Let’s take a closer look at the latest numbers. Here’s what they look like by age group:

PetFood2

Age Group Observations

  • The growth is being driven by the old and young…especially 55>64 and 25>34. However there is significant growth in the <35 group (Millennials) and the 55>74 group (Mostly Boomers). One big factor in the small decrease in the 45>54 age group is that there are 267,000 fewer households.
  • There are 600K more >75 H/H’s. This may indicate that 75+ is the threshold for declining pet ownership.

Does money matter? Here’s a look at Pet Food Spending by Major Income Groups:

PetFood3

Income Group Observations

  • When you look at the under/over $70K groups, there has been a turnaround. The over $70K group now accounts for more than 50% of Pet Food spending. They are only 34.8% of U.S. Households.
  • There was strong growth in all the over $30K groups – ranging from 19 to 25%.
  • The under $3OK group is showing the only decrease in spending and it is only -$60M (-1.2%)
  • I quickly looked at other demographic groups to search for more insight into the under $30K decline:
    • Over 75 yrs of age – Down 41.6%
    • African Americans – Down 18.8% (Note: All other Racial/Ethnic groups had increased Pet Food spending except for Asian Americans, but they have a high H/H income)
    • Single Parents, Retirees, the Under 25 age group and many other lower income demographics were all showing increased Pet Food Spending, which undoubtedly helped to mitigate the overall drop in spending by the H/H’s with less than $30K in gross income.
  • It is not a good idea to rush to judgment without a more in depth review, but the question of low or declining pet ownership among the elderly and African Americans has come up numerous times before and merits a closer look.

Final Comment

This report is quite frankly great news for the industry. If you have a Pet, you invariably buy Pet Food. Increased Pet Food spending may reflect the movement to more premium foods but it also is an excellent indicator that the number of U.S. pet households is strong and growing. In an earlier post on Pet Products we noted that our spending on Pet Food & Supplies showed a 50 year commitment to our pets – from age 25 to 75. With this report, we saw a 30.6% increase in Pet Food Spending from the Under 25 age group. Admittedly, their spending numbers are still small. However, they are moving up – quickly. I’m sure that you’ll all join me in welcoming these young Millennials aboard the “Pet Parent Express”. We know that they will enjoy it and it’s a ride that lasts a lifetime!

U.S. SPENDING DEMOGRAPHICS for PET PRODUCTS: Food & Supplies…Winners, Losers

There is no getting around it. Pets are big part of our lives and our spending in America. However, there are distinct differences in the demographics of spending between the industry segments. The Prices in the Service Segments, especially Veterinary have been strongly inflating. Sharply higher prices affect the spending of a wider range of groups. Veterinary Spending was up $3B from 2013 despite a $1B drop in spending from consumers making $50K or less. Both the Food and Supply segments have been deflating in recent years so a lower H/H income is less of a factor. Also Pet Products (Food & Supplies) are a “must spend”. If you have a pet, you spend money on Pet Products . For this report we’ll take the services out of the mix and just look at Pet Products.

First, let’s “bundle” segments together to reach a dominant market share of Pet Products spending (80%). Like Total Pet Spending, Homeowners, Metro Area Dwellers, H/H’s with 2 or more people, White Not Hispanic and H/H’s with income over $30K are all groups which exceed 80% of Pet Products spending. Let’s dig a little deeper.

“Which of the 80+ individual segments are performing best in Pet Products?” The chart below identifies the best and worst performing segments in key demographic categories. The performance of each segment was determined by comparing the share of total pet spending to the share of households. Ex: If a segment accounts for 10% of households but generates 15% of Pet Spending the score is 15/10=1.5 = 150%…a great performer. However, if the situation was reversed, 10/15=.67 = 67%…not so good.

PetProdWinners-Losers-1

Married Couples with children, Homeowners vs renters, Rural vs Center City, Larger family H/H’s, White Not Hispanic, the 45-54 yrs age group… Some of the best and worst performers are exactly what one would expect.

  • African Americans are the lowest of the under-performing groups. The most recent American Housing Survey indicated that Pet Ownership by African Americans H/H’s was about 50% of the national average!
  • 2 of the fastest growing occupations in the U.S. are Service Workers (+1M) and Self-employed (+300K). Both had increases in Pet Products Spending per H/H but the Service Workers spending increase did not keep up with the 7% increase in the number of H/H’s.
  • Higher Income and higher education both are harbingers of increased pet product spending. However, pet ownership crosses all income and education levels. The lowest performers are still relatively high.
  • The Under 25 age group…Getting people started as “pet parents” must be an industry priority.

We have identified the best/worst performing segments. Which ones are “on the move”- the segments within each category with the biggest $ gain or loss (or smallest gain) in Pet Products Spending from 2013-14.

PetProdWinnersLosers-2

POINT #1 –When we looked at Total Pet Winners & Losers, 8 of the 10 categories had negative segments. For Pet Products, only 4 of 10 categories have any negative segments…at all! This is great news! Let’s take a look!

Income – Although higher incomes fueled the increase, every major income group spent more on Pet Products.

Occupation – The Self-employed group grew by 339K in numbers and their Pet Product Spending per H/H went up 26%. The Tech, Sales, Clerical group numbers fell by 339K and their Pet Product Spending per H/H dropped by 17%. They were the only occupational group with a drop in Pet Products Spending per H/H.

Race/Ethnic – 70% of H/H’s (White) account for 87% of Pet Products Spending. African Americans were the only racial/ethnic group with a decrease in Pet Products Spending…despite a 535K increase in H/H’s.

Highest Education in H/H – All education groups had an increase in spending. The group with less than a college degree is leading the way in the increase…a nice surprise.

H/H Size – It just takes 3 or maybe 1. Even singles had a significant increase in their spending. Two person H/H’s showed the only decrease. As you will see in the next category, these twosomes were not married couples.

H/H Composition – Married Couples with children drove the increase. No groups had a negative number. The “Married couple only” group was flat in spending. Even single parents showed an increase.

Region – Spending was up in all Regions. However, the Midwest was up $2.1B and the West…only $0.2B.

Area Type – Consumers in areas with under 2500 population, both inside and outside of Metro areas, are showing the most growth. Suburbs, the biggest spending segment is showing the slowest growth. In fact, spending per H/H is actually down slightly.

Housing Tenure – Homeowners are at the top with +$2.0B, but even Renters had a $1B increase (+16%).

Age – Good news. The 25>34 age group is showing the biggest growth. Bad news. The richest, highest spending segment, 45>54 is down. Much of this comes from a drop in numbers but their spending per H/H is also down

Major Issues: 1.The ongoing concern of more racial/ethnic diversity in Pet Ownership. 2. Getting the under 25 age group started. 3. Two big spending groups are slipping – the 45>54 age group and consumers residing in the suburbs. Both are spending less per H/H. The ongoing deflation in Pet Products could be a factor. Innovative, new products is certainly one way to motivate these firmly established “pet parents” to spend more.

Pet Prices Update: 2015 vs 2014 – Not a good second half!

In December all Segments were up slightly, but that doesn’t tell the story of what has been a crazy year. Of course prices in the Service Segments, especially Veterinary consistently moved up. It’s the Food and Supply Segments, which account for 63% of the Industry’s business, that are the real story in 2015.

Of course, all the hard data is included in the report. However the CPI story, which includes all-time record setting drops in both Supplies and Food is best told visually. You need to see it to believe it. First…The Data

DECEMBER PET CPI SPECIFICS

Veterinary Services

  • Dec – Up ↑ 0.37% (slightly more than 2014 when Dec went Up ↑ 0.14%)
  • Since Dec 2014: Up ↑4.56%

NonVet Services

  • Dec – Up↑ 0.15% (A turnaround from 2014 when Dec was Down↓ 0.01%)
  • Since Dec 2014: Up ↑3.12%

Pet Food

  • Dec- Up ↑0.23%% (Slightly more than 2014 when Dec went Up ↑0.1%)
  • Since Dec 14: Down ↓-1.52%…Big!

Pets & Pet Supplies

  • Dec- Up ↑0.21% (slightly more than 2014 when Dec went Up 0.09)
  • Since Dec 14:↓-2.35%…huge drop!!

Total Pet

  • Dec – Up↑ 0.22% (Last year Dec went Up ↑0.14% – All segments are moderately up.)
  • Since Dec 2014: Up ↑0.44% – Strong Inflation + Strong Deflation = Moderation

Here’s a monthly “visual” of 2015 so you can see “the storm” before a calm December

CPI-Dec-15-1

  • The Service segments basically continued their upward pricing spiral in 2015.
  • The year in Food & Supplies started off with a larger than normal Drop in January. However, December was the pricing peak in 2014, rather than November, so this contributed to the size of the decrease.
  • Food prices were moderately up and down until July brought a record drop which continued into August. Prices began a gradual recovery in the Fall but are still down 1.5% for the year.
  • Supplies had a similar pattern to Food but waited until September to begin a record 2 month plunge.
  • Take special note of how “calm” Total Pet is…never more than 0.68% above or -0.27% below Dec 14.

The chart below compares the Annual CPI Change from 2014 to 2015 as well as for the 1st and 2nd halves.

CPI-Dec-15-2

  • The inflation in the Service segments strongly accelerated in the second half…Vet +32, Services +43%.
  • The Supply Segment was looking to turnaround deflation…then the 2nd half.. a huge drop… a flat year.
  • Food was down slightly at -0.2%…then a record drop in the 2nd half led to the worse CPI year…ever.
  • I think you see where the title of this article came from, “Not a good 2nd Half”…an understatement!

Next we’ll put the CPI numbers into a “historical” and market perspective. The following chart shows the average annual rate of change in the CPI from 1997 to 2015 for each of the Pet industry segments, Total Pet…and some comparable product groups and industries.

CPI-Dec-15-3

  • Veterinary leads them all in CPI increase – 36% faster than Human Medical services. Of note: A veterinary service that cost $100 in 1997 cost $236 in 2015 – a 136% increase in prices. Services are also high at 3.4%.
  • On the other hand, the price increase in Pet Food over 18 years almost exactly matches the CPI increase of Human Food served at home. From an overview, Pet Food pricing seems to be on target.
  • Pet Supplies are a different story. They have increased at an annual rate of only 0.6%. That means that the total increase in supply prices over 18 year is only 13.6%, amazingly low.
  • Driven by the Service Segments, Total Pet has increased prices 38% faster than the overall U.S. CPI.

The Pet Industry CPI increase from 1997 to 2015, except for the Vets, seems reasonable. Let’s look deeper!

As I reviewed the CPI records, logical divisions in time seemed to stand out. The next chart shows the average annual rate of change in CPI for each Industry Segment.      Note: I also included the Overall Average from 97>15

CPI-Dec-15-4

  • 1997>2005 – “The Early Years” – Veterinary prices were increasing at an extraordinary rate and services were at what turned out to be their average inflation rate for 18 years. With annual increases of 0.9% for Supplies and 1.3% for Food, these 2 segments were in the “sweet spot”…and almost all the strong revenue growth in these segments over these years was real…not price increases.
  • 2005>2009 – “The Big Short” – The already high inflation rate in the Service segments increased slightly but in the product segments, it skyrocketed. The rate of increase in supplies was 2.6%, not too bad. However, it was triple the rate of the earlier years. The rate for Pet Food increased 400+% to 6.8%. Prices for food increased a total of 29.9% in just 4 years. Together the segments generated an annual rate for Total Pet of 5.6%. Most of the Industry’s revenue growth in this period was simply from price increases. However, the really bad thing was the timing…up to and through the heart of the great recession.
  • 2009>2015 – “The Recovery” – The buying behavior of U.S. consumers changed forever. “Value” became the #1 priority in virtually all purchases. Price now mattered…a lot. All segments, even Services took a step back in price increases. Food prices were up and down, but the overall rate is the lowest in history. Supply Prices reached their peak in September 2009 and have basically been deflating ever since. Competition in the product segments became even fiercer. When low retail price becomes a top priority, consumers benefit but profit suffers, affecting everyone in the distribution channel. Revenue increases, especially in the Vet segment became increasingly dependent on higher income groups. The CPI rate for Total Pet dropped 75% to 1.4%.
  • 2013>2015 – “What’s Happening Now?” Amazingly, the Service Segment rates are inching up again. Vet prices in December 15 are up 4.6% from a year ago. Products are a different Story. Food Prices have been deflating since 2013, with a record drop in 2014. Supplies prices dropped 1.1% in 2014. 2015 was poised for a deflation turnaround year…then came the Fall…literally. Prices fell almost 2.5% between September and November. The result…prices flat for the year…better than a drop, but not what this segment needed. Total Pet CPI is a little low at 0.8% and is being generated by 2 negative situations.
  • 2016> – “What’s Next?” Prices affect the U.S. consumer. Strong inflation can depress sales. Necessary expenditures, like Veterinary Services, can become “discretionary” and are put off or eliminated, especially by demographic groups with lower incomes. Although revenues may increase, consumers may be paying more, but buying less. Deflation can be even a bigger problem. For necessary items, like Food, reduced prices don’t generate increased purchases. Consumers just spend less. It can spur increases in discretionary spending but with today’s well informed consumer, you better make sure it is a great value – it needs to be better.

We’ll take a look at the CPI for the first quarter of 2016 when March numbers are released in April.

Attending Global Pet Expo 2016? – It’s Bigger than Ever! What’s Your Plan?

Global Pet Expo has earned the title of “Greatest Show on Earth” and has some “impressive” statistics. However, for attendees, a different word might come to mind…perhaps, intimidating?

At GPE 2016 there are:

  • Over 1100 separate exhibitor booths
  • 334,000 square feet of exhibitor booths (Plus 30,000 sq ft for the New Product Showcase)
  • 1000 new items in the New Product Showcase plus 2000 more launched on the exhibit floor
  • Over 16,000 attendees with more than 6000 “buyers”.
  • 30 different educational seminars (plus 1 repeat) – 33 hours of classes
  • 5 miles of aisles – just to walk the exhibit floor

The show floor is open for 26 hours so…Let’s “Do the Math!”

If you don’t attend any seminars, visit the New Product Showcase, stop to chat with anyone in the aisles or for food, a drink or to go to the bathroom and maintain a walking speed of 2.5 mph, you can spend about 1 minute and 20 seconds with each exhibitor…Perhaps you need a plan…??

There are a lot of fun things to do in Orlando and the weather provides a great break for those of us in the Northern latitudes. However the primary purpose for attending GPE or any industry event must be to improve your business.

[box]With 1100+ Exhibitors you can spend 1 minute and 20 seconds with each, if you don’t eat, drink, go to a class, go to the restroom…and walk fast!     You need a plan!

[/box]

GPE is primarily about Pet Products – Food, treats and a vast array of Supply categories. New Products are a critical element in helping to turn around the current deflation in Food and Supplies so of course, you must take the time to visit the new product area. You should also sign up for any relevant classes, network with other industry professionals and…walk the whole show. The GPE is about gathering information and making decisions to improve your business – whether they are made on the spot or put on your “must do” list.

Every business can improve in terms of products. If you are a retailer, what sections of your store are not doing as well as you hoped and need a “facelift” or conversely, what areas are growing and need products to fill additional space? Category managers for distributors and retail chains may only be interested in targeted visits to exhibitors relevant to their “categories”. Representatives may be looking for new manufacturers…in specific product categories. Manufacturers could be looking to find distributors to handle their products or just looking to “check out” the competition. In regard to products, there is always something to see…for everyone!

Both the GPE and the Pet Industry have grown tremendously and the influence of Pet Products is widespread across Retail America. I don’t know if we fully appreciate just how widespread. If you include Veterinary Clinics and Service Establishments, Pet Products – food and/or supplies are sold in 200,000 U.S outlets – including 69 of the top 85 non-restaurant retailers in the U.S. …plus the Internet! And according to A.C. Nielsen, 62% of all consumer shopping trips are for $20 or less. As expected, the biggest “drivers” are #1 Milk and #2 Bread, but #3 is…pet products…the only nonhuman food item in the top 10. It’s a competitive, consumer driven market.

So you’re most definitely going to GPE 2016, how do you make the most out of your time? Here’s an idea…

In 2014 I first designed a tool in Excel, the Super Search Exhibitor Visit Planner to make “working SuperZoo” easier and more productive for ALL attendees – retailers, distributors, reps, groomers, vets…even exhibitors. I have updated the data and produced a tool for every GPE and SuperZoo since then…including GPE 2016.

When I say “update the data”, I am referring not just to exhibitor lists but also to the product category offerings for every exhibitor. Of course I reviewed every exhibitor profile on the show site but I also visited over 1000 websites to “validate” the offerings. It is not 100% accurate. However, it is close.

What does the SuperSearch do?…It searches for and produces a list of Exhibitors by product categories.

  • From the simplest…”just give me a list that I can look at on my phone or tablet quickly in either Booth # order or alphabetically”
  • To the most complex…”can do a simultaneous search for multiple specific product categories, allowing me to personally narrow down the initial results and see the “final” alphabetically or by booth number.

The GPE SuperSearch Exhibitor Visit Planner does both…and more…and does it quickly! Here’s what it looks like. It looks complex but is truly quite simple…Of course, you will print results in “landscape” – because it’s easier to read!

SuperSearch-1

  1. In the Top section, you “design” your searches.
    • Enter a “Y” in the exhibitor search column. It turns green to indicate an “active” search
    • Enter a “1” the desired category
      1. If you want to search separately for several categories, use multiple rows (multiple search results are combined into 1 list for efficiency)
      2. If you want the results to be “and”…for example, exhibitors that carry, treats, toys and beds, put a “1” in all three…in the same row. Only those with all 3 will show up.
      3. Note: If you enter something other than a “1”, the cell turns red to indicate an error
  2. Now, click on “Execute” search and it happens
  3. You can then view the results alphabetically or in booth # order by clicking on a button.

Pretty simple, don’t you think? Plus, you can personally narrow the search results by using the “U pick ‘em” feature. And of course there is also a button to clear your search criteria so you can easily begin a new search.

Ready to Start Planning?

There are download links below for the GPE 2016 Super Search tool as well as one for the instructions. Please print out and read the instructions before you start to “play”. Yes, the instructions are 4 pages long. But before you get “turned off” about their length, take a look at some of the instructions that you have around the house…vacuum cleaner – 11 pgs; coffee maker – 21 pgs; cell phone…a novel!  After you see what the Super Search can do, your searches may grow more complex. The instructions will help you to be more efficient from the start… Note: The File has been updated. GPE 2016 SuperSearch is based on info as of 3/9. Six new exhibitors were added since the 3/9 update and a total of 14 since the 2/22 original. This is the final update before the show. Check the date in the file name. The exhibitors added between 3/2 and 3/9 are “highlighted” in pink. Those added from 2/22 to 3/2 are “highlighted” in blue.

Plan your work! Work your plan! You will be more productive and more successful!

Download Now and Get Started!

[button link=”https://pmud8a.a2cdn1.secureserver.net/wp-content/uploads/2016/02/GPE-2016SuperSearchEXHIBITOR-VISIT-PLANNER-Instructions.pdf” type=”icon” newwindow=”yes”] Download Instructions (PDF)[/button]

(To save the PDF to your computer Right Click the download link and select “Save Link As…”)


[button link=”https://pmud8a.a2cdn1.secureserver.net/wp-content/uploads/2016/03/GPE-2016-SuperSearchRev-3-9-16.xlsm” type=”icon” newwindow=”no”] Download SuperSearch GPE 2016 -3-9-16(Excel)[/button]

(For the Excel file to work on your computer, be sure to enable macros/editing)

GLOBAL PET EXPO 2016 – “The Greatest Show on Earth” is coming soon!

In 2015, Trade Show Executive Magazine officially named the 2014 Global Pet Expo as “The Greatest Show on Earth”, beating out a host of other events across an extraordinarily wide range of industries.

When I consider this great honor in context of reviewing the 2016 exhibitor and show information , I can’t help but be struck by how far the Pet Industry has come from my first APPMA show in June of 1989 in New Orleans.

The change really is just a reflection of the spectacular and still growing love affair that Americans have with our companion animals. Want some statistical proof? According to the government’s annual Consumer Expenditure survey, the Pet Industry has grown from $16.8B in 1994 to $64.3B in 2014…with over $41B spent on pets, food and supplies. In terms of Pet Food & Supplies expenditures, Americans exceed the household spending average for 50 consecutive years – from age 25 to 75. Even when the average income is halved after reaching age 75, pet spending keeps pace. With U.S. consumers demonstrating a lifetime commitment to our pets, is it any wonder that the industry and its showcase event, Global Pet Expo, continue to grow?

Let’s look at some 2016 GPE “booth” facts:

  • Over 1100 booths – up 3% from 2015
  • 330,000+ sq ft of exhibit floor booth space (Not counting the new product area) – up 7% from 2015
  • Booths are 3% larger – “average” booth is 300 sq ft (30×10)
  • But 10 x 10 is still the most popular size – with 405, in fact 70% of the booths are 20 x 10 or less.

Will you see any new exhibitors or is it the usual group? The “usual” group is definitely there but…

  • 360 of the GPE 2016 Exhibitors did not exhibit at GPE 2015
  • 570 of this year’s GPE exhibitors didn’t exhibit at SuperZoo 2015*
    • *By the same token, over 350 SuperZoo 2015 exhibitors weren’t at GPE 2015. Obviously, attending both of these shows is a “must do” if you want to keep up with what’s happening in the U.S. Pet Industry!

There are five Specially Designated “Floor Sections” at GPE. Let’s start with a brief review.

  • Natural – 122 Booths. This section remains strong after it was increased by 50% last year. Without a doubt, “Natural” has become a “magic” word to the “ultimate” buyers – the consumers.
  • Boutique – 51 Booths. A “specialty” section which is considerably smaller than SuperZoo’s Rodeo Drive. One factor in the difference is the higher percentage of Retail Pet Stores among SZ attendees.
  • Aquatic – 51 Booths. Up slightly from last year. GPE remains the “go to” show for aquatics.
  • International – 51 Booths. This is somewhat “deceptive”. Last year GPE had 202 international exhibitors…one of every five booths. Expect a similar count in 2015. GPE is truly GLOBAL!
  • 1st Time Exhibitors – 142 Booths. If you want to get established in the U.S. Pet Industry, you “must” do GPE. Every year, a major focus of GPE is “new”…both in products and in exhibitors.

A word of caution: These are specially targeted sections but as we saw in the “international” example, there are large numbers of Exhibitors in the “regular” floor space with products that would qualify for inclusion in these sections. You need to “work” the whole show to insure that you get a good view of what’s available in the product categories of particular interest to you.

In 2015 I developed a search tool for GPE and SuperZoo to make this type of planning easier. Show attendees could plan out their floor time by targeting the exhibitors with products that they were interested in seeing. Up to 5 product category searches could be run concurrently and the results were available in alpha or booth# order. This year’s tool will be made available shortly as the last few GPE 2016 booth assignments are finalized.

Let’s look at the results from the research done in developing the 2016 GPE SuperSearch Tool.

First We’ll Compare Exhibitor Types – By function: By Animal type

Greatest-1

  • Cats are certainly Royalty …but Dogs Rule! However, cats are gaining ground. The number of booths offering cat products showed a significant increase and is now at 50%. This is up from 40% just 2 years ago.
  • While booths offering products for Reptiles, Small Animals and Horses increased slightly in numbers, the percentage increase was significant. It demonstrates that these companion animals remain a strong part of the U.S. Pet Industry.
  • Fish and Bird product exhibitors basically maintained their “share” of the growing GPE exhibitor count.
  • The big gain is in exhibitors offering business services. This can “cover a lot of ground” – from Private Label Food manufacturers to POS systems. This increase further enhances GPE’s appeal!

Dogs and Cats are certainly the royalty of Pet. Because of their huge impact on the industry, I have divided the products designed for them into 32 subcategories. Here are the top ten in exhibitor count for 2016.

Greatest-2

  • The big movement is in the OTC Meds, Supplements and therapeutic products. This is a trend that has been accelerating. One factor in this growth may be the exceptional inflation in Veterinary prices.
  • Exhibitors with Food or treats are also growing in numbers. This is indicative of the competitive environment in these categories which is undoubtedly contributing to the ongoing price deflation in this Industry Segment. Also, many new Supplements are appearing in the form of treats.
  • Grooming Tools, both for providers and consumers entered the top 10 in 2015 and continues to grow.

Finally, the chart below details the specifics for all 32 of the Dog/Cat product categories that I defined. Of note: All the data inputs for this report and the SuperSearch tool were derived from reviewing the GPE online exhibitor product listings AND visits to over 1000 websites. They’re not 100% accurate, but pretty close.

Changes of special note from 2015 are highlighted. Which categories are of interest to your business?

Greatest-3

In addition to being bigger, the show staff actively works to make each GPE better, including enhanced educational offerings and of course…the New Product Showcase. In combination with the excellent work being done on SuperZoo, we have 2 “must attend” U.S. Pet Industry Shows. Thank you, APPA, PIDA and WPA!

Regardless of why you are attending the GPE, having a productive show requires planning. It has simply gotten too big and is definitely too important to just “wing it”. The “GPE Super Search” tool that I referenced will be available shortly for download. Take a look. It can’t hurt…and it just might help.


U.S. PET SPENDING DEMOGRAPHICS: The 2014 Winners and Losers are….

In a recent post we identified the demographics of the “Ultimate” Pet spending household. Unfortunately, there are just not enough of these “prime” households. So we took the next step and bundled the subsets together for each category until we could identify a group with a dominant market share. Our goal was 80%. This produced some interesting results. Metro area dwellers, Homeowners, white but not Hispanic, 2 or more people living together and those with an income over $30K are all groups that generate 80+% of Pet Spending.

With over 80 segments in 12 different demographic categories, it is natural to wonder, “Which individual segments are performing best? Who are the winners…and losers?” This report will address those questions. The chart below identifies the best and worst performing segments in key demographic categories.

The performance of each segment was determined by comparing the share of total pet spending to the share of households. Ex: If a segment accounts for 10% of households but generates 15% of Pet Spending the score is 15/10=1.5 = 150%…a great performer. However, if the situation was reversed, 10/15=.67 = 67%…not good.

DemoChge1

The top performers generally reflect our “Ultimate” Pet Spending H/H. Regarding the underperformers:

  • The under 25 age group was the worst of all the underperforming segments. Improving the pet spending of this demographic should be an Industry priority. Make it easy to get started as a Pet Parent.
  • Consumers of all income levels have pets. However, income is undeniably a factor in spending. This is reflected in the spending of single parents and service workers as well as the lower income segment.
  • Having more space and “owning” it are two keys to increased Pet ownership and…spending. You can see the impact of this in Center City dwellers and renters.
  • Pets are a great companion for singles, but get 2 adults together and pets are more likely to “follow”.
  • The Asian underperformance is curious. They have the highest H/H income but spend the least on pets.
  • Higher education generally means increased Pet Spending. However, Pet ownership is not dependent on education. In fact consumers who dropped out of HS spent more per H/H than HS grads with no college.

In the next chart we’ll “Show you the money”! We’ll identify the demographic segments within each category with the biggest gain or loss (or smallest gain) in Pet $pending from 2013-14.

DemoChge2

Age & Occupation – Want proof of the impact of the Baby Boomers? Almost half the industry’s growth comes from the over 65 age group…and “retired” was the #1 “occupation” in growth contribution. Over 600K “Boomer” H/H’s turned 65 in 2014. Now on the Flip side: The tech, sales, clerical occupation lost 5% in income and 2% in H/H’s so their Pet purchases fell sharply. The 45-54 age group makes the most money and their H/H Pet spending went up…but over 600K “Boomers” moved up to the 55-64 so group spending fell.

Income – 14% of the H/H’s (over $120K) account for 82% of the Industry’s growth. The lowest incomes are being impacted by rising Veterinary prices.

Race/Ethnic – 70% of H/H’s (White) account for 87% of Pet Spending and 105% of the increase. There is definitely a racial/ethnic disparity in Pet spending.

Highest Education in H/H – Although Consumers with a Master’s Degree or above spend more on their pets, pet parenting is not about education. 61% of U.S. H/H’s don’t have a college degree but their pet spending increased 15% and they accounted for 64% of the $6.6B increase. Those H/H’s with a BA/BS spent significantly less on services, driving their overall Pet expenditures down.

H/H Size – It just takes 2…or more! Single person H/H’s spending was down.

H/H Composition – Married Couples, with or without children, accounted for 124% of the increase. The combined Pet spending for Singles, Single Parents and all other combinations was down…a total of $1.6B.

Region – Pet Spending was up in all Regions. However the Midwest was up 26% and the South…only 1%.

Area Type – Consumers in areas with under 2500 population spend the most but we are growing more Urban every day. There is strong growth both in Rural sections within metro areas and center cities. The Suburbs have the biggest share of Pet Spending at 46% but their spending per H/H dropped 4% in 2014.

Housing Tenure – Homeowners account for 80% of Pet Spending but 2014 was a really good year all-around as Renters pet expenditures increased $2.9B..↑23%.

Three “opportunities” seem readily apparent.

  1. Keep the aging/retiring “boomers” spending on their pets.
  2. Get the under 25 group started faster.
  3. Investigate the racial/ethnic disparity in Pet Spending

Pet Prices Update: November 2015 – Supply Prices Plummet↓↓↓

In November, the Pet Industry set several dubious records. The Consumer Price Index for the Pets & Supplies Segment fell 1.72%. This is the biggest November drop on record, edging out 2009, during the recession. Add this to the 0.73% drop in October and Supply Prices fell 2.44% in two months. This is an all-time record for any 2 month period by a big margin…29%. The previous “leader” was Oct-Nov 2009, which marked the beginning of the ongoing deflationary period in this segment.

Total Pet prices fell 0.43% in November. The drop was mitigated by the continued strong inflationary trend in the Service segments and “Flat” Food prices. Here are the NOVEMBER PET CPI SPECIFICS:

Veterinary Services

  • Nov – Up ↑ 0.12% (slightly less than 2014 when Nov went Up ↑ 0.18%)
  • Year To Date: Up ↑4.17%

NonVet Services

  • Nov – Up↑ 0.31% (Slightly more than 2014 when Nov was Up↑ 0.21%)
  • Year To Date: Up ↑2.97%

Pet Food

  • Nov- Up ↑0.02%% (In 2014 Nov went Up ↑0.03% – Almost exactly the same)
  • Year To Date: Down ↓-1.74%…Still big!

Pets & Pet Supplies

  • Nov- Down ↓-1.72% (Last year Nov went Up ↑0.3%…A -2.02% Swing!)
  • YTD:↓-2.56%…A precipitous drop!!

Total Pet

  • Nov- Down↓ 0.43% (Last year Nov went Up ↑0.17% – Supplies Segment is driving the difference.)
  • Year To Date: Up ↑0.21% – Still on track for a moderate annual increase.

There is no doubt that the CPI “headliners” for 2015 are the Food and Supplies Segments. After a big pricing drop in January, both Food and Supply prices remained relatively stable until the second half of the year. Then July-Aug brought a record drop in the Food CPI and the same thing happened to Supplies in Oct-Nov. This resulted in a 1.41% pricing drop from June to November in this combined Food/Supplies segment. This is the biggest Jun-Nov drop (by 56%) in this grouping since they began keeping records in 1977 – 38 years ago! (the 3rd and final record breaker for the month!)

Here’s a “visual” on the first 11 months of 2015 for all segments and Total Pet.

Nov-15-CPI-1

What strikes me most about the chart is the relatively calm movement of the Total Pet Pricing in 2015 which “masks” the underlying turmoil in the segments. The Service Segments basically just go up. After a big drop in January, the Food and Supply segments were also relatively calm until the second half when both literally “fell off a cliff” with record drops.
Here’s an updated status and “best case” projection for the total year.

Nov-15-CPI-2

Veterinary Services – Prices continue to inflate at a high rate. We’ll see what impact this has on 2015 consumer expenditures. The inflation in 2014 helped push sales to a record level but the increase was primarily limited to the higher income households. Lower income groups decreased spending by $1B.

Non-Vet Services – Although inflation is less than the Veterinary Segment, it has started to slow the increase in consumer spending. Income (over $120K) and need (age 65+) are big drivers in this segment.

Pet Food – Pet Food prices have only deflated in 3 years since 1997. They will fall in 2015 for the second year in a row, the third time since the recession and the drop in the CPI will be about 3 times as large as the previous worst plunge. Things have changed in this segment. Since the recession, the consumer is more value driven, less brand motivated and better informed. Couple this with the increased availability of improved quality products in nearly 200,000 outlets plus the internet…and you get an extraordinarily competitive environment. Remember that food is a “need” product group. Lower prices do not drive consumers to buy “more”. They just spend less.

Pet Supplies – For most of the year, it appeared that the Supply segment was moving out of the deflationary slide which began in 2009. However, the record Fall plunge probably spoiled that. If 2015 mimics 2009, then December prices should increase slightly, if not…. Major categories in this segment have become commoditized, driving down prices. Innovation is the key to reversing this trend. Make it functionally better and consumers are willing to pay more. If not, then retail price is their focus.

Total Pet – Projecting a moderate 1.02% increase. 2 Negative situations have combined to produce at least the appearance of a positive. What we have seen in the Pet CPI is a powerful argument for looking beneath the surface of all data.

When December’s numbers are published, we’ll do a detailed annual CPI review.

U.S. Pet Spending Demographics: The “Ultimate” Pet Spending Household and…more!

It’s early in the New Year. Let’s have a little fun by taking a look at the demographics of the “Ultimate” Pet Spending Household. If there were more of these, Pet Spending would be in the stratosphere.

The “Ultimate” Pet Spending Household consists of 3 people – a married couple with an 18+ year old child, still living at home. Mom and Dad are in the 55 to 64 age range. They are White, but not of Hispanic origin. At least one of the Parents has an advanced College Degree. Everyone works in the H/H. Mom and Dad are “managers” or professionals. Their child also works, at least part time. They’re doing OK with a total Household income in excess of $120K. They own their home or to be more accurate, share ownership with the bank. They live in a rural area (under 2500 population) in the Midwest or Western U.S., but it is adjacent to a good sized metropolitan area. This gives them plenty of space for their companion animals, but they are still close enough to commute to the City for work, shopping and entertainment – the benefits of the Urban environment.

The Chart below details the specifics along with how the Total Pet Spending of each of the demographic factors compares to the National Average. There is also a chart on “Pet Products” Spending – just pets, food and supplies – no Veterinary or other services. The “ultimate” households are similar, but there are also some distinct differences. Take a look.

Ultimate1

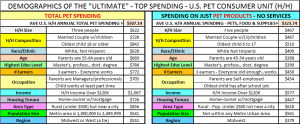
Differences in the Ultimate “Pet Products” Spending Household

The Parents in the Top Pet Products Spending Household are younger – 45 to 54 age range. They still have 3 children at home and the oldest is not yet 18. They are well educated and make over $120K per year like the “Total Pet” group, but they are self-employed. They are firmly anchored in the Midwest, but not near any big metropolitan area. They live in a truly rural environment. Our modern world has made it much easier to work out of your home.

These two “ultimate” households would be easy to sell to but there are not enough of them. Let’s look at where the bulk of the business is going – the biggest market share by key demographics.

The chart below compares the share of Consumer Units (H/H’s) to the share of Total $ and Total Pet Products $ for Key Demographic measures. The goal was to bundle the subsets within a demographic category, like gross income until we reached a dominant market share of 80%. Sometimes this is simple, sometimes not. There are also Key Subsets listed for certain Demographics.

You will note a similar pattern in Total Pet and Pet Products. Differences will be noted in the comments.

Ultimate2

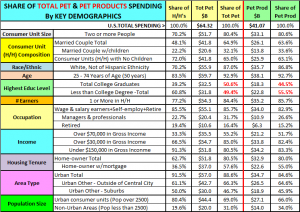
Income – This is usually the first demographic that anyone looks at and it is generally true that increased income results in increased pet spending. The midpoint (50%) is generally recognized as $70K. This is substantially correct although the over $70K group spends more on services. To get to the 80+% market share, you have to go down to the over $30K level. The upper 2/3 of the households in income spend over 80% of the pet $. You can also get to 80% by grouping everyone who makes less than $150K. However, this requires 91% of the total households. Pet ownership is popular across all income levels but as expected, there is a great disparity in spending between the high and low ends.

# Earners – This is an easy one. To get to the 80+% level, someone in the house has to have a job. It is interesting to note that 23% of U.S. households have no earner but they still account for about 15% of Pet Spending. I’m sure the retired group is a major factor.

Occupation – To reach 80% market share of spending you have to include all wage & salary earners, self-employed and retired people. The Managers/Professionals spend the most money of any group, especially on services. However, “retired” people are second. This is an important and growing group.

Race & Hispanic Ethnicity – White, non-Hispanics make up 70% of the consumer units in the U.S. but account for 87% of both the total pet and pet products expenditures. (Note: Native Americans and Pacific Islanders are included in the white grouping). African Americans, Asians and Hispanics account for 30% of the households but only 13% of Pet Spending. This is a situation which should be reviewed.

Age – We should note that the 55-64 age group has the largest share of Total Pet Spending and the 45-54 group is the Pet Products winner. Together they account for over 40% of Spending. However, there is significant pet spending in all ranges. To get to the 80+% level in spending share for either Pet Products or Total Pet you have to include everyone from 25 to 74 – 50 years. This reinforces that Pet ownership is a commitment for a lifetime.

Highest Education Level – It’s true that College graduates spend more per household and have a slightly larger share of Total Pet $ (51%). However, when you look at Pet Products spending only, the less than college degree group moves to the top at 55%. The subgroup with a Bachelor’s degree spends 25% of all Pet Products $. However, the subgroup with a High School diploma or less (and no college classes) actually accounts for 26%. Pet ownership and spending encompasses all education levels.

Consumer Unit Size – Another easy one. 70% of U.S. households consist of 2 or more people. Although single people definitely have pets, the 2+ group is more likely to have a pet…and definitely spends more.

Consumer Unit Composition – One of the industry stereotypes is the married couple with their children – both human and 4 legged. To some extent this is true as 48% of U.S. households are married couples and they spend over 60% of Pet $. Only 22% of U.S. households are married couples with children. They do spend more on their pets but still only account for 1/3 of total Pet $. On the other hand, 72% of U.S. households have no children at home and their share of Pet spending is also over 60%. The biggest key to pet spending seems to be to put 2+ people together in a consumer spending unit. This = 80% Pet $.

Housing Tenure – When you own your home, you have a “permanent” residence and you set “most” of the rules for having pets (can’t forget HOA’s). 63% of Americans own their own home and they account for 80% of Pet Spending. Home ownership is a key factor in both Pet Ownership and Pet Spending.

Type of Area – 91.5% of American Households are within defined Metropolitan Statistical Areas (MSA’s) so it’s not surprising that over 85% of Pet Spending comes from this Urban environment. However, the Central Cities have lower pet ownership and spending. The lion’s share (2/3) of the $ come from “other urban”, which consists of the suburbs and rural areas included in the MSA’s. The largest share goes to the stereotype – the suburbs – with 50% of all U.S. households and almost 46% of Pet Spending. However, it also should be noted that the “rural” areas (under 2500 population) included in the MSA’s account for 11% of all U.S. households and 19% of Pet spending. These folks spend some $ on their pets.

Population – Urban environments (over 2500 population) generate the largest share of Pet $ – 2/3. However, you just can’t discount rural households which generate 1/3 of total pet spending from only 20% of the total households. As you get more space – moving from the central city to the suburbs to “the country”, you spend more money on your pets.

Region – Pet Spending is dependent upon # of H/H’s, but the Midwest and West perform slightly better.

Pet ownership and spending is obviously widespread across U.S. Households. Just for fun, here is one thought on the minimum Household Demographic “requirements” to “Max Pet Spending Market Share”: 2+ people living together; who own their own home in an urban area, but not in the “city”; at least one person works or has retirement earnings; the household income is over $30K and they are White, but not of Hispanic ethnicity. That’s a lot of people, a lot of pets and a lot of spending!

In a follow up, we will look at how the demographic groups are performing compared to the number of households…earning their share…and which ones are the big gainers…or losers.