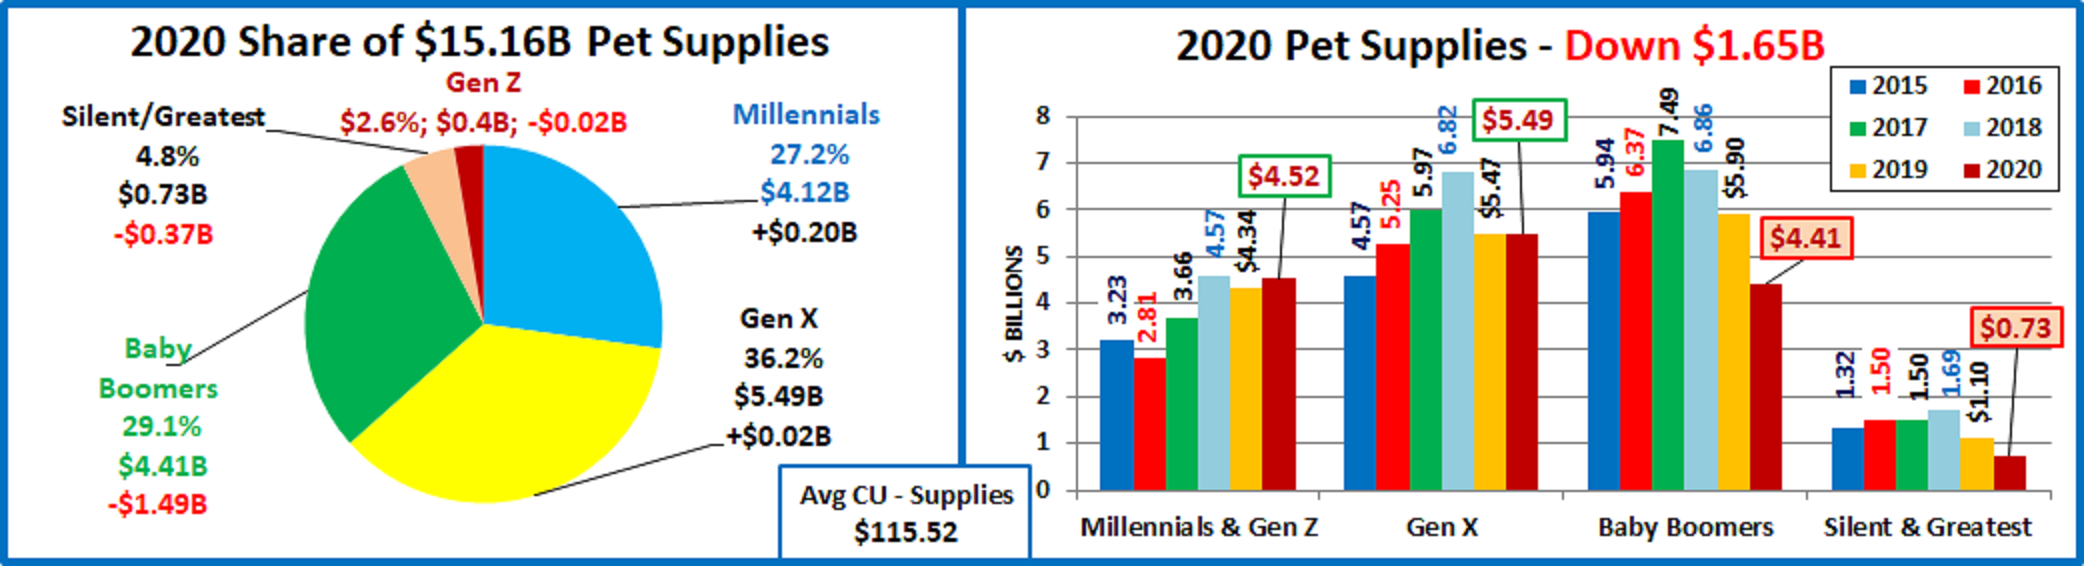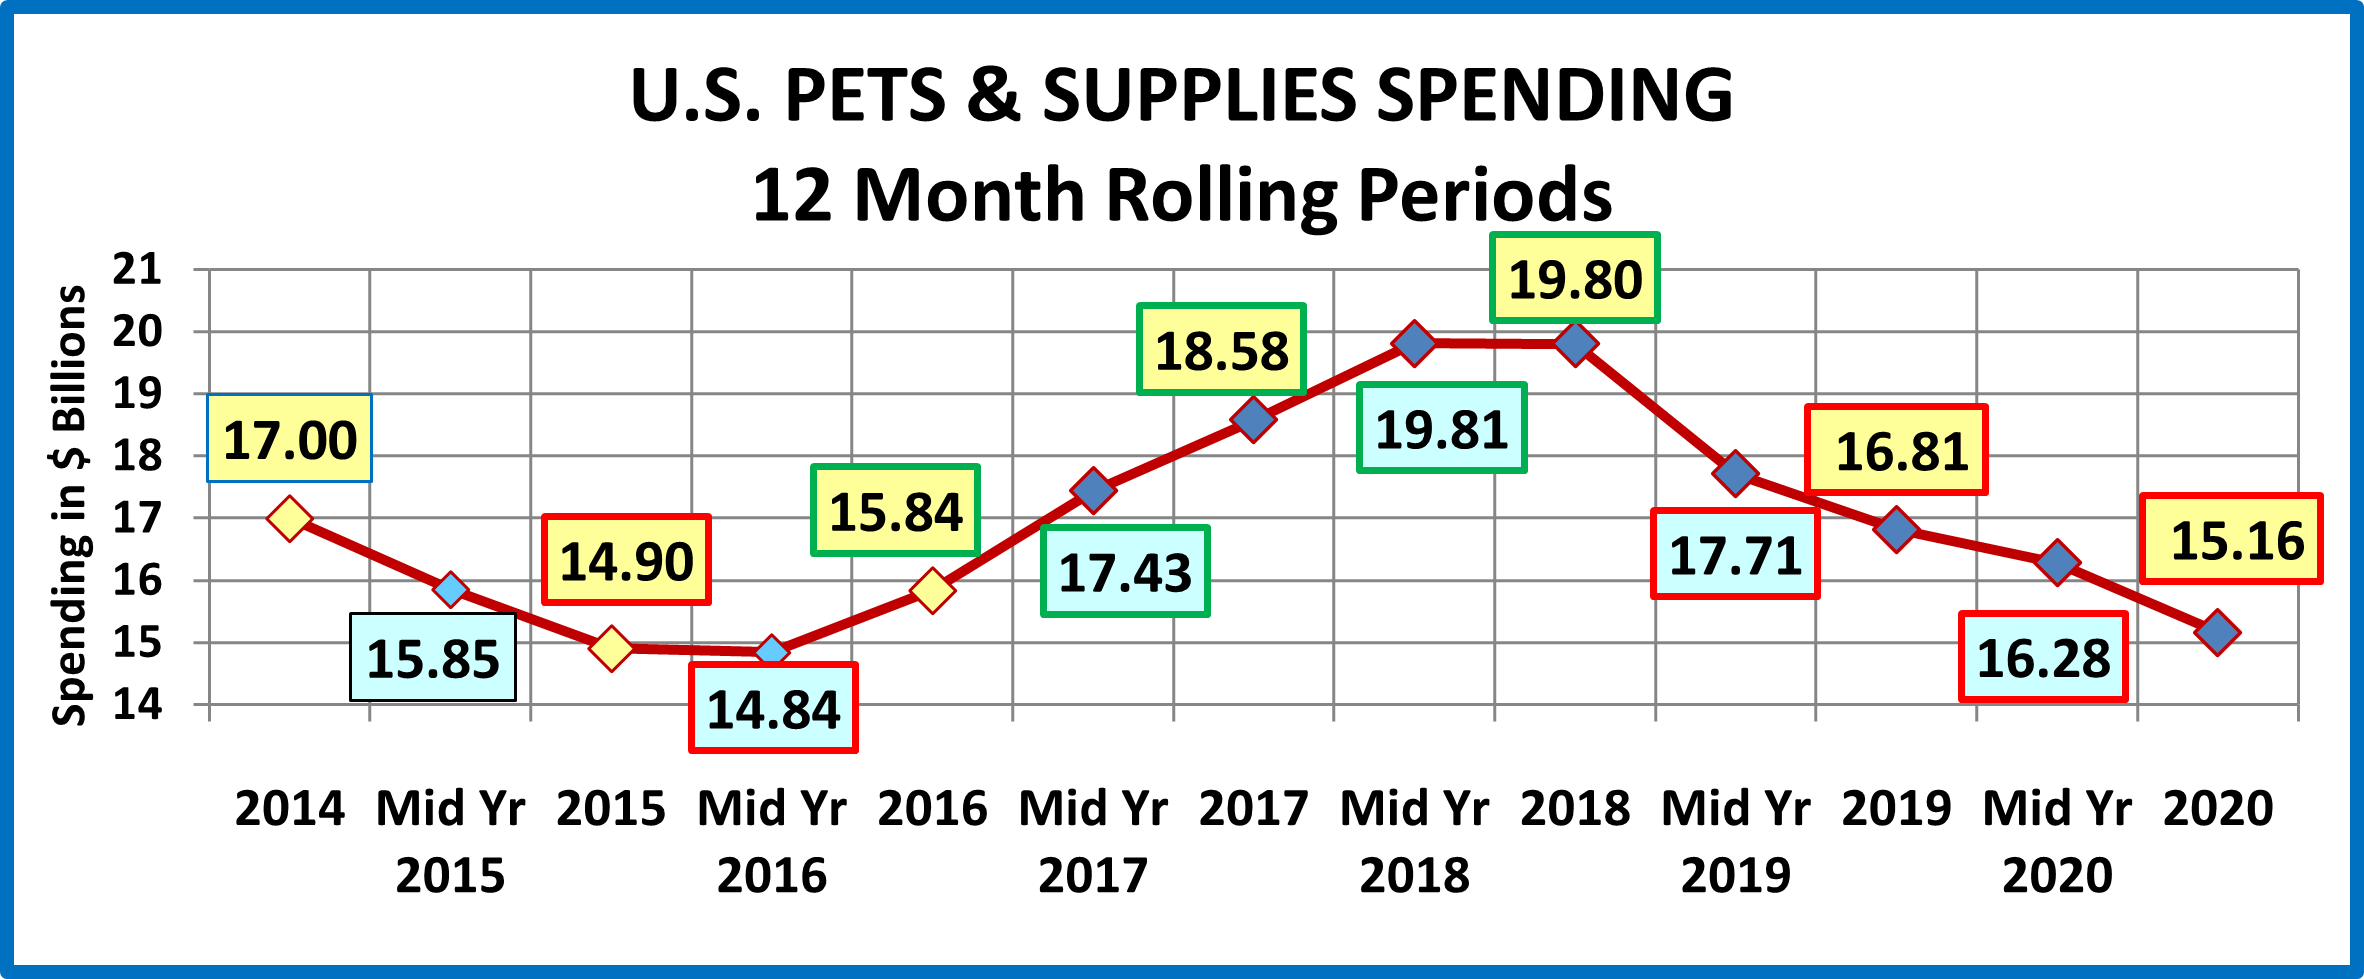
2020 Pet Supplies Spending was $15.16B – Where did it come from…?
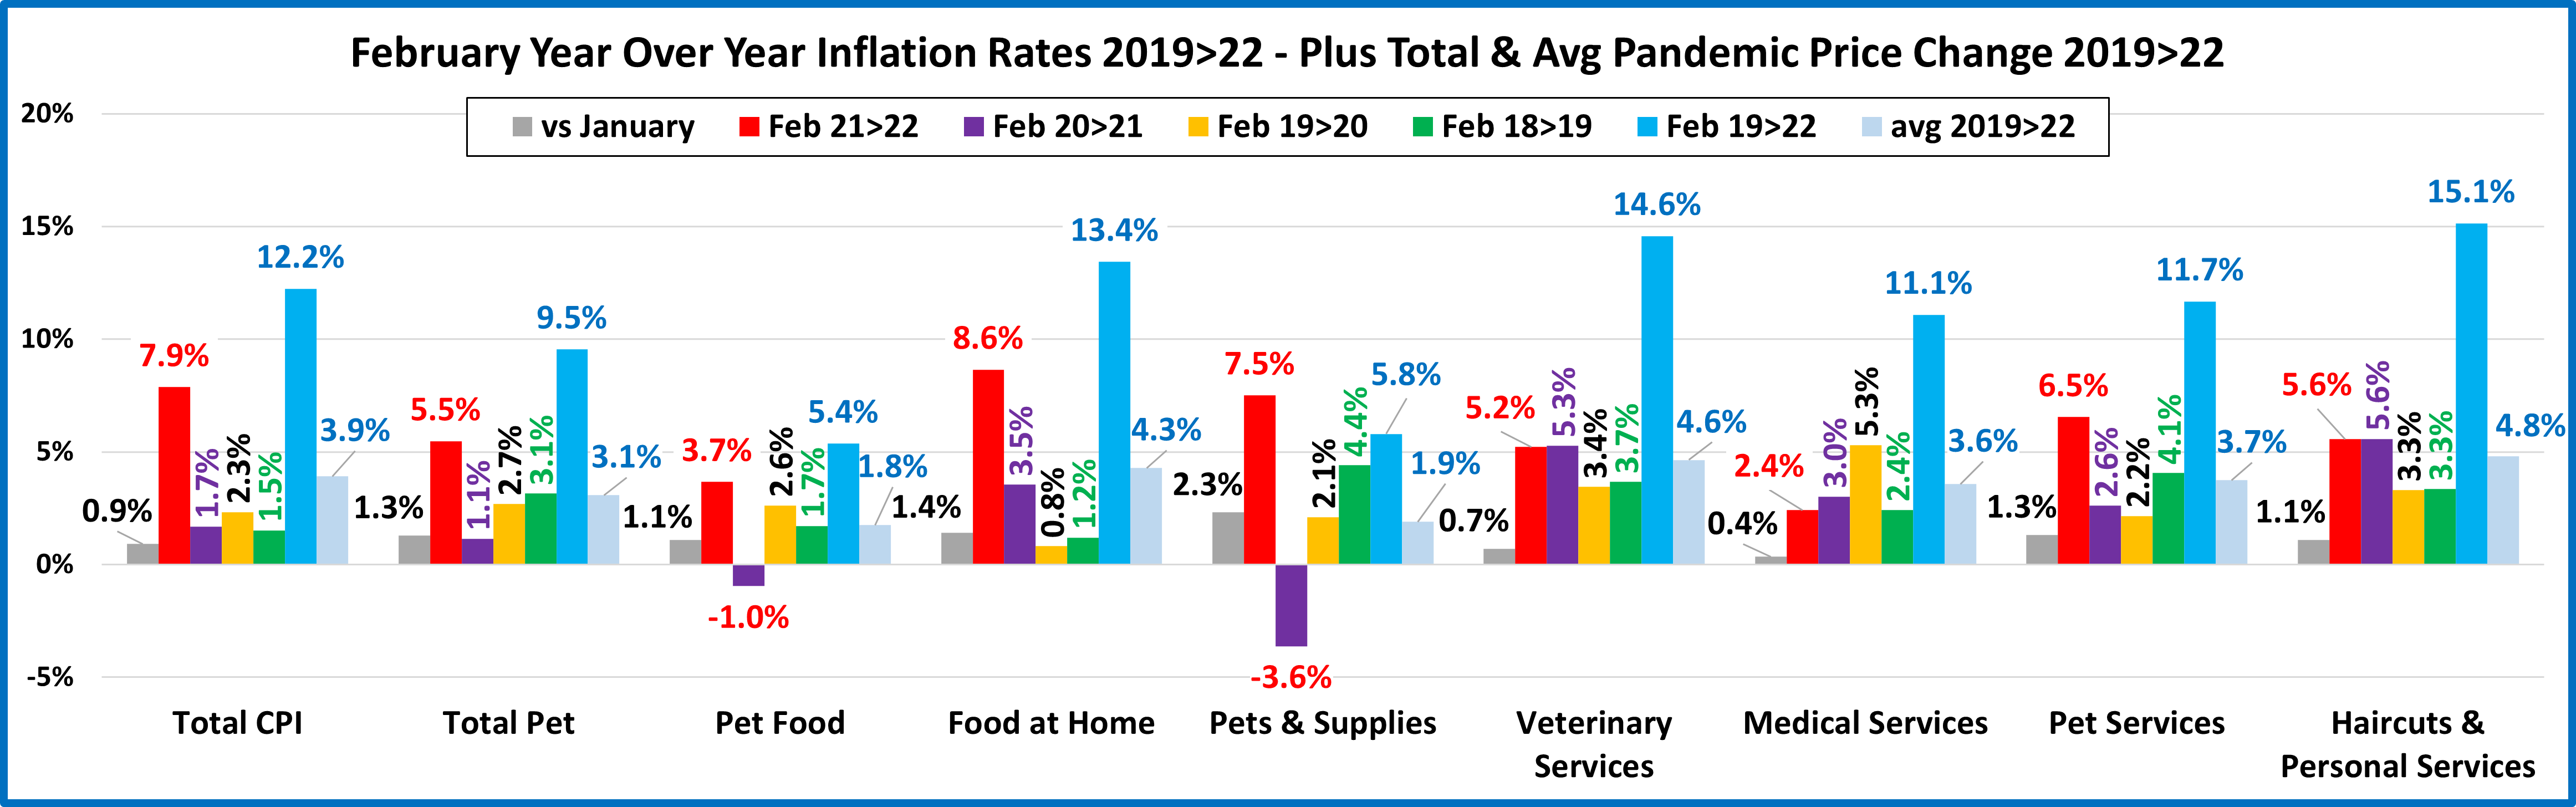
Next, we’ll turn our attention to Pets and Supplies. We’ll see definite differences from Pet Food as the spending in the Supplies segment is more discretionary in nature. There are other factors too. Spending can be affected by the spending behavior in other segments, especially Food. Consumers often trade $ between segments. However, the biggest factor is price. Many supplies categories have become commoditized so pricing changes (CPI) can strongly impact Consumers’ buying behavior in this segment. In the 2nd half of 2016, deflation began, and Supplies started a 24 month spending lift, totaling $4.97B. Prices turned up in mid-2018 due to new tariffs and Supplies $ fell a record -$2.98B in 2019. In 2020 prices fell in the Spring but most Supplies weren’t considered a pandemic necessity, so sales continued to drop, -$1.65B.
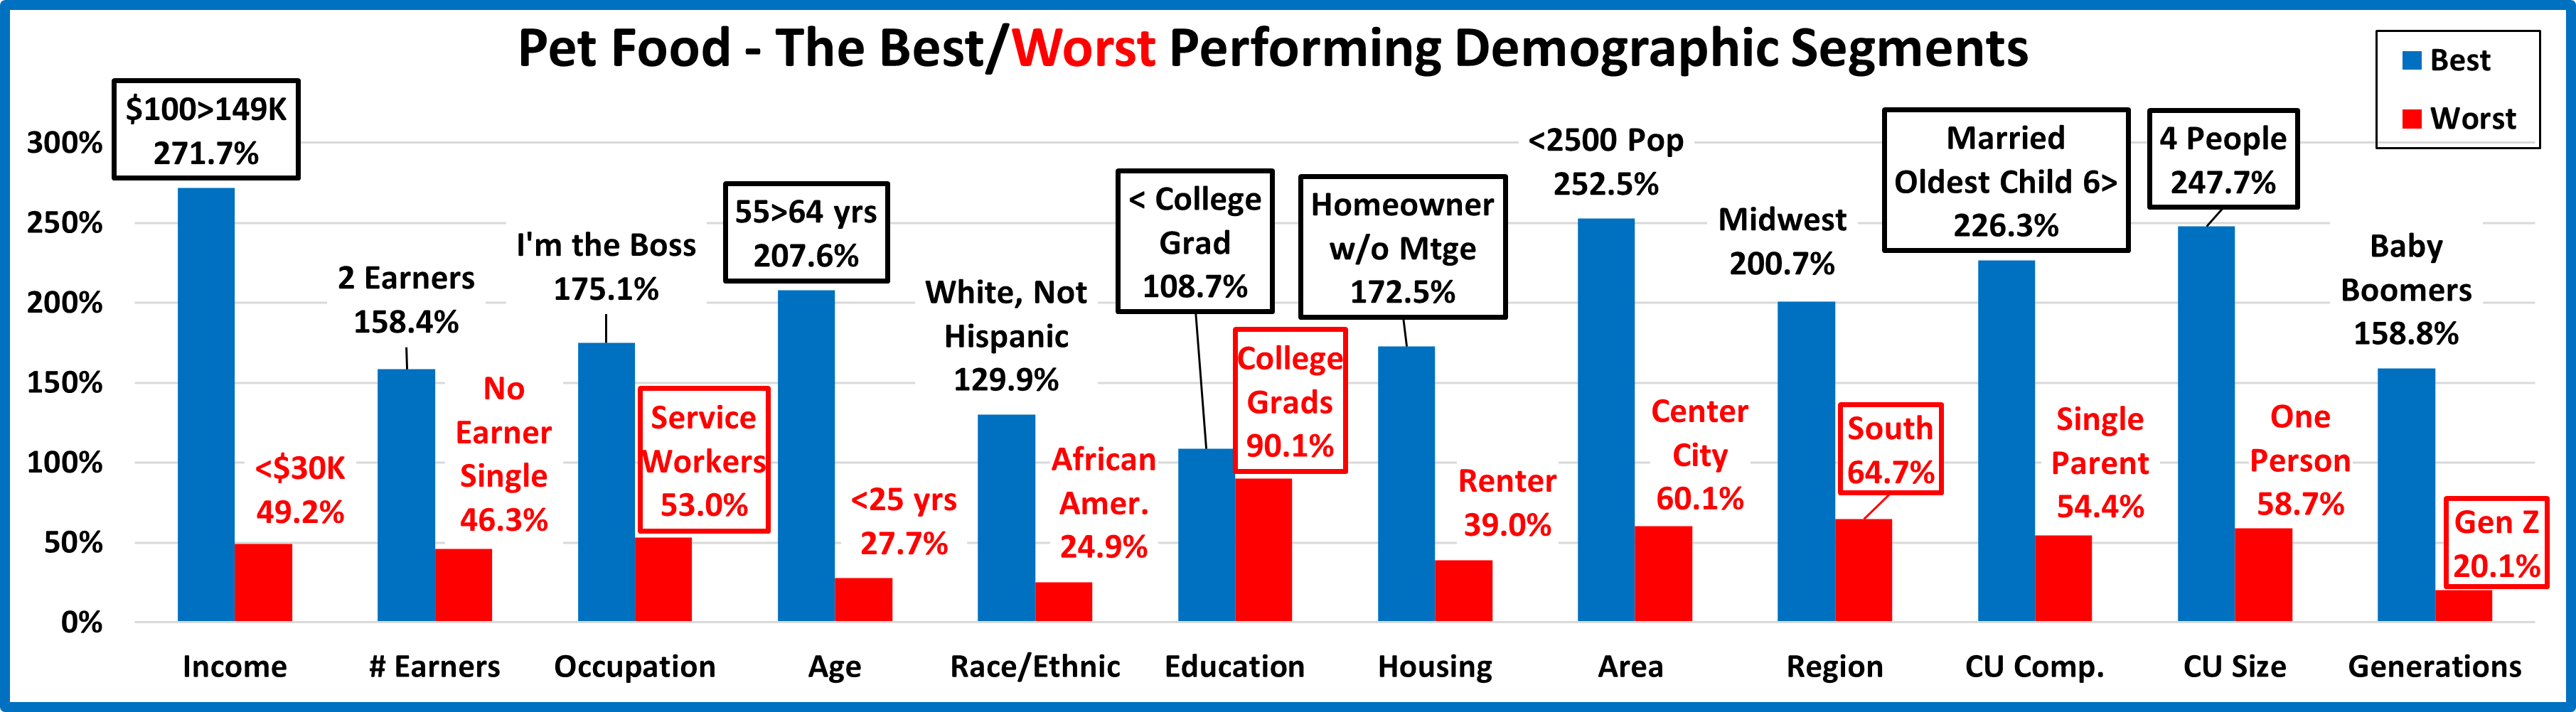
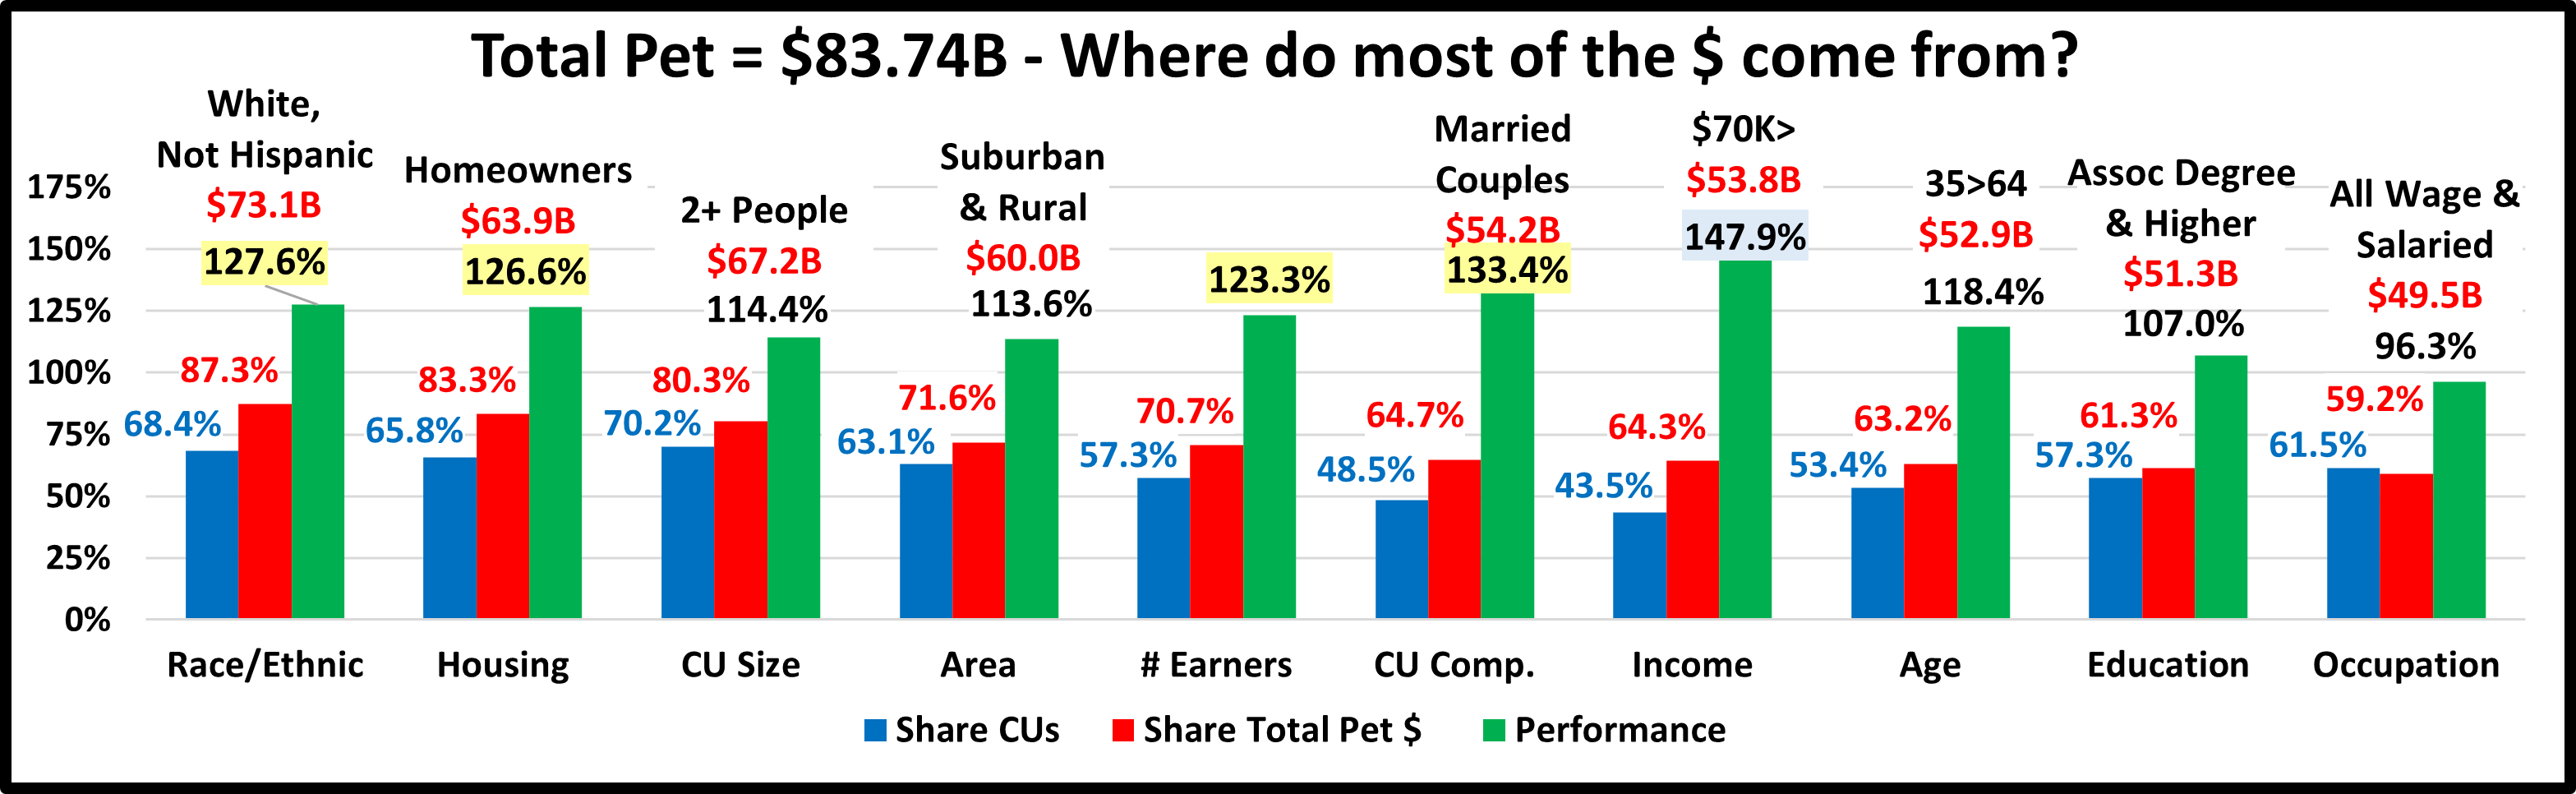
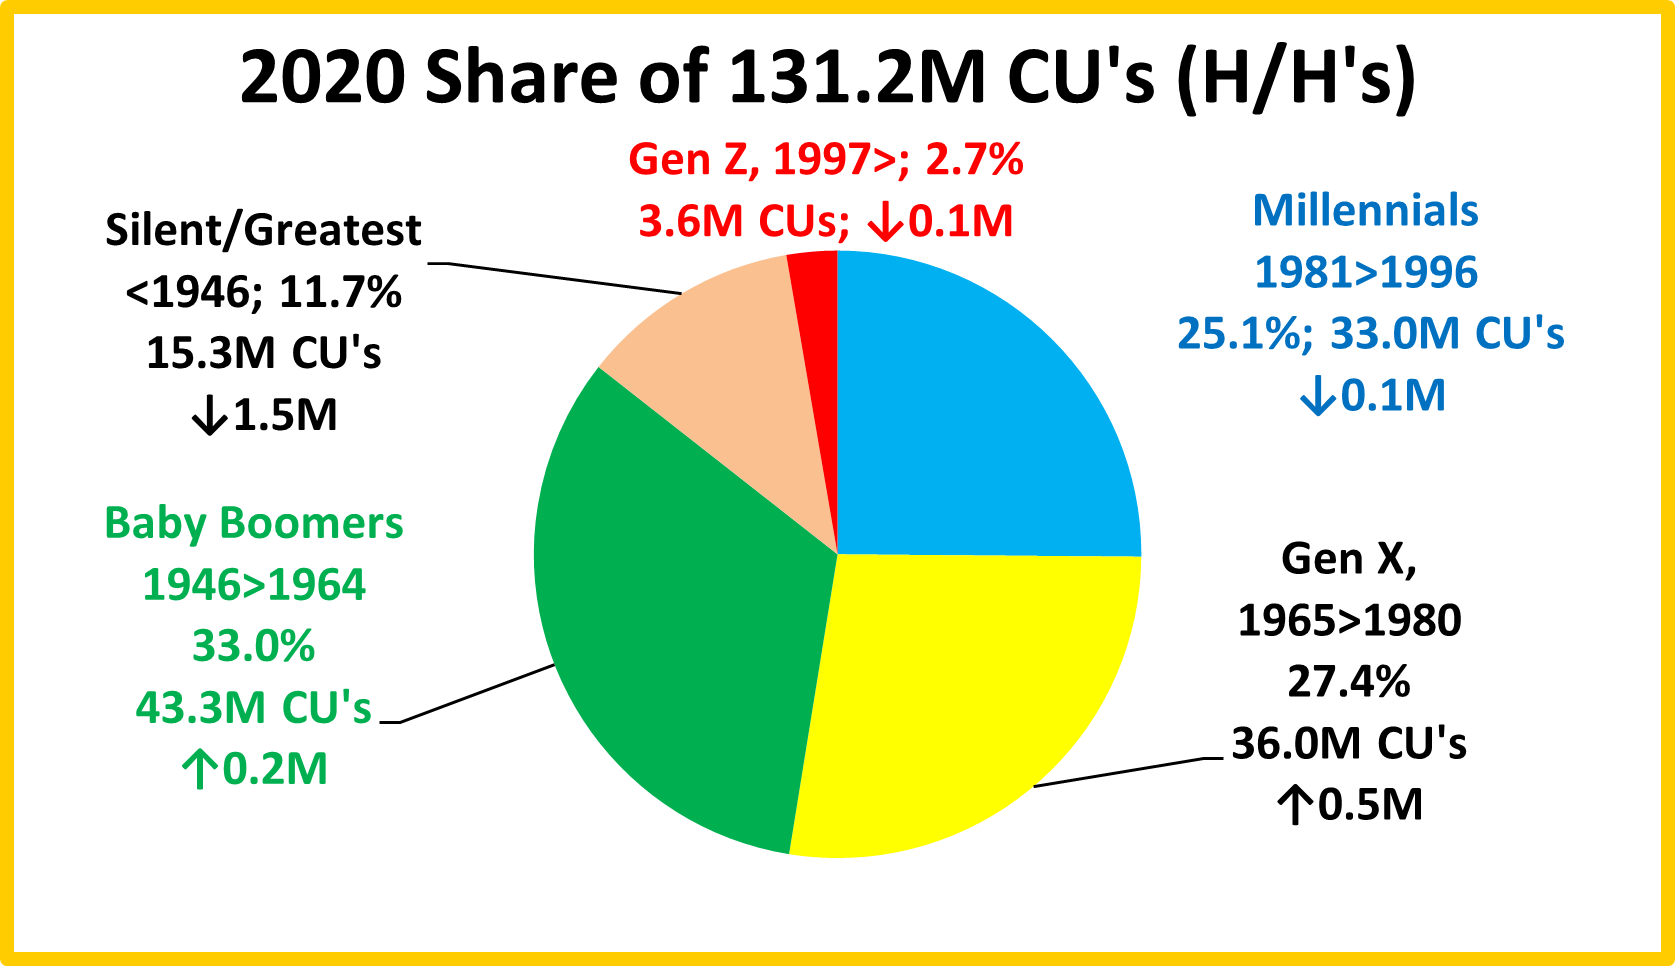
Let’s see which groups were most responsible for the bulk of Pet Supplies spending in 2020 and the $1.65B decrease. The first chart details the biggest pet supplies spenders for each of 10 demographic categories. It shows their share of CU’s, share of Supplies spending and their spending performance (Share of spending/share of CU’s). The Age group is different from Total Pet and Food. It’s younger, especially from Food. The categories are presented in the order that reflects their share of Total Pet Spending. This highlights the differences in importance. All 10 of the groups have over a 60% market share. The big difference is we only have 5 groups with performance over 120%, down 2 from 2019. That’s the same as Total Pet but 3 less than Pet Food. Higher income and # of Earners are the 2 most important categories but Supplies spending, unlike Pet Food, is becoming a little more balanced across many demographics.
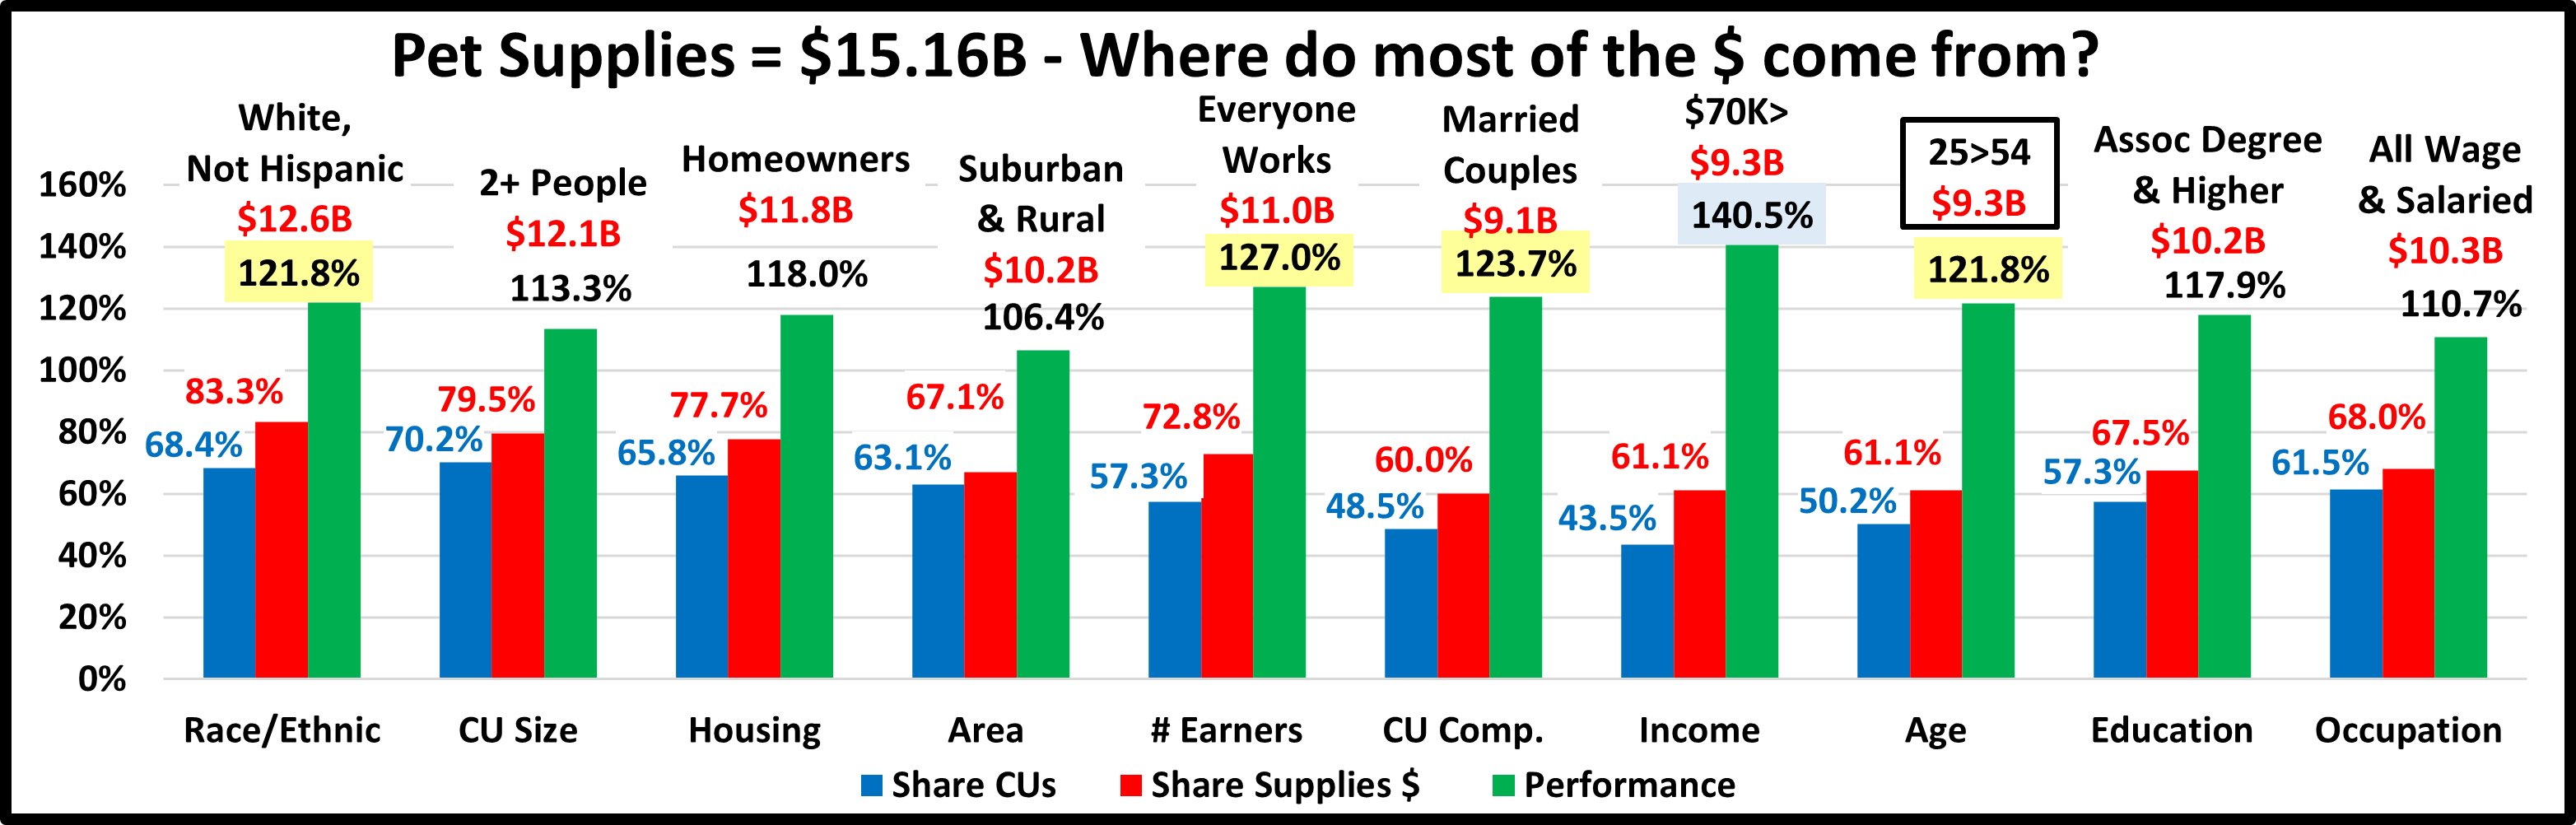
- Race/Ethnic – White, not Hispanic (83.3%) down from (84.6%) This large group accounts for the vast majority of spending in every segment. Their share fell and their performance rating was down from 123.4% to 121.8% but they remain #4, in terms of importance in Supplies Spending. Minority groups account for 31.4% of all CUs but spend only 16.7% of Supplies $. This is actually their biggest share of any category. The drop was less severe for lower income Hispanics and African Americans because they are more focused on essential supplies. Asians actually spent more.
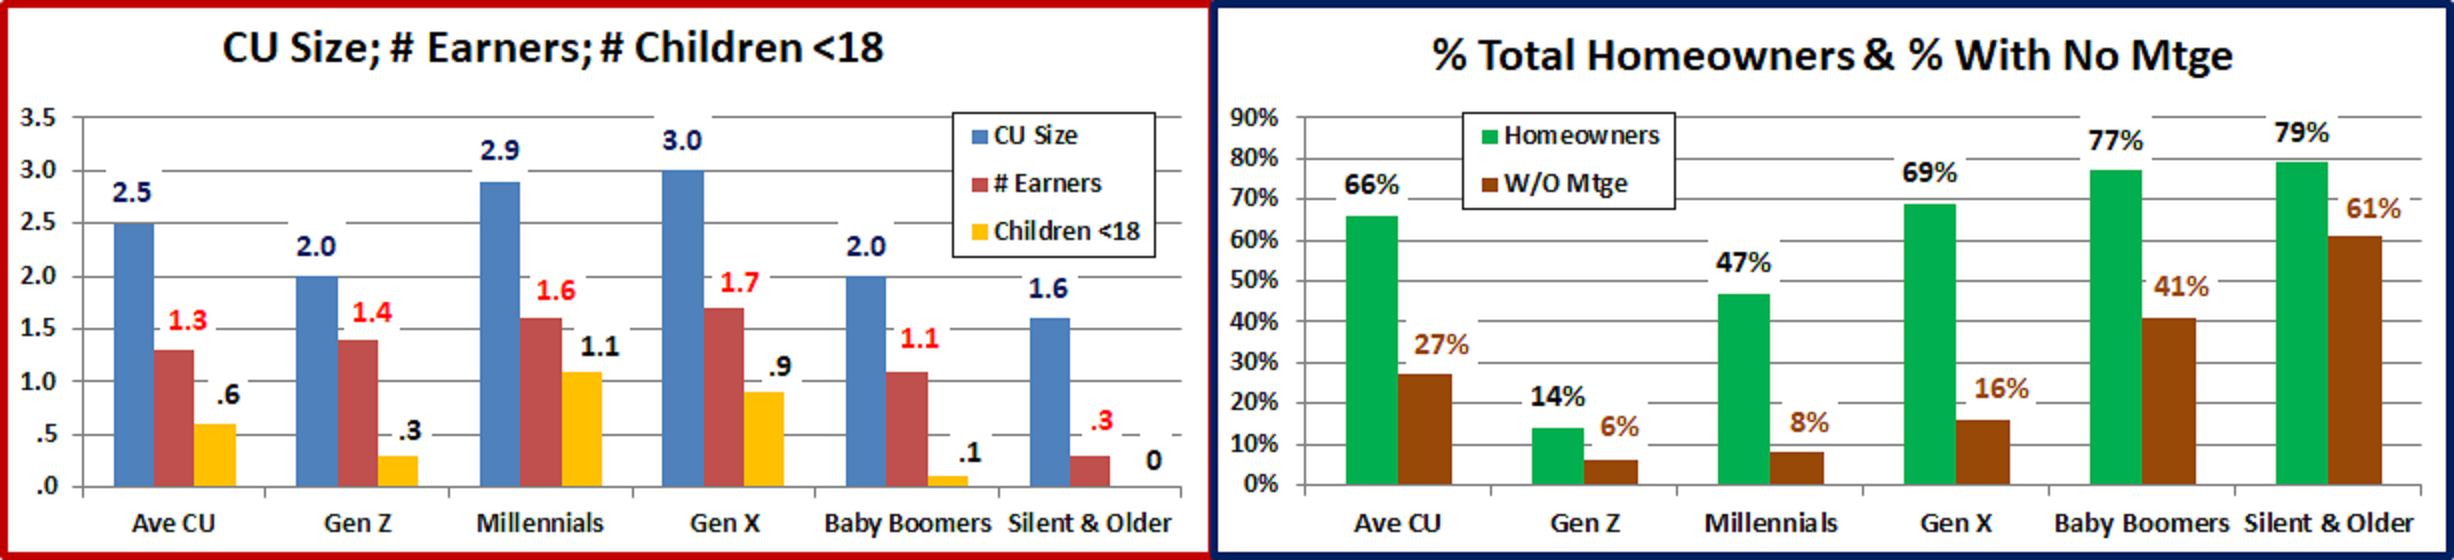
- # in CU – 2+ people (79.5%) down from (79.8%) Their Supplies performance was 113.3%, down from 114.3%. All CU sizes but 5+ spent less. Double digit decreases by 2 & 3 person CUs drove down the 2+ CU share and performance. However, all groups but 1 person CU’s still performed above 100%.
- Housing – Homeowners (77.7%) up from (76.6%) Homeownership is a big factor in pet ownership and spending in all segments. However, due to an increases in CUs, their performance dropped to 118.0%, from 120.1%,. They stayed in 6th place in terms of importance for increased Pet Supplies spending but dropped out of the 120+% Club. Homeowners w/Mtges spent 0.6% more but Renters and Homeowners w/o Mtges had double digit % decreases.
- Area – Suburban + Rural (67.1%) down from (68.0%) All areas but Rural spent less. The Suburban drop was so large that we had to add Rural to the big group in order to reach our 60% goal. Even with this positive addition the new group lost a little share and their performance fell to 106.4%, from 106.7% in 2019.
- # Earners – “Everyone Works” (72.8%) up from (70.0%) Their performance grew from 119.6% to 127.0% and they moved up from #7 to #2 in importance. In this group, all adults in the CU are employed. Income and now # Earners is very important in Supplies $. The gains were driven by a big lift by working singles, the only group to spend more.
- CU Composition – Married Couples (60.0%) down from (60.9%) Their performance also dropped from 124.6% to 123.7% but they stayed 3rd in importance. Only Married Couples with the oldest child 6>17 and Single Parents spent more. The Married group was driven down primarily by a $1.33B decrease in spending by Couples only and those with at least one child over 18.
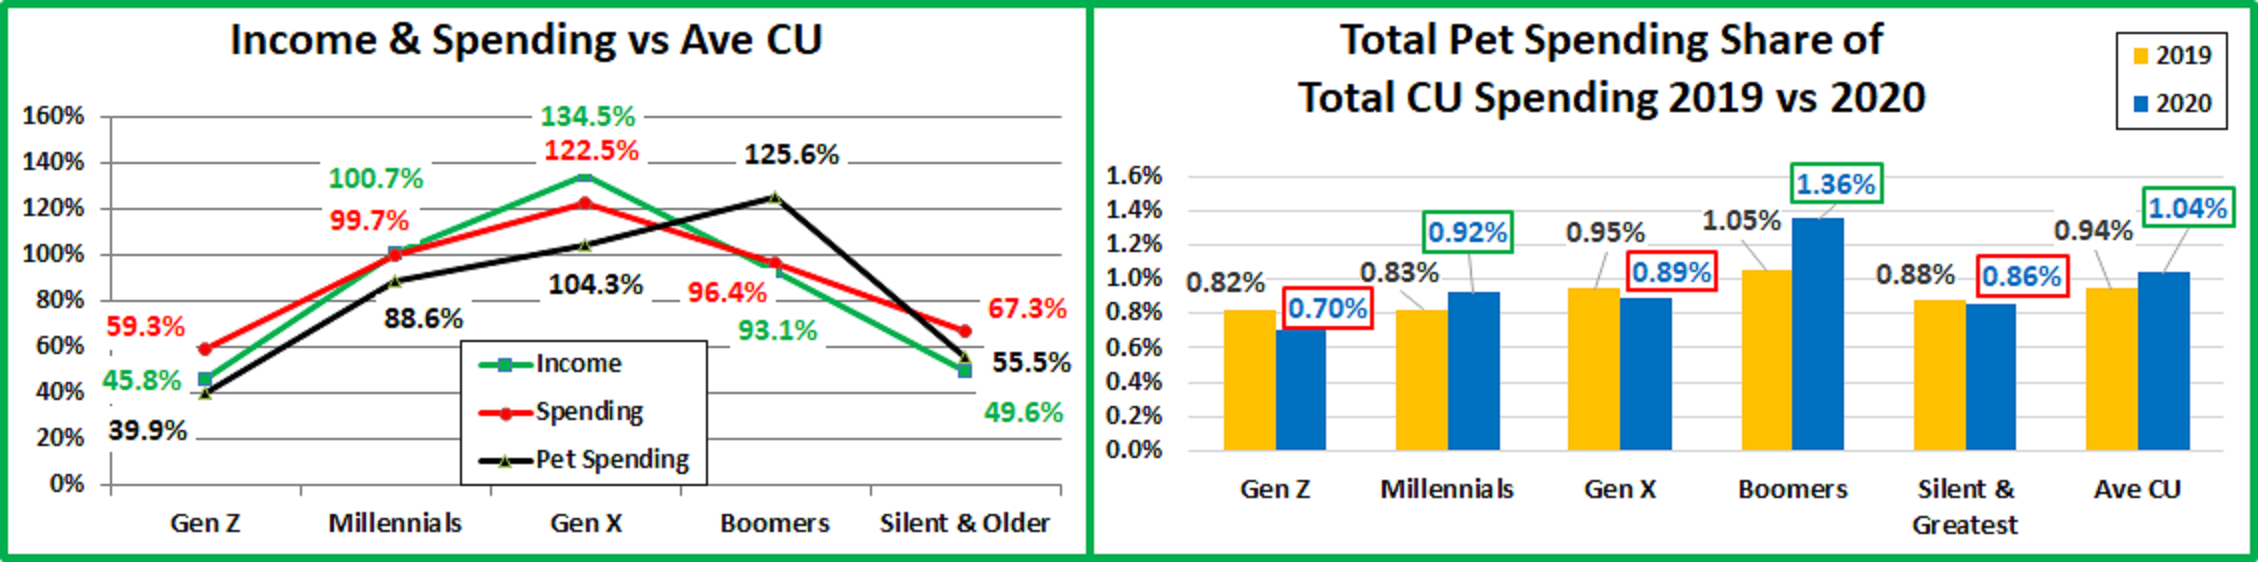
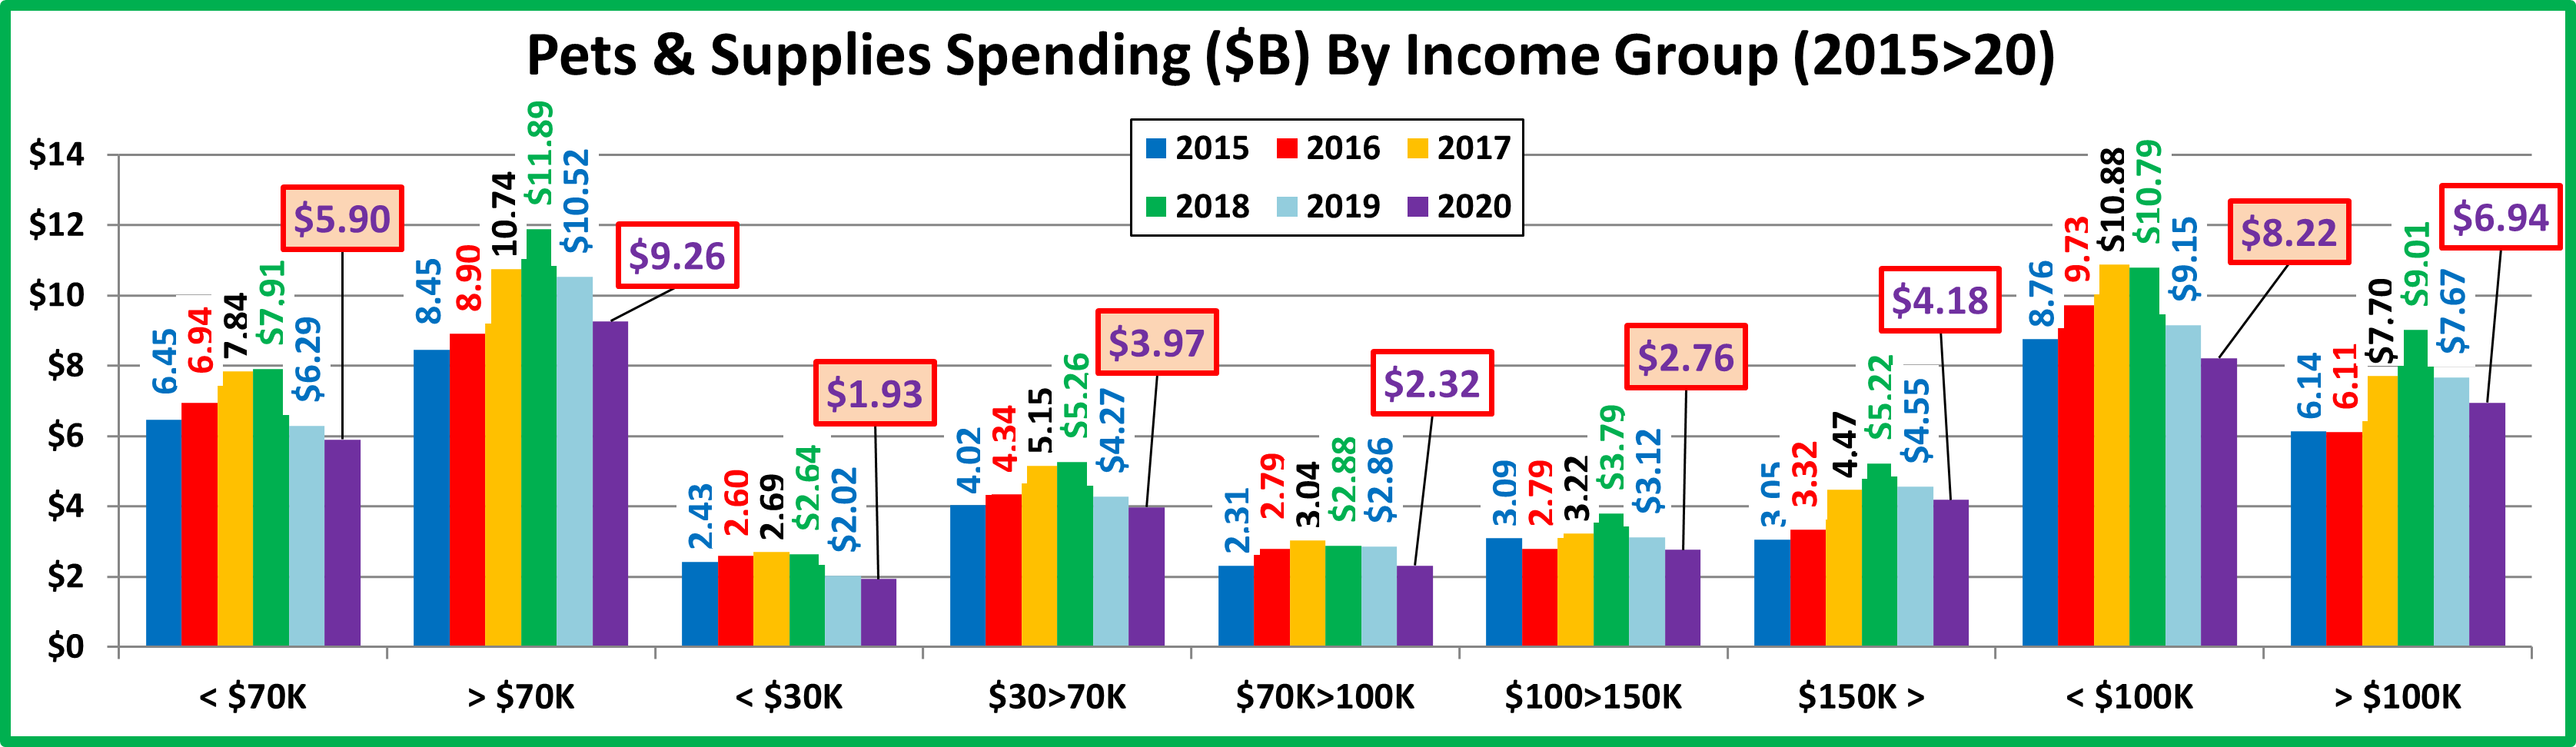
- Income Over $70K (61.1%) down from (62.6%) Although performance fell from 150.8%, to 140.5%, income is still the most important factor in increased Pet Supplies Spending. The $40>49K group spent 24% more and the $150>199K group was +0.6%, the only increases. The $70K> lost ground because they had a bigger decrease than <$70K. A 4% increase in CUs along with the 2020 movement away from discretionary spending has pushed the performance of this high income group in Supplies down to its lowest level for any industry segment.
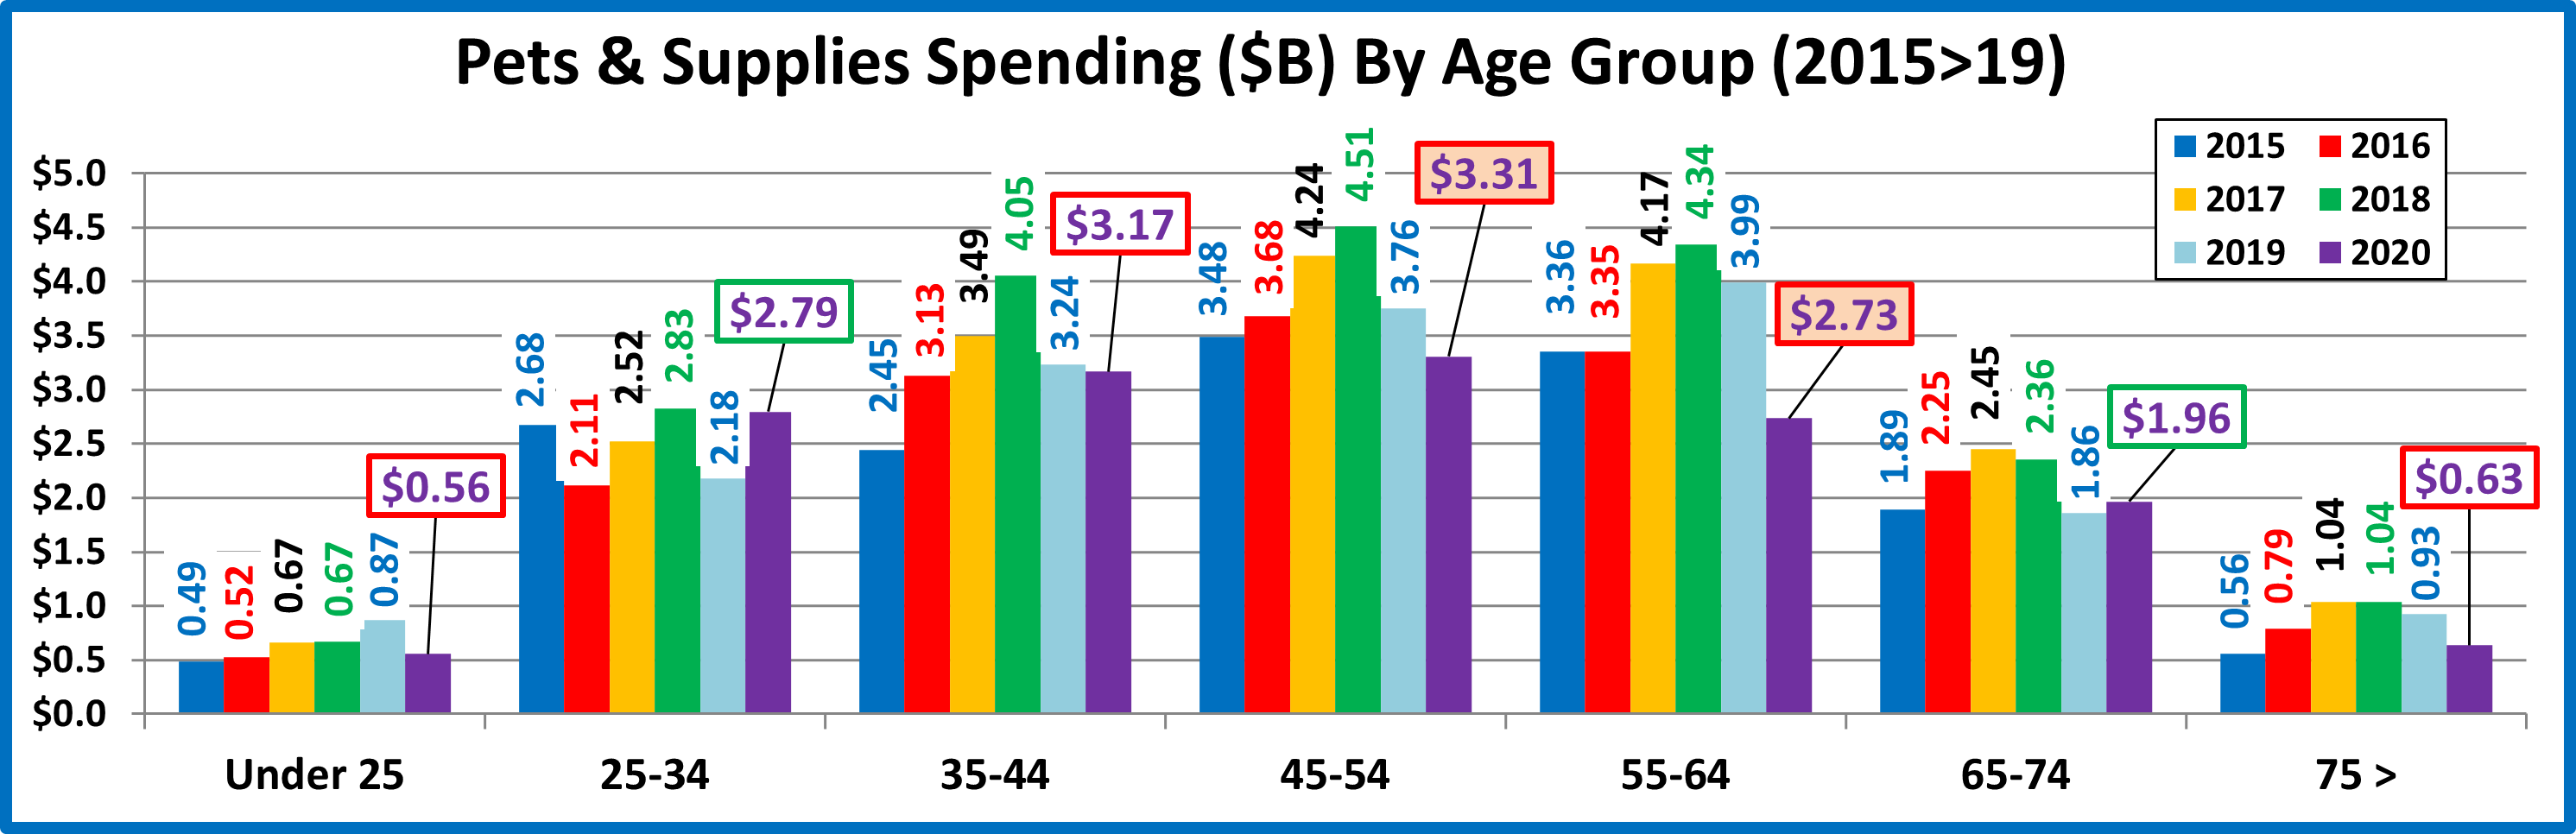
- Age – 25>54 (61.1%) up from (54.5%) This is a new, younger group as a spending lift by the 25>34 yr-olds pushed their spending past that of the 55>64 yr-olds. The performance level increased to 121.8% from 109.5% but the change in range caused the age category to fall from 2nd in importance to a tie for 4th. Supplies $ traditionally skew towards the younger groups. However, the 65>74 yr-olds also spent more so Supplies spending became more balanced across the age groups.
- Education – Associates Degree or Higher (67.5%) down from (67.6%) Higher Education lost market share and their performance level decreased from 121.6 to 117.9%, largely because of an increase in the number of CUs. They fell from 5th to 7th in importance. The only increases came from the opposite ends of the Education spectrum. The less than High School diploma group spent $0.17B more and those with Advanced College Degrees were +$0.28B.
- Occupation – All Wage & Salary Earners (68.0%) up from (65.6%) – The performance of this group was 110.7%, up from 107.5%. Only the 2 highest income segments, Mgrs/Professional & Self-Employed spent more. A big drop in spending by Retirees drove up the share and performance of all wage/salary earners in Supplies spending.
Pet Supplies spending skews younger than both Total Pet and Food. The spending decrease continued in the pandemic as consumers focused on needs rather than the more discretionary Supplies. They often traded $ as the groups with the biggest increases in Food had the biggest decreases in Supplies $. Also, the drop from 7 to 5 groups with 120+% performance indicates reduced disparity between segments.
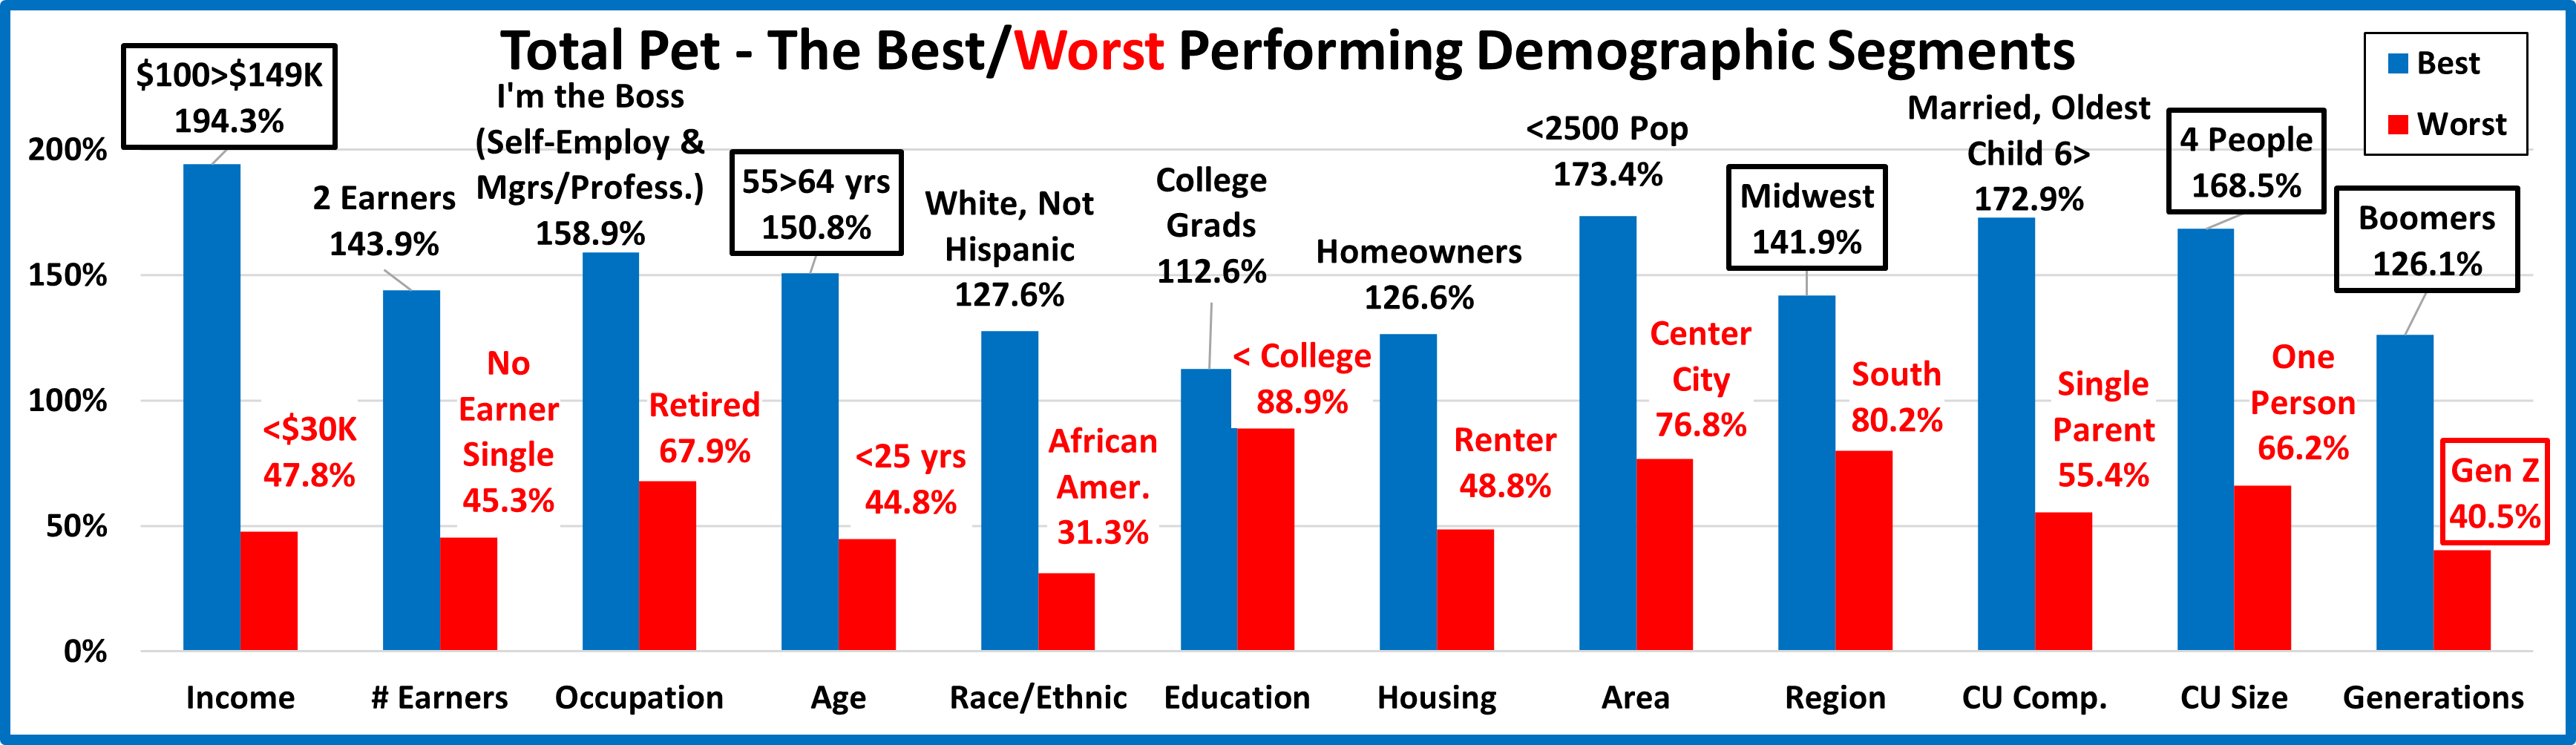
Now, we’ll look at 2020’s best and worst performing Pet Supplies spending segments in each category.
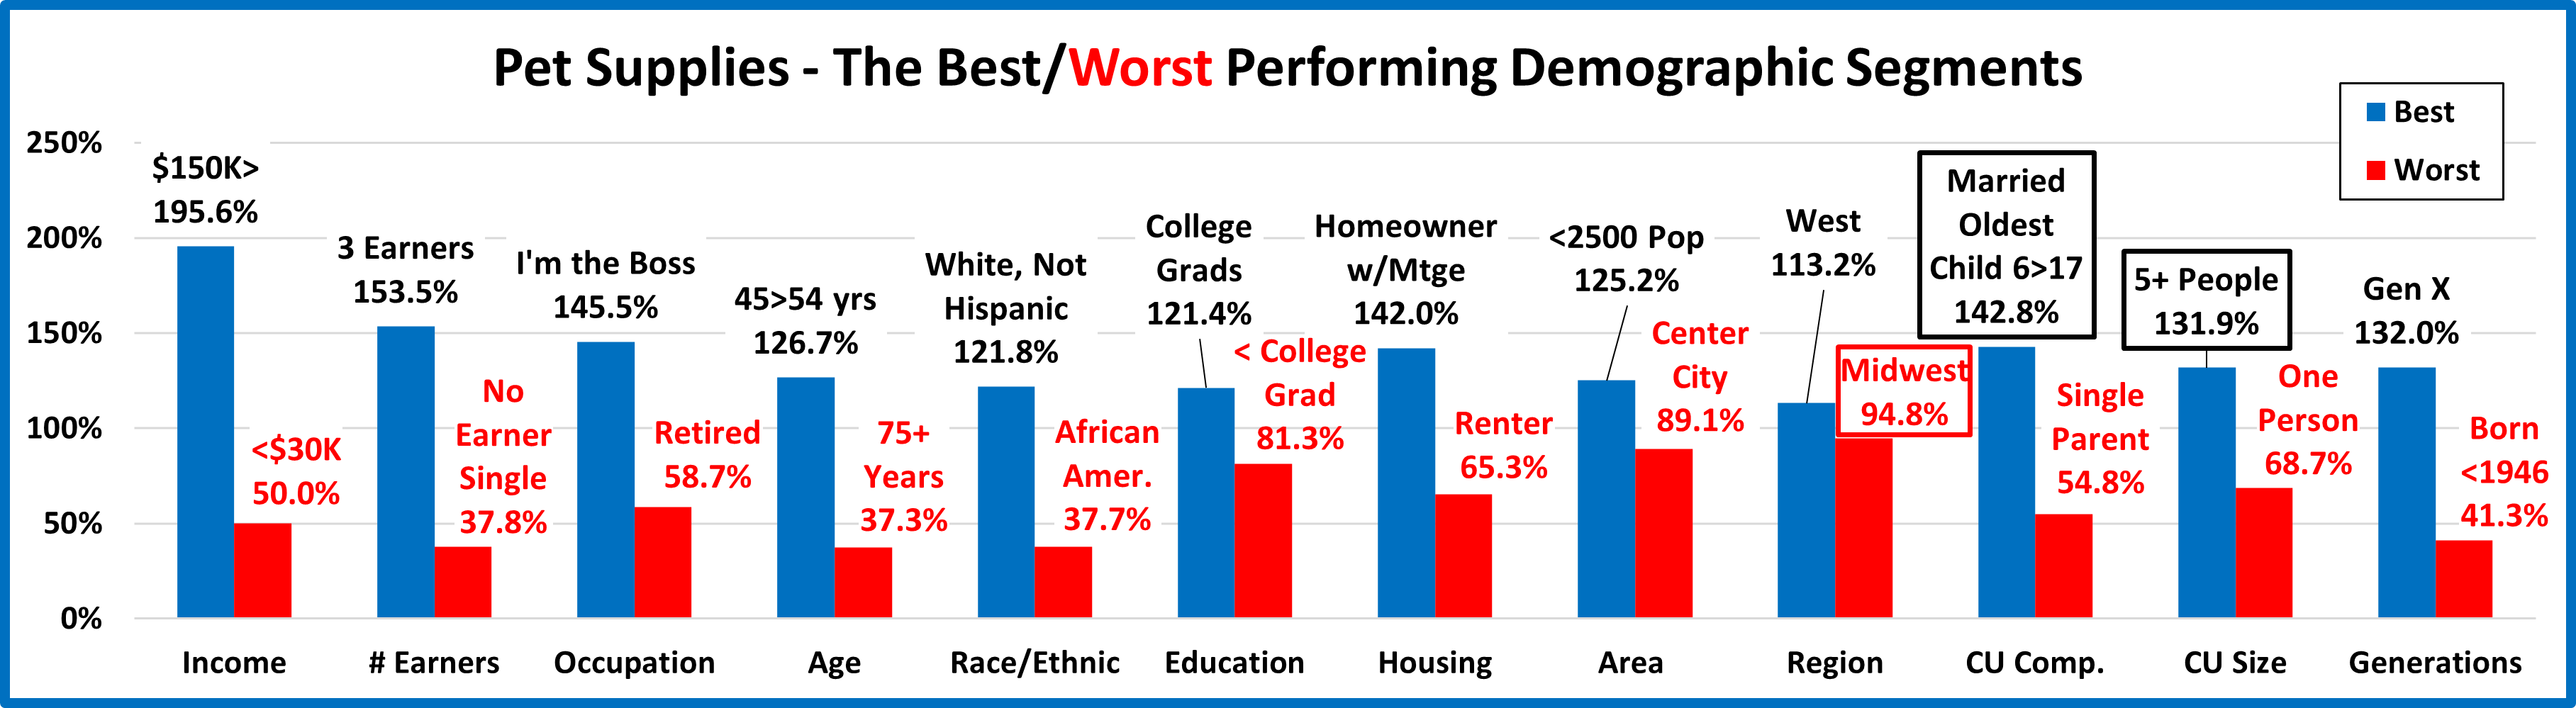
Almost all of the best and worst performers are those that we would expect. In Pet Supplies spending, there are only 3 that are different from 2019. That is 3 less than Total Pet and 7 less than Pet Food. It is actually the lowest number for any Industry segment. As we move deeper into the data, we will start to see even more differences between the Industry Segments. Changes from 2019 are “boxed”. We should note:
- Income matters in Supplies spending.
- The $150K> was group the top performer in all segments but Food, where $100>149K won. However, this highest income group had its lowest performance level in Supplies.
- All of the 12 winners for best performance were either 1st or 2nd in income of any segment in the category.
- Region – The West won again and this year was the only region with performance over 100%. The Midwest replaced the South at the bottom. However, spending was more regionally balanced with the lowest performance at 94.8%.
- CU Composition – Last year’s winner had an oldest child over 18. Spending skewed a little younger this year. Marriage was the “key”. Only Singles and Single Parents performed below 100%.
- # in CU – 5+ People CUs was the only size to increase Pet Supplies spending so they earned their spot. Once again, only Singles perform below 100% so in Pet Supplies spending, it still just takes 2.
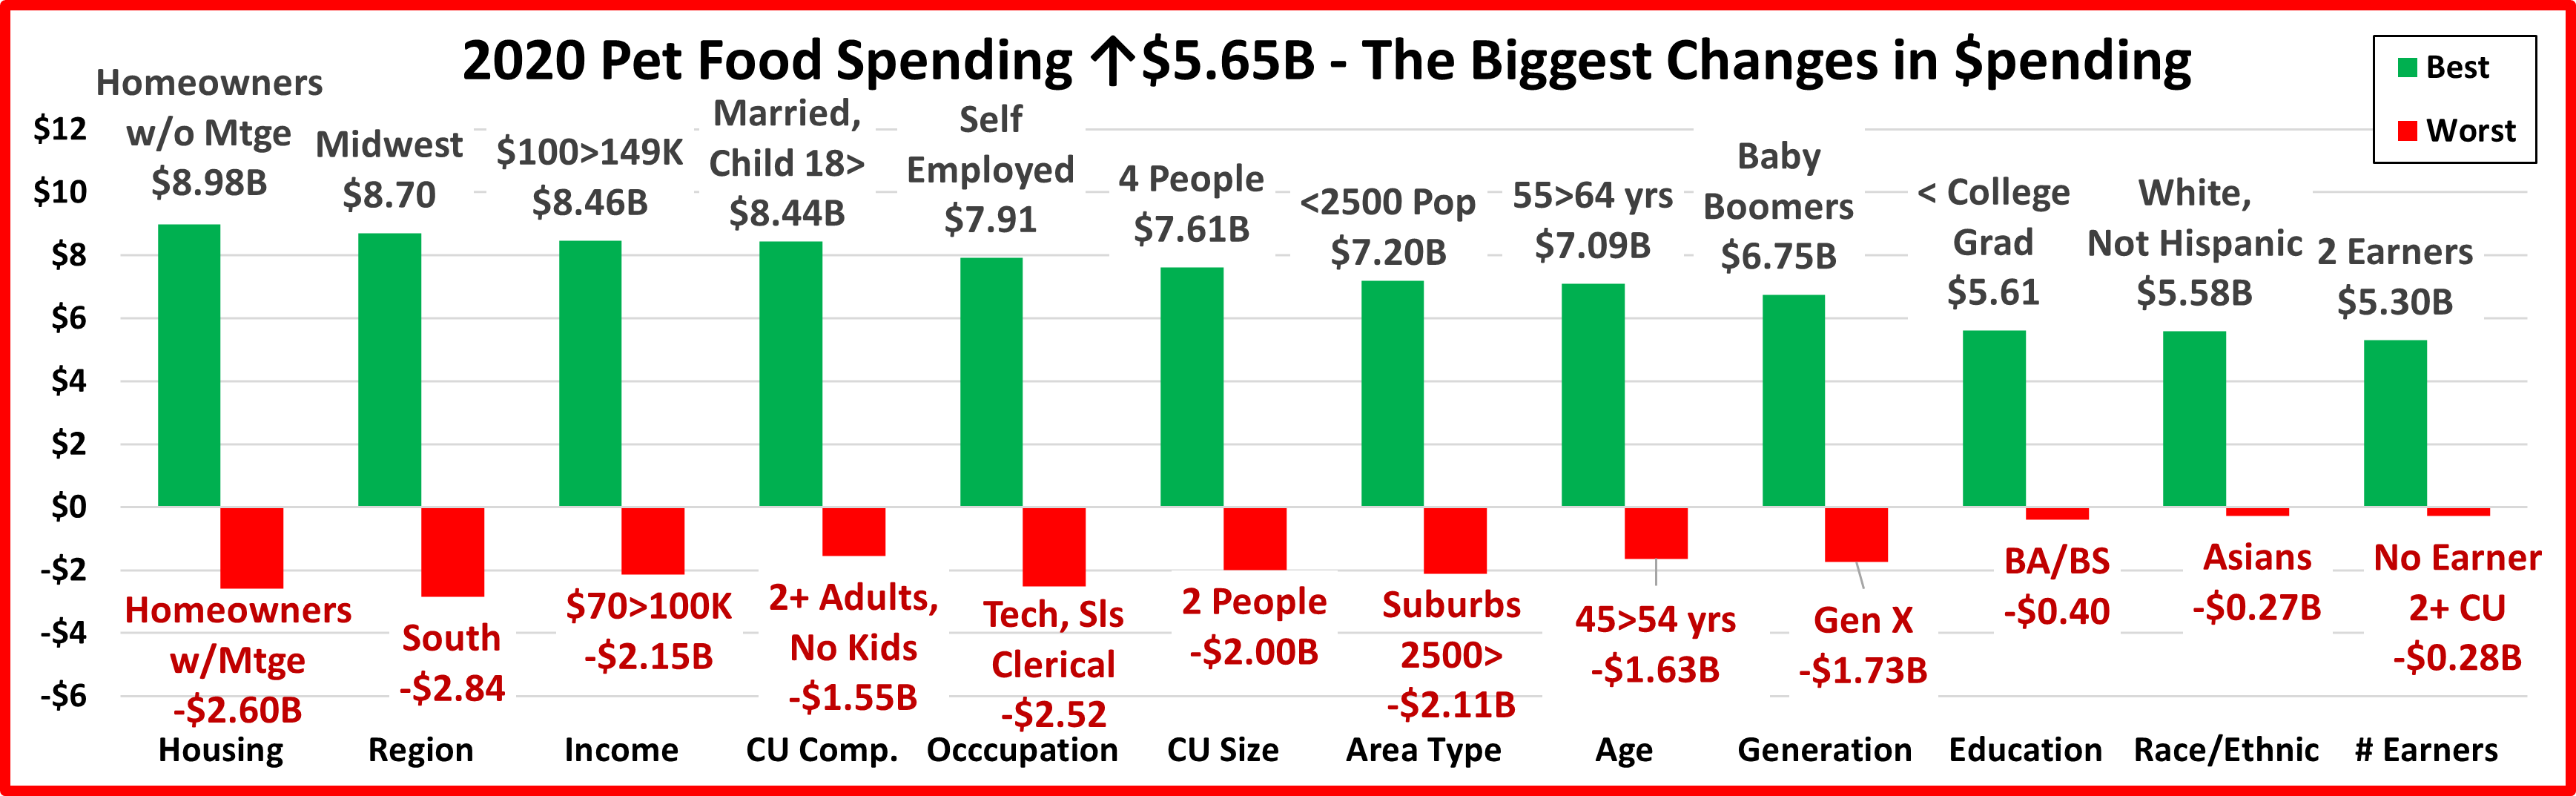
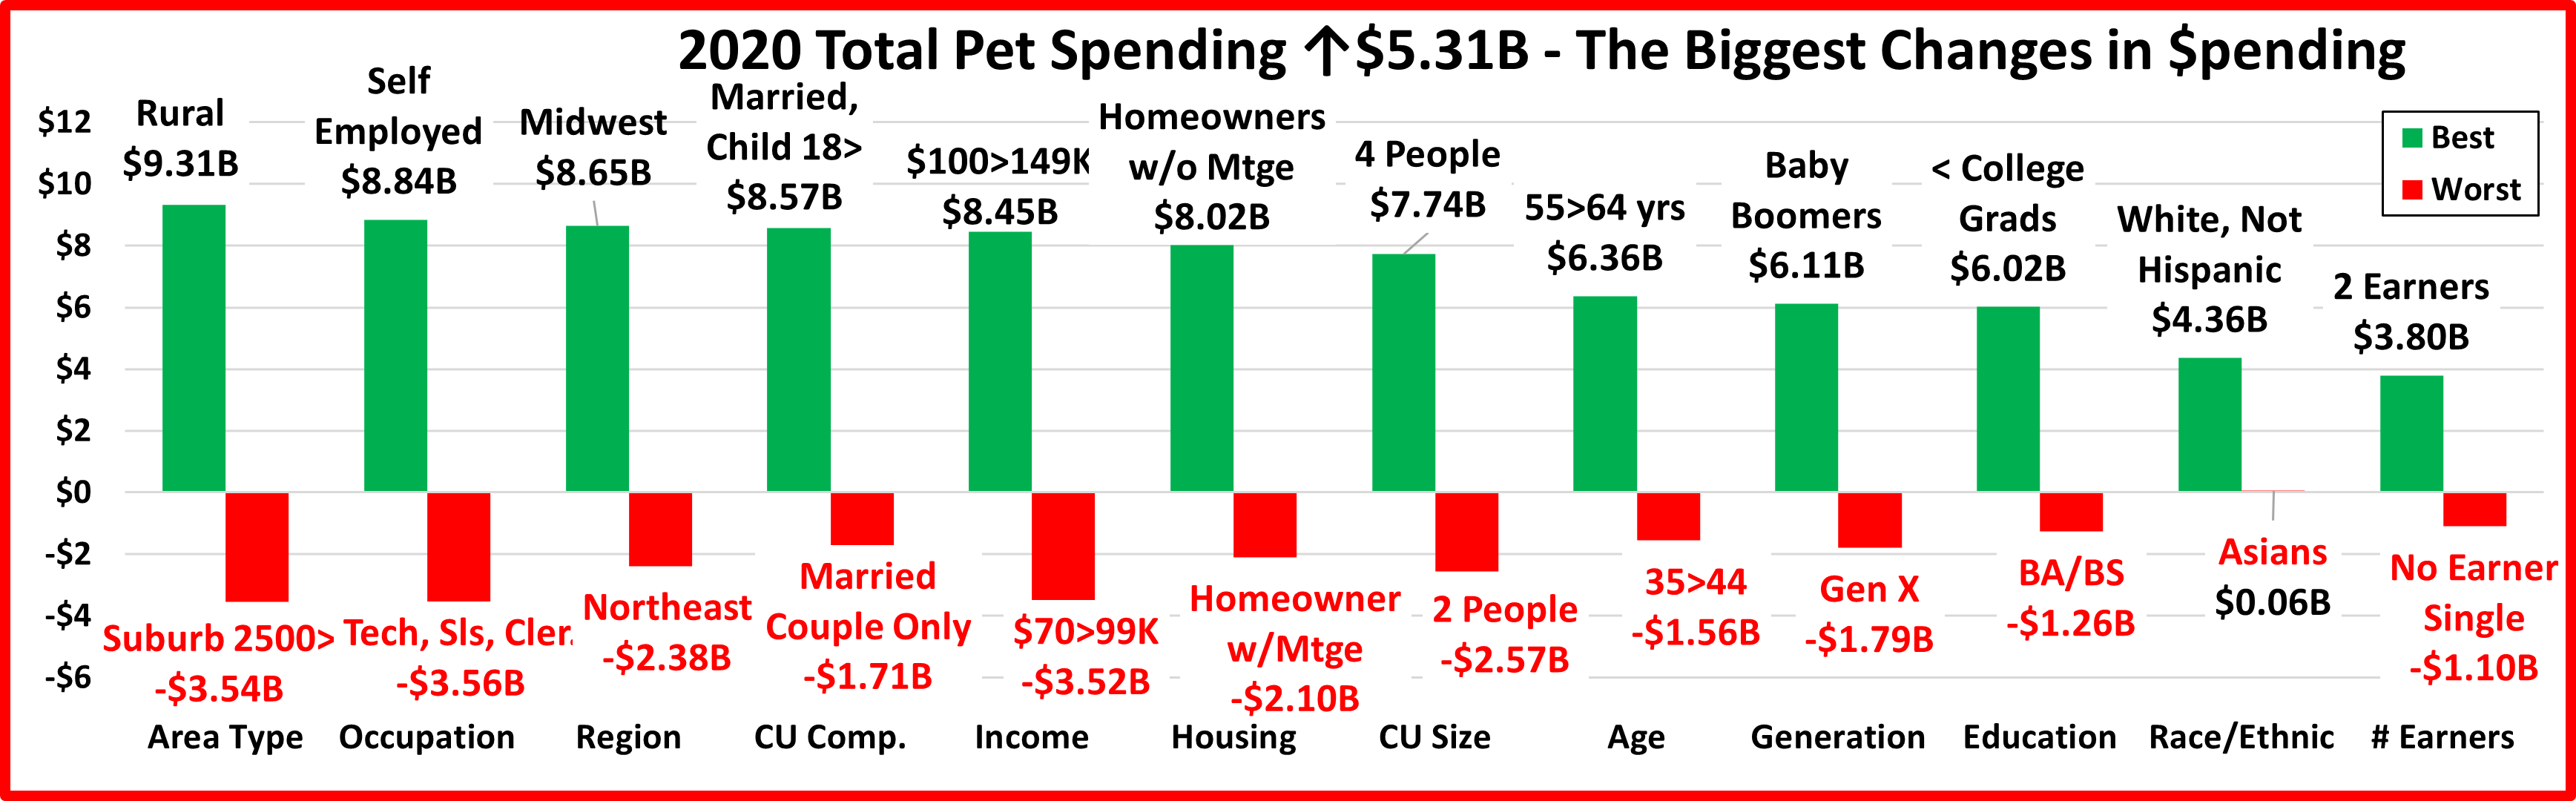
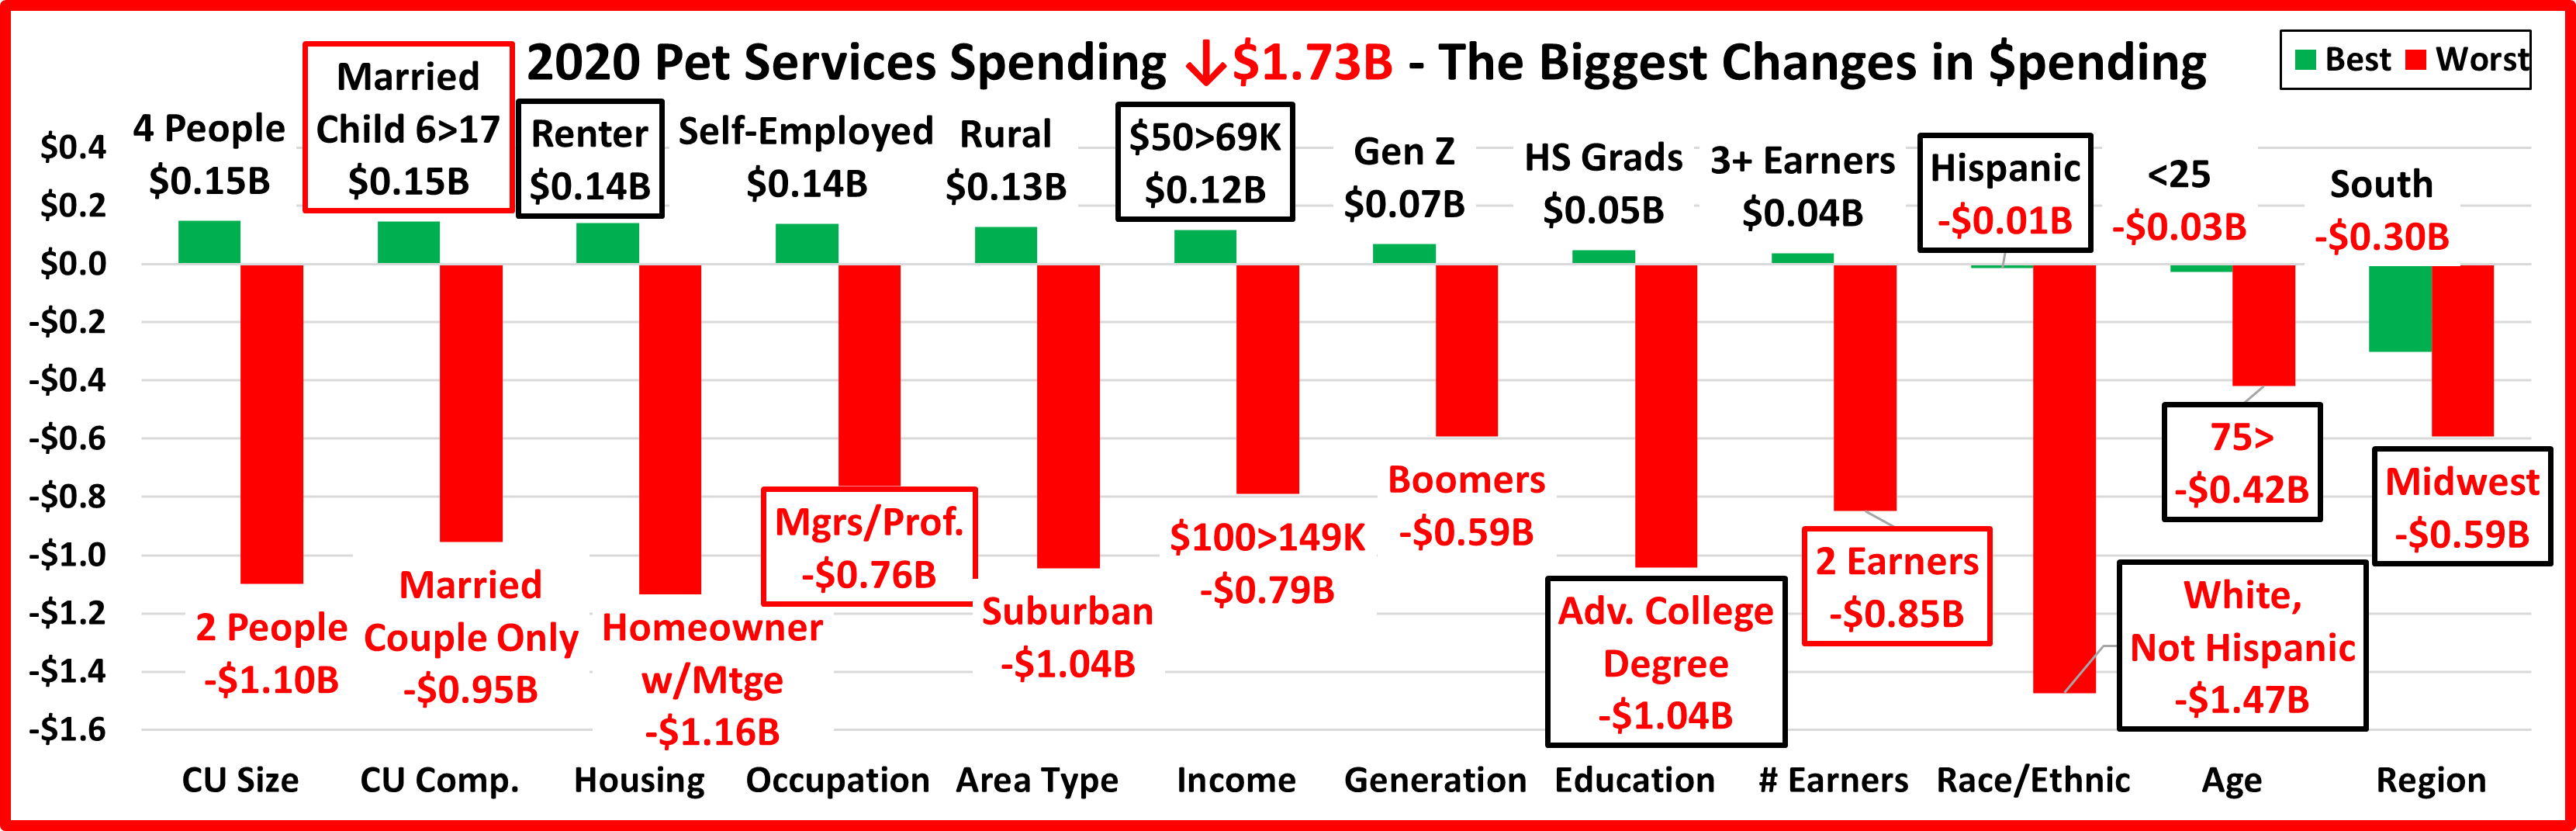
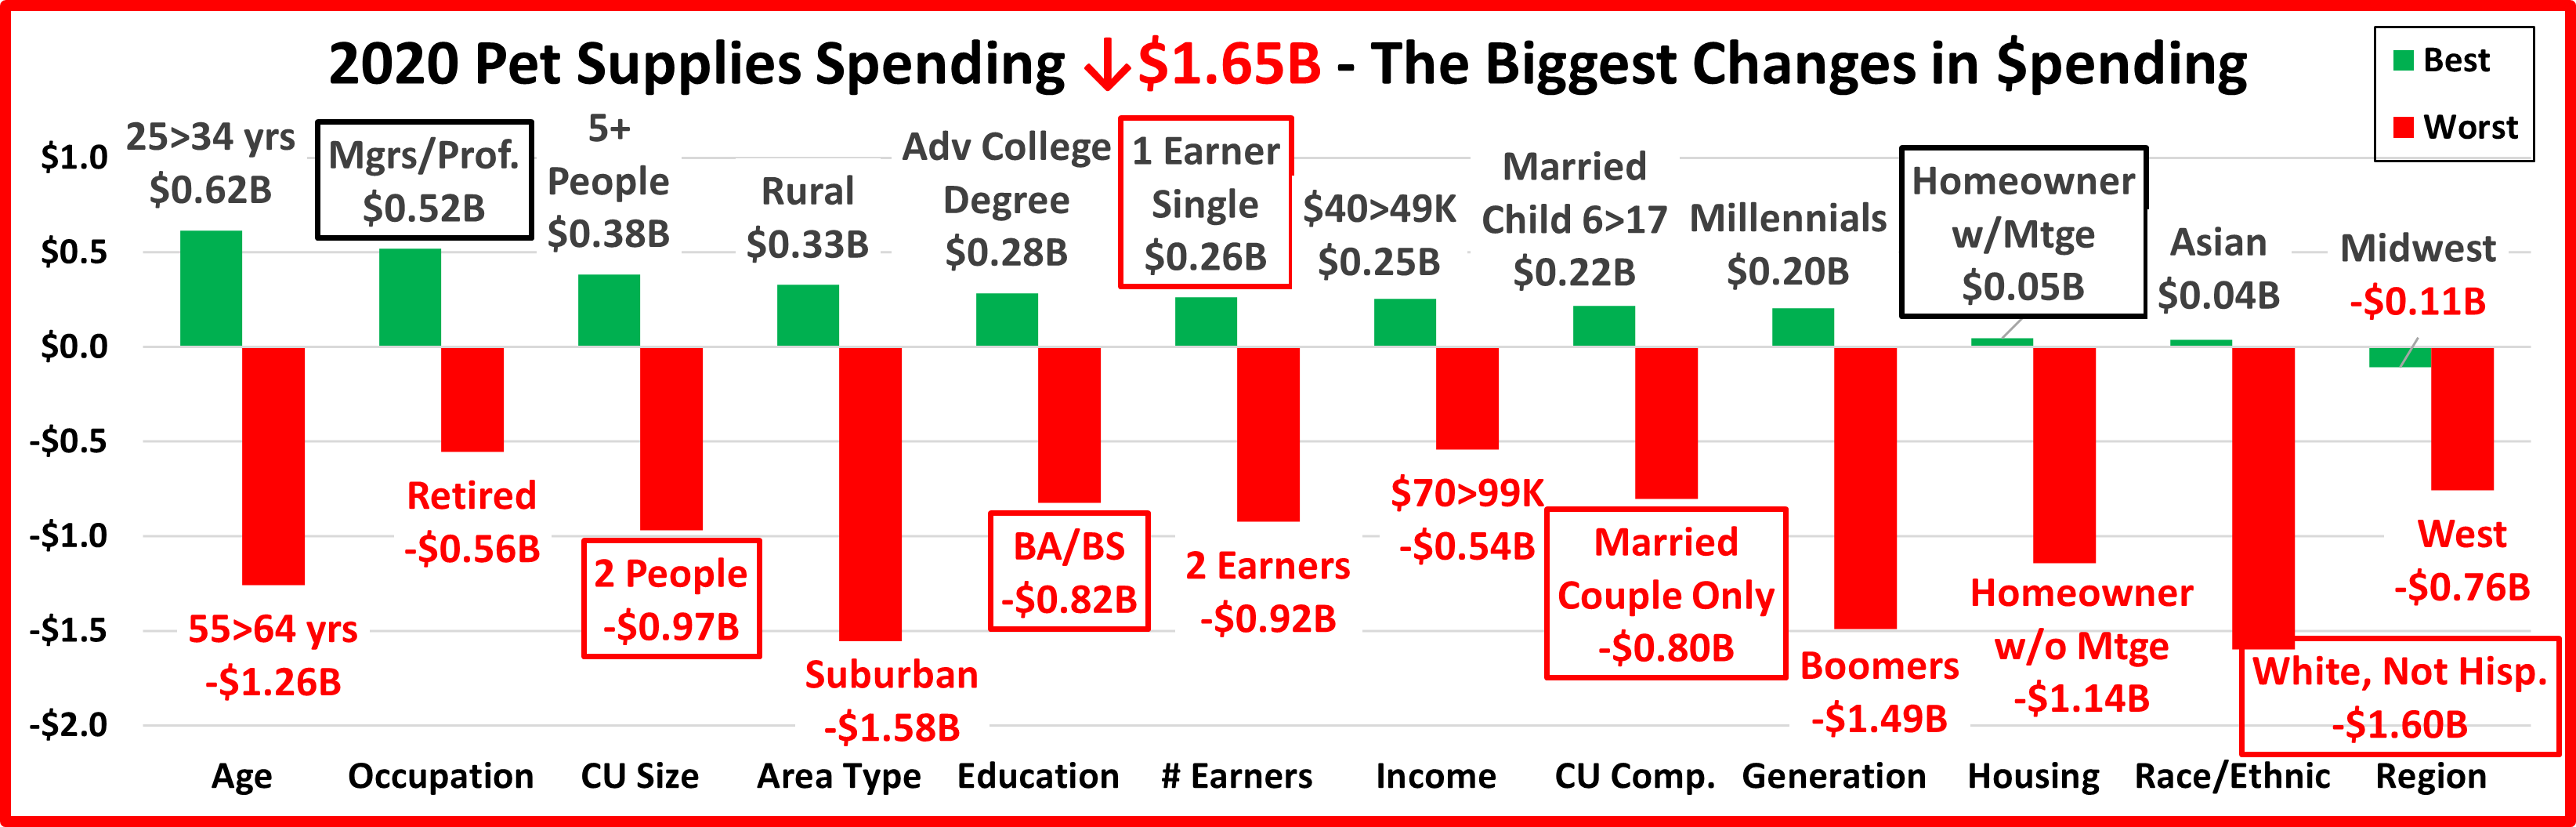
It’s time to “Show you the money”. Here are segments with the biggest $ changes in Pet Supplies Spending.
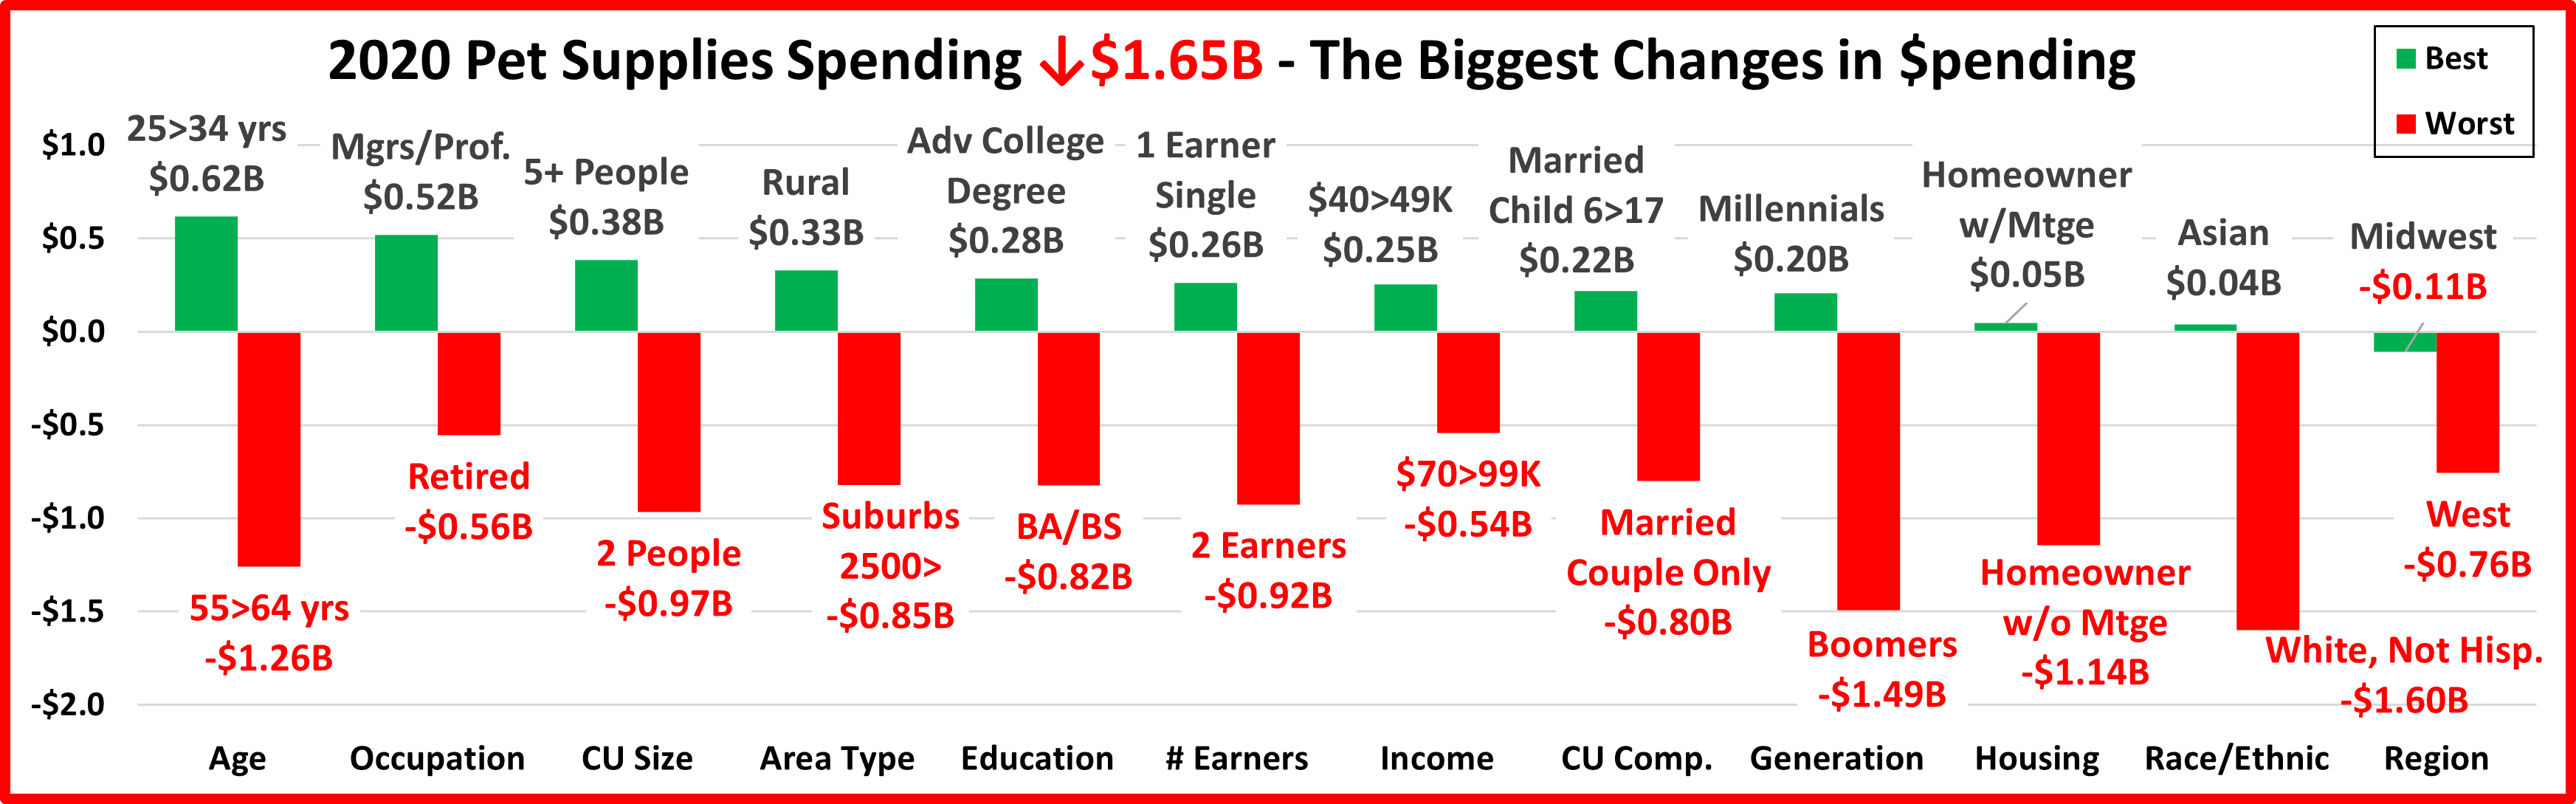
In 2019, Tarifflation caused a record $2.98B drop in Supplies spending. 2020 brought the pandemic and pet parents focused on “needs” so the more discretionary Supplies segment fell $1.65B. In the chart, there are 7 repeats from 2019 – 2 winners and 5 losers. 2 segments switched from last to first or vice versa. This is far less turmoil than last year when there were only 2 repeats but 9 “flips”. There is another improvement. In 2019 all segments in 9 of 12 categories spent less. In 2020, there was only 1 – Regions. Back in 2017, the good old days, every segment in 10 categories increased spending. In the 1st year of the pandemic the spending decline has slowed but not stopped. Here are the specifics:
- Age – Only the 25>34 and 65>74 groups spent more.
- Winner – 25>34 yrs – Pet Supplies Spending: $2.80B; Up $0.62B (+28.3%) 2019: <25 yrs
- Loser – 55>64 yrs – Pet Supplies Spending: $2.73B; Down -$1.26B (-31.5%) 2019: 35>44 yrs
- Comment: The 45>64 yr olds spent $1.71B less on Supplies.
- Occupation – Managers & Professionals flipped from last to first.
- Winner – Managers & Professionals – Pet Supplies Spending: $5.65B; up +$0.52B (+10.1%) 2019: Blue Collar
- Loser – Retired – Pet Supplies Spending: $1.90B; Down -$0.56B (-22.7%) 2019: Mgrs/Professionals
- Comment – Only Self-Employed and Managers & Professionals spent more. All other occupational groups and Retirees had double digit percentage decreases and their spending fell at least $0.5B.
- # in CU – The winner flipped from the smallest CUs to the largest.
- Winner – 5+ People – Pet Supplies Spending: $2.02B; Up +$0.38B (+23.3%) 2019: 1 Person
- Loser – 2 People – Pet Supplies Spending: $5.43B; Down -$0.97B (-15.1%) 2019: 2 People
- Comment: Only 5+ CUs spent more. 2 person CUs stayed at the bottom. Their Supplies spending has fallen $2.5B, -31.5% since 2018. That’s 54% of the total 2018>2020 spending drop for the Supplies Segment.
- Area Type– Another big change – Rural won this year. Last year it was Center City. Big Suburbs stayed at the bottom.
- Winner – Rural – Pet Supplies Spending: $1.40B; Up +$0.33B (+30.3%) 2019: Center City
- Loser – Suburbs 2500> – Pet Supplies Spending: $6.59B; Down -$0.85B (-11.4%) 2019: Suburbs 2500>
- Comment – In 2019, all segments spent less. In 2020, only Rural Areas spent more.
- Education – Advanced College Degrees won, a big flip from the 2019 winner – less than High School grads.
- Winner – Advanced College Degree – Pet Supplies Spending: $4.08B; Up +$0.28B (+7.5%) 2019: < HS Grads
- Loser – BA/BS Degree – Pet Supplies Spending: $4.52B; Down $0.82B (-15.4%) 2019: BA/BS Degree
- Comment – BA/BS Degrees repeated as loser. In 2019, all segments spent less. In 2020, Advanced Degrees and those without a High School diploma spent more. Everyone in between spent less.
- # Earners – 1 Earner, Single kept their spot at the top.
- Winner – 1 Earner, Single – Pet Supplies Spending: $2.38B; Up +$0.26B (+12.3%) 2019: 1 Earner, Single
- Loser – 2 Earners – Pet Supplies Spending: $6.59B; Down -$0.92B (-12.3%) 2019: 1 Earner, 2+ CU
- Comment – Income is a big factor and the # of Earners is becoming more important. In 2020 only 1 Earner, Single CUs spent more. The “Everyone Works” group grew in share and performance because they had a smaller decrease than CUs where not all adults were employed.
- Income – For the 2nd consecutive year, the winner was below the average CU income level but the gain was small.
- Winner – $40>49K – Pet Supplies Spending: $1.27B; Up +$0.25B (+24.9%) 2019: $30>39K
- Loser – $70 > 99K – Pet Supplies Spending: $2.32B; Down -$0.54B (-19.0%) 2019: $50>69K
- Comment – The $100>149K group also spent a little more, +0.01B (+0.6%). Everyone else spent less. The over $70K group continues to generate over 60% of Supplies $. However, the biggest spenders continue to be the biggest losers as their % drop was twice that of the <$70K group.
- CU Composition – Married Couples Only flipped from 1st to last n 2019. In 2020 they held on to the bottom spot.
- Winner – Married, Oldest Child 6>17 – Supplies: $2.36B; Up $0.22B (+10.1%) 2019: Married, + Adults, No Kids
- Loser – Married, Couple Only – Supplies: $3.70B; Down -$0.80B (-17.8%) 2019: Married, Couple Only
- Comment – Single Parents also had a small spending increase. Married Couples Only are definitely the big losers. They account for 24% of Supplies $. Their spending from 2018>2020 is -$2.35B, 51% of Supplies’ Total decrease.
- Generation – Millennials held their spot at the top for the 3rd consecutive year.
- Winner – Millennials – Supplies: $4.12B; Up +$0.20B (+5.2%) 2019: Millennials
- Loser – Baby Boomers – Supplies: $4.41B; Down $1.49B (-25.3%) 2019: Gen X
- Comment – This win by Millennials was driven by the 25>34 group. Gen X turned it around with a small 0.4% increase. All other generations, younger and older, spent less.
- Housing – The 2nd and last flip as Homeowners w/Mtge moved from last to first.
- Winner – Homeowner w/Mtge – Supplies: $8.35B; Up +$0.05B (+0.6%) 2019: Renter
- Loser – Homeowner w/o Mtge – Supplies: $3.43B; Down -$1.14B (-25.0%) 2019: Homeowner w/Mtge
- Comment – Renters also had a double digit % decrease in Supplies $. Some of the $ saved by Homeowners w/o Mtges on Supplies went toward funding their huge increase in Pet Food spending.
- Race/Ethnic – Asian Americans are truly a surprise winner.
- Winner – Asian Americans – Supplies: $0.40B; Up +$0.04B (+10.7%) 2019: African Americans
- Loser – White, Not Hispanic – Supplies: $12.63B; Down $1.60B (-11.2%) 2019: White, Not Hispanic
- Comment – Although their share of Pet Supplies $ has fallen from 86.3% in 2018 to 83.3%, White, Not Hispanics still drive this discretionary segment. They have the highest % of pet ownership and the second highest income. The interaction of these two factors is very clear in the Racial/Ethnic category. Whites have the most to lose and they did. Asians have the highest income. A 64¢/Month spending increase on Supplies wouldn’t even be noticed.
- Region – Both the winner and loser are new.
- Winner – Midwest – Pet Supplies Spending: $3.06B; Down -$0.11B (-3.4%) 2019: Northeast
- Loser – West – Pet Supplies Spending: $3.90B; Down -$0.76B (-16.3%) 2019: South
- Comment – In 2018, all regions spent more on Supplies. In 2019 they all spent a lot less. In 2020 the decreases for the Midwest and South were minimal but all Regions again spent less. They were the only Demographic Category in 2020 in which all segments decreased spending on Supplies.
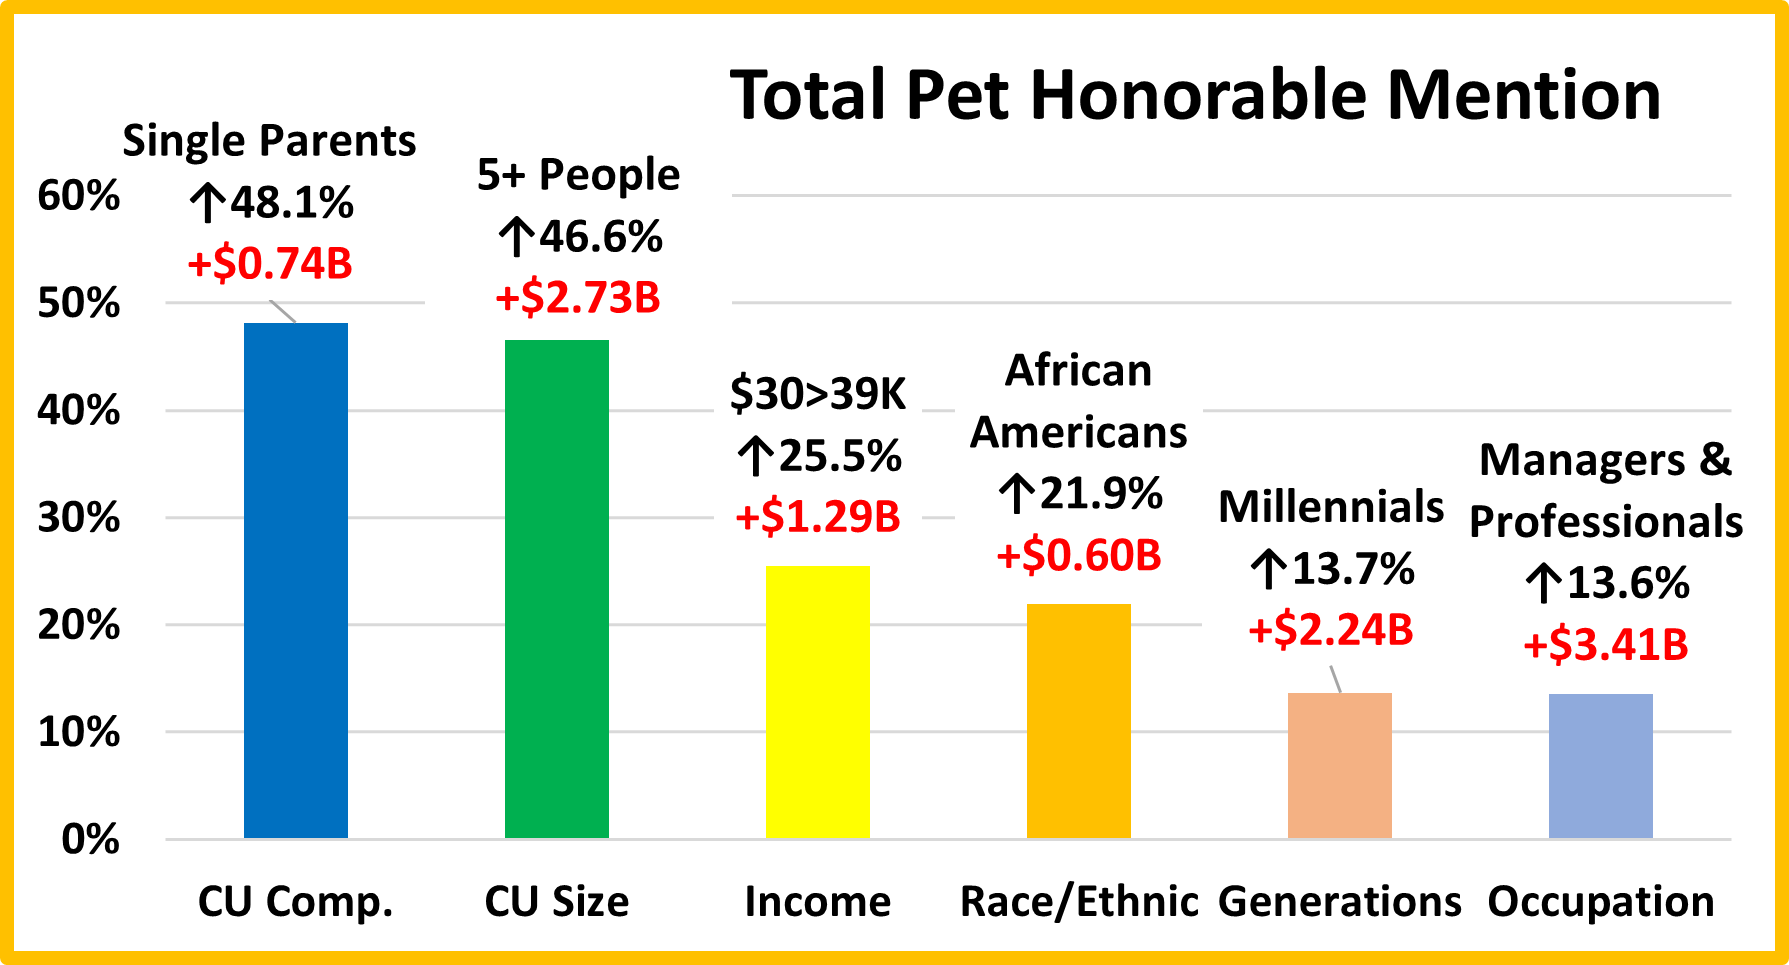
We’ve now seen the winners and losers in Pet Supplies Spending $ for 12 Demographic Categories. In 2020, the pandemic priorities caused the spending decline which began in 2019 to continue. However, things got a little better. In 2019, only 3 of 96 segments had increases and 9 of 12 categories had no segments that spent more on Supplies. In 2020, 18 segments spent more and only 1 category had no segments with an increase. In performance, we saw many expected winners and 10 of 12 were the same as 2019. However, not every good performer can be “the” winner and some of these “hidden” segments should be recognized for their performance. They don’t win an award, but they deserve…
HONORABLE MENTION
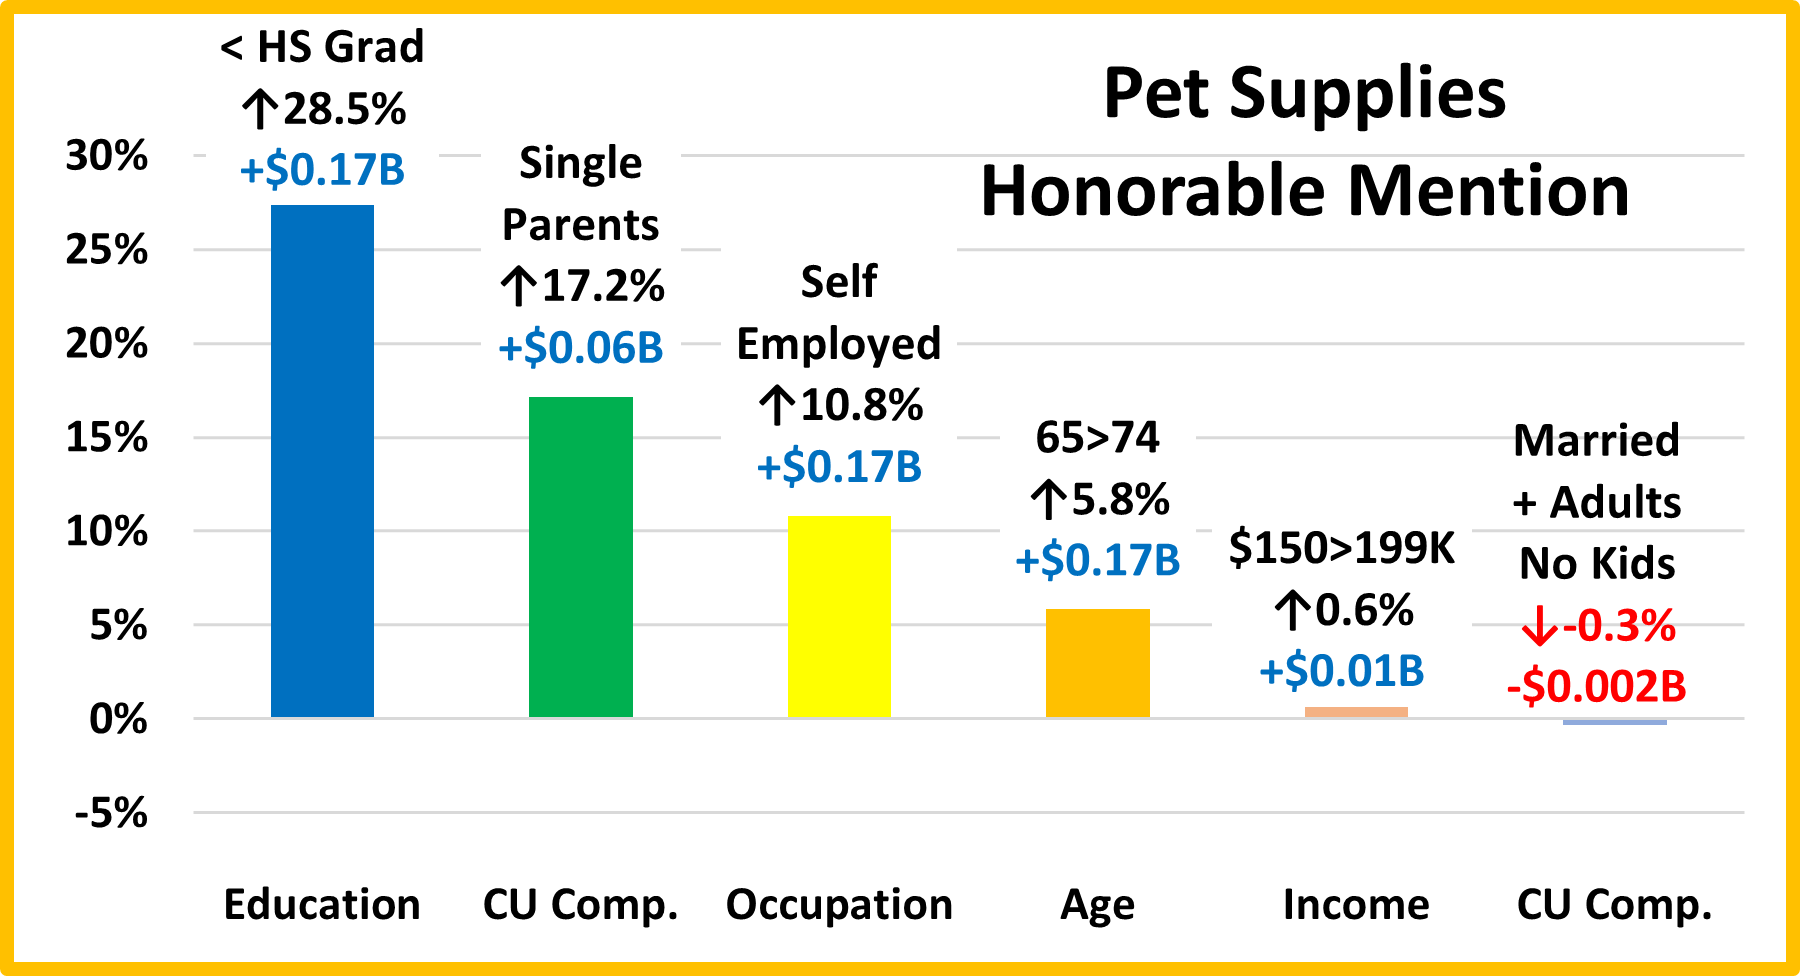
In 2019, all numbers from these segments were negative. In 2020, 5 are positive but all merit some recognition in a tough, pandemic year. Most are unexpected and a very eclectic mix. Those without a High School diploma had a good year, including in Pet Supplies. Single Parents are perennial losers. In 2020 they demonstrated that they are also committed to their Pet Children. 2020 was the year of “bosses”, especially self-employed. They spent more in every industry segment and had the largest increase of any occupation in Total Pet Spending. In many categories the Pet Supplies spending leaders were virtual opposites. Age was one of these as the 65>74 yr-olds stood with the 25>34 yr-olds in spending more on Supplies. The high income $150>199K is certainly no surprise. Their increase is truly minimal, but they were the only income segment other than $40>49K group to post an increase in Supplies $. That brings us to Married Couples w/Other Adults but No Kids. They didn’t quite make it to the plus side but were very close. 2020 was a bad year for Pet Supplies. However, it was a slight improvement over 2019.
Summary
While Pet Food spending has shown a definite pattern, Pet Supplies have been on a roller coaster ride since 2009. Many Supplies categories have become commoditized and react strongly to changes in the CPI. Prices go up and spending goes down…and vice versa. Supplies spending has also been reactive to big spending changes in Food. Consumers spend more to upgrade their Food, so they spend less on Supplies – trading dollars. We saw this in 2015. In 2016 the situation reversed. Consumers value shopped for Food and spent some of the “saved” money on Supplies.
That brought us to 2017. Both Supplies and Food prices deflated while the inflation rate in both of the Services segments dropped to lows not seen in recent years. Value was the “word” and it was available across the market. Perhaps the biggest impact was that the upgrade to super premium Food significantly penetrated the market. This could have negatively impacted Supplies Spending, but it didn’t. Supplies’ spending increased in 93% of all demographic segments.
2018 started out as expected with a $1B increase in Supplies and a small lift in Food. Then the government got involved. In July the FDA issued a warning on grain free dog food and spending dropped over $2B. New tariffs were implemented on Supplies and spending flattened out then turned down $0.01B in the 2nd half. Because of shipping timing, the full retail impact of Tariffs was delayed until 2019 when spending fell -$2.98B, affecting 97% of all demographic segments.
Among the demographic categories in which a consumer has some control, Higher Income & Marriage are still very important while Homeownership and Higher Education lost ground. In 2020 Income stayed on top and # of Earners and being a “boss” grew in importance. Supplies Spending also skewed a little younger.
The 2019 decline due to Tarifflation slowed but continued in 2020. 88% of the best/worst performers in 2019 kept their position in 2020. The pandemic caused consumers to focus on needs. That resulted in big spending lifts for Food and Veterinary and big drops in Supplies and Services. Pet Parents traded $. The best illustration of this is that 8 of the 12 segments with the biggest decrease in Supplies $ had the biggest increase in Food and/or Veterinary $. Some good news is that Supplies spending became more balanced. The performance gap between best and worst narrowed by 10.25%.
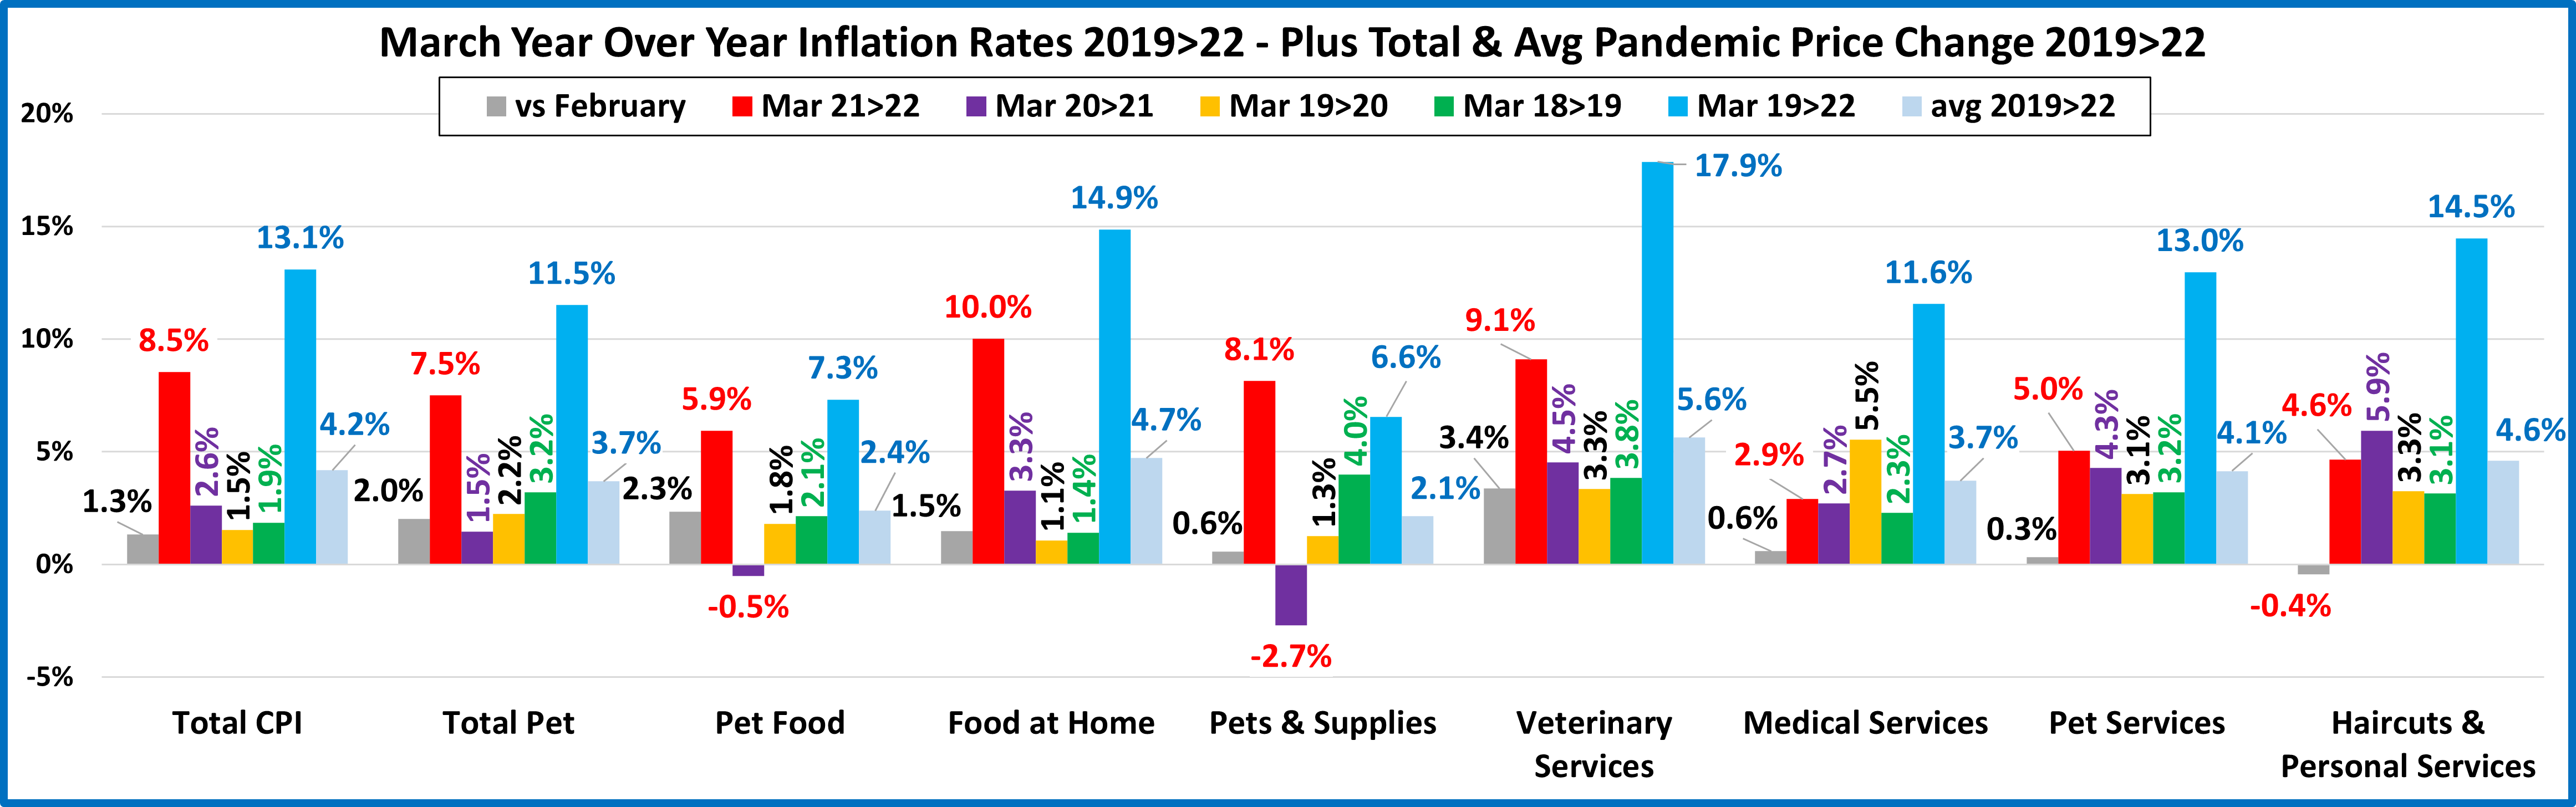
Prices are still important in Supplies $. They deflated in the spring of 2020 and stayed down until Mid-yr 2021 when they turned up again. We’ll see how this trend impacted spending in the more normal environment of 2021.
Finally – The “Ultimate” Pet Supplies Spending CU consists of 5 people – a married couple, with an oldest child over 18. They are 45>54 yrs old. They are White, but not of Hispanic origin. At least one has an Advanced Degree. Both of them work in their own business and one child just started a part time, after school job. They’re doing well with an income over $200K. They live in a small suburb, adjacent to a big city in the Western U.S. and are still paying off their mortgage.